
Journal of Geographical Sciences >
Response of the water use efficiency of natural vegetation to drought in Northeast China
Author: Liu Dan (1974-), PhD, specialized in ecological meteorology. E-mail: nefuliudan@163.com
*Corresponding author: Yu Chenglong (1973-), PhD, specialized in ecological meteorology. E-mail: nefuycl@163.com
Received date: 2017-10-18
Accepted date: 2018-01-06
Online published: 2018-03-30
Supported by
Foundation of Northeast China Innovation and Opening Laboratory of Eco-Meteorology, CMA, No.stqx2017zd01
Special Projects of Climate Change of CMA, No.CCSF201512
Foundation of Institute of Atmospheric Environment in Shenyang, CMA, No.2016SYIAE11
National Natural Science Foundation of China, No.41165005
Copyright
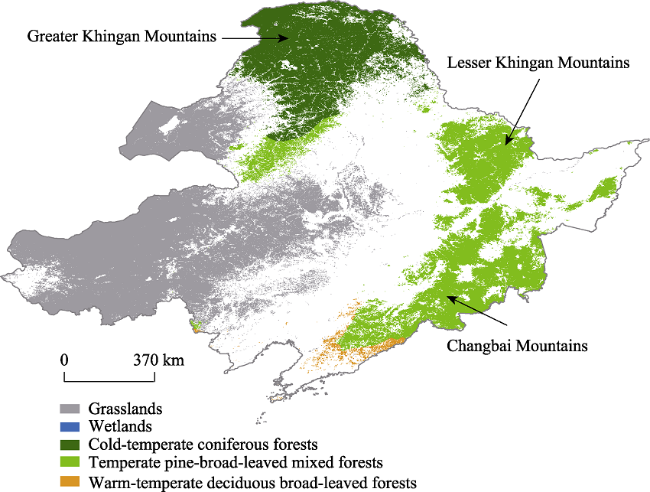
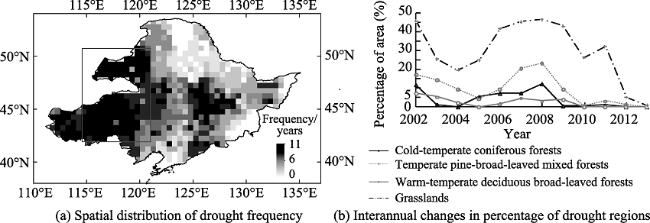
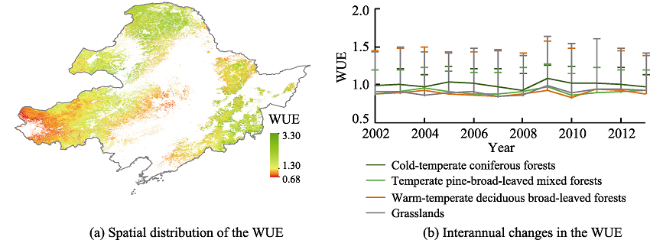
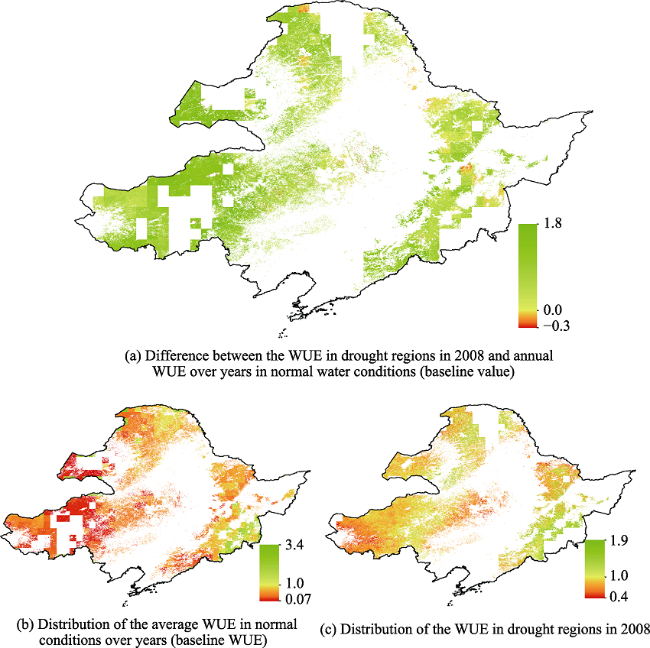
Drought has become a problem that is universally faced by global terrestrial ecosystems. Northeast China is located in a region sensitive to global climate changes, and one of the main impacts of climate changes in Northeast China is manifested as drought in growing seasons. This study analyzes the spatio-temporal evolution law of the water use efficiency (WUE) of the main natural vegetation (i.e., cold-temperate coniferous forests, temperate pine-broad-leaved mixed forests, warm-temperate deciduous broad-leaved forests, and grasslands) in Northeast China based on public MODIS data products, including MCD12Q1, MOD15A2H, MOD16A2, and MOD17A3H, and meteorological data from 2002 to 2013. The influence of drought events on the WUE of different vegetation types and their response to drought events are also investigated. The study findings are as follows: (1) drought in Northeast China frequently occurs in the regions stretching from 114.55°E to 120.90°E, and the percentage of drought area among the forests is lower than that among the grasslands during these years; (2) the annual average WUE of the natural vegetation ranges from 0.82 to 1.08 C/kg-1H2O, and the WUE of forests (0.82 to 1.08 C/kg-1H2O) is universally higher than that of grasslands (0.84 to 0.99 C/kg-1H2O); (3) in 2008, the regions where the WUE in drought conditions is higher than that in normal water conditions account for 86.11% of the study area, and a significant linear positive correlation is found between the WUE in drought conditions and the WUE in normal water conditions, whereas the degree of drought does not influence the WUE of the natural vegetation in an obviously linear manner; and (4) the WUE for the cold-temperate coniferous forests and temperate pine-broad-leaved mixed forests with a high ET or low NPP is more likely to rise in drought conditions; the WUE for the grasslands with a low Evapotranspiration (ET), Net Primary Production (NPP), and Leaf Area Index (LAI) is more likely to rise in drought conditions; and the ET, NPP, and LAI have no significant influence on the WUE for the warm-temperate deciduous broad-leaved forests in drought conditions. This study contributes to improving the evaluation of the influence of drought on natural ecosystems.
Key words: natural vegetation; drought; water use efficiency (WUE)
LIU Dan , YU Chenglong , ZHAO Fang . Response of the water use efficiency of natural vegetation to drought in Northeast China[J]. Journal of Geographical Sciences, 2018 , 28(5) : 611 -628 . DOI: 10.1007/s11442-018-1494-9
Figure 1 Natural vegetation distribution in Northeast China. |
Figure 2 Spatial distribution of drought frequency (a) and the annual change in the percentage of drought regions (b) in Northeast China from 2002 to 2013 |
Figure 3 Spatial distribution (a) and interannual changes (b) of the WUE of the natural vegetation in Northeast China from 2002 to 2013 |
Figure 4 Comparison of the average WUE between drought conditions and normal water conditions in 2008 |
Table 1 Changes in the WUE of the natural vegetation in drought conditions in Northeast China in 2008 |
| Vegetation type | ∆WUE < 0 | ∆WUE > 0 | ∆WUE = 0 |
|---|---|---|---|
| Cold-temperate coniferous forests (%) | 4.56 | 80.00 | 15.44 |
| Temperate pine-broad-leaved mixed forests (%) | 6.13 | 73.95 | 19.93 |
| Warm-temperate deciduous broad-leaved forests (%) | 0.78 | 97.16 | 2.06 |
| Grasslands (%) | 1.09 | 94.25 | 4.66 |
| Total (%) | 3.10 | 86.11 | 10.79 |
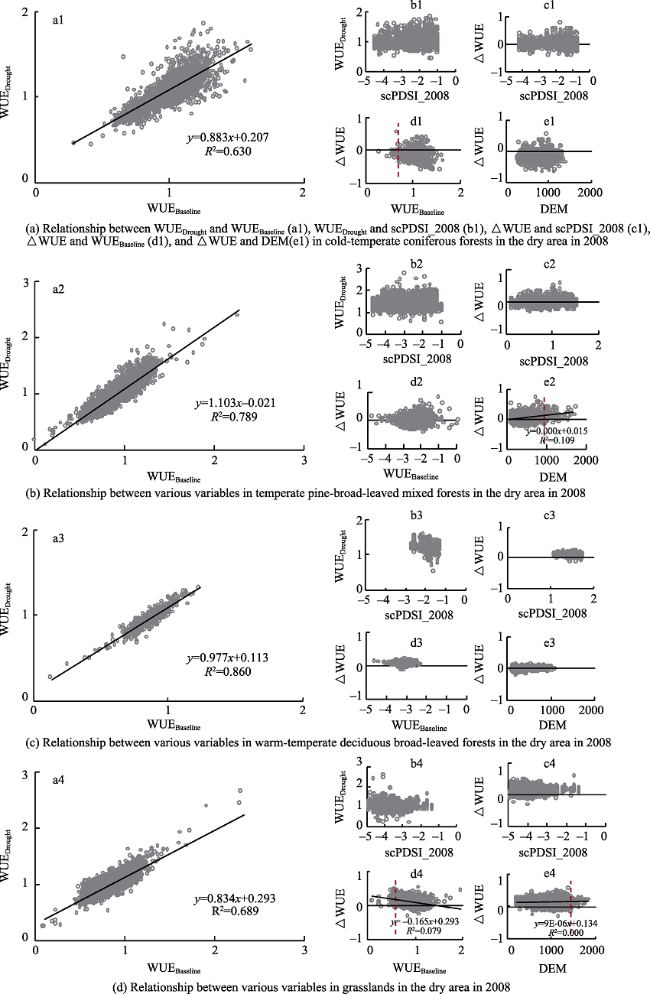
Figure 5 Changes in the WUE of the natural vegetation in drought conditions in 2008 |
Table 2 Indices of the natural vegetation in Northeast China in normal water conditions |
| Vegetation type | ∆WUE | ET (mm/year) | NPP (kgC/m2) | LAI | |||
|---|---|---|---|---|---|---|---|
| Mean | Comparison of the means | Mean | Comparison of the means | Mean | Comparison of the means | ||
| Cold-temperate coniferous forests | ∆WUE > 0 | 482.21 | sig < 0.001 | 454.23 | sig < 0.001 | 1.47 | sig = 0.101 |
| ∆WUE < 0 | 440.20 | 520.00 | 1.51 | ||||
| Temperate pine-broad-leaved mixed forests | ∆WUE > 0 | 526.99 | sig < 0.001 | 468.76 | sig < 0.001 | 1.40 | sig = 0.131 |
| ∆WUE < 0 | 508.27 | 438.31 | 1.43 | ||||
| Warm-temperate deciduous broad-leaved forests | ∆WUE > 0 | 419.41 | sig = 0.253 | 360.45 | sig = 0.061 | 0.63 | sig = 0.726 |
| ∆WUE < 0 | 394.14 | 353.08 | 0.62 | ||||
| Grasslands | ∆WUE > 0 | 329.19 | sig = 0.032 | 280.30 | sig < 0.001 | 0.81 | sig < 0.001 |
| ∆WUE < 0 | 318.84 | 299.40 | 0.80 | ||||
Note: An independent-sample T test was used to compare the average values. |
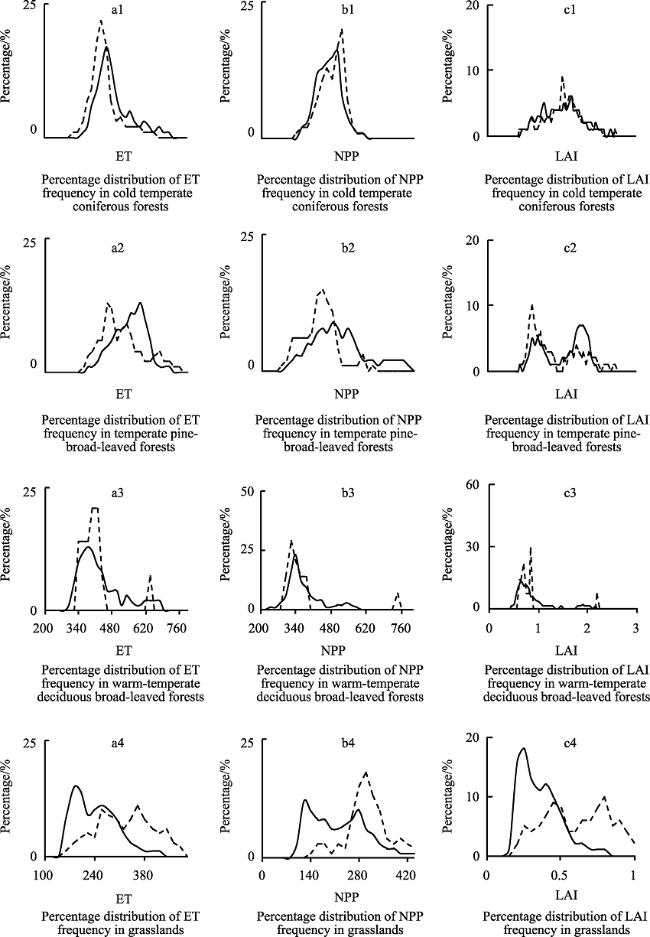
Figure 6 Distribution of ET, NPP, and LAI of natural vegetation in drought conditions. The solid line is the distribution curve of the frequency (percentage) of ET, NPP, and LAI in normal water conditions with regard to the pixels with ∆WUE ≥ 0 specified in Figure 5d. The dotted line is the distribution curve of the frequency (percentage) of the corresponding indices in normal conditions with regard to the pixels with ∆WUE < 0 specified in Figure 5d. |
Table 3 Comparison of the WUE data |
| Ecosystem class | Study area | Value (gC/kg-1H2O) | Data source |
|---|---|---|---|
| Forests | Yangtze River Delta, China | 1.68-1.95 | Wang et al. (2015) |
| Changbaishan temperate broad-leaved Korean pine mixed forest, China | 9.43 | Yu et al. (2008) | |
| Qianyanzhou subtropical coniferous plantation, China | 9.27 | Yu et al. (2008) | |
| Dinghushan subtropical evergreen broad-leaved forest, China | 6.90 | Yu et al. (2008) | |
| Forest ecosystems, Europe | 1.2-5.0 | Kuglitsch et al. (2008) | |
| Urban-forest reserve, China | 2.6 ± 0.2 | Xie et al. (2016) | |
| Alpine area of Southwest China | 0.83-1.46 | Zhang et al. (2016) | |
| California, USA | 1.33 | Malone et al. (2016) | |
| Northeast China | 0.82-1.08 | This study | |
| Grasslands | Yangtze River Delta, China | 1.66 | Wang et al. (2015) |
| Xinjiang, China | 0.26-0.69 | Huang and Luo (2017) | |
| Qinghai-Tibet Plateau, China | 0.62 | Mi et al. (2015) | |
| Alpine area of Southwest China | 0.84-1.14 | Zhang et al. (2016) | |
| California, USA | 1.73 | Malone et al. (2016) | |
| Northeast China | 0.84-0.99 | This study |
The authors have declared that no competing interests exist.
| [1] |
|
| [2] |
|
| [3] |
|
| [4] |
|
| [5] |
|
| [6] |
|
| [7] |
|
| [8] |
|
| [9] |
|
| [10] |
|
| [11] |
|
| [12] |
|
| [13] |
|
| [14] |
|
| [15] |
|
| [16] |
|
| [17] |
|
| [18] |
|
| [19] |
|
| [20] |
|
| [21] |
|
| [22] |
|
| [23] |
|
| [24] |
|
| [25] |
|
| [26] |
|
| [27] |
|
| [28] |
|
| [29] |
|
| [30] |
|
| [31] |
|
| [32] |
|
| [33] |
|
| [34] |
|
| [35] |
|
| [36] |
|
| [37] |
|
| [38] |
|
| [39] |
|
| [40] |
|
| [41] |
|
| [42] |
|
| [43] |
|
| [44] |
|
| [45] |
|
| [46] |
|
| [47] |
|
| [48] |
|
| [49] |
|
| [50] |
|
| [51] |
|
| [52] |
|
| [53] |
|
| [54] |
|
| [55] |
|
| [56] |
|
| [57] |
|
| [58] |
|
| [59] |
|
| [60] |
|
| [61] |
|
| [62] |
|
| [63] |
|
| [64] |
|
| [65] |
|
| [66] |
|
/
| 〈 |
|
〉 |