
Journal of Geographical Sciences >
Analyzing vegetation dynamic trend on the Mongolian Plateau based on the Hurst exponent and influencing factors from 1982-2013
Author: Tong Siqin (1991-), PhD, specialized in vegetation dynamic change, long-term climate change, remote sensing and GIS. E-mail: tongsq223@nenu.edu.cn
*Corresponding author: Zhang Jiquan (1965-), Professor, E-mail: zhangjq022@nenu.edu.cn
Received date: 2017-04-01
Accepted date: 2017-09-28
Online published: 2018-03-30
Supported by
National Key Technology R&D Program of China, No.2013BAK05B01, No.2013BAK05B02
National Natural Science Foundation of China, No.41571491, No.61631011
The Program of Introducing Talents of Discipline to Universities, No.B16011
Copyright
This study analyzed the spatial and temporal variations in the Normalized Difference Vegetation Index (NDVI) on the Mongolian Plateau from 1982-2013 using Global Inventory Modeling and Mapping Studies (GIMMS) NDVI3g data and explored the effects of climate factors and human activities on vegetation. The results indicate that NDVI has slight upward trend in the Mongolian Plateau over the last 32 years. The area in which NDVI increased was much larger than that in which it decreased. Increased NDVI was primarily distributed in the southern part of the plateau, especially in the agro-pastoral ecotone of Inner Mongolia. Improvement in the vegetative cover is predicted for a larger area compared to that in which degradation is predicted based on Hurst exponent analysis. The NDVI-indicated vegetation growth in the Mongolian Plateau is a combined result of climate variations and human activities. Specifically, the precipitation has been the dominant factor and the recent human effort in protecting the ecological environments has left readily detectable imprints in the NDVI data series.
TONG Siqin , ZHANG Jiquan , BAO Yuhai , LAI Quan , LIAN Xiao , LI Na , BAO Yongbin . Analyzing vegetation dynamic trend on the Mongolian Plateau based on the Hurst exponent and influencing factors from 1982-2013[J]. Journal of Geographical Sciences, 2018 , 28(5) : 595 -610 . DOI: 10.1007/s11442-018-1493-x
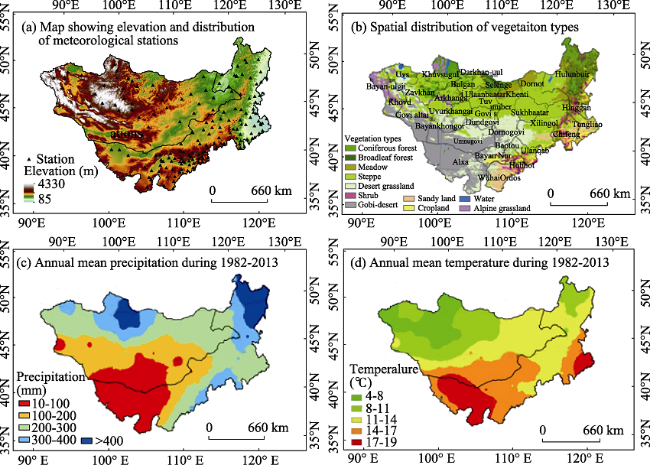
Figure 1 Geographic characteristics of the Mongolian Plateau: Elevation (a), vegetation types (b), annual mean precipitation (c), and temperature (d) |
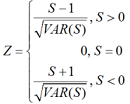
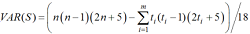 , n is the number of data points in the sequence, m is the number of repeated datasets in the sequence, and ti is the number of repeated data values in the i th group. At the given significance level, α=0.05, the threshold of the normal distribution is Z1-a/2. When |Z|≤Z1-a/2, the null hypothesis can be accepted (the trend is insignificant), and when |Z|>Z1-a/2, the null hypothesis is rejected and the trend is significant, Z1-a/2=Z0.975=1.96.


Figure 2 Annual mean NDVI across the Mongolian Plateau from 1982-2013 |
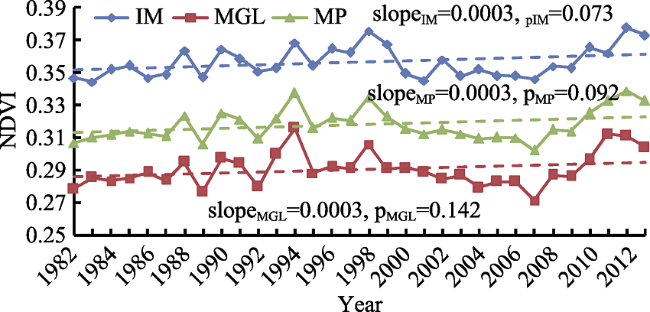
Figure 3 Annual average NDVI values for the Mongolian Plateau (MP), Inner Mongolia (IM), and Mongolia (MGL) from 1982-2003 |
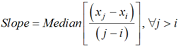
Table 1 Annual average NDVI, slope, and Hurst value for each vegetation type in the Mongolian Plateau from 1982-2013 |
| Vegetation types | NDVI range | NDVI average | Sen’s slope/yr | Mean for H |
|---|---|---|---|---|
| Broadleaf forest | 0.59-0.66 | 0.63 | 0.0002 | 0.419 |
| Coniferous forest | 0.52-0.58 | 0.56 | 0.0006 | 0.412 |
| Meadow | 0.51-0.56 | 0.54 | 0.0004 | 0.426 |
| Shrub | 0.43-0.48 | 0.45 | 0.0005 | 0.447 |
| Cropland | 0.37-0.43 | 0.39 | 0.0007 | 0.440 |
| Steppe | 0.32-0.39 | 0.35 | 0.0004 | 0.404 |
| Sandy land | 0.28-0.35 | 0.31 | 0.0005 | 0.437 |
| Alpine grassland | 0.27-0.31 | 0.28 | 0.0005 | 0.418 |
| Desert | 0.13-0.16 | 0.14 | 0.0001 | 0.389 |
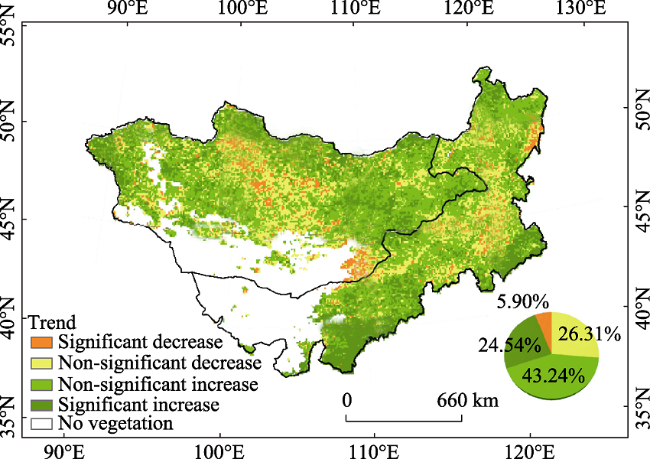
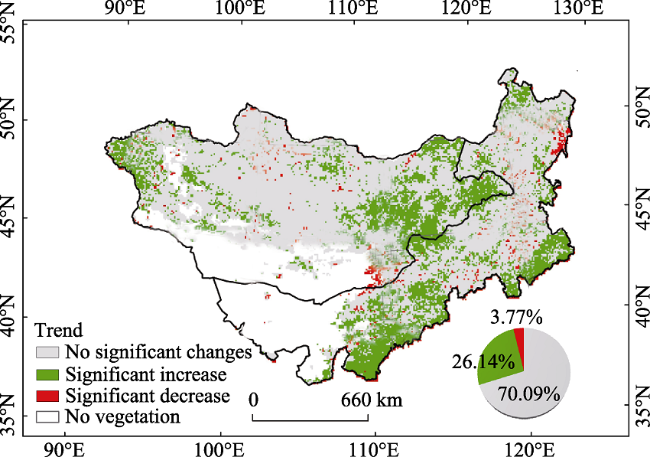
Figure 4 Spatial distribution of NDVI trends on the Mongolian Plateau from1982-2013 |
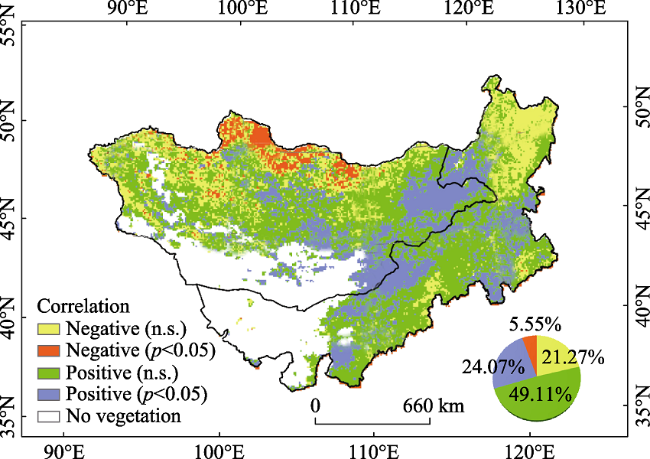
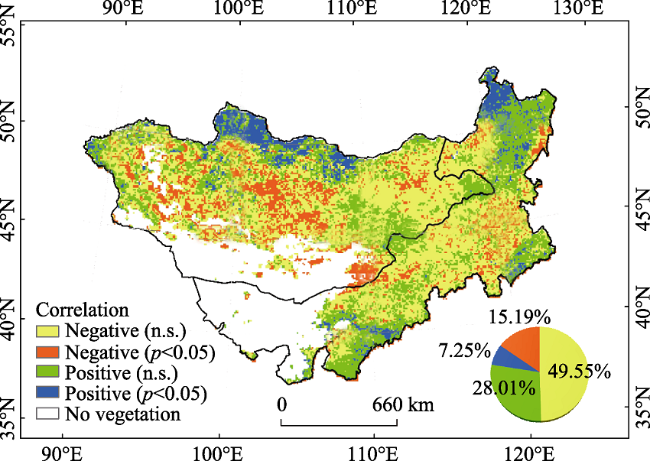
Figure 5 Spatial correlation between NDVI and precipitation from 1982-2013 |
Figure 6 Spatial correlation between NDVI and temperature from 1982-2013 |
Figure 7 Spatial distribution of residual NDVI trends on the Mongolian Plateau from 1982-2013 |
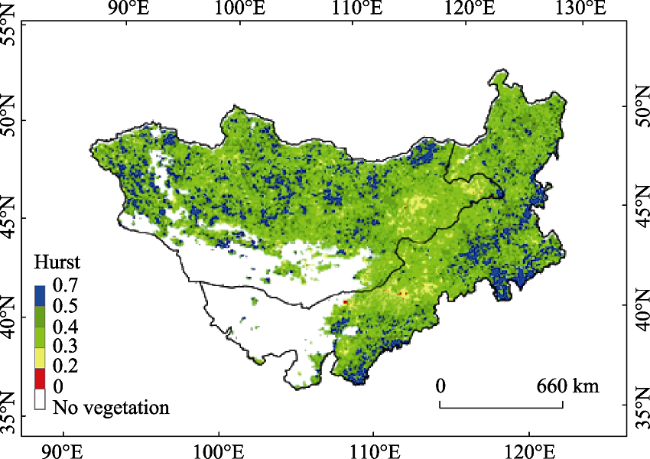
Figure 8 Spatial distribution of the Hurst exponent for the annual average NDVI time series on the Mongolian Plateau from 1982-2013. Values over 0.5 suggest a continuation in the past trend, while values below 0.5 suggest a reversal in the past trend |
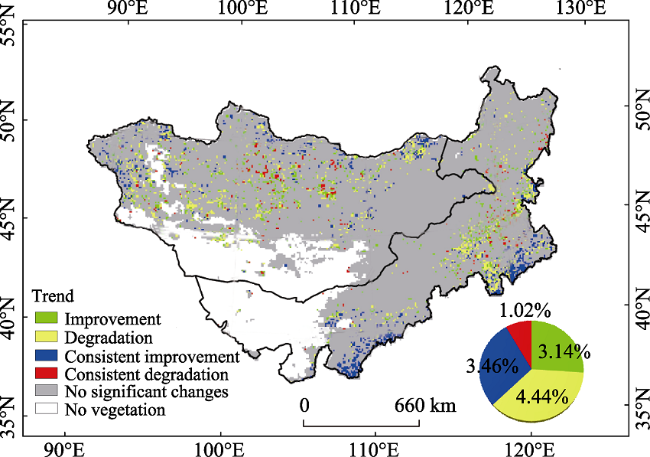
Table 2 Parameters for predicted future vegetation change trends |
| -20 < Zc < -1.96 | 1.96 < Zc < 20 | |
|---|---|---|
| H<0.5 | Improvement | Degradation |
| H>0.5 | Consistent degradation | Consistent improvement |
Figure 9 Predicted vegetation changing trends on the Mongolian Plateau |
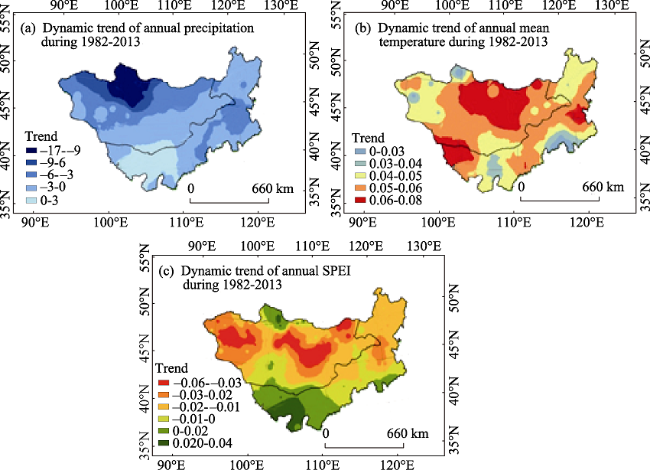
Figure 10 Dynamic trends of precipitation (a), temperature (b), and Standardized Precipitation Evapotranspiration Index (SPEI) (c) on the Mongolian Plateau from1982-2013 |
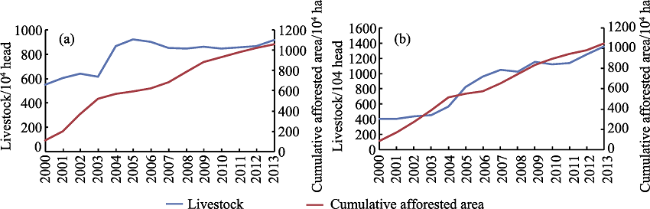
Figure 11 Statistics for livestock numbers and cumulative afforested area in Ordos (a) and Tongliao (b), Inner Mongolia, from 2000-2013 |
The authors have declared that no competing interests exist.
| [1] |
|
| [2] |
|
| [3] |
|
| [4] |
|
| [5] |
|
| [6] |
|
| [7] |
|
| [8] |
|
| [9] |
|
| [10] |
|
| [11] |
|
| [12] |
|
| [13] |
|
| [14] |
|
| [15] |
|
| [16] |
|
| [17] |
|
| [18] |
|
| [19] |
|
| [20] |
|
| [21] |
|
| [22] |
|
| [23] |
|
| [24] |
|
| [25] |
|
| [26] |
|
| [27] |
|
| [28] |
|
| [29] |
|
| [30] |
|
| [31] |
|
| [32] |
|
| [33] |
|
| [34] |
|
| [35] |
|
| [36] |
|
| [37] |
|
| [38] |
|
| [39] |
|
| [40] |
|
| [41] |
|
| [42] |
|
| [43] |
|
| [44] |
|
| [45] |
|
| [46] |
|
| [47] |
|
| [48] |
|
| [49] |
|
| [50] |
|
| [51] |
|
| [52] |
|
/
| 〈 |
|
〉 |
