Research Articles

The spatiotemporal responses of Populus euphratica to global warming in Chinese oases between 1960 and 2015

  • ZHANG Wenxia ,
  • FENG Qingrong ,
  • WANG Tianguang ,
  • WANG Tianqiang
Expand
  • College of Geography and Environmental Science, Northwest Normal University, Lanzhou 730070, China

Author: Zhang Wenxia (1987-), MS Candidate, specialized in arid area environment and the construction of oasis. E-mail:

*Corresponding author: Liu Puxing (1964-), PhD and Professor, E-mail:

Received date: 2017-09-17

  Accepted date: 2017-10-30

  Online published: 2018-03-30

Supported by

National Natural Science Foundation of China, No.40961035, No.41461012

The Science and Technology Project of Gansu Province, No.0803RJZA094

Copyright

Journal of Geographical Sciences, All Rights Reserved

Abstract

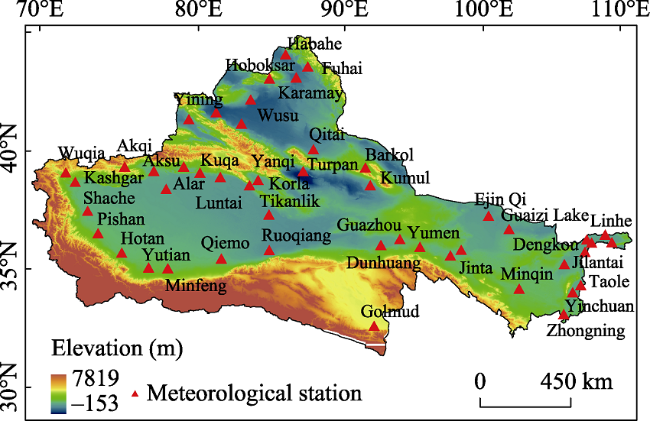
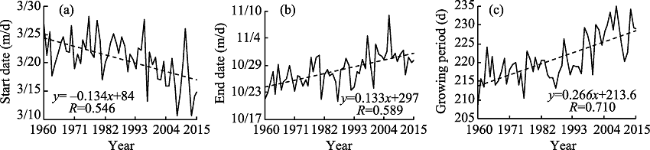
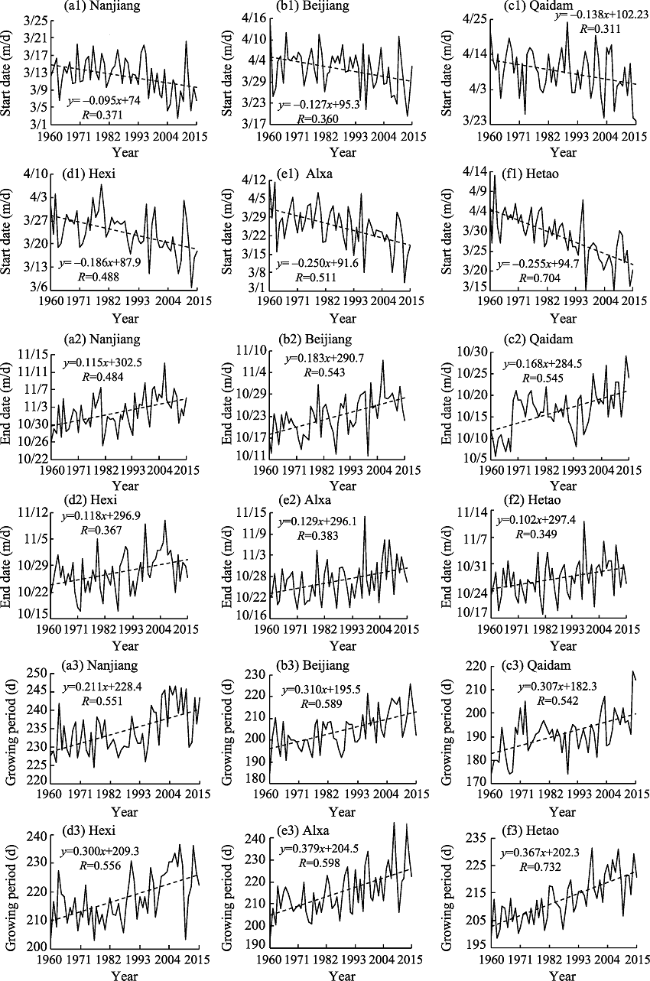
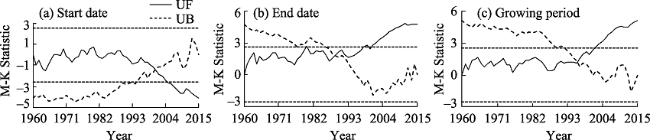
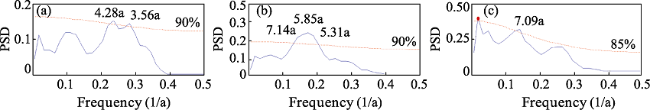
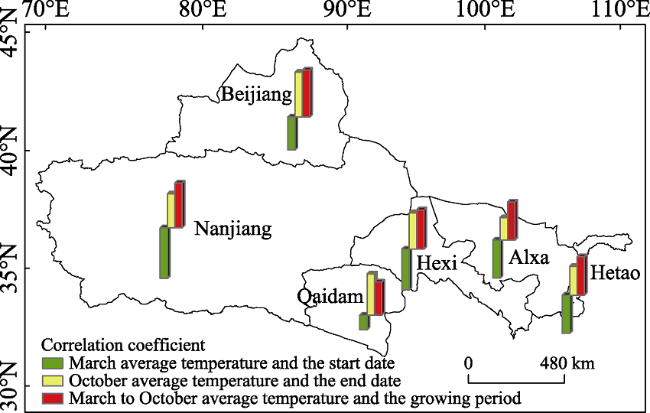
Daily average temperature data from 48 meteorological stations in Chinese oases that are within the distribution area of Populus euphratica were analyzed to determine the spatiotemporal responses of this tree to climate change. Specifically, the start and end date as well as the number of days that comprised the growing season were analyzed with a multi-year trend line and using the Mann-Kendall mutation test, inverse distance weighted interpolation (IDW) in the software ArcGIS, a Morlet wavelet power spectrum, and correlation analysis. The results of this study show that, over the last 56 years, the start date of the P. euphratica growing season has advanced, while the end date has been postponed, and the number of days that comprise the growing season have gradually increased. The changing trend rates recovered in this analysis for these three time slices are -1.34 d/10 a, 1.33 d/10a, and 2.66 d/10a (α ≥ 0.001), respectively. Data show that while spatial disparity is extremely significant, it is nevertheless the case that along a southwest-to-northeast transect of Chinese oases, the later the start date of the P. euphratica season, the sooner the end data and the shorter the growing season. Mutations points in start and end date, as well as for the growing season overall were observed in 2001, 1989, and 1996, respectively, and the data presented in this paper show that, in particular, the date of this end of this period is most sensitive to climate warming. Growing season cycles for P. euphratica are between 3.56 years and 7.14 years, consistent with the periodicity of El Niño events, while a start date cycle between 3.56 years and 4.28 years is consistent with atmospheric circulation cyclicity. The causal analysis presented in this paper shows that the Asian polar vortex area index (APVAI), the Qinghai-Tibet Plateau index (TPI), the westerly circulation index (WCI), and carbon dioxide emissions (CDE) are the main factors influencing spatiotemporal changes in the growth of P. euphratica, the effect of latitude during the growing season is more significant than altitude, and the start date of the growing season is more significantly influenced by these factors than end date. In addition, data show that the start date, end date, and length of the growing season are all significantly correlated with their average corresponding monthly temperature (correlation coefficients are -0.875, 0.770, and 0.897; α≥0.001). Thus, if the average temperature in March increases by 1℃, the start date of the growing season will advance by 2.21 days, while if the average temperature in October increases by the same margin then the seasonal end date will be delayed by 2.76 days. Similarly, if the average temperature between March and October increases by 1℃, the growing season will be extended by 7.78 days. The results of this study corroborate the fact that changes in the P. euphratica growing are sensitive to regional warming and are thus of considerable theoretical significance to our understanding of the responses of Chinese vegetation to climate change as well as to ecological restoration.

Cite this article

ZHANG Wenxia , FENG Qingrong , WANG Tianguang , WANG Tianqiang . The spatiotemporal responses of Populus euphratica to global warming in Chinese oases between 1960 and 2015[J]. Journal of Geographical Sciences, 2018 , 28(5) : 579 -594 . DOI: 10.1007/s11442-018-1492-y

1 Introduction

Global warming has been occurring for almost a century. The Fifth Assessment Report of the Intergovernmental Panel on Climate Change noted that global average surface temperature increased by 0.85℃ between 1880 and 2012, and it is also the case that warming trends within China are consistent with those seen across the rest of the world (Qin et al., 2014). Vegetation is the most important component of terrestrial ecosystems, and so the responses of plant phenology to regional climate change are both sensitive and simple to observe (Chmielewski and Rötzer, 2001). This means that research on the responses of plant phenology to global climate change have become a hot topic both within China and internationally (Fang and Yu, 2002); a number of previous studies have concluded that global warming has led to corresponding changes in the start and end dates of growth as well as the length of this period in plants (Pei et al., 2009; Zhang, 1995). Research outside China began much earlier; organized phenological observations in Europe, for example, were first initiated in the middle of the 18th century, and a number of devoted observation networks were subsequently established, including the European Penology Network and the International Phenological Gardens (IPG) (Pei et al., 2009). Based on analysis of IPG data from between 1960 and 1990, Menzel et al. (1999) noted that spring events have advanced by 6 days and autumn events have been delayed by 4.8 days likely because of rising European temperatures. Similarly, spring events in North American lilac (Schwartz and Reiter, 2000) and Belgian temperate woody plants (Fu et al., 2012) have also advanced markedly, while a 1℃ increasing in early spring temperature has been shown to have advanced the start date of the Betula pubescens and Prunus avium growing season in Europe by 8 days (Chmielewski and Rötzer, 2001). More than 70% of the Northern Hemisphere areas surveyed exhibit a trend towards the postponement of the growing season end date (mean rate: 0.18 ± 0.38 d/a; Liu et al., 2016), and phenological responses to climate change are also evident in the start of flowering, leaf-unfolding, and veraison periods. Previously presented data show that the start of flowering has markedly advanced in a number of central European plants (i.e., snowdrop, forsythia, sweet cherry, and apple) (Roetzer et al., 2000), as well as in 11 UK species (Sparks et al., 2000), P. tremuloides in Canada (Beaubien and Freeland, 2000), citrus in Kerman and Shiraz in Iran (Fitchett et al., 2014), and in several Hungarian taxa (i.e., Convallaria majalis, Taraxacum officinale, Sambucus nigra, Tilia cordata) (Szabó et al., 2016). Similarly, the leaf-unfolding period in Swiss horse-chestnut trees (Defila and Clot, 2001) as well as in Lithuanian deciduous trees (Juknys et al., 2016), and the veraison of the Rkatsiteli in Georgia (Cola et al., 2016) have also all significantly advanced. The founder of modern Chinese phenology, Zhu, established a national observation network in 1963 to provide data for the study of changes (Ge et al., 2010), while Zhang (1995) pointed out that temperature was likely the most important meteorological factor affecting growth changes in woody plants. Zhang (1995) also noted that when annual mean temperature increases by 1℃, spring events in Chinese woody plants advanced by between 3 and 4 days, while autumn events were delayed by the same time period. A number of scholars have studied phenological changes in Chinese temperate plants (Chen et al., 2015), herbs in Hebei Province (Gao et al., 2012), woody plants in the city of Guiyang (Bai et al., 2009), general species within the city of Zhengzhou (Liu et al., 2007), and the vegetation of the Minqin desert area (Chang et al., 2009) to demonstrate advances in spring growth events correlated with autumn postponements. Chen et al. (2007) also noted that the length of the multi-year average growing season is mainly influenced by variations in latitude and altitude.
The tree species Populus euphratica is known to occur in 20 countries across Asia, Africa, and Europe, and is one of the most widespread desert region taxa in Central Asia. The highest abundance and largest area of this species globally are found within Chinese oases, mainly in Xinjiang Province, the Qaidam Basin, the Alxa Plateau, the Hexi Corridor, and on the Hetao Plain (Wei, 1990; Wang et al., 1995; Liu and Zhang, 2011). This species has the advantage of being drought and salt tolerant, and is also wind resistant, fast growing, and highly adaptable (Wei, 1990). Indeed, as P. euphratica is ‘a green guard’ that maintains the ecological balance of arid area oases, changes in its growing season start and end date as well as the length of this period are clear indicators of the impact of climate change on Chinese oases. Previous studies to evaluate the growing season responses of P. euphratica to climate change were focused on Hexi Corridor (Liu and Zhang, 2011) and Ejina Banner oases (Zhao et al., 2012), as well as some other isolated regions; the vast oases in Xinjiang Province, on the Hetao Plain, and in the Qaidam Basin have so far not been studied, and so the patterns and drivers of spatiotemporal responses to climate change remain unknown. The aim of this study is therefore to evaluate the spatiotemporal characteristics of growing season changes in P. euphratica within these regions in order better understand the effects of climate change and to provide a theoretical basis for the restoration and reconstruction of the ecological environment in Chinese oases.

2 Data and methods

2.1 Study area

Chinese oases are mainly distributed within the desert and semi-desert regions of northwestern China, between 34°25′-48°10′N and 73°40′-109°08′E, almost entirely in high mountains and on huge proluvium fans (Figure 1). These oases are mostly subject to a desert climate which consists of droughts and rare rainfall, are cold in the winter and hot in the summer, and experience large ranges of both annual and daily temperature. These oases are also heat-rich, a trend that increases generally from the east to the west; an accumulated temperature of 10℃ or greater is seen as values increase from 2500℃ in the Hexi Corridor to 4500℃ within the Tarim Basin in Xinjiang Province, while the accumulated temperature of the Qaidam Basin is very low (mostly less than 1500℃) as it is influenced by the vertical zone of the Tibetan Plateau. Mean annual rainfall in these regions tends to be less than 200 mm, while evaporation is very strong and sunshine levels are high, especially in the Hexi Corridor, the Tarim Basin, and western Inner Mongolia where annual solar radiation is above 586 kJ/cm2 (Shen et al., 2001). The soils of these regions are also dominated by brown-to-gray- brown deserts and eolian sandy soils, while zonal vegetation is mostly characterized by desert and desert steppe.
Figure 1 Distribution of meteorological stations in Chinese oases characterized by P. euphratica

2.2 Data

A dataset of daily average temperatures was used in this study that encompasses the period between 1960 and 2015; these data were recorded at 48 meteorological stations that span the distributional range of P. euphratica, all downloaded from the China Meteorological Science Data-sharing Service System (http://www.cma.gov.cn/). In earlier work, Shen et al. (2001) divided Chinese oasis regions into six parts, northern and southern Xinjiang Province, the Hexi Corridor, the Hetao Plain, the Qaidam Basin, and the Alxa Plateau. Similarly, and on the basis of observations of 42 plants in the Minqin desert botanical garden, Chang et al. (2009) considered temperature to be the main factor influencing the phenology of oasis plants in arid areas; indeed, these workers suggested that increasing temperature was the main reason underlying changes in the phenology of plants within the Minqin desert area. Based on the standard division proposed by Wei (1990), the annual cycle of P. euphratica starts with an average daily temperature of 5℃ or greater that remains stable throughout the spring, and ends at an average daily temperature at this level or less that remains stable throughout the autumn. We therefore confirmed the start date, the end date, and the growing season for P. euphratica, and applied an average weighting method to subregions when calculating these variables for Chinese oases. The circulation feature indexes used in this study were drawn from a set of 74 that comprise monthly values for the period between 1960 and 2015 issued by National Climate Center, including the cold air index (CA), the Tibetan Plateau index (TPI), the Asian polar vortex index (APVII, APVAI), and the westerly circulation index (WCI). In addition, annual mean carbon dioxide emissions (CDE) for the period between 1960 and 2011 were extracted from the World Bank database of world development indicators (http://data.worldbank.org.cn/). We analyzed trends and variations in the P. euphratica growing season applying a linear fitting method, and evaluated spatial variation and disparity via inverse distance weighted interpolation (IDW) in the software ArcGIS 9.3, and utilized the Mann-Kendall method for mutation tests as well as the Morlet wavelet power spectrum for periodic analysis. Finally, we discuss the factors that influence aspects of the P. euphratica growing season via correlation and regression analyses.

3 Results

3.1 Temporal variations in the P. euphratica growing season

(1) The start of growing season
The data presented in this paper show that over the past 56 years, variation in the start date of the P. euphratica growing season in Chinese oases has advanced significantly at a rate of -1.34 d/10 a (α ≥ 0.001) (Figure 2a), while the average start date (March 21st) has advanced 7.5 days over the past 56 years. Interestingly, although the start date in each oasis was not the same, they had all advanced to varying degrees (Figure 3a1-3f1); amongst these, the start date in the southern Xinjiang oasis was the earliest, March 11th on average, while that in the Qaidam Basin oasis was the latest, April 8th on average. The most obvious advancing trend was seen in the Hetao Plain oasis, where the change rate is -2.55 d/10 a (α ≥ 0.001); this start date has advanced 14 days over the last 56 years. The most unclear trend in advancing start date was seen in the southern Xinjiang oasis where the rate of change is -0.95 d/10 a (α ≥ 0.05); the start date in this oasis has advanced by just 5.4 days over the past 56 years.
In terms of inter-decadal variations (Table 1), the anomaly value of the start date was positive between the 1960s and the 1980s; this encapsulates a slight trend towards a delay during the 1970s, as well as a return to an advance during the 1980s. In the 1990s, however, this anomaly value reverted to negative; the observed change in this anomaly was the greatest between the 1990s and 2000s, reaching a maximum value of 3.8 days in the 2000s. These data show that the most significant advancing trend was during the 2000s.
Figure 2 Trends in P. euphratica start date, end date, and growing season variation in Chinese oases
(2) The end of growing season
Data presented in this study reveal that, over the past 56 years, variation in the end date of the P. euphratica growing season in Chinese oases has tended to be delayed significantly at a rate of 1.33 d/10a (α ≥ 0.001) (Figure 2b). Indeed, the average growing season end date has been delayed by 7.5 days over the past 56 years and now ends on October 28th on average. As with start dates, the recorded end date in each oasis is not the same and they have all been delayed by varying degrees (Figure 3 a2-3f2). Amongst these data, the end date for the P. euphratica growing season in the Qaidam Basin oasis was the earliest, ending on October 16th on average, while that of the southern Xinjiang oasis was the latest, ending on November 1st on average. The most obvious trend in postponement was seen in the northern Xinjiang oasis, where the rate of change is 1.83 d/10a (α ≥ 0.001); over the past 56 years, the end date has been delayed by 10 days in this oasis, while the most ambiguous trend towards postponement was in the Hetao Plain oasis, a rate of 1.02 d/10a (α ≥ 0.05). In this latter case, the end date of the growing season has been delayed by just 5.7 days over the past 56 years.
In terms of inter-decadal variations (Table 1), the anomaly value of the end date was negative between 1960 and the 1980s; the value of this anomaly ranged between -2.7 and 1.5, while the end date exhibited a slight trend towards advancement during the 1980s. In contrast, the end date tended to be delayed during the 1990s; this value switched from negative to positive over this period, from 0.5 to 3.6, while the greatest change was seen between the 1990s and the 2000s. This anomaly reached its highest level of 3.6 days during the 2000s, which shows that the most significant trend towards growing season postponement was at this time.
Figure 3 Trends in P. euphratica start date, end date, and growing season variation in each of the Chinese oases sampled in this study (Abbreviations: Beijiang, northern Xinjiang oasis; Nanjiang, southern Xinjiang oasis; Hexi, Hexi Corridor oasis; Hetao, Hetao Plain oasis; Qaidam, Qaidam Basin oasis; Alxa, Alxa oasis)
(3) The number of growing season days
Results show that over the past 56 years, the number of days that comprise the growing season of P. euphratica in Chinese oases has tended to extend at a rate of 2.66 d/10 a (α ≥ 0.001) (Figure 2c). In total, the number of days that comprise the growing season has been extended by 15 days over the past 56 years. Data show that the average growing season for P. euphratica is 221 days overall; the longest recorded period was 235 days in 2008 while the shortest was 209 days in 1960. The number of days that comprise the growing season in each oasis are different but have nevertheless all been extended to varying degrees (Figure 3a3-3f3); an average number of 234 days comprise the P. euphratica growing season in the southern Xinjiang oasis, the longest across the whole area, while that of the Qaidam Basin oasis was the shortest at just 191 days. The most obvious lengthening trend was seen in the Alxa Plateau oasis, a rate of 3.79 d/10 a (α ≥ 0.001); in this case, the growing season has been extended by 21 days over the last 56 years. The least obvious lengthening trend was seen in the southern Xinjiang oasis, a rate of change of just 2.11 d/10 a (α ≥ 0.001) which corresponds to an extension of just 11.8 days over the last 56 years.
In terms of inter-decadal variations (Table 1), the results of this study show that the growing season of P. euphratica has been remarkably extended. Negative values characterize the 1960s to the 1980s while absolute anomaly values decrease gradually, and the number of days that comprise the growing season exhibit a trend towards significant extension. In the 1990s, however, anomaly values changed from negative to positive, and increased gradually, so the largest changes were seen during the period between the 1960s and the 2000s; over this time, values increased to 6.6 days and reached a maximum value of 7.3 days by the 2000s. These data reveal an obvious trend towards lengthening the growing season.
Table 1 Decadal P. euphratica growing season anomalies in Chinese oases
Decade Start date (d) End date (d) Growing season (d)
1960-1969 1.8 -2.7 -4.4
1970-1979 2.4 -1.3 -3.7
1980-1989 1.6 -1.5 -3.2
1990-1999 -0.1 0.5 0.7
2000-2009 -3.8 3.6 7.3
2010-2015 -3.3 2.3 5.5
In sum, the P. euphratica growing season in Chinese oases conforms to a trend over the last 56 years such that the start date has been advanced, the end date has been delayed, and the number of days that comprise this period have been extended. This result is consistent with the conclusion that the spring phenology of woody plants has been advanced by increasing temperatures, while autumn phenology has been delayed, and the number of days that comprise the growing season has increased (Zhang, 1995). Thus, a trend in P. euphratica growing season start date advancement is more obvious than the corresponding postponement trend in end date and is also consistent with the conclusion that extension of the growing season is mainly the result of spring phenology advancement (Chmielewski and Rötzer, 2001).

3.2 Spatial variations in the P. euphratica growing season in Chinese oases

We investigated the spatial distribution characteristics of mean start and end date values as well as the number of growing season days measured at 48 meteorological stations within Chinese oases between 1960 and 2015 by applying the IDW interpolation method (Figure 4).
Figure 4 Trends in the spatial distribution of the P. euphratica growing season in the Chinese oases sampled in this study
The results of these comparisons show that although spatial disparity in start and end dates, as well as the number of days that comprise the P. euphratica growth period exhibit significant regional differences, the characteristics of spatial variation remain consistent. In general, the number of days that make up the growth period have tended to shorten over time; specifically, start dates have tended to be delayed while end dates have advanced from southwest to northeast over Chinese oases. This variation is particularly evident in the Xinjiang oasis; overall, the start date of the growing season has varied between February 9th and April 18th, the end date has varied between October 8th and November 14th, and the number of days that comprise this period has ranged between 173 and 256. The earliest growing season start date, the latest end date, and the longest growing season were all seen in southwestern China in the southern Xinjiang oasis, for two reasons. In the first place, this oasis is located in the Tarim Basin and is therefore blocked by the Tianshan Mountains; this terrain occlusion means that more cold air enters from the east but is greatly weakened when it reaches the southwest of this oasis (Li, 1991). Secondly, the underlying surface of this region comprises desert and so it is difficult for heat to spread due to basin topography. This means that the region to the west of southern Xinjiang oasis tends to be warmer than other areas. Similarly, due to the combination of high elevation and low temperature, the Qaidam Basin oasis exhibited the latest start date, the earliest end date, and the shortest growing season.
Results from 92% of the stations across our study area reveal a tendency towards advancing start dates for the P. euphratica growing season, and 56% were significant at the 0.05 level (Figure 4a). In terms of end dates, delaying trends were seen at about 96% of stations, and 75% were significant at the 0.05 level (Figure 4b). In contrast, in terms of the number of days that comprise the growing season, extending trends were seen in about 98% of stations, and 85% were significant at the 0.05 level (Figure 4c). These data reveal a very obvious and widespread trend towards extending the number of days that comprise the P. euphratica growing season in Chinese oases. At the same time, however, start dates were advanced, the number of days that comprised the growing season increased, and end dates revealed an insignificant trend towards delaying within the Hetao and Alxa oases. These observations may be due to the fact that the most significant warming trends occur in winter and summer, while this trend is less significant in spring, and negligible in autumn in Inner Mongolia (Chen et al., 2009). Similarly, an advancing trend in start date combined with a delayed trend in end date, and an extension in the number of days that comprise the P. euphratica growing season in southern Xinjiang were the least significant across the study area. In contrast, in the northern Xinjiang region, the end date of the growing season exhibited the most significant trend towards a delay, while the start date exhibited an insignificant advance across this region, a result in close agreement with the earlier work of Li et al. (2011). These workers note that the seasonal warming rate in spring was the lowest in Xinjiang Province between 1961 and 2005. Results also show that the end date of the growing season was significantly delayed within the Qaidam Basin oasis, in concert with an insignificant trend in advancing start date that is related to the autumn and winter warming rate; previous work has shown that this rate is significantly higher than that of the spring and summer, and that spring within this basin is characterized by the slowest rate of warming (Shi et al., 2005).

3.3 Mutation analysis

We performed a mutation test analysis to investigate trends in start and end dates as well as the number of days that comprise the P. euphratica growing season in Chinese oases over the last 56 years by applying the Mann-Kendall method with a 0.01 significance level and a critical line set at Uα= ± 2.56. UF is the statistic sequence which is calculated by time series sequence. And | UFi | > Uα indicates that the sequence has obvious changing trend.
The results of this analysis show that, out of the last 56 years, a mutation in growing season start date occurred in 2001 (Figure 5a); in other words, the start date of the growing season advanced after 2001, and the UF curve has exceeded the critical line since 2005 when the start date advanced significantly. In contrast, prior to 2001, the average start date of the growing season was March 22nd, and it was March 17th after 2001, this has advanced 5 days following mutation (Table 2). A similar mutation in the end date of the growing season occurred in 1989 (Figure 5b); results show that the UF curve has exceeded the critical line since 2000 and thus the end date of the growing season has been significantly delayed; the average end date before mutation in 1989 was October 26th, but has subsequently moved to October 30th, a delay of 4 days. Finally, a mutation in the number of days that comprise the growing season occurred in 1996 (Figure 5c); UF curves indicate that the number of days comprising the P. euphratica growing season had been slowly extending prior to 1996, but that a very significant extension has occurred since this date. The average length of the growing season was 218 days before the 1996 mutation, rising to 228 days afterwards, a total extension of 10 days. Thus, the end date of the P. euphratica growing season appears to have exhibited the most sensitive response to climate warming.
Figure 5 Mutation analysis of the start date, end date, and growing season of P. euphratica in Chinese oases
Table 2 Changes in the P. euphratica growing season in Chinese oases before, and after mutation
Start date End date Growing season (d)
Before abrupt change 3/22 10/26 218
After abrupt change 3/17 10/30 228
Change (d) -5 4 10

3.4 Period analysis

We utilized Morlet wavelet power spectra in order to analyze cyclical variations in the start and end date, as well as the number of days that comprise the growing season of P. euphratica in Chinese oases. The results of this analysis reveal that the periods of P. euphratica growing seasons across the study area were obviously short; amongst these, start dates are characterized by periods of 3.56 years and 4.28 years (α ≥ 0.1) (Figure 6a; PSD is power spectral density), while end date are characterized by periods of 5.31 years, 5.85 years, and 7.14 years (α ≥ 0.1) (Figure 6b), and the number of days within the growing season had a period of 7.09 years (α ≥ 0.15) cycle (Figure 6c). These P. euphratica growing season periods are all consistent with an El Niño period of between two years and seven years, while the growing season start date period is consistent with an atmospheric circulation period of between two years and four years. These data are clearly consistent with the fact that the start date, end date, and length of the P. euphratica growing season have mainly been impacted by El Niño events and atmospheric circulation.
Figure 6 Morlet wavelet power spectra of the start date, end date, and the number of days that comprise the P. euphratica growing season in Chinese oases

3.5 Causal analysis

(1) Correlation analysis to determine the factors influencing variation
In order to explore the factors that influence changes in the start date, end date, and the number of days that comprise the P. euphratica growing season in Chinese oases, we evaluated six circulation indexes as natural proxies (i.e., APVAI, APVII, CA, TPI, and WCI) as well as the artificial CDE. We performed a linear correlation analysis to calculate the correlation coefficient between atmospheric circulation factors and the start date, the end date, and the number of days that comprise the P. euphratica growing season in Chinese oases in corresponding months and periods. We also established a correlation between start dates, end dates, and the number of growing season days in the case of the Qaidam Basin oasis as well as mean values for each index for April, November, and the period between April and November.
The results of this analysis indicate that changes in the start date, the end date, and the number of days that comprise the P. euphratica growing season were influenced mainly by the atmospheric circulation factors, such as APVAI, TPI and WCI, and the artificial CDE indexes (Table 3), a finding that is consistent with the periodic characteristics of Morlet wavelet power spectra which proves that the P. euphratica growing season have mainly been impacted by atmospheric circulation. Thus, as the APVAI increased, start dates were delayed, end dates advanced, and the number of days that comprised the growing season were extended accordingly. In addition, results also show that the TPI is significantly correlated with start dates, end dates, and the number of days that comprise the P. euphratica growing season, especially within the Hexi Corridor and southern Xinjiang oasis in large part due to the dynamic and thermal effects of the Tibetan Plateau. Indeed, because of the branching effect of the Tibetan Plateau in winter, one cold air branch from the east moves off into southern Xinjiang Province, while the other moves along the Hexi Corridor to the south and consequently influences both the start and end dates of the P. euphratica growing season (Wang, 2007). In addition, with the exception of the Qaidam Basin oasis, values for the WCI were significantly correlated with the start date, the end date, and the number of days that comprise the P. euphratica growing season in other Chinese oases because these areas are all located at the level of mid-latitude westerlies and therefore the intensity of circulation affects temperature. In addition, and again with the exception of the start date in the Qaidam Basin oasis, start dates, end dates, and the number of days that comprise the growing season in other oases are all significantly correlated with CDE; excessive CO2 emissions are the main cause of global warming, and therefore a high degree of correlation between this index and P. euphratica growing season variations further reflects the fact that these changes are very sensitive to climatic fluctuations in Chinese oases.
Table 3 Correlation analysis results comparing the P. euphratica growing season and relevant impact factors in Chinese oases
APVII APVAI CA TPI WCI CDE
Start date Alxa 0.243* 0.529*** 0.029 -0.185 -0.399*** -0.377***
Beijiang 0.393*** 0.583*** -0.053 -0.177 -0.263** -0.246*
Qaidam -0.091 0.013 -0.108 -0.346*** -0.092 -0.17
Hetao 0.173 0.486*** 0.045 -0.306** -0.397*** -0.582***
Hexi 0.181 0.580*** -0.016 -0.434*** -0.409*** -0.319**
Nanjiang -0.21 0.342*** -0.272** -0.540*** -0.435*** -0.321**
End date Alxa -0.104 -0.273** -0.163 0.372*** 0.315** 0.281**
Beijiang -0.324** -0.523*** -0.179 0.372*** 0.284** 0.547***
Qaidam -0.340** -0.042 0.071 0.135 0.068 0.474***
Hetao 0.145 -0.211 -0.096 0.395*** 0.382*** 0.392***
Hexi -0.03 -0.395*** -0.122 0.581*** 0.308** 0.406***
Nanjiang -0.230* -0.416*** -0.012 0.481*** 0.236* 0.529***
Growing season Alxa -0.152 -0.358*** -0.246* 0.301** 0.356*** 0.507***
Beijiang -0.205 -0.368*** -0.152 0.345*** 0.234* 0.538***
Qaidam -0.393*** -0.270** -0.062 0.192 0.059 0.423***
Hetao -0.106 -0.363*** -0.22 0.361*** 0.414*** 0.649***
Hexi -0.169 -0.362*** -0.197 0.445*** 0.335** 0.488***
Nanjiang -0.222* -0.480*** 0.041 0.592*** 0.322** 0.552***

Abbreviations: *, ** and, *** denote α = 0.1, α = 0.05, and α = 0.01 levels of significance, respectively.

(2) The influence of geographical parameters
As the Chinese oases evaluated in this study cross 14 latitudes from south-to-north and encompass large changes in terrain slope, we further analyzed the influence of latitude and altitude on aspects of the P. euphratica growing season. We therefore established a binary linear regression model in this study that expresses the relationship between start date, end date, the number of days that comprise the growing season, and latitude and altitude (see equations (1) to (3), below). Thus, at a 95% confidence level, corresponding R2 values are 0.44, 0.55, and 0.57 respectively, while F values are 17, 27, and 29. Therefore, we obtain the following equations:
Y1 = 3.69X1 + 0.016X2 - 89.4 (1)
Y2 = -2.57X1 - 0.012X2 + 420 (2)
Y3 = -6.30X1 - 0.028X2 + 511 (3)
where Y1, Y2, and Y3 denote the start date, the end date, and the number of days that comprise the P. euphratica growing season, respectively, while X1 denotes latitude, and X2 denotes altitude.
This model reflects the effect of both latitude and altitude on the start date, the end date, and the number of days that comprise the P. euphratica growing season. Thus, given an increase in latitude of 1°N, the growing season start date will occur about 3.69 days later, while the end date will occur about 2.57 days earlier, and the number of days that make up the growing season will be shortened by about 6.3 days. Similarly, given a change in altitude of 100 m, the start date will occur about 1.6 days later, the end date will occur about 1.2 days earlier, and the number of days that comprise the growing season will be shortened by 2.8 days. At the same altitude, therefore, a higher latitude will be characterized by a later starting date, an earlier ending date, and a shorter P. euphratica growing season, while the same latitude but higher altitude will exhibit a later starting date, an earlier ending date, and a shorter growing season. This analysis shows that the influence of latitude on growing season variables is more significant than that of altitude, while the start date is more significantly influenced by both latitude and altitude than the end date. This result is also consistent with the conclusion that inter-annual variability has more significantly advanced the start date of the growing season as opposed to postponing the end date.
Figure 7 Correlation analyses comparing start dates, end dates, and the number of days that comprise the P. euphratica growing season versus mean monthly temperatures in Chinese oases
(3) The relationship between the P. euphratica growing season and monthly mean temperature
We performed a further correlation analysis as part of this study to investigate the relationship between start date, end date, the number of days that comprise the growing season, and the average temperature of March, October, and between March and October. We also sought to explore response mechanisms between P. euphratica growing season variation and temperature (Figure 7).
The results of this analysis reveal that the start date of the P. euphratica growing season in Chinese oases and March average temperatures are significantly negatively correlated with one another (correlation coefficient: -0.875; α ≥ 0.001). The southern Xinjiang oasis exhibits the highest correlation within this dataset (correlation coefficient: -0.920; α ≥ 0.001), while the Qaidam Basin oasis has the lowest correlation (correlation coefficient: -0.265; α ≥ 0.05). At the same time, data show that the correlation coefficient between the start date of the P. euphratica growing season in the Qaidam Basin oasis and April average temperature was -0.571 (α ≥ 0.001), a result that is clearly related to the high elevation of this region. Similarly, the end date of the P. euphratica growing season in Chinese oases and average October temperature were significantly positively correlated with one another (correlation coefficient: 0.770; α ≥ 0.001), while the end date in each oasis was also significantly correlated with October average temperature. This result shows that the higher the temperature in October, the later the growing season of P. euphratica will end; indeed, amongst these oases, the Northern Xinjiang example exhibited the highest correlation (correlation coefficient: 0.815; α ≥ 0.001), while the number of days comprising the P. euphratica growing season and the average temperature between March and October were also significantly positively correlated (correlation coefficient: 0.897; α ≥ 0.001). In addition, the number of days that comprised the growing season in each oasis were also significantly positively correlated with the average temperature between March and October (correlation coefficients between 0.606 and 0.854; α ≥ 0.001), with the Northern Xinjiang example exhibiting the highest correlation. These data indicate that the higher the temperature between March and October, the longer the P. euphratica growing season.
Previous research has shown that temperature is the dominant meteorological factor that influences phenological changes in woody plants across China (Zhang, 1995). This variable can control phenological arrival time; indeed, the statistical analysis presented above shows that the annual P. euphratica growing season is strongly correlated with average temperature in any given month. We therefore established another series of regression equations that express the relationships between start date, end date, the number of days that comprise the growing season, and the average temperature of each corresponding month. Thus, at a 95% confidence level, corresponding R2 values are 0.77, 0.59, and 0.81 respectively, while F values are 177, 78, and 223. Therefore, we obtain the following equations:
Y1 = -2.21X3 + 84.78 (4)
Y2 = 2.76X4 + 280.58 (5)
Y3 = 7.78X5 + 116.64 (6)
where Y1, Y2, and Y3 denote the start date, the end date, and the number of days that comprise the P. euphratica growing season, respectively, while X3 is the average temperature in March, X4 is the average temperature in October, and X5 is the average temperature between March and October.
The model accurately reflects the responses seen in the P. euphratica growing season to changes in temperature. Calculations show that if the average temperature in March increases by 1℃, then the growing season will start about 2.21 days earlier, while if the average temperature in October increases by 1℃, then the end date of the growing season will be delayed by 2.76 days. These results are similar to those reported previously by Chen and Xu (2012); these workers noted that if the average temperature in the autumn increased by 1℃, then the end date of the vegetation growing season in the Chinese temperate zone would be delayed by 2.6 days (Chen and Xu, 2012). Similarly, if the average temperature between March and October increased by 1℃, then the number of days that comprise the growing season will be prolonged by about 7.78. These results further indicate that changes in the P. euphratica growing season are sensitive in response to global warming.

4 Conclusions

(1) The data presented in this study show that the start date of the P. euphratica growing season has advanced over the last 56 years, while the end date has been postponed, and the number of days that comprise the growing season have been gradually prolonged, at average rates of -1.34 d/10 a, 1.33 d/10 a, and 2.66 d/10 a (α ≥ 0.001), respectively. Data show that the start date of the P. euphratica growing season in the southern Xinjiang oasis was the earliest, while the end date in this region was the latest, and the number of days that comprise the growing season was the longest. This situation is reversed in the case of the Qaidam Basin oasis.
(2) The spatial distribution of start dates, end dates, and the number of days that comprise the P. euphratica growing season exhibit significant regional differences, but consistent patterns of spatial variation. The data presented in this paper generally show that the number of days that comprise the growing season have tended to shorten over time, while start dates have been delayed, and end dates have advanced along a transect from southwest-to-northeast over Chinese oases. These patterns of variation are most notable within the Xinjiang oasis.
(3) The mutation analysis presented in this study shows that mutation points of start and end dates as well as the overall growing season were seen in 2001, 1989, and 1996, respectively. Results reveal that the end date of the growing season provides the most sensitive response to climate warming, while analysis of Morlet wavelet power spectra show that the start date, the end date, and the number of days that comprise the P. euphratica growing season have cycled over short periods of time between 3.56 years and 7.14 years. This periodicity is consistent with El Niño event cycles, while variation in start dates are likely correlated with atmospheric circulation.
(4) The causal analysis presented in this paper shows that the APVAI, APVII, CA, and CDE indexes provide the main explanations for variations in start dates, end dates, and the number of days that comprise the P. euphratica growing season in Chinese oases. This result is consistent with the previous outcomes of Morlet wavelet power spectra analysis.
Data show that given a 1°N increase in latitude, the start date of the growing season will occur about 3.69 days later, the end date will occur about 2.57 days earlier, and the number of days that comprise the growing season will be shortened by about 6.3. Similarly, at an altitude of 100 m, the start date of the growing season will occur about 1.6 days later, while the end date will occur about 1.2 days earlier, and the number of days that comprise the growing season will be shortened by about 2.8. Latitude exerts a more significant influence on the P. euphratica growing season than altitude, while the start date was more significantly perturbed by latitude and altitude than the end date.
Data show that the start date, the end date, and the number of days that comprise the growing season were all significantly correlated with the average temperatures in March, October, and between March and October, respectively, with correlation coefficients of -0.875, 0.770, and 0.897 (α ≥ 0.001), respectively. Thus, a 1℃ increase in March average temperature will cause the start date of the growing season to occur about 2.21 days earlier, while a similar increase in October average temperature will cause a 2.76 day delay to the growing season end date. Lastly, a 1℃ increase in the average temperature between March and October will cause a 7.78 day increase in the length of the P. euphratica growing season.

The authors have declared that no competing interests exist.

[1]
Bai J, Ge Q S, Dai J H, 2009. Response of woody plant phenophases to climate change for recent 30 years in Guiyang.Geographical Research, 28(6): 1606-1614. (in Chinese)By using observed phenological and meteorological data from 1978 to 2007 at Guiyang station,the variation of 71 woody plants' five primary phenophases and their responses to climate change were analyzed,especially focused on the link between phenophases changes and climate changes before the phenophase onset,including leaf bud sprouting,first leaf unfolding,first flowering,leaf fully coloring and leaf fully defoliation.Conclusions are obtained as follows.1) Since 1978,the mean annual temperature has dropped in oscillations totally,and decreased sharply after 2000,of which summer(June to August) temperature declined markedly,but spring(February to April) temperature had no clear variation except a slight increase of February temperature.2) Three spring phenophases showed advancement generally,with advancement of 17 days for leaf bud sprouting,advancement of 15.5 days for first leaf unfolding and advancement of 16.7 days for first flowering during the past 30 years.But in the meantime,autumn phenophase delayed,with 19 days deleyed in leaf fully coloring and 14.3 days postponed of leaf fully defoliation.3) Statistically significant correlation was found between the changes of spring phenophases and the mean temperature of one or several months before the phenophase onset,and the mean monthly temperature of February was the key indicator to the three spring phenophases.With 1 increase of monthly temperature of February,leaf bud sprouting,first leaf unfolding and first flowering advanced 3.4 days,3.3 days and 3.1days,respectively.In addition,the sunshine duration change in February or March also played an important role in advancement of spring phenophase.4) The variation of phenophases in autumn and winter had no clear relationship with the monthly temperature,precipitation and sunshine duration respectively,due to the complexity of the autumn phenological variations and wide influence on them.

DOI

[2]
Beaubien E G, Freeland H J, 2000. Spring phenology trends in Alberta, Canada: Links to ocean temperature.International Journal of Biometeorology, 44(2): 53-59.Abstract Warmer winter and spring temperatures have been noted over the last century in Western Canada. Earlier spring plant development in recent decades has been reported for Europe, but not for North America. The first-bloom dates for Edmonton, Alberta, were extracted from four historical data sets, and a spring flowering index showed progressively earlier development. For Populus tremuloides, a linear trend shows a 26-day shift to earlier blooming over the last century. The spring flowering index correlates with the incidence of El Ni01±o events and with Pacific sea-surface temperatures.

DOI PMID

[3]
Chang Z F, Qiu G Y, Zhao M , et al. 2009. Responses of plant phenology to climate warming in Minqin desert area.Acta Ecologica Sinica, 29(10): 5195-5206. (in Chinese)Recently responses of plant phenology to climate warming have become a hot topic both in the plant phenology and the climate change studies.However,reports of desert plant to climate warming based on a long-term observation are quite few.In this study,a 34-years observation was carried out to reveal the responses of phenology of 42 desert plant species(including mesophyte and xerophyte) to climate changes in Minqin,a typical desert area in the Northwest China.Results showed that spring phenophases were significantly greater than reported by others.In the process of climate warming,change of monthly average temperature in different months and change of annual mean temperature was not corresponding entirely.The influence on phenophase by monthly average temperature in the phenophase month was more obviously than that in the last month,and annual mean temperature influenced phenophase the least.The study area locates in China typical desertification areas and has an arid desert climate;air temperature rising in spring is faster than other regions.This is the reason of advanced spring phenophase in local area;it is also the reason that it has more sandstorms and the in-advance date of sandstorms over the past several decades in this area as well as China northwest sand area.

[4]
Chen X Q, Pang C, Xu Let al., 2015. Spatiotemporal response ofSalix matsudana’s phenophases to climate change in China’s temperate zone. Acta Ecologica Sinica, 35(11): 3625-3635. (in Chinese)

[5]
Chen X Q, Peng J D, Li H M, 2009. Seasonal and regional differences of air temperature changes in Inner Mongolia.Geographical Research, 28(1): 27-35. (in Chinese)Using monthly mean air temperature data from 101 meteorological stations during 1961-2003 in the entire Inner Mongolia and the method of Rotated Empirical Orthogonal Functions(REOF),we implemented a regionalization according to consistency in air temperature variations of the four seasons,and analyzed seasonal and regional differences of air temperature variations.The seasonal air temperature changes indicate an apparent east-west difference in Inner Mongolia.The air temperature fields of spring,autumn and winter could be divided into two regions,namely,the West Region and the East Region,whereas the air temperature field in summer could be classified into three regions,namely,the West Region,the Southeast Region and the Northeast Region.In terms of the interannual variation,the seasonal air temperatures in each region experienced an obvious transition from decrease to increase during the recent 43 years except the Southeast Region in summer,and the turning points appeared either in the middle and late 1980s(in the East Region of spring and summer,and in the East and West Regions in autumn and winter) or in the early and mid-1990s(in the West Region of spring and summer).Dealing with the linear trend,the slope and significance of increased temperature trends in the East Region are larger than in the West Region during spring and summer,whereas the slope and significance of increased temperature trends in the West Region are larger than in the East Region during autumn and winter.Generally speaking,the most significant temperature increase appeared in winter and summer and then in spring,and the slightest temperature increase was shown in autumn.

DOI

[6]
Chen X Q, Xu L, 2012. Temperature controls on the spatial pattern of tree phenology in China’s temperate zone.Agricultural and Forest Meteorology, 154/155: 195-202.We used Ulmus pumila leaf unfolding and leaf fall data collected at 46 stations during the 1986–2005 period to construct and validate daily temperature-based spatial phenology models. These models allowed simulation of the 20-year mean and yearly spatial patterns of U. pumila growing season beginning and end dates. This work was undertaken to explore the ecological mechanisms driving tree phenology spatial patterns and examine tree phenology spatial responses to temperature across China's temperate zone. The results show that spatial patterns of daily temperatures within the optimum spring and autumn length periods control spatial patterns of growing season beginning and end dates, respectively. Regarding 20-year mean growing season modeling, mean growing season beginning date correlates negatively with mean daily temperature within the optimum spring length period at the 46 stations. The mean spring spatial phenology model explained 90% of beginning date variance ( P 02<020.001) with a Root Mean Square Error (RMSE) of 4.6 days. In contrast, mean growing season end date correlates positively with mean daily temperature within the optimum autumn length period at the 46 stations. The mean autumn spatial phenology model explained 82% of end date variance ( P 02<020.001) with a RMSE of 5.6 days. On average, a spatial shift in mean spring and autumn daily temperatures by 102°C may induce a spatial shift in mean beginning and end dates by 613.1 days and 2.6 days, respectively. Similarly, a significant negative and positive correlation was detectable between beginning date and spring daily temperature and between end date and autumn daily temperature at the 46 stations for each year, respectively. In general, the explained variances for yearly spatial phenology models are less than those of mean spatial phenology models, whereas the RMSEs of yearly models are greater than those of mean models. On average, a spatial shift in spring and autumn daily temperatures by 102°C in a year may induce a spatial shift in beginning and end dates between 614.28 days and 612.75 days and between 2.17 days and 3.16 days in the year, respectively. Moreover, both mean and yearly spatial phenology models perform satisfactorily in predicting beginning and end dates of the U. pumila growing season at external stations. Further analysis showed that the negative spatial response of yearly beginning date to spring daily temperature was stronger in warmer years than in colder years. This finding suggests that climate warming in late winter and spring may enhance sensitivity of the growing season's spatial response due to the relationship of beginning date to temperature.

DOI

[7]
Chen X Q, Yu R, 2007. Spatial and temporal variations of the vegetation growing season in warm-temperate Eastern China during 1982 to 1999.Acta Geographica Sinica, 62(1): 41-51. (in Chinese)Phenological observation data of plant communities from 1982 to 1996 at 5 sites and a method for phenological cumulative frequency modeling were used to determine the beginning dates of local phenological seasons and their corresponding threshold values of normalized difference vegetation index(NDVI) in each year.Then,a year-type cluster analysis of NDVI profiles at each phenological station during 1982 to 1999 and a spatial cluster analysis of NDVI profiles for all of the pixels within the study area year by year were employed to fulfill a spatial-temporal extrapolation of vegetation phenological seasons.Consequently,we obtained spatial-temporal patterns of the beginning date of vegetation phenological seasons and the length of the vegetation growing season in the deciduous broad-leaved forest area of warm-temperate eastern China from 1982 to 1999.The results show that(1) the annual mean beginning dates of vegetation phenological seasons and the mean lengths of the vegetation growing season indicate changes of a spatial pattern mainly following latitude and altitude;(2) the beginning dates of the phenological spring dominate a significantly advanced trend over the entire area during 1982 to 1999,especially in North China Plain,whereas the beginning dates of the phenological summer,autumn and winter dominate a significantly delayed trend,also mainly in North China Plain,which causes a significant lengthening of the vegetation growing season in North China Plain;(3) linear trends of the beginning dates of vegetation phenological seasons are consistent with linear trends of seasonal air temperatures in North China;(4) the vegetation growing season lengthening revealed by the current study is consistent with the phenological growing season lengthening of the individual tree species in Europe,and the satellite-derived growing season lengthening in Eurasia and temperate China.

[8]
Chmielewski F M, Rötzer T, 2001. Response of tree phenology to climate change across Europe.Agricultural and Forest Meteorology, 108(2): 101-112.To investigate the impact of recent climatic changes on the plant development in Europe, this study uses phenological data of the International Phenological Gardens for the period 1969–1998. For this study, the leafing dates of four tree species ( Betula pubescens , Prunus avium , Sorbus aucuparia and Ribes alpinum ) were combined in an annual leaf unfolding index to define the beginning of growing season. The end of growing season was defined using the average leaf fall of B. pubescens , P. avium , Salix smithiana and R. alpinum . A nearly Europe-wide warming in the early spring (February–April) over the last 30 years (1969–1998) led to an earlier beginning of growing season by 8 days. The observed trends in the onset of spring corresponded well with changes in air temperature and circulation ( North Atlantic Oscillation Index (NAO-index)) across Europe. In late winter and early spring, the positive phase of NAO increased clearly, leading to prevailing westerly winds and thus to higher temperatures in the period February–April. Since the end of the 1980s the changes in circulation, air temperature and the beginning of spring time were striking. The investigation showed that a warming in the early spring (February–April) by 1°C causes an advance in the beginning of growing season of 7 days. The observed extension of growing season was mainly the result of an earlier onset of spring. An increase of mean annual air temperature by 1°C led to an extension of 5 days.

DOI

[9]
Cola G, Failla O, Maghradze Det al., 2016. Grapevine phenology and climate change in Georgia.International Journal of Biometeorology, 61: 761-773.Abstract While the climate of Western Europe has been deeply affected by the abrupt climate change that took place in the late '1980s of the twentieth century, a similar signal is detected only few years later, in 1994, in Georgia. Grapevine phenology is deeply influenced by climate and this paper aimed to analyze how phenological timing changed before and after the climatic change of 1994. Availability of thermal resources in the two climatic phases for the five altitudinal belts in the 0-1250-m range was analyzed. A phenological dataset gathered in two experimental sites during the period 2012-2014, and a suitable thermal dataset was used to calibrate a phenological model based on the normal approach and able to describe BBCH phenological stages 61 (beginning of flowering), 71 (fruit set), and 81 (veraison). Calibration was performed for four relevant Georgian varieties (Mtsvane Kakhuri, Rkatsiteli, Ojaleshi, and Saperavi). The model validation was performed on an independent 3-year dataset gathered in Gorizia (Italy). Furthermore, in the case of variety Rkatsiteli, the model was applied to the 1974-2013 thermal time series in order to obtain phenological maps of the Georgian territory. Results show that after the climate change of 1994, Rkatsiteli showed an advance, more relevant at higher altitudes where the whole increase of thermal resource was effectively translated in phenological advance. For instance the average advance of veraison was 5.9 days for 250-500 m asl belt and 18.1 days for 750-1000 m asl). On the other hand, at lower altitudes, phenological advance was depleted by superoptimal temperatures. As a final result, some suggestions for the adaptation of viticultural practices to the current climatic phase are provided.

DOI PMID

[10]
Defila C, Clot B, 2001. Phytophenological trends in Switzerland.International Journal of Biometeorology, 45(4): 203-207.

DOI

[11]
Fang X Q, Yu W H, 2002. Progress in the studies on the phenological responding to global warming. Advances in Earth Sciences, 17(5): 714-719. (in Chinese)The global average surface temperature has increased over the 20th Century evidently, especially in the last 20 years of the century. Global warming has been a very important problem of the world. Climate warming is expected to alter seasonal biological phenomena such as plant growth and flowering or animal migration, which depend on accumulated temperature. These phenological changes are likely to have a wide range of consequences for ecological processes, agriculture, forestry, human health, and the global economy. The study on the phenological responding to global warming is becoming a new hot research point. Remote sensing data validate these ground observations on larger scales. Lots of studies demonstrate that NOAA AVHRR data are well suited for studying the regional impact of the climatic change. This paper summarized the progresses in the studies of the phenology in responding to global warming. Based on observation on the spot and remote sensing monitoring on plant and animal, it is found that the phenology is changing remarkably. Many plants and animals respond to a longer growing season by changing the timing of activities associated with the arrival of spring and onset of autumn such as flowering, leaf fall, breeding, and migration. Observations on the spot show the leaves of many deciduous plant species now unfold earlier and fall later in the mid to high latitude area of the northern hemisphere. A large increase in growing season NDVI magnitude and a longer active growing season has also been observed by satellite. Flowering date of many flowers are tending to earlier. Some insects now also appear earlier. The timing of bird migration and breeding is sensitive to changes in temperature, and global warming would be expected to lead to an earlier onset of those activities in the spring. These changes in plant and animal phenology may lead to a decoupling of species interactions. It is also found the trend toward earlier ice break up and snow melting in spring that is consistent with the enhanced warming observed at higher latitudes. All the phenological changes which link to increasing surface temperatures very well, which is an obviously responding to the globe warming. Compared with the international research advance, there are still lots of work to do on the research of phonological response to global warming in China.

[12]
Fitchett J M, Grab S W, Thompson D I , et al. 2014. Spatio-temporal variation in phenological response of citrus to climate change in Iran: 1960-2010. Agricultural & Forest Meteorology, 198-199: 285-293.Recent studies investigating floral and faunal phenological responses to climate change have highlighted the extent to which these relationships are species and location specific. This study investigates temporal responses of citrus peak flowering to climate change in the cities of Kerman, Shiraz and Gorgan, Iran. Phenological data comprise peak flowering dates of five citrus types: orange, tangerine, sweet lemon, sour lemon and sour orange, collected daily from government heritage gardens located within each of the cities over the period 1960–2010. For the same period, daily Tmax, Tmin and rainfall data were acquired from the Iranian Meteorological Organization. Time trend analyses were undertaken for both the phenological and meteorological data, followed by linear regression to determine the nature and extent of relationships between these variables. We find that the mean peak flowering dates, and their long-term trends over the 51-year period, are similar across the five citrus types within each city, but demonstrate significant differences between cities. Flowering date advances of 0.12–0.17d/yr are recorded for Kerman, and more rapid advances of 0.56–0.65d/yr for Shiraz. Notably, progressive delays in flowering dates occur in Gorgan (0.05–0.1d/yr). The peak flowering dates in the former two cities demonstrate strong relationships with mean annual Tmin, ranging from r=0.47–0.61 (p=0.0045; p<0.0001) for Kerman to r=0.53–0.67 (p=0.0386; p<0.0001) for Shiraz, and equate to peak flowering advances of 3.15–3.39d/°C and 4.34–5.47d/°C, respectively. By contrast, the strongest relationships between peak flowering dates and annual climate in Gorgan are with rainfall (r=0.02–0.3, p=0.8874; p=0.0528), indicating a weak phenophase response of 0.01d/mm. For Gorgan, the strongest relationships (r=0.43–075, p=0.0002 to p<0.0001) are between peak flowering date and mean Tmax for May, the month during which peak flowering occurs, with a delay in flowering of 1.26–1.86d/°C cooling. This suggests a relatively more influential climatic role directly preceding peak flowering, which may be associated with anomalous cooling in May. However, Kerman and Shiraz demonstrate more consistent strength in correlation between peak flowering and climate variables across the months of the year, with only slight peaks for the months flanking peak flowering. Our study highlights the importance of considering location-specific phenophase shifts within given regions, as dissimilar trends may occur within a country; this has important implications for future agricultural planning and fruit crop supply to local and international markets.

DOI

[13]
Fu Y H, Campioli M, Demarée G , et al. 2012. Bayesian calibration of the uUnified budburst model in six temperate tree species.International Journal of Biometeorology, 56: 153-164.Numerous phenology models developed to predict the budburst date of trees have been merged into one Unified model (Chuine, 2000, J. Theor. Biol. 207, 337–347). In this study, we tested a simplified version of the Unified model (Unichill model) on six woody species. Budburst and temperature data were available for five sites across Belgium from 1957 to 1995. We calibrated the Unichill model using a Bayesian calibration procedure, which reduced the uncertainty of the parameter coefficients and quantified the prediction uncertainty. The model performance differed among species. For two species (chestnut and black locust), the model showed good performance when tested against independent data not used for calibration. For the four other species (beech, oak, birch, ash), the model performed poorly. Model performance improved substantially for most species when using site-specific parameter coefficients instead of across-site parameter coefficients. This suggested that budburst is influenced by local environment and/or genetic differences among populations. Chestnut, black locust and birch were found to be temperature-driven species, and we therefore analyzed the sensitivity of budburst date to forcing temperature in those three species. Model results showed that budburst advanced with increasing temperature for 1–302days °C 611 , which agreed with the observed trends. In synthesis, our results suggest that the Unichill model can be successfully applied to chestnut and black locust (with both across-site and site-specific calibration) and to birch (with site-specific calibration). For other species, temperature is not the only determinant of budburst and additional influencing factors will need to be included in the model.

DOI PMID

[14]
Gao Q, Chen J, Yan F , et al. 2012. Phenological characteristics of herbaceous plants in Hebei Province and their responses to climate warming.Chinese Journal of Ecology, 31(3): 600-605. (in Chinese)Based on the herbaceous plants phenological observation data of 8 National agro-meteorological observation stations and the ground observation data of 47 meteorological stations in Hebei Province from 1981 to 2006, and by using EOF and REOF methods, this Paper analyzed the phenological characteristics of herbaceous plants in this Province and the responses of the plants to climate warming. In 1981-2006, the herbaceous plants in the Province had an overall advancing trend in their first leafing date, and the trend was most obvious in the eastern coastal plain, followed by in the central-southern plain, and in the northwest mountain region. The first withering date of the herbaceous plants delayed, and the growth season extended. The air temperature in spring had significant effects on the first leafing date, i.e., when the air temperature increased by 1 , the first leafing date was advanced by 4.1 days. There was a significant positive correlation between the growth season trend and the mean annual air temperature, i.e., the greater the increment of mean annual air temperature, the greater the increment of growth season extension. The phenological characteristics of herbaceous plants and their responses to climate change were similar to those of woody plants. This study would be helpful to the evaluation of the relationships between phenology and climate change in Hebei Province.

[15]
Ge Q S, Dai J H, Zheng J Y, 2010. The progress of phenology studies and challenges to modern phenology research in China.Bulletin of Chinese Academy of Sciences, 25(3): 310-316. (in Chinese)The establishment and development process of modern phenology in China are reviewed in this paper,and an overview of the up-to-date research progress in modern phenology is also given.Modern phenology is playing a very important role in global warming research;phenology becomes a new clue in researches of global ecology and terrestrial ecosystem carbon cycle;new technology plays important roles in modern phenology research,especially the adapting of automatic monitoring technology has resulted in great progress in the data acquiring methods;the traditional phenology observation is still of much concern,but research objects are more fine,gradually developing towards microscopic direction.As compared with the rapid developing of international phenology,the phenology researches in China are encountering unprecedented challenges.Thus,Chinese researchers in phenology will shoulder heavy responsibilities in the future,and many fundamental researches remain to be deeply conducted.

[16]
Juknys R, Kanapickas A, Šveikauskaitė I , et al. 2016. Response of deciduous trees spring phenology to recent and projected climate change in Central Lithuania.International Journal of Biometeorology, 60(10): 1589-1602.The analysis of long-term time series of spring phenology for different deciduous trees species has shown that leaf unfolding for all the investigated species is the most sensitive to temperatures in

DOI PMID

[17]
Li J F, 1991. Xinjiang Climate. Beijing: China Meteorological Press, 75-76. (in Chinese)

[18]
Li Q H, Chen Y N, Shen Y J , et al. 2011. Spatial and temporal trends of climate change in Xinjiang, China.Journal of Geographical Sciences, 21(6): 1007-1018.Temperature and precipitation time series datasets from 1961 to 2005 at 65 meteorological stations were used to reveal the spatial and temporal trends of climate change in Xinjiang,China.Annual and seasonal mean air temperature and total precipitation were analyzed using Mann-Kendall (MK) test,inverse distance weighted (IDW) interpolation,and R/S methods.The results indicate that:(1) both temperature and precipitation increased in the past 45 years,but the increase in temperature is more obvious than that of precipitation;(2) for temperature increase,the higher the latitude and the higher the elevation the faster the increase,though the latitude has greater influence on the increase.Northern Xinjiang shows a faster warming than southern Xinjiang,especially in summer; (3) increase of precipitation occurs mainly in winter in northern Xinjiang and in summer in southern Xinjiang.Ili,which has the most precipitation in Xinjiang,shows a weak increase of precipitation; (4) although both temperature and precipitation increased in general,the increase is different inside Xinjiang; (5)Hurst index (H) analysis indicates that climate change will continue the currant trends.

DOI

[19]
Liu J, Zheng Y F, Zhao G Q , et al. 2007. Responses of phenology to climate change in the Zhengzhou area.Acta Ecologica Sinica, 27(4): 1471-1479. (in Chinese)Statistic and abrupt analysis methods are applied to investigate tendencies of climate change during 1956-2003 and phenology of four kinds of trees in 1986-2003,as well as the correlations with mean temperature and sunshine duration,and afterwards,are discussed the tendencies of the responses of phenological events to temperature change,together with their differences in abrupt change in tendencies and linkage.Results show that(1) 1956-2003 temperature in the study area has risen significantly in spring and winter,in contrast to the summer equivalent that has dropped somewhat;sunshine duration has declined most appreciably in summer,next being that in winter,as opposed to the weak rise occurring from February to April during this period;(2) the occurrence of phenological events(Leaf spreading and Flowering) is advanced markedly and so is the Fruit ripening except Melia azedarach,as opposed to a little delay of leaf fall time but the leaf growing stage is prolonged and particularly from the mid 1990s,spring events(except Salix babylonica L.) are about 10 days in advance and leaf greening is kept longer some 15 days;(3) average temperature is a climate factor greatly affecting the phenology but sunshine duration plays a minor role except during the autumn when leaves begin falling.On a phenological basis,it is found that a about 6-day interval in advance that leads to the extension of green leaves by 9.5-18.6 days occurs for every 1 rise in spring.Generally,the sudden change in phenology appears after that in temperature,and the curve after abrupt point shows temperature rise for spring phenological events happening in advance and longer green-leaf stage.As a result,the phenological response to climate change is remarkable and through study to understand the relations between climate and phenology,it is likely to provide some theoretical basis for agricultural practice and the monitoring and assessment of ecological environment.

[20]
Liu P X, Zhang K X, 2011. Climate characteristic of seasonal variation and its influence on annual growth period of Populus euphratica populous euphratica Olive in the Hexi Corridor in recent 55 years. Acta Ecologica Sinica, 31(3): 882-888. (in Chinese)In the last 100 years,especially in the last 50 years,the earth is getting warmer and warmer in the most parts of the world and China,which leads climatic belts moving northward and higher altitude region and the change of the phenological period and growing season.The climatic change of seasons is also observed in some parts of China.Based on the daily average temperature data of the 4 weather stations of Dunhuang,Jinta,Guazhou and Minqin in Hexi Corridor during the period from 1955 to 2009,using the methods of climate trending rate,5 days running mean temperature and Mann-Kendall abrupt change test and slide T detected method,the average beginning dates,length of four seasons and the annual growth period of populus euphratica were analyzed.The results showed that:(1) The beginning dates of the spring,summer and autumn come earlier in the study area in recent 55 years,especially in summer,but winter comes later.It is more obvious at the beginning of the 21st century.The average beginning dates in spring,summer,autumn and winter are Apr.11,Jun.13,Aug.25,and Oct.13 respectively,and their average length were 62d,73d,50d and 180d,respectively.The average length of four seasons change as follow: winter summer spring autumn.(2) In last 55 years,the average beginning dates of spring,summer and autumn were advanced for 2.6d,7d and 0.7d respectively,but winter was delayed for 0.6d,and only that of the summer was changing significantly.The earliest 6.0d advanced for spring was in Guazhou County,14.3d advanced for summer in Minqin County,Minqin County and Dunhuang City ware delayed for autumn and winter in last 55 years.The average length of spring and winter was shortened for 4.9d and 0.7d respectively,those of summer and autumn were prolonged for 6.8d and 0.4d,respectively,and those of autumn and winter vary little.That means the change in spring and summer was more than that in autumn and winter in the study area in recent 55 years.(3) It is a trend that the beginning dates of annual growth of populus euphratica was becoming earlier and its the ending dates was becoming later,and the delaying trend is more clear.The beginning dates and ending dates of annual growth of populus euphratica were Mar.20,and Oct.28 respectively and the average length of annual growth was 224d.The annual growth period of populus euphratica is becoming longer.The average beginning dates of the annual growth of populus euphratica was advanced for 1d,the average ending dates was delayed for 4.2d and the average length was prolonged for 5.2d in last 55years.(4) The abrupt change analysis results showed that there was abrupt change in 1969 and 2001 in the beginning dates of spring,summer in 1998,autumn in 1985 or 1997 and winter in 1985.The beginning dates of populus euphratica annual growth period had several obvious abrupt change,such as in 1961,1973 and 1997.There is an obvious response to the climatic change of the seasons and populus euphratica is an indicator of climate in the study area.

DOI

[21]
Liu Q, H. Fu Y S, Zhu Z Cet al., 2016. Delayed autumn phenology in the Northern Hemisphere is related to change in both climate and spring phenology.Global Change Biology, 22: 3702-3711.Abstract The timing of the end of the vegetation growing season (EOS) plays a key role in terrestrial ecosystem carbon and nutrient cycles. Autumn phenology is, however, still poorly understood, and previous studies generally focused on few species or were very limited in scale. In this study, we applied four methods to extract EOS dates from NDVI records between 1982 and 2011 for the Northern Hemisphere, and determined the temporal correlations between EOS and environmental factors (i.e., temperature, precipitation and insolation), as well as the correlation between spring and autumn phenology, using partial correlation analyses. Overall, we observed a trend toward later EOS in ~70% of the pixels in Northern Hemisphere, with a mean rate of 0.1802±020.3802days02yr611. Warming preseason temperature was positively associated with the rate of EOS in most of our study area, except for arid/semi-arid regions, where the precipitation sum played a dominant positive role. Interestingly, increased preseason insolation sum might also lead to a later date of EOS. In addition to the climatic effects on EOS, we found an influence of spring vegetation green-up dates on EOS, albeit biome dependent. Our study, therefore, suggests that both environmental factors and spring phenology should be included in the modeling of EOS to improve the predictions of autumn phenology as well as our understanding of the global carbon and nutrient balances.

DOI PMID

[22]
Menzel A, Fabian P, 1999. Growing season extended in Europe.Nature, 397(6721): 659.Changes in phenology (seasonal plant and animal activity driven by environmental factors) from year to year may be a sensitive and easily observable indicator of changes in the biosphere. We have analysed data from more than 30 years of observation in Europe, and found that spring events, such as leaf unfolding, have advanced by 6 days, whereas autumn events, such as leaf colouring, have been delayed by 4.8 days. This means that the average annual growing season has lengthened by 10.8 days since the early 1960s. These shifts can be attributed to changes in air temperature.

DOI

[23]
Pei S X, Guo Q S, Xin X B , et al. 2009. Research on plant phenological responses to climate change abroad.World forestry research, 22(6): 31-37. (in Chinese)Plant phenology is sensible to the climate change and easy to be observed.A lot of achievements have been made abroad in the field.The research methods and major achievements of plant phenology observation,observation network construction and the response of plant phenology to climate change were reviewed in this paper,the future trend is discussed.

DOI

[24]
Qin D H, Thomas Set al., 2014. Highlights of the IPCC Working Group I Fifth Assessment Report.Progressus Inquisitiones de Mutatione Climatis, 10(1): 1-6. (in Chinese)Highlights of the IPCC Working Group I(WGI) Fifth Assessment Report(AR5) are the essence refined from the researches in the field of climate change physical science in the past seven years.More than half of the observed increase in global average surface temperature since the 1950s was caused by the human influence.Nightythree percent of the energy resulting from the anthropogenic CO_2 emissions since 1971 is stored in the ocean.Besides,ocean has absorbed about 30%of the emitted anthropogenic CO_2,causing the decrease in pH of ocean surface by 0.1,etc.Based on the CMIP5 models,it is projected that global warming will continue.Relative to 1986 2005,the global mean surface temperature by the end of the 21 st century will increase by 0.3~4.8 ℃.Limiting climate change will require substantial and sustained reductions of greenhouse gas emissions.Controlling the warming caused by anthropogenic CO_2 emissions alone with a probability of 66%to less than 2℃ since the period 1861 1880,will require cumulative CO_2 emissions from all anthropogenic sources to stay between 0 and about 1000 Gt C since that period.

[25]
Roetzer T, Wittenzeller M, Haeckel H , et al. 2000. Phenology in central Europe: Differences and trends of spring phenophases in urban and rural areas.International Journal of Biometeorology, 44(2): 60-66.In order to examine the impacts of both large-scale and small-scale climate changes (urban climate effect) on the development of plants, long-term observations of four spring phenophases from ten central European regions (Hamburg, Berlin, Cologne, Frankfurt, Munich, Prague, Vienna, Zurich, Basle and Chur) were analysed. The objective of this study was to identify and compare the differences in the starting dates of the pre-spring phenophases, the beginning of flowering of the snowdrop ( Galanthus nivalis ) and forsythia ( Forsythia sp.), and of the full-spring phenophases, the beginning of flowering of the sweet cherry ( Prunus avium ) and apple ( Malus domestica ), in urban and rural areas. The results indicate that, despite regional differences, in nearly all cases the species studied flower earlier in urbanised areas than in the corresponding rural areas. The forcing in urban areas was about 4 days for the pre-spring phenophases and about 2 days for the full-spring phenophases. The analysis of trends for the period from 1951 to 1995 showed tendencies towards an earlier flowering in all regions, but only 22% were significant at the 5% level. The trends for the period from 1980 to 1995 were much stronger for all regions and phases: the pre-spring phenophases on average became earlier by 13.9 days/decade in the urban areas and 15.3 days/decade in the rural areas, while the full-spring phenophases were 6.7 days earlier/decade in the urban areas and 9.1 days/decade earlier in the rural areas. Thus rural areas showed a higher trend towards an earlier flowering than did urban areas for the period from 1980 to 1995. However, these trends, especially for the pre-spring phenophases, turned out to be extremely variable.

DOI PMID

[26]
Schwartz M D, Reiter B E, 2000. Changes in North American spring.International Journal of Climatology, 20(8): 929-932.ABSTRACT Onset of the growing season in mid-latitudes is a period of rapid transition, which includes heightened interaction between living organisms and the lower atmosphere. Phenological events (seasonal plant and animal activity driven by environmental factors), such as first leaf appearance or flower bloom in plants, can serve as convenient markers to monitor the progression of this yearly shift, and assess longer-term change resulting from climate variations. We examined spring seasons across North America over the 1900–1997 period using modelled and actual lilac phenological data. Regional differences were detected, as well as an average 5–6 day advance toward earlier springs, over a 35-year period from 1959–1993. Driven by seasonally warmer temperatures, this modification agrees with earlier bird nesting times, and corresponds to a comparable advance of spring plant phenology described in Europe. These results also align with trends towards longer growing seasons, reported by recent carbon dioxide and satellite studies. North American spring warming is strongest regionally in the northwest and northeast portions. Meanwhile, slight autumn cooling is apparent in the central USA. Copyright 08 2000 Royal Meteorological Society

DOI

[27]
Shen Y C, Wang J W, Wu G H et al., 2001. Oaseis of China. Zhengzhou: Henan University Press, 278-284. (in Chinese)

[28]
Shi X H, Zhao Y N, Dai S , et al. 2005. Research on climatic change of Qaidam Basin since 1961.Journal of Desert Research, 25(1): 123-128. (in Chinese)The observed meteorological data of Qaidam basin in Qinghai province in 1961\_2002 are analyzed. The result shows that the changing tendency rate of precipitation and surface evaporation as well as annual and seasonal temperature is positive. Especially in last decade, the air temperature rose, the surface evaporation and precipitation increased, these were favorable for the climate developed toward warm and wet. But due to the limited rainfall (daily average rainfall less than 0\^3 mm) and its approximation with surface evaporation amount, the overall environment state of Qaidam basin is still under relatively inferior stage viewed from the historical change of meteorological factors and seasonal distribution characteristics.

[29]
Sparks T H, Jeffree E P, Jeffree C E, 2000. An examination of the relationship between flowering times and temperature at the national scale using long-term phenological records from the UK.International Journal of Biometeorology, 44(2): 82-87.This paper examines the mean flowering times of 11 plant species in the British Isles over a 58-year period, and the flowering times of a further 13 (and leafing time of an additional 1) for a reduced period of 20 years. Timings were compared to Central England temperatures and all 25 phenological events were significantly related ( P <0.001 in all but 1 case) to temperature. These findings are discussed in relation to other published work. The conclusions drawn from this work are that timings of spring and summer species will get progressively earlier as the climate warms, but that the lower limit for a flowering date is probably best determined by examining species phenology at the southern limit of their distribution.

DOI PMID

[30]
Szabó B, Vincze E, Czúcz B, 2016. Flowering phenological changes in relation to climate change in Hungary.International Journal of Biometeorology, 60(9): 1347-1356.The importance of long-term plant phenological time series is growing in monitoring of climate change impacts worldwide. To detect trends and assess possible influences of climate in Hungary, we studied flowering phenological records for six species (Convallaria majalis, Taraxacum officinale, Syringa vulgaris, Sambucus nigra, Robinia pseudoacacia, Tilia cordata) based on phenological observations from the Hungarian Meteorological Service recorded between 1952 and 2000. Altogether, four from the six examined plant species showed significant advancement in flowering onset with an average rate of 1.9-4.4 days per decade. We found that it was the mean temperature of the 2-3 months immediately preceding the mean flowering date, which most prominently influenced its timing. In addition, several species were affected by the late winter (January-March) values of the North Atlantic Oscillation (NAO) index. We also detected sporadic long-term effects for all species, where climatic variables from earlier months exerted influence with varying sign and little recognizable pattern: the temperature/NAO of the previous autumn (August-December) seems to influence Convallaria, and the temperature/precipitation of the previous spring (February-April) has some effect on Tilia flowering.

DOI PMID

[31]
Wang J A, 2007. Chinese Geography Course. Beijing: Higher Education Press, 33-34. (in Chinese)

[32]
Wang S J, Chen B H, Li H Q, 1995. Populus Euphratica. Beijing: China Environmental Science Press, 16-18. (in Chinese)

[33]
Wei Q J, 1990. Populus Euphratica. Beijing: China Forestry Publishing House, 7-21. (in Chinese)

[34]
Zhang F C, 1995. Effects of global warming on plant phonological evertsevents in China.Acta Geographica Sinica, 50(5): 402-410. (in Chinese)

[35]
Zhao M L, Liu P X, Zhu X J , et al. 2012. Response of Populus euphratica Oliv. Phenology to climate warming in the oasis of lower reaches of Heihe River from 1960 to 2010. Acta Botanica Boreali-Occidentalia Sinica, 32(10): 2108-2115. (in Chinese)

Outlines

/