Research Articles

Spatiotemporal characteristics of urban air quality in China and geographic detection of their determinants

  • ZHANG Xiaoping ,
  • GONG Zezhou
Expand
  • College of Resources and Environment, University of Chinese Academy of Sciences, Beijing 100049, China

Author: Zhang Xiaoping, PhD and Associate Professor, specialized in regional sustainable development. E-mail:

Received date: 2017-05-31

  Accepted date: 2017-11-18

  Online published: 2018-03-30

Supported by

National Natural Science Foundation of China, No.41771133

Science and Technology Service (STS) Program of Chinese Academy of Sciences, No.KFJ-EW-STS-089

Copyright

Journal of Geographical Sciences, All Rights Reserved

Abstract

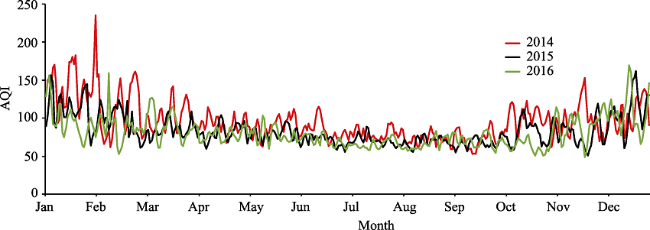
Ambient air pollution brought by the rapid economic development and industrial production in China has exerted a significant influence on socio-economic activities and public health, especially in the densely populated urban areas. Therefore, scientific examination of regional variation of urban air quality and its dominant factors is of great importance to regional environmental management. Based on daily air quality index (AQI) datasets spanning from 2014 to 2016, this study analysed the spatiotemporal characteristics of air quality across different regions throughout China and ascertained the determinants of urban air quality in disparate regions. The main findings are as follows: (1) The annual average value of the urban AQI in China decreased from 2014 to 2016, indicating a desirable trend in air quality at the national scale. (2) The attainment rate of the urban AQI exhibited an apparent spatially stratified heterogeneity, wherein North China retained a high AQI value. The increase of Moran’s I Index reported an apparent spillover effect among adjacent regions. (3) Both at the national and regional scales, the seasonal tendency of air quality in each year is similar, wherein good in summer and relatively poor in winter. (4) Results drawn from the Geographic Detector analysis show that dominant factors influencing AQI vary significantly across urban agglomerations. Topographical and meteorological variations in urban areas may lead to complex spatiotemporal variations in pollutant concentration. Whereas given the same natural conditions, the human-dominated factors, such as industrial structure and urban form, exert significant impacts on urban air quality.The spatial spillover effects and regional heterogeneity of urban air quality illustrated in this study suggest the governments and institutions should set priority to the importance of regional cooperation and collaboration in light of environment regulation and pollution prevention.

Cite this article

ZHANG Xiaoping , GONG Zezhou . Spatiotemporal characteristics of urban air quality in China and geographic detection of their determinants[J]. Journal of Geographical Sciences, 2018 , 28(5) : 563 -578 . DOI: 10.1007/s11442-018-1491-z

1 Introduction

Ambient air pollution resulting from the rapid economic development and industrial production in China has exerted a significant influence on socio-economic activities and public health, especially in the densely populated urban areas. As a substantial number of diseases have been reported to have a close connection to the severity of air pollution, urban air quality has caught the attention from both governments and individuals (Lelieveld et al., 2015; Li et al., 2015; Chen et al., 2016; Liu et al., 2016; Liu et al., 2017; Qin et al., 2017). To address this concern, the central government of China has adopted a series of new policies to strengthen the environmental management (Hu et al., 2015). In 2012, China’s Ministry of Environmental Protection (MEP) issued a new ambient air quality standard (GB 3095-2012), which monitors the concentration of PM2.5, carbon monoxide, sulfur dioxide, nitrogen dioxide, PM10, and ozone in ambient air (MEP, 2012). Considering the diversity of cities throughout the nation, China has employed a three-stage scheme to implement the new ambient air quality standard (Sheng and Tang, 2016). At the end of 2014, 287 prefecture-level cities had implemented this new standard; subsequently, 367 cities began to monitor the six air pollutants and publicize their ambient air quality conditions on the official websites in January of 2015.
Urban air quality in China has attracted much interest from multi-disciplinary perspectives, among which the regional disparity of air pollution is an important one. Most of the studies have explored the spatial spillover effect and regional homogeneity characteristics of air pollution in China from different spatial dimensions, ranging from nationwide to urban agglomerations and specific cities (Sun et al., 2012; Fang et al., 2016; Lin and Wang, 2016; Peng et al., 2016; Gong and Zhang, 2017). To account for the regional variation of air quality, many researchers have examined the influencing factors relevant to urban air quality. In these studies, factors as meteorological elements, land use and land cover change, urbanization, industrialization, energy structure, and transport patterns have been reported to have significant impact on urban air quality (Krummel et al., 1984; Shaw et al., 2010; Tai et al., 2010; Zhang and Fan, 2011;Guan et al., 2014; Lu and Han, 2014; Patton et al., 2014; Li et al., 2015; Lin and Wang, 2016; Qin and Liao, 2016; Sun et al., 2016; Zou et al., 2016; Hu et al., 2017;Yan et al., 2017). The previous studies, in general, have predominantly observed the characteristics of determinants within a single region or among different cities. However, only few of previous researches have explored the driving forces of urban air quality in aspect of regional division and little literature is available so far about the spatially stratified heterogeneity of determinants for AQI in disparate regions throughout China (Zhou et al., 2016). Since regional variation of air quality is complex and its dominant driving factors vary in different regions, comparative analysis at different spatiotemporal scales still requires further research.
To better understand the manner in which air quality and regional determinants interact, we illustrated the spatiotemporal evolution of urban AQI throughout China based on datasets from 2014 to 2016, and explored the influence of relevant factors. Compared with the existing literature, the quantity of sampled cities in our research increased significantly, which helped to engender more accurate and reliable results. Furthermore, the Geographical Detector-based model (Wang, 2010) was used to explore the influence of different geographical factors on urban air quality among disparate regions. Therefore, this research is expected to contribute not only to a further understanding of the current urban air pollution within China but also to a scientific reference for targeted environmental management at regional level.

2 Materials and methods

2.1 Study area and sample cities

Due to China’s three-stage scheme to implement the new ambient air quality standard, the number of cities with daily AQI data varied significantly within the past few years. Considering the data availability, we selected datasets of 161 sample cities in 2014 and 366 sample cities in both 2015 and 2016 to illustrate the change of overall air quality in China. The location of these cities and their regional division are shown in Figure 1. Most of the cities monitored in 2014 were clustered within relatively more prosperous areas, particularly along the eastern coastal areas. While in 2015 and 2016, the cities monitored in terms of the new standard have spanned to a wide geographical range of Chinese mainland, including 4 municipalities, 23 provincial capital cities, 5 autonomous region capital cities, 305 prefecture cities (or administrative regions), and 29 county-level cities. Our research is mainly based on the data of 366 sample cities, with 161 sample cities in 2014 as a comparison.
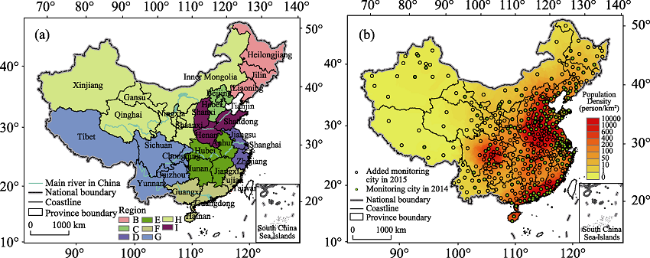
Figure 1 The location of the study area (a) and sample cities (b)
In the Legend of Figure 1a, Region B represents Northeast China, C represents the Beijing-Tianjin-Hebei region, D represents the Yangtze River Delta region, E represents the middle reaches of the Yangtze River, F represents the southeastern coastal areas, G represents Southwest China, H represents Northwest China, and I represents the middle and lower reaches of the Yellow River; see Table 1

2.2 Data sources

Daily averaged air quality values for all of the sample cities were downloaded from the official website of China’s Ministry of Environmental Protection (http://datacenter.mep.gov.cn). The AQI of 161 cities in 2014 and 366 cities in both 2015 and 2016 were collected. The MEP’s AQI is based on Chinese Ambient Air Quality Standards, and is measured as the maximum individual AQI of all pollutants (MEP, 2012). Geographical data of spatial determinants were obtained from the Data Center for Resources and Environmental Sciences, Chinese Academy of Sciences (RESDC) (http://www.resdc.cn). In our Geographical Detector model, 289 sample cities in 2015 were tested due to data availability. Socio-economic data of sample cites were collected from the China Statistics Yearbook of Cities, the China Statistical Yearbook, and relevant provincial or municipal statistical yearbooks. Meteorological data of sample cities were extracted from the interpolation of meteorological data from 824 monitoring stations (http://data.cma.cn).

2.3 Methodology

2.3.1 Spatial interpolation
Spatial interpolation, a widely used data estimation method, is based on the proposition that values of a variable in near-by locations are more similar or related than values that are far apart. On the basis of this proposition, spatial interpolation procedure estimates the values of unknown points in an area by computing the data of nearer known points that influence the unknown points (Jeffrey et al., 2001). Given the feature of geographical similarity in China’s regional physical geography, we interpolate a raster surface from the points containing related data and then extract the values from the raster for every point of each sample city. The process of Kriging interpolation was conducted in this study. Kriging interpolation is an advanced geostatistical procedure that generates an estimated surface from a scattered set of points, and it can effectively involve an investigation of the spatial manner in which targeted factors interact before the final selection of the best estimation method for generating the output surface (Oliver and Webster, 1990).
2.3.2 Spatial clusters
Spatial agglomeration patterns of urban AQI values are acquired by analysing Global Moran’s I statistic and employing the Hot Spot detection tool in ArcGIS. The Global Moran’s I Index measures the spatial autocorrelation based on both feature locations and feature values simultaneously. The resulting I Index reveals the spatial correlation of the urban AQI: when I is greater than zero, it indicates a positive correlation wherein the urban AQI has an agglomeration pattern; when I is less than zero, it indicates a negative correlation wherein the urban AQI has a diffuse or uniform distribution; and when I is equal to zero, it is uncorrelated, and the urban AQI is distributed irregularly. The Moran’s I Index is given as follows (Moran, 1950):
where xi and xj are the urban AQI of the i-th and j-th city, respectively, n is equal to the total number of all sample cities, wij is the spatial weight between the i-th and j-th city, and \(\overline{x}\) is the mean of x.
The Hot Spot Analysis tool in ArcGIS operates by comparing each city within the context of neighbouring cities. To be a statistically significant hot spot, a city must possess a high value and be surrounded by other cities with high values as well. The local sum for a city and its neighbours is compared proportionally to the sum of all cities. When the local sum is substantially different from the expected local sum and that difference is too large to be the result of random chance, the resulting statistically significant Z score indicates that a hot spot can be detected accordingly. The Hot Spot Analysis calculates the Getis-Ord Gi* statistic for each city in a dataset. By definition, Gi* is calculated as follows (Getis and Ord, 1992):
where wi,j is the spatial weight between city i and city j; x, n, and \(\overline{x}\) have the same meanings as in formula (1), and
Because G*i is a Z-score, no further calculation is required. The resultant Z score indicates the location wherein cities with either high or low values will cluster spatially.
2.3.3 Geographic Detector
The fundamental theory of the Geographic Detector method was first proposed by Wang et al. (2010) as a tool of detecting and assessing the risks of diseases. The Geographic Detector method used herein is a spatial statistical method employed to test the relationships between geographical phenomena and their potential driving factors (Ju et al., 2016; Wang et al., 2014; Wang et al., 2016). The factor detector, which is a type of Geographic Detector, can quantitatively estimate the relative importance of a particular factor. In this study, the power determinant is defined as the difference between unity and the ratio of the accumulated dispersion variance of the determinants over each sub-region to that over the entire study region (Wang, 2010):
where D is the influencing factor, U is the affected index, PD,U is the power of determinant, n is the sum of all sample cities, σu2 is the variance of the AQI, m is the classification number of an index, and nD, i is the sample number of D of type i. The model is based on the hypothesis wherein \(\sigma^2_{U_{D,i}}\)≠ 0, with PD,U∈[0,1]. A significantly larger value of PD,U represents a greater power of influence of a factor, and consequently a higher degree of influence on the urban AQI.

3 The spatiotemporal evolution of urban air quality

3.1 The evolution characteristics of AQI in China

As shown in Figure 2, the annual average value of the urban AQI in China demonstrates a distinct decrease after 2014. The highest AQI value in 2014 is 235.16 in January, following which it drops to 162.14 in 2015, and thereafter becomes 169.23 in 2016. It appears that the urban air quality, in general, becomes gradually better from 2014 to 2016. Comparatively, the minimum AQI value exhibits little change, dropping from 52.46 (in 2014) to 50.58 (in 2015), and then to 48.36 (in 2016). These three years have nearly similar variation periods, wherein the air quality is better in summer and autumn, but worse in winter and spring. For the number of attainment days, the summer is better than the other seasons since the AQI values of the majority of days in July, August, and September are lower than 100 (i.e., the attainment standard). However, the higher values (greater than 150) are observed for December, January, and February. Moreover, the range of variation is larger in winter than in summer, and it decreases from 2014 to 2016, which indicates that the air quality in China has become relatively more stable.
Figure 2 The daily AQI average of sample cities in China in 2014, 2015, and 2016
In the NAAQS-2012, any daily AQI not exceeding 100 is considered to represent an attainment day. The number of attainment days or the attainment rate during the monitored days is a key index with which to evaluate the air quality of a city. The attainment rate (AR) is the rate during the monitored days when the AQI does not exceed 100, and is computed as follows:
From the distribution pattern of the attainment rate (Figure 3), it is apparent that urban air quality exhibits a significant agglomeration feature. North China retains the highest values at the nationwide scale, especially in southern Hebei Province, central and western Shandong Province, and central Henan province, where the attainment rates are less than 0.5. Comparatively, cities within the southeastern coastal areas demonstrate significantly different results, for which the attainment rates all exceed 0.7. The contour tool in ArcGIS is used to subdivide the attainment zones (Figure 3). As one of main spatial analysis functions of Arcgis, contour tool creates a line feature class of contours (isolines) from a raster surface. By this tool, regions with similar attainment rate can be separated from other areas. Cities between different layers have distinct values in terms of average attainment rate. It can be observed that cities with lower AR values are clustered in the southern part of North China and the western part of Xinjiang. Accordingly, the AQI of China shows an obvious stratified heterogeneity. In this stratification, the Beijing-Tianjin-Hebei region, the western part of Xinjiang, the west-central part of Shandong, and Henan Province belong to the first layer of attainment, which is characterized by lower attainment values. The middle and lower reaches of the Yangtze River, the middle reaches of the Yellow River, the southern Inner Mongolia, and the areas including north of Hebei, Jilin, and Liaoning belong to the second layer, wherein the attainment rate ranges from 0.3 to 0.7. The other regions belong to the third layer, which demonstrates a relatively good air quality.
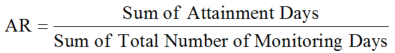
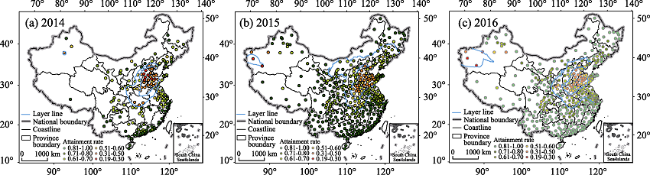
Figure 3 The spatial distribution of the attainment rate for the annually averaged AQI in China
Generally, the attainment rate of South China is better than that of North China. The southeastern coastal area and Southwest China retain a better air quality, while the attainment rate of North China exhibits change in some cities from 2014 to 2016. Apparently, the number of attainment cities and attainment days is increasing, which represents a desirable trend.

3.2 Spatial cluster variation

Moran’s I Index was calculated to test the tendency for spatial clustering (Figure 4). The global Moran’ s I during the period spanning from 2014 to 2016 is positive, and the spatial pattern of urban AQI displays a positive spatial correlation. The Moran’s I in 2014, 2015, and 2016, is 0.695, 0.698, and 0.710, respectively, which demonstrates a statistically significant increase of spatial clustering trend. Employing a Hot Spot Analysis of the variation in spatial agglomeration of the annual AQI (Figure 5), we discovered the hot spots clustered within the Beijing-Tianjin-Hebei region, the middle and lower reaches of the Yangtze River, and the North China Plain. In addition, some cities in Xinjiang demonstrate an agglomeration of hot spots because of its sandstorm climate. Cold spots are clustered in southern China, including the southeastern coastal areas, Guangdong Province, the Yunnan-Guizhou-Sichuan region, and Heilongjiang Province (which is especially apparent in 2016) (Figure 5c). This suggests an interaction of air quality among cities in adjacent regions. However, the coastal cities along the Yangtze River do not present a significant autocorrelation.
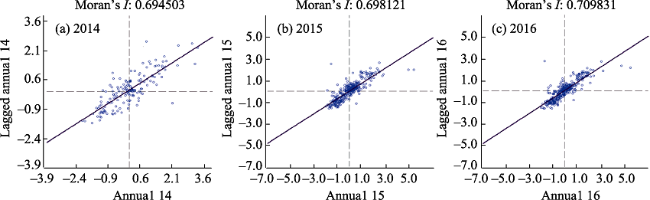
Figure 4 Global autocorrelation of AQI for China in 2014, 2015, and 2016
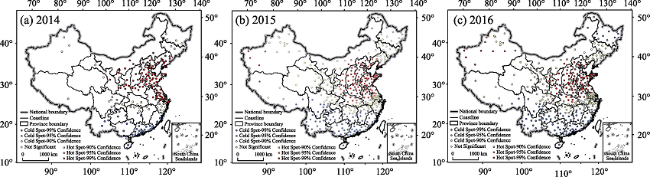
Figure 5 Spatial agglomeration variation of annual AQI in China

3.3 Comparison among different regions

To explore the underlying differences and factors of the AQI, we divided the sample cities into eight sub-regions (Figure 1 and Table 1). The principle of our division is to maintain the homogeneity within the same region and the heterogeneity among different regions, in which both the physical factors and socio-economic factors are taken into full consideration (Liu et al., 2016; Lin et al., 2016). Specifically speaking, the sub-regions are illustrated as follows. Northeast China is composed of Heilongjiang, Jilin, and Liaoning provinces (Region B). Beijing, Tianjin, and Hebei Province belong to the Beijing-Tianjin-Hebei region (C), which has implemented an integration strategy of environmental management for several years. Shanghai, Jiangsu, and Zhejiang provinces comprise the Yangtze River Delta region (D). Hubei, Hunan, Anhui, and Jiangxi provinces belong to the middle reaches of the Yangtze River (E), while Shandong, Shanxi, and Henan provinces belong to the middle and lower reaches of the Yellow River (I). Considering geographical proximity and climatic similarity, Guangdong, Guangxi, Fujian, and Hainan provinces are classified into the southeastern coastal area (F), which has a relatively better air quality. Sichuan, Guizhou, Yunnan, and Chongqing as well as Tibet belong to Southwest China (G). Finally, Northwest China (H) consists of three provinces as Gansu, Shaanxi, Qinghai, and three autonomous regions as Ningxia, Xinjiang as well as Inner Mongolia. The number of cities in each region is shown in Table 1.
Table 1 Description of regional divisions in China
Region Province Number of city (2014) Number of city (2015 and 2016)
A Nationwide 161 366
B Heilongjiang, Jilin, Liaoning 16 37
C Beijing, Tianjin, Hebei 13 13
D Shanghai, Jiangsu, Zhejiang 25 39
E Hubei, Hunan, Anhui, Jiangxi 14 54
F Guangdong, Guangxi, Fujian, Hainan 30 46
G Sichuan, Guizhou, Yunnan, Chongqing, Tibet 15 54
H Gansu, Shaanxi, Qinghai, Ningxia, Xinjiang, Inner Mongolia 19 65
I Shandong, Shanxi, Henan 29 58
As shown in Figure 6, a significant difference of the urban AQI is observed among regions. The AQI value decreased at the national scale from 2014 to 2015. The annual average value of the urban AQI was 95.17 in 2014, which decreased further to 82.88 in 2015 and 79.94 in 2016, respectively. Compared with the other regions, the Beijing-Tianjin-Hebei region (C) and the middle and lower reaches of the Yellow River (I) had a higher AQI, while the southeastern coastal areas (F) retained a lower AQI during the three years. The middle reaches of the Yangtze River (E) exhibited the greatest difference between the winter and summer seasons. The Yangtze River Delta region (D) and Southwest China (G) had a similar AQI trend, which remained stable for the whole year except in January and December. The air quality of most cities in China had been improved apparently thereafter 2014. In general, the trend of air quality in each year was similar, both at the national and regional scale, which was good in summer and relatively poor in winter.

4 Detection of the determinants of AQI in different regions

4.1 Determinants diagram

Based on the theoretical researches and literature review, we divided factors impacting urban air quality into two main categories: nature-dominated factors and human-dominated factors. Among them, the human-dominated factors are further divided into two sub-groups as urbanization-related factors and industrialization-related factors. Accordingly, we focused on three categories of variables: urbanization, industrial pollution, and natural conditions. A total of 12 indices were selected to provide a comprehensive assessment of the determinants affecting the urban AQI in China, as shown in Figure 7. Urbanization primarily refers to the transformation process experienced by a rural area toward an urban life style, which is represented by an increase of urban population, the expansion of urban built-up areas, and the creation of a landscape and corresponding urban environment with social and life style changes (Morikawa, 1988; Gu et al., 2012). Therefore, when measuring urbanization variables, we selected the annual average population (X1), the ratio of urban built-up areas to that of the city (X2), per capita gross domestic product (X3), and green land area (X5). Considering industrial production contributes remarkably to air pollution (Place and Mitloehner, 2010), variables consisting of the number of industrial enterprises (X4), industrial dust discharge (X6), and industrial SO2 emission (X7) are selected to describe industrial pollution. Meanwhile, the natural environment is a fundamental necessity for a region’s air quality. Natural condition variables include the slope (X8), annual average relative humidity (X9), annual precipitation (X10), annual average wind speed (X11), and the annual average temperature (X12).
Due to data availability, 289 sample cities in 2015 were chosen to investigate the determinants of the urban AQI. All of the above mentioned indices (X1 through X12) were classified into five grades (Table 2) based on a natural break classification and the number of same categories within the sample cities. Figure 8 illustrates the spatial distribution and differentiation of the 12 detected factors.
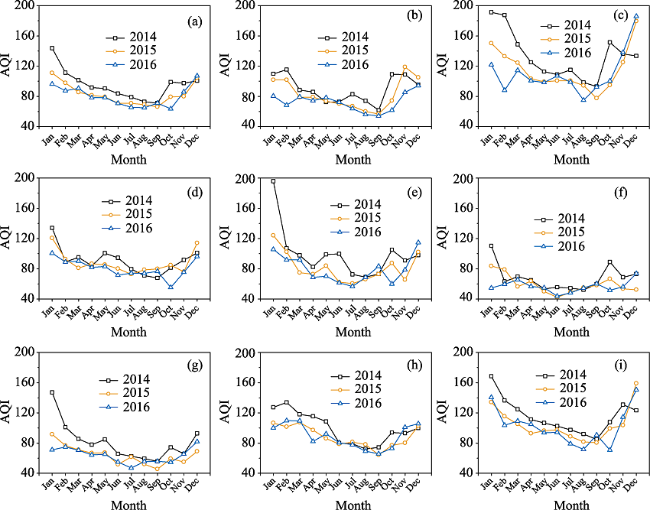
Figure 6 Monthly variations of AQI among different regions of China for 2014, 2015, and 2016
Figure 7 Determinants diagram of urban air quality
Table 2 Impact factor partitions for the identified geographical factors
Indices First-grade Second-grade Third-grade Fourth-grade Fifth-grade
X1 (104 per) <200 200-400 400-700 700-1000 >1000
X2 (%) <4 4-10 10-18 18-33 >33
X3 (104 yuan) <3 3-5 5-7.5 7.5-12 >12
X4 (102) <7 7-15 15-25 25-45 >45
X5 (102 hm2) <15 15-25 25-40 40-80 >80
X6 (103 t) <19 19-23 23-42 42-130 >130
X7 (104 t) <3 3-6 6-10 10-16 >16
X8 (°) <0.1 0.1-0.5 0.5-1.5 1.5-3.5 >3.5
X9 (%) <50 50-60 60-70 70-75 >75
X10 (102 mm) <4.5 4.5-7.5 7.5-10 10-15 >15
X11 (m/s) <1.4 1.4-1.8 1.8-2.2 2.2-2.6 >2.6
X12 (℃) <7 7-11 11-15 15-19 >19

4.2 Results and analysis

Using the Geographic Detector model, we measured the impact of the 12 factors related to the urban AQI in China. The key findings are as follows:
(1) The significance test of different factors affecting the urban AQI in China (Table 3) reveals that meteorological factors have a more significant influence on AQI compared with other factors. It is also apparent that the annual average temperature has a greater influence relative to other factors except the annual precipitation. In addition, the industrial SO2 emissions indicator is an important factor exerting a greater influence than other socio-economic factors at the national scale.
At the national scale, meteorological conditions and industrial pollution exert obvious impacts on the urban AQI, but the influence of urbanization is limited, which is illustrated from details about region A in Tables 4 and 5. The top five factors that influence the urban AQI are the annual average temperature (0.3436), annual precipitation (0.2943), annual average relative humidity (0.2168), industrial SO2 emission (0.1889), and industrial dust discharge (0.1599). For most regions, the P values for annual precipitation remained high, especially for the Yangtze River Delta region (D) and Southwest China (G) where the P values for annual precipitation were 0.6956 and 0.4749, respectively, which indicates that annual precipitation plays a key role in maintaining good air quality.
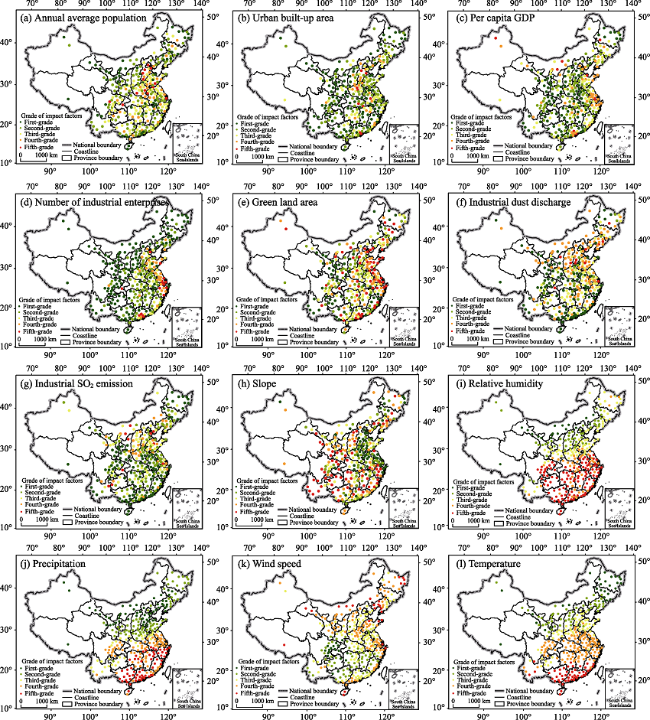
Figure 8 Spatial distribution of the 12 detected factors
Table 3 Significance test of different factors affecting the urban AQI in China (Region A)
X1 X2 X3 X4 X5 X6 X7 X8 X9 X10 X11 X12
X1
X2 N
X3 N N
X4 N N N
X5 N N N N
X6 N N N N N
X7 N N Y N N N
X8 N N N N N N N
X9 N N Y N N N N N
X10 Y Y Y Y Y Y N Y N
X11 N N N N N N N N N N
X12 Y Y Y Y Y Y Y Y Y N Y
Table 4 Geographically determined weights of the factors affecting the urban AQI in the study area
Factors P value
A B C D E F G H I
X1 0.1228 0.2636 0.4115 0.2606 0.1194 0.1440 0.2166 0.0907 0.1765
X2 0.1312 0.3477 0.0736 0.1213 0.1568 0.1759 0.1716 0.0448 0.1071
X3 0.0298 0.5177 0.4911 0.1972 0.0688 0.0830 0.1973 0.1315 0.1514
X4 0.1272 0.2982 0.8172 0.5873 0.1350 0.1104 0.1298 0.0447 0.4137
X5 0.1307 0.2824 0.3109 0.2576 0.0771 0.0421 0.5025 0.1660 0.2235
X6 0.1599 0.3471 0.3368 0.4776 0.0162 0.0134 0.0924 0.1616 0.0491
X7 0.1889 0.4813 0.1442 0.3482 0.0182 0.2016 0.0981 0.0888 0.0450
X8 0.1315 0.0705 0.2278 0.1232 0.1490 0.0442 0.4818 0.0145 0.2327
X9 0.2168 0.2764 0.2746 0.2559 0.1084 0.0067 0.3129 0.0231 0.1483
X10 0.2943 0.3289 0.0397 0.6956 0.1880 0.0592 0.4749 0.0575 0.0148
X11 0.1016 0.0562 0.2641 0.2289 0.1782 0.3815 0.4509 0.2087 0.2351
X12 0.3436 0.2479 0.7128 0.0077 0.1507 0.0450 0.3834 0.0365 0.1590
Table 5 The top three factors affecting the urban AQI for individual regions
Region Factors P value Factors P value Factors P value
A X12 0.3436 X10 0.2943 X9 0.2168
B X3 0.5177 X7 0.4813 X2 0.3477
C X4 0.8172 X12 0.7128 X3 0.4911
D X10 0.6956 X4 0.5873 X6 0.4776
E X10 0.1880 X11 0.1782 X2 0.1568
F X11 0.3815 X7 0.2016 X2 0.1759
G X5 0.5025 X8 0.4818 X10 0.4749
H X11 0.2087 X5 0.1660 X6 0.1616
I X4 0.4137 X11 0.2351 X8 0.2327
(2) Disparate regions are characterized by different primary determinants (Tables 4 and 5). The dominant factors for the urban AQI in Northeast China (B) are the per capita GDP (0.5177), industrial SO2 emission (0.4813), and the ratio of urban built-up areas (0.3477). This reveals that industrial production and the economic development of Northeast China have a fundamental influence on its air quality. Meanwhile, the influences of precipitation (0.3289) and temperature (0.2479) are lower than those of industrial factors.
The dominant factors in the Beijing-Tianjin-Hebei region (C) are the number of industrial enterprises (0.8172), annual average temperature (0.7128), per capita GDP (0.4911), and annual average population (0.4115). The number of industrial enterprises represents the extent of air pollution, and has a significant correlation with the AQI. Temperature influences air flow and diffusion, which have a significant impact on air quality. The GDP reflects the industrial development and urbanization of a region, and therefore has a certain relationship with air quality. Meanwhile, population is a key factor for the Beijing-Tianjin-Hebei region, as the cluster of population in this region is directly correlated with pollutant emissions from vehicles and households, etc. This result supports the hypothesis that population is a key influencing factor on the air quality in densely populated areas, same as other researchers have argued that anthropogenic emissions impact the regional climate and air quality (Chen et al., 2017; Li et al., 2017).
The dominating factors in the Yangtze River Delta region (D) are annual precipitation (0.6956), the number of industrial enterprises (0.5873), and industrial dust discharge (0.4776). Since the Yangtze River Delta is adjacent to the sea, precipitation has a substantial influence on the urban AQI. The frequent rainfall in the region significantly improves the urban air quality, and industrial production has a greater influence than other factors since it represents a direct source of air pollution.
The foremost factors in the middle reaches of the Yangtze River (E) are annual precipitation (0.1880), annual average wind speed (0.1782), and the ratio of urban built-up areas (0.1568). These factors reflect that precipitation plays an important role in improving the air quality, while wind speed affects the diffusion of air pollution. Compared with other regions, these three factors have a lower influence on air quality in this region.
The principal factors for the southeastern coastal areas (F) are the annual average wind speed (0.3815), the industrial SO2 emissions (0.2016), the ratio of urban built-up areas (0.1759), and the annual average population (0.1440). The significance of wind speed factor demonstrates that coastal weather and the corresponding air circulation greatly affect air quality in southeastern China, the reason for which is that, under tropical and subtropical monsoon climates, easterly and southeasterly winds are prevalent during spring (March to May) and southwesterly winds are prevalent during midsummer (June to August). Since these winds blow clean air from the sea to the coast, it is helpful to improve the air quality (Sheng and Tang, 2016). Moreover, industrial pollution has a direct influence on air quality, while the flow of pollution is a significant factor as well. Finally, since many people are clustered in the southeastern coastal areas, especially in the Pearl River Delta, the size of the population also has a significant influence on the air quality within this region.
The prevailing factors in Southwest China (G) are the green land area (0.5025), slope (0.4818), and annual precipitation (0.4749). This suggests that topography has a significant influence on the AQI in Southwest China, especially in the Sichuan Basin, since the slope has a notable influence on air diffusion and circulation. Moreover, the area of green land and forest coverage within an urban territory has a positive influence on the improvement of urban air quality.
The dominating factors in Northwest China (H) are the annual average wind speed (0.2087), area of green land (0.1660), industrial dust discharge (0.1616), and the per capita GDP (0.1315). Compared with other regions, economic development and industrial production tend to play a more important role in air quality in Northwest China.
The dominant factors in the middle and lower reaches of the Yellow River (I) are the number of industrial enterprises (0.4137), annual average wind speed (0.2351), and slope (0.2327). Industrial emission is the key factor for this region, and it is thus necessary to implement regional joint control to improve air quality. Wind speeds and slope also affect the air circulation in this region.
(3) There are obvious differences among the 12 examined factors. The urbanization factors have a greater influence on air quality in metropolis areas, especially the factor X1 (annual average population) whose P value is higher in the Beijing-Tianjin-Hebei and Yangtze River Delta regions. The factor X3 (per capita GDP) has greater influence in Northeast China, the Beijing-Tianjin-Hebei and Yangtze River Delta regions. The factor X5 (green land area) exerts a more powerful influence in Southwest China, the Beijing-Tianjin-Hebei region as well as Northeast China. Meanwhile, the number of industrial enterprises (X4) has the greatest influence (0.8172) relative to other factors in the Beijing-Tianjin-Hebei region, by contrast with its weak influence on AQI in Northwest China (0.0447). Generally, the industrial factors possess greater significance in regions which are characterized by a more developed industry, such as the Beijing-Tianjin-Hebei and Yangtze River Delta regions. Meteorological conditions influence nearly all of the regions, while the slope only matters in regions with wide-range topographic variations. Annual precipitation and annual average relative humidity have more influence in the Yangtze River Delta region and South China, while the annual average wind speed matters more substantially in South China. The annual average temperature has the greatest influence on AQI in the Beijing-Tianjin-Hebei region (0.7128) compared with the other regions.

5 Conclusions and implications

5.1 Conclusions

Based on a dataset spanning from 2014 to 2016, our study analysed the spatiotemporal patterns of the urban AQI in China in terms of attainment rates, seasonal differentiation, and regional divisions. Furthermore, we focused on exploring the geographical determinants affecting AQI among different regions by combining the GIS spatial analysis and the Geographic Detector method. The following main conclusions can be drawn from the study:
(1) The annual average value of the urban AQI in China decreased from 2014 to 2016, representing a desirable trend of air quality. However, the worst air quality days still appeared during winter, while the air quality in summer was relatively good and stable.
(2) The attainment rate of the urban AQI exhibits an apparently spatial stratified heterogeneity. The south-central region of North China and the western part of Xinjiang retained the worst air quality at the national scale. Cities with medium grade of air quality are mainly located in the middle and lower reaches of the Yangtze River, the middle reaches of the Yellow River, southern Inner Mongolia, and the northern part of Hebei, Jilin, and Liaoning provinces. Other regions demonstrated a good attainment rate of the average annual air quality.
(3) The increase of Moran’s I Index of the urban AQI from 2014 to 2016 demonstrates a statistically significant increase of spatial clustering trend, which indicates that urban air quality exhibits an apparent agglomeration feature. Hot spots were reported in the Beijing-Tianjin-Hebei region, the middle and lower reaches of the Yangtze River, and North China. Meanwhile, a major cold spot was clustered in Southern China. However, the coastal cities along the Yangtze River did not possess any significant autocorrelation.
(4) Both at the national and regional scale, the tendency of air quality in each year is similar, i.e., good values in summer and relatively poor values in winter. Compared with the other regions, the Beijing-Tianjin-Hebei region and the middle and lower reaches of the Yellow River maintained higher AQI values over each of the three years. Meanwhile, the southeastern coastal areas retained a lower AQI for the three years, and the middle reaches of the Yangtze River exhibited the greatest differences between winter and summer.
(5) Disparate regions have different determinants for the urban AQI. Meteorological conditions and industrial pollution exert obvious impacts on the urban AQI, but the influence of urbanization is limited from the national scale. Generally, industrial factors have greater influence in regions which possess higher levels of industrialization. Meteorological conditions play an important role toward improving air quality, while the slope affects air diffusion in regions with high topographic variations.

5.2 Implications

The findings in our paper have significant policy implications. Air quality management plan has been employed by Chinese government as the most important one of the series of policies in managing urban air quality. The successful implementation of air quality policies relies on multi-factors existing at different scales, e.g. national, municipal and local. Undeniably, topographical and meteorological variations in urban areas, which are generally beyond our control, may lead to complex spatiotemporal variation in pollutant concentration. Whereas given the same natural conditions, the human-dominated factors, such as industrial structure and urban form which exert significant impacts on urban air quality are within the control of human activities. Thus, optimizing industrialization and urbanization initiatives and strengthening their environmental implications should be the key points to improve urban air quality. Furthermore, the regional heterogeneity of urban air quality urges Chinese municipal governments strengthen regional cooperation and deepen bilateral collaboration in light of air regulation and pollution prevention.
Due to data limitations, the long-term change of urban air quality has not been deeply discussed in this study. Meanwhile, the complexity of urban air quality and its interaction mechanism with influencing factors still remain to be studied in the future. We need to accumulate more data and to explore new avenues to research the spatiotemporal variations of urban air quality and its driving forces.

The authors have declared that no competing interests exist.

[1]
Chen J, Li C, Ristovski Zet al., 2017. A review of biomass burning: Emissions and impacts on air quality, health and climate in China.Science of The Total Environment, 579: 1000-1034.Biomass burning (BB) is a significant air pollution source, with global, regional and local impacts on air quality, public health and climate. Worldwide an extensive range of studies has been conducted on almost all the aspects of BB, including its specific types, on quantification of emissions and on assessing its various impacts. China is one of the countries where the significance of BB has been recognized, and a lot of research efforts devoted to investigate it, however, so far no systematic reviews were conducted to synthesize the information which has been emerging. Therefore the aim of this work was to comprehensively review most of the studies published on this topic in China, including literature concerning field measurements, laboratory studies and the impacts of BB indoors and outdoors in China. In addition, this review provides insights into the role of wildfire and anthropogenic BB on air quality and health globally. Further, we attempted to provide a basis for formulation of policies and regulations by policy makers in China.

DOI PMID

[2]
Chen X, Zhang LW, Huang J J , et al. 2016. Long-term exposure to urban air pollution and lung cancer mortality: A 12-year cohort study in Northern China.Science of The Total Environment, 571: 855-861.Cohort evidence that links long-term exposures to air pollution and mortality comes largely from the United States and European countries. We investigated the relationship between long-term exposures to particulate matter <021002μm in diameter (PM 10 ), nitrogen dioxide (NO 2 ), and sulfur dioxide (SO 2 ) and mortality of lung cancer in Northern China. A cohort of 39,054 participants were followed during 1998–2009. Annual average concentrations for PM 10 , NO 2, and SO 2 were determined based on data collected from central monitoring stations. Lung cancer deaths (n02=02140) were obtained from death certificates, and hazard ratios (HRs) were estimated using Cox proportional hazards models, adjusting for age, gender, BMI, education, marital status, smoking status, passive smoking, occupation, alcohol consumption, etc. Each 1002mg/m 3 increase in PM 10 concentrations was associated with a 3.4%–6.0% increase in lung cancer mortality in the time-varying exposure model and a 4.0%–13.6% increase in the baseline exposure model. In multi-pollutant models, the magnitude of associations was attenuated, most strongly for PM 10 . The association was different in men and women, also varying across age categories and different smoking status. Substantial differences exist in the risk estimates for participants based on assignment method for air pollution exposure.

DOI PMID

[3]
Fang C L, Wang Z B, Xu G, 2016. Spatial-temporal characteristics of PM2.5 in China: A city-level perspective analysis.Journal of Geographical Sciences, 26(11): 1519-1532.薄雾污染在在中国的人们的日常生活成为了一个严重环境问题。下午 2.5 做重要贡献到差的空气质量。瓷器下午 2.5 集中的时间空间的特征应该被调查。这份报纸,基于从 945 的观察数据,在 2014 的最新定位的监视地点和工业工作人口数据从国际标准工业分类(ISIC ) 获得了,在不同工业之中在中国和关联揭示下午 2.5 集中的时间空间的变化。我们与空间自相关模型一起在中国的城市里测试了下午 2.5 集中的空间自相关。在 2014 在中国为 190 个城市检验下午 2.5 集中和 23 个典型变量的相互关系的一个关联系数,从哪个最重要的被选择,然后一个回归模型被造进一步揭示影响下午 2.5 集中的社会、经济的因素。结果:(1 ) 胡焕勇线和长江是 E-W 划分并且 S-N 在中国的高、低的价值之间划分。(2 ) 下午 2.5 集中表演伟人季节的变化,它在秋天和冬季高但是在春天和夏天低。每月的一般水准证明一个 U 字形的模式,和每日的一般水准介绍一个周期、塑造推动的变化。(3 ) 下午 2.5 集中有空间凝块的一个不同特征。北方中国平原是凝块的占优势的区域,并且东南的沿海的区域有稳定的好空气质量。

DOI

[4]
Getis A, Ord J K, 1992. The analysis of spatial association by use of distance statistics.Geographical Analysis, 24(3): 189-206.Introduced in this paper is a family of statistics, G, that can be used as a measure of spatial association in a number of circumstances. The basic statistic is derived, its properties are identified, and its advantages explained. Several of the G statistics make it possible to evaluate the spatial association of a variable within a specified distance of a single point. A comparison is made between a general G statistic and Moran's I for similar hypothetical and empirical conditions. The empirical work includes studies of sudden infant death syndrome by county in North Carolina and dwelling unit prices in metropolitan San Diego by zip-code districts. Results indicate that G statistics should be used in conjunction with I in order to identify characteristics of patterns not revealed by the I statistic alone and, specifically, the Gi and Gi* statistics enable us to detect local 090008pockets090009 of dependence that may not show up when using global statistics.

DOI

[5]
Gong Z Z, Zhang X P, 2017. Assessment of urban air pollution and spatial spillover effects in China: Cases of 113 key environmental protection cities.Journal of Resources and Ecology, 8(6): 584-594.With rapid urbanization and energy consumption, environmental pollution and degradation have become increasingly serious problems in China. At the beginning of 2013, China implemented new ambient air quality standards(GB 3095-2012) in which the concentration of six pollutants including PM_(2.5), ozone, carbon monoxide, PM_(10), sulfur dioxide and nitrogen dioxide were monitored. This study gathered annual air pollutant concentration data for the six pollutants in 113 key environmental protection cites throughout China in 2014 and 2015 to explain spatial patterns of urban air pollution. Based on the Kernel density estimation method, spatial hotspots of air pollution were illustrated through which spatial cluster of each pollutants could be plotted. By employing an entropy evaluation system, urban air quality was assessed in terms of the six atmospheric pollutants. We conclude that, in general, CO and SO_2 were two important pollutants in most Chinese cities, but this varied greatly among cities. The assessment results indicate that cities with the worst air quality were mainly located in northern and central provinces, dominantly in the Beijing-Tianjin-Hebei metropolitan area. Regression modeling showed that a combination of meteorological factors and human-related determinants, to say specifically, industrialization and urbanization factors, greatly influenced urban air quality variation in China. Results from spatial lag regression modeling confirmed that air pollution existed obvious spatial spillover effects among key cities. The spatial interdependence effects of urban air quality means that Chinese municipal governments should strengthen regional cooperation and deepen bilateral collaboration in terms of air regulation and pollution prevention.

DOI

[6]
Gu C, Wu L, Lan C, 2012. Progress in research on Chinese urbanization.Frontiers of Architectural Research, 1(2): 101-149.

DOI

[7]
Guan D, Su X, Zhang Qet al., 2014. The socioeconomic drivers of China’s primary PM2.5 emissions.Environmental Research Letters, 9(2): 024010.Primary PMemissions contributed significantly to poor air quality in China. We present an interdisciplinary study to measure the magnitudes of socioeconomic factors in driving primary PMemission changes in China between 1997-2010, by using a regional emission inventory as input into an environmentally extended input-output framework and applying structural decomposition analysis. Our results show that China significant efficiency gains fully offset emissions growth triggered by economic growth and other drivers. Capital formation is the largest final demand category in contributing annual PMemissions, but the associated emission level is steadily declining. Exports is the only final demand category that drives emission growth between 1997-2010. The production of exports led to emissions of 638 thousand tonnes of PM, half of the EU27 annual total, and six times that of Germany. Embodied emissions in Chinese exports are largely driven by consumption in OECD countries.

DOI

[8]
Hu J, Huang L, Chen Met al., 2017. Impacts of power generation on air quality in China (Part II): Future scenarios.Resources Conservation & Recycling, 121: 115-127.Power generation is an important source of air pollution in China since it is mostly from coal-fired power plants. Future power generation plans are needed to meet both increasing power needs and air quality improvement. In this study, five future power development scenarios in 2030 were considered. The REF scenario is the base case in which the growth was assumed to follow the existing projection (business as usual). The CAP scenario represents power sector in the trajectory to achieve 80% reduction by 2050 as proposed by IPCC, the LOW scenario reflects low cost of renewable to foster wind and solar development, the PEAK scenario allows China to peak its carbon emission by 2030, while the WEST scenario assumes that the coal power bases build all planned capacity by 2030 and no coal power in Beijing, Tianjin and Shanghai by 2030. Then, impacts of the scenarios on air quality were simulated with the Community Multiscale Air Quality (CMAQ) model in January and August 2030 with unchanged emissions from other sectors and the same meteorology in 2013. The results indicate that air quality gets worse in the REF scenario in both months compared to 2013. The CAP and WEST scenarios generally have larger impacts on pollutant concentrations than the LOW and PEAK scenarios. The four scenarios improve PM 2.5 total mass and SO 4 261 in North China, with maximum decreases of over 10002μg02m 613 in January and over 1002μg02m 613 in August in the Hohhot area. However, PM 2.5 total mass and SO 4 261 pollution are worsened in Shandong for CAP and WEST scenarios and in Chongqing for LOW and PEAK scenarios. NO 3 61 and O 3 get worsened in the four scenarios in large areas of the North China Plain (NCP), East and South China due to more NH 3 available for NO 3 61 formation associated with reduction in SO 4 261 and aerosol radiative effects on UV radiation for O 3 formation. Power development plans greatly affect air quality in Beijing, with decrease in PM 2.5 and PM 10 , but increase in O 3 . Reducing NO x and SO 2 combined with NH 3 should be considered to reduce contribution of power generation to future air pollution in China.

DOI

[9]
Hu J, Ying Q, Wang Yet al., 2015. Characterizing multi-pollutant air pollution in China: Comparison of three air quality indices.Environment International, 84: 17-25.61Three air quality indices were compared in six megacities in China.61AAQI and HAQI consider the combined effects of various pollutants.61AQI under-reports the severity of health risk of multi-pollutant pollution.61The public should take more stringent actions than those suggested based on AQI.61HAQI is sensitive to the choice of threshold values and total risk calculation.

DOI PMID

[10]
Jeffrey S J, Carter J O, Moodie K Bet al., 2001. Using spatial interpolation to construct a comprehensive archive of Australian climate data.Environmental Modelling & Software, 16(4): 309-330.A comprehensive archive of Australian rainfall and climate data has been constructed from ground-based observational data. Continuous, daily time step records have been constructed using spatial interpolation algorithms to estimate missing data. Datasets have been constructed for daily rainfall, maximum and minimum temperatures, evaporation, solar radiation and vapour pressure. Datasets are available for approximately 4600 locations across Australia, commencing in 1890 for rainfall and 1957 for climate variables. The datasets can be accessed on the Internet at http://www.dnr.qld.gov.au/silo. Interpolated surfaces have been computed on a regular 0.05° grid extending from latitude 10°S to 44°S and longitude 112°E to 154°E. A thin plate smoothing spline was used to interpolate daily climate variables, and ordinary kriging was used to interpolate daily and monthly rainfall. Independent cross validation has been used to analyse the temporal and spatial error of the interpolated data. An Internet based facility has been developed which allows database clients to interrogate the gridded surfaces at any desired location.

DOI

[11]
Ju H, Zhang Z, Zuo Let al., 2016. Driving forces and their interactions of built-up land expansion based on the geographical detector: A case study of Beijing, China.International Journal of Geographical Information Science, 30(11): 1-20.Scientific interpretation of the driving forces of built-up land expansion is essential to urban planning and policy-making. In general, built-up land expansion results from the interactions of different factors, and thus, understanding the combined impacts of built-up land expansion is beneficial. However, previous studies have primarily been concerned with the separate effect of each driver, rather than the interactions between the drivers. Using the built-up land expansion in Beijing from 2000 to 2010 as a study case, this research aims to fill this gap. A spatial statistical method, named the geographical detector, was used to investigate the effects of physical and socioeconomic factors. The effects of policy factors were also explored using physical and socioeconomic factors as proxies. The results showed that the modifiable areal unit problem existed in the geographical detector, and 4000 m might be the optimal scale for the classification performed in this study. At this scale, the interactions between most factors enhanced each other, which indicated that the interactions had greater effects on the built-up land expansion than any single factor. In addition, two pairs of nonlinear enhancement, the greatest enhancement type, were found between the distance to rivers and two socioeconomic factors: the total investment in fixed assets and GDP. Moreover, it was found that the urban plans, environmental protection policies and major events had a great impact on built-up land expansion. The findings of this study verify that the geographical detector is applicable in analysing the driving forces of built-up land expansion. This study also offers a new perspective in researching the interactions between different drivers.

DOI

[12]
Krummel J R, Gilmore C C, O'Neill R V, 1984. Locating vegetation at-risk to air pollution: An exploration of a regional approach.Journal of Environmental Management, 18(3): 279-290.Oak Ridge national lab., Oak Ridge TN37830, ETATS-UNISJEVMAW 1984, vol. 18, n3, pp. 279-290 (1 p.)AnglaisElsevier, Kidlington, ROYAUME-UNI (1973) (Revue); ; ; ; ; ; ; ; ; ; ; ; ; ; ; ; ; ; INIST-CNRS, Cote INIST : 16218

DOI

[13]
Lelieveld J, Evans J S, Fnais Met al., 2015. The contribution of outdoor air pollution sources to premature mortality on a global scale.Nature, 525(7569): 367-371.Abstract Assessment of the global burden of disease is based on epidemiological cohort studies that connect premature mortality to a wide range of causes, including the long-term health impacts of ozone and fine particulate matter with a diameter smaller than 2.5 micrometres (PM2.5). It has proved difficult to quantify premature mortality related to air pollution, notably in regions where air quality is not monitored, and also because the toxicity of particles from various sources may vary. Here we use a global atmospheric chemistry model to investigate the link between premature mortality and seven emission source categories in urban and rural environments. In accord with the global burden of disease for 2010 (ref. 5), we calculate that outdoor air pollution, mostly by PM2.5, leads to 3.3 (95 per cent confidence interval 1.61-4.81) million premature deaths per year worldwide, predominantly in Asia. We primarily assume that all particles are equally toxic, but also include a sensitivity study that accounts for differential toxicity. We find that emissions from residential energy use such as heating and cooking, prevalent in India and China, have the largest impact on premature mortality globally, being even more dominant if carbonaceous particles are assumed to be most toxic. Whereas in much of the USA and in a few other countries emissions from traffic and power generation are important, in eastern USA, Europe, Russia and East Asia agricultural emissions make the largest relative contribution to PM2.5, with the estimate of overall health impact depending on assumptions regarding particle toxicity. Model projections based on a business-as-usual emission scenario indicate that the contribution of outdoor air pollution to premature mortality could double by 2050.

DOI PMID

[14]
Li P, Yan R, Yu Set al., 2015. Reinstate regional transport of PM2.5 as a major cause of severe haze in Beijing.Proceedings of the National Academy of Sciences of the United States of America, 112(21): 2739-2740.Building upon fine particulate matter (PM2.5) data and the accompanying meteorological conditions in the fall of 2013, Guo et al. (1) conclude that local aerosol nucleation and growth dominantly contributed to severe haze in Beijing, whereas regional transport of PM2.5 played an “insignificant” role. Guo et al.’s conclusion is surprising...

DOI

[15]
Li Q, Jiang J, Wang Set al., 2017. Impacts of household coal and biomass combustion on indoor and ambient air quality in China: Current status and implication.Science of The Total Environment, 576: 347-361.This review briefly introduces current status of indoor and ambient air pollution originating from household coal and biomass combustion in mainland China. Owing to low combustion efficiency, emissions of CO, PM 2.5 , black carbon (BC), and polycyclic aromatic hydrocarbons have significant adverse consequences for indoor and ambient air qualities, resulting in relative contributions of more than one-third in all anthropogenic emissions. Their contributions are higher in less economically developed regions, such as Guizhou (61% PM 2.5 , 80% BC), than that in more developed regions, such as Shanghai (4% PM 2.5 , 17% BC). Chimneys can reduce ~ 80% indoor PM 2.5 level when burning dirty solid fuels, such as plant materials. Due to spending more time near stoves, housewives suffer much more (~ 2 times) PM 2.5 than the adult men, especially in winter in northern China (~ 4 times). Improvement of stove combustion/thermal efficiencies and solid fuel quality are the two essential methods to reduce pollutant emissions. PM 2.5 and BC emission factors (EFs) have been identified to increase with volatile matter content in traditional stove combustion. EFs of dirty fuels are two orders higher than that of clean ones. Switching to clean ones, such as semi-coke briquette, was identified to be a feasible path for reducing > 90% PM 2.5 and BC emissions. Otherwise, improvement of thermal and combustion efficiencies by using under-fire technology can reduce ~ 50% CO 2 , 87% NH 3 , and 80% PM 2.5 and BC emissions regardless of volatile matter content in solid fuel. However, there are still some knowledge gaps, such as, inventory for the temporal impact of household combustion on air quality, statistic data for deployed clean solid fuels and advanced stoves, and the effect of socioeconomic development. Additionally, further technology research for reducing air pollution emissions is urgently needed, especially low cost and clean stove when burning any type of solid fuel. Furthermore, emission-abatement oriented policy should base on sound scientific evidence to significantly reduce pollutant emissions.

DOI PMID

[16]
Lin X, Wang D, 2016. Spatiotemporal evolution of urban air quality and socioeconomic driving forces in China.Journal of Geographical Sciences, 26(11): 1533-1549.Air pollution is a serious problem brought by the rapid urbanization and economic development in China, imposing great challenges and threats to population health and the sustainability of the society. Based on the real-time air quality monitoring data obtained for each Chinese city from 2013 to 2014, the spatiotemporal characteristics of air pollution are analyzed using various exploratory spatial data analysis tools. With spatial econometric models, this paper further quantifies the influences of socioeconomic factors on air quality at both the national and regional scales. The results are as follows: (1) From 2013 to 2014, the percentage of days compliance of urban air quality increased but air pollution deteriorated and the worsening situation in regions with poor air quality became more obvious. (2) Changes of air quality show a clear temporal coupling with regional socioeconomic activities, basically “relatively poor at daytime and relatively good at night”. (3) Urban air pollution shows a spatial pattern of “heavy in the east and light in the west, and heavy in the north and light in the south”. (4) The overall extent and distribution of regional urban air pollution have clearly different characteristics. The formation and evolution of regional air pollution can be basically induced as “the pollution of key cities is aggravated—pollution of those cities spreads—regional overall pollution is aggravated—the key cities lead in pollution governance—regional pollution joint prevention and control is implemented—regional overall pollution is reduced”. (5) At the national level, energy consumption, industrialization and technological progress are the major factors in the worsening of urban air quality, economic development is a significant driver for the improvement of that quality. (6) Influenced by resources, environment and the development stage, the socioeconomic factors had strongly variable impacts on air quality, in both direction and intensity in different regions. Based on the conclusion, the regional differentiation and development idea of the relationship between economic development and environmental changes in China are discussed.

DOI

[17]
Liu C, Chen R, Zhao Yet al., 2017. Associations between ambient fine particulate air pollution and hypertension: A nationwide cross-sectional study in China.Science of The Total Environment, 584/585: 869-874.Abstract Limited evidence is available regarding the long-term effects of fine particulate (PM 2.5 ) air pollution on hypertension in developing countries. This study aimed to explore the associations of long-term exposure to PM 2.5 with hypertension prevalence and blood pressure (BP) in China. We conducted a cross-sectional study based on a nationally representative survey (13,975 participants). We estimated the long-term average exposure to PM 2.5 for all subjects during the study period (June 2011 to March 2012) by a satellite-based model with a spatial resolution of 10010310km. We applied multivariable logistic regression models to evaluate the associations between PM 2.5 and hypertension prevalence and linear regression models for the associations between PM 2.5 and systolic BP and diastolic BP. We also explored potential effect modification by stratification analyses. There were 5715 cases of hypertension, accounting for 40.9% of the study population in this analysis. The annual mean exposure to PM 2.5 for all participants was 72.80204g/m 3 on average. An interquartile range increase (IQR, 41.70204g/m 3 ) in PM 2.5 was associated with higher prevalence of hypertension with an odds ratio of 1.11 [95% confidence interval (CI): 1.05, 1.17]. Systolic BP increased by 0.60mmHg (95% CI: 0.05, 1.15) per an IQR increase in PM 2.5 . The effects of PM 2.5 on hypertension prevalence were stronger among middle-aged, obese and urban participants. This national study indicated that long-term exposure to PM 2.5 was associated with increased prevalence of hypertension and slightly higher systolic BP in China. Copyright 0008 2017 Elsevier B.V. All rights reserved.

DOI PMID

[18]
Liu W, Cai J, Huang Cet al., 2016. Associations of gestational and early life exposures to ambient air pollution with childhood atopic eczema in Shanghai, China.Science of The Total Environment, 572: 34-42.

DOI

[19]
Lu X, Han L, 2014. Research on meteorological features of PBL during heavy haze episodes in the city of Chengdu, Sichuan basin, China. American Geographical Union, Fall Meeting.Sichuan basin is one of the areas that have the most serious haze in China. To understand how wind, temperature ,relative humidity and PHLH influence air pollution, WRF was used to simulate the meteorological condition of PBL during two heavy haze episodes in 2013. Combined with the local meteorological data and air pollution data, the analysis shows that cyclone is caused by the terrain of basin often. Air pollutants are limited in the basin and accumulate periodically. The concentration of O3 is significantly correlated with temperature while negatively correlated with relative humidity. There are significant negative correlations between the pollutants concentrations and the height of PBL. During the episode from 2nd to 23th March he highest daily concentration of PM2.5 was 270ug/m3. The relativity between PM2.5 and O3 is lower than normal because of the dust storm. The correlation coefficients between O3 and temperature and relative humidity are 0.756 and -0.735, respectively. The dominant wind direction is south-west through the PBL. During the episode from 10th to 22nd April, the highest daily concentration of PM2.5 was 158ug/m3. The correlation coefficients between O3 and PM2.5, temperature, and relative humidity are 0.516, 0.825, -797, respectively. The dominant wind direction was south-west through PBL.

[20]
Ministry of Environmental Protection (MEP) of China, 2012. Ambient Air Quality Standards GB3095-2012. Beijing: China's Ministry of Environmental Protection. (in Chinese)

[21]
Moran P A P, 1950. Notes on continuous stochastic phenomena.Biometrika, 37(1/2): 17-23.Biometrika. 1950 Jun;37(1-2):17-23.

DOI PMID

[22]
Morikawa H, 1988. On the phenomenon of population turnaround or "counterurbanization".Geographical Review of Japan, 61: 685-705.

DOI

[23]
Oliver M A, Webster R, 1990. Kriging: A method of interpolation for geographical information systems.International Journal of Geographical Information Science, 4(3): 313-332.Geographical information systems could be improved by adding procedures for geostatistical spatial analysis to existing facilities. Most traditional methods of interpolation are based on mathematical as distinct from stochastic models of spatial variation. Spatially distributed data behave more like random variables, however, and regionalized variable theory provides a set of stochastic methods for analysing them. Kriging is the method of interpolation deriving from regionalized variable theory. It depends on expressing spatial variation of the property in terms of the variogram, and it minimizes the prediction errors which are themselves estimated. We describe the procedures and the way we link them using standard operating systems. We illustrate them using examples from case studies, one involving the mapping and control of soil salinity in the Jordan Valley of Israel, the other in semi-arid Botswana where the herbaceous cover was estimated and mapped from aerial photographic survey.

DOI

[24]
Patton A P, Perkins J, Zamore Wet al., 2014. Spatial and temporal differences in traffic-related air pollution in three urban neighborhoods near an interstate highway.Atmospheric Environment, 99: 309-321.61We compared traffic-related air pollution in 3 Boston-area neighborhoods near I-93.61Pollutant distance-decay gradients were different in each neighborhood.61Pollutant correlations varied by neighborhood, season, and time of day.

DOI PMID

[25]
Peng J, Chen S, Het al., 2016. Spatiotemporal patterns of remotely sensed PM2.5 concentration in China from 1999 to 2011.Remote Sensing of Environment, 174: 109-121.61PM2.5increased significantly in central and eastern China during 1999–2011.61National center of average PM2.5shifted to the southeast in China.61A spatial zoning with two standard contours was proposed for PM2.5control.61Health risk was the highest in central and eastern China, with fast growth rate.61Spatial patterns of PM2.5are quantified using standard deviation ellipse analysis.

DOI

[26]
Place S E, Mitloehner F M, 2010. Invited review: Contemporary environmental issues: A review of the dairy industry's role in climate change and air quality and the potential of mitigation through improved production efficiency.Journal of Dairy Science, 93(8): 3407-3416.Environmental concerns involving the dairy industry are shifting from an exclusive focus on water quality to encompass climate change and air quality issues. The dairy industry's climate change air emissions of concern are the greenhouse gases methane and nitrous oxide. With regard to air quality, the dairy industry's major emission contributions are particulate matter, volatile organic compounds, and ammonia. The emissions of these compounds from dairies can be variable because of a number of factors including weather conditions, animal type, management, and nutrition. To evaluate and compare emissions across the diverse operations that comprise the US dairy industry, emissions should be reported per unit of output (e.g., per kg of 3.5% fat-corrected milk). Accurately modeling emissions with models that can predict the complex bio-geochemical processes responsible for emissions is critical to assess current emissions inventories and develop mitigation strategies. Improving the dairy industry's production efficiency (e.g., improvements in management, nutrition, reproduction, and cow comfort) is an effective way to reduce emissions per unit of milk. With accurate process-based models, emissions reductions due to improved production efficiency could be reported per unit of milk and predicted on a farm-to-farm basis.

DOI PMID

[27]
Qin H, Liao T F, 2016. The association between rural-urban migration flows and urban air quality in China.Regional Environmental Change, 16(5): 1-13.In light of the rapid urbanization of the world’s population over the past decades, there is a growing concern about the environmental impacts of urban population growth. Rural–urban migration is a...

DOI

[28]
Qin R X, Xiao C, Zhu Yet al., 2017. The interactive effects between high temperature and air pollution on mortality: A time-series analysis in Hefei, China.Science of The Total Environment, 575: 1530-1537.Recent evidence suggests that there may be an interaction between air pollution and heat on mortality, which is pertinent in the context of global climate change. We sought to examine this interaction in Hefei, a hot and polluted Chinese city. We conducted time-series analyses using daily mortality, air pollutant concentration (including particulate matter with aerodynamic diameter <021002μm (PM 10 ), sulphur dioxide (SO 2 ) and nitrogen dioxide (NO 2 )), and temperature data from 2008 to 2014. We applied quasi-Poisson regression models with natural cubic splines and examined the interactive effects using temperature-stratified models. Subgroup analyses were conducted by age, gender, and educational levels. We observed consistently stronger associations between air pollutants and mortality at high temperatures than at medium temperatures. These differences were statistically significant for the associations between PM 10 and non-accidental mortality and between all pollutants studied and respiratory mortality. Mean percentage increases in non-accidental mortality per 1002μg/m 3 at high temperatures were 2.40% (95% confidence interval: 0.64 to 4.20) for PM 10 , 7.77% (0.60 to 15.00) for SO 2 , and 6.83% (61021.37 to 15.08) for NO 2 . The estimates for PM 10 were 3.40% (0.96 to 5.90) in females and 4.21% (1.44 to 7.05) in the illiterate, marking them as more vulnerable. No clear trend was identified by age. We observed an interaction between air pollutants and high temperature on mortality in Hefei, which was stronger in females and the illiterate. This may be due to differences in behaviours affecting personal exposure to high temperatures and has potential policy implications.

DOI PMID

[29]
Shaw D, Pang A, Lin C Cet al., 2010. Economic growth and air quality in China.Environmental Economics and Policy Studies, 12(3): 79-96.The relationship between economic development and air quality for mainland China is investigated by examining the environmental Kuznets curve (EKC). We compile a panel dataset comprising air quality, income, and environmental policy variables for 99 cities from 1992 to 2004 to estimate the EKC relationship. Time-specific fixed effects panel models are estimated and the instrumental variables approach is used to consider the endogeneity of income and policy variables. The regression results indicate that the EKC hypothesis is supported in the case of SO 2 .

DOI

[30]
Sheng N, Tang U W, 2016. The first official city ranking by air quality in China: A review and analysis.Cities, 51: 139-149.Frequent regional haze and fog episodes in China force the central government to adopt air quality as a key indicator to assess the performance of provincial and local governors. The 74 key cities have been selected as pilot cities to carry out real-time air quality monitoring according to the new ambient air quality standards, in which PM 2.5 is for the first time included as one of the six compulsory items. The air quality ranking of the 74 cities has been released in the monthly report by the Ministry of Environmental Protection since January 2013. This is the first official city ranking by air quality in China, which makes air quality to be an important aspect of city branding and city competition. The information disclosure puts political pressure on city and provincial governments as their air quality will be watched by the public and the media. The present study provides a review and analysis of air pollution in China from city scale to regional scale based on the monthly reports in 12 months from August 2013 to July 2014. The official air quality rankings of the 74 cities are discussed from the aspects of geographical location, economic development mode and regional air quality management. The air quality rankings of the 74 cities provide the evidence that improvement of air quality requires industrial restructuring and sustainable development strategy. In addition, joint prevention and regional emission control are also essential.

DOI

[31]
Sun D, Du W P, Gao Q Xet al., 2012. Change characteristics of API of several typical cities within three urban agglomerations in China from 2001 to 2010.Resources Science, 34(8): 1401-1407. (in Chinese)Due to the enormous differences in economic development level, climate, geography and other natural conditions, the atmospheric pollution and change characteristics of air quality present diverse trends in different regions. Air pollution index (API) is released daily for some important cities and it serves as a useful reference for public atmospheric environment researches. Beijing-Tianjin-Hebei region, Yangtze River Delta and Pearl River Delta are the most important and most developed urban agglomerations in China. Therefore, studying their air quality characteristics and clarifying the API similarities as well as differences among different cities and urban agglomerations will play an active role in amending environmental protection policies and technical standards and in providing policy reference for other cities. API data used in this study come from the announced results of State Department of Environmental Protection. In this paper, daily API data of nine typical cities within the above three urban agglomerations in the last decade were used to research API annual and seasonal change characteristics and to calculate days with low pollution level or above every year. In addition, the reasons leading to pollution change were analyzed and discussed. The results show that API had declined clearly in typical cities of three urban agglomerations in the last decade as a whole; API of Beijing-Tianjin-Hebei urban agglomeration is the highest and presents the most obviously decline trend, while the Pearl River Delta urban agglomeration has the lowest API and the least prominent decline; annual and seasonal API for all cities decrease from north to south with latitude, and the API of a city near the sea is lower than other cities; the API of three urban agglomerations are high in winter and spring and lowe in summer; the pollution days in Beijing and Shijiazhuang are the most, while in Zhuhai are the least; the pollution days have large gaps among three urban agglomerations during 2001-2008, but the gaps narrow significantly after 2008; the API of all typical cities have the trend of synchronous development and atmospheric pollution presents regional homogeneous characteristics in a certain extent. Analyzing the API change trend and characteristics of three urban agglomerations in the last decade systemically can provide certain reference for scientific evaluation and comparison of two indices in the future.

[32]
Sun L, Wei J, Duan D Het al., 2016. Impact of land-use and land-cover change on urban air quality in representative cities of China.Journal of Atmospheric and Solar-Terrestrial Physics, 142: 43-54.The atmospheric particulate pollution in China is getting worse. Land-Use and Land-Cover Change (LUCC) is a key factor that affects atmospheric particulate pollution. Understanding the response of particulate pollution to LUCC is necessary for environmental protection. Eight representative cities in China, Qingdao, Jinan, Zhengzhou, Xi'an, Lanzhou, Zhangye, Jiuquan, and Urumqi were selected to analyze the relationship between particulate pollution and LUCC. The MODIS (MODerate-resolution Imaging Spectroradiometer) aerosol product (MOD04) was used to estimate atmospheric particulate pollution for nearly 10 years, from 2001 to 2010. Six land-use types, water, woodland, grassland, cultivated land, urban, and unused land, were obtained from the MODIS land cover product (MOD12), where the LUCC of each category was estimated. The response of particulate pollution to LUCC was analyzed from the above mentioned two types of data. Moreover, the impacts of time-lag and urban type changes on particulate pollution were also considered. Analysis results showed that due to natural factors, or human activities such as urban sprawl or deforestation, etc., the response of particulate pollution to LUCC shows obvious differences in different areas. The correlation between particulate pollution and LUCC is lower in coastal areas but higher in inland areas. The dominant factor affecting urban air quality in LUCC changes from ocean, to woodland, to urban land, and eventually into grassland or unused land when moving from the coast to inland China.

DOI

[33]
Tai A P K, Mickley L J, Jacob D J, 2010. Correlations between fine particulate matter (PM2.5) and meteorological variables in the United States: Implications for the sensitivity of PM2.5 to climate change.Atmospheric Environment, 44(32): 3976-3984.We applied a multiple linear regression (MLR) model to study the correlations of total PM higher on stagnant vs. non-stagnant days. Our observed correlations provide a test for chemical transport models used to simulate the sensitivity of PM2.5 to climate change. They point to the importance of adequately representing the temperature dependence of agricultural, biogenic and wildfire emissions in these models.

DOI

[34]
Wang J F, 2010. Spatial Analysis. Beijing: Science Press, 50-61. (in Chinese)

[35]
Wang J F, Ge Y, Li Let al., 2014. Spatiotemporal data analysis in geography.Acta Geographica Sinica, 69(9): 1326-1345. (in Chinese)Following the emergence of large numbers of spatiotemporal datasets, the literatures related to spatiotemporal data analysis increase rapidly in recent years. This paper reviews the literatures and practices in spatiotemporal data analysis, and classifies the methods available for spatiotemporal data analysis into seven categories: including geovisualization of spatiotemporal data, time series analysis of spatial statistical indicators,coupling spatial and temporal change indicators, detection of spatiotemporal pattern and abnormality, spatiotemporal interpolation, spatiotemporal regression, spatiotemporal process modelling, and spatiotemporal evolution tree. We summarized the principles, input and output, assumptions and computer software of the methods that would be helpful for users to make a choice from the toolbox in spatiotemporal data analysis. When we handle spatiotemporal big data, spatial sampling appears to be one of the core methods, because(1)information in a big data is often too big to be mastered by human physical brain, so has to be summarized by statistics understandable;(2) the users of Weibo, Twitter, internet, mobile phone, mobile vehicles are neither the total population nor a random sample of the total population, therefore, the big data sample is usually biased from the population, and the bias has to be remedied to make a correct inference;(3) the data quality is usually inconsistent within a big data, so there should be a balance between the variances of inferences made by using data with various quality and by using small but high quality data.

DOI

[36]
Wang J F, Li X H, Christakos Get al., 2010. Geographical detectors-based health risk assessment and its application in the neural tube defects study of the Heshun region, China.International Journal of Geographical Information Science, 24(1): 107-127.Physical environment, man‐made pollution, nutrition and their mutual interactions can be major causes of human diseases. These disease determinants have distinct spatial distributions across geographical units, so that their adequate study involves the investigation of the associated geographical strata. We propose four geographical detectors based on spatial variation analysis of the geographical strata to assess the environmental risks of health: the risk detector indicates where the risk areas are; the factor detector identifies factors that are responsible for the risk; the ecological detector discloses relative importance between the factors; and the interaction detector reveals whether the risk factors interact or lead to disease independently. In a real‐world study, the primary physical environment (watershed, lithozone and soil) was found to strongly control the neural tube defects (NTD) occurrences in the Heshun region (China). Basic nutrition (food) was found to be more important than man‐made pollution (chemical fertilizer) in the control of the spatial NTD pattern. Ancient materials released from geological faults and subsequently spread along slopes dramatically increase the NTD risk. These findings constitute valuable input to disease intervention strategies in the region of interest.

DOI

[37]
Wang J F, Zhang T L, Fu B J, 2016. A measure of spatial stratified heterogeneity.Ecological Indicators, 67: 250-256.Spatial stratified heterogeneity, referring to the within-strata variance less than the between strata-variance, is ubiquitous in ecological phenomena, such as ecological zones and many ecological variables. Spatial stratified heterogeneity reflects the essence of nature, implies potential distinct mechanisms by strata, suggests possible determinants of the observed process, allows the representativeness of observations of the earth, and enforces the applicability of statistical inferences. In this paper, we propose a q -statistic method to measure the degree of spatial stratified heterogeneity and to test its significance. The q value is within [0,1] (0 if a spatial stratification of heterogeneity is not significant, and 1 if there is a perfect spatial stratification of heterogeneity). The exact probability density function is derived. The q -statistic is illustrated by two examples, wherein we assess the spatial stratified heterogeneities of a hand map and the distribution of the annual NDVI in China.

DOI

[38]
Yan Z, Xin Y, Brown Ret al., 2017. Shipping emissions and their impacts on air quality in China.Science of the Total Environment, 581/582: 186-198.Abstract China has >400 ports, is home to 7 of 10 biggest ports in the world and its waterway infrastructure construction has been accelerating over the past years. But the increasing number of ports and ships means increasing emissions, and in turn, increasing impact on local and regional air pollution. This paper presents an overview of the broad field of ship emissions in China and their atmospheric impacts, including topics of ship engine emissions and control, ship emission factors and their measurements, developing of ship emission inventories, shipping and port emissions of the main shipping areas in China, and quantitative contribution of shipping emissions to the local and regional air pollution. There have been an increasing number of studies published on all the above aspects, yet, this review identified some critical research gaps, filling of which is necessary for better control of ship emissions, and for lowering their impacts. In particular, there are very few studies on inland ports and river ships, and there are few national scale ship emission inventories available for China. While advanced method to estimate ship emission based on ship AIS activities makes it now possible to develop high spatial- and temporal-resolution emission inventories, the ship emission factors used in Chinese studies have been based mainly on foreign measurements. Further, the contribution of ship emissions to air pollution in coastal cities, the dispersion of pollution plumes emitted by ships, or the chemical evolution process along the transmission path, have so far not been systematically studied in China. Copyright 2016 Elsevier B.V. All rights reserved.

DOI PMID

[39]
Zhang R, Fan S, 2011. Study of the influence of wind field on air quality over the Pearl River Delta.Acta Scientiarum Natralium Universitatis Sunyatseni, 50(6): 130-134. (in Chinese)Using daily data of wind speed and wind direction recorded at 14 00 during 2006-2008 at 11 surface weather stations of the Pearl River Delta(PRD) and daily data of Regional Air Quality Index(RAQI) from 11 monitoring stations of the Hong Kong and Guangdong Pearl River Delta Air Quality Monitoring Network,the influence of wind field on air quality over the PRD were studied.Both in dry and wet seasons,the air quality of northern and eastern regions is better than that of southern and western regions of the PRD,and the air quality of central areas of the PRD is the worst.Regional transport has a great impact on the air quality of the PRD.When the regional mean wind speed(RMVS) is greater than 2.6 m/s,the air quality of the PRD is good.When RMVS is greater than 3.2 m/s,the air of PRD is very clean.When RMVS is less than 1.8 m/s,the air pollution of the PRD is serious.When RMVS is between 1.8 m/s and 2.6 m/s,the air quality of the PRD shows a complex change.

DOI

[40]
Zhou L, Wu J, Jia Ret al., 2016. Investigation of temporal-spatial characteristics and underlying risk factors of PM2.5 pollution in Beijing-Tianjin-Hebei area.Research of Environmental Sciences, 29(4): 483-493. (in Chinese) In order to investigate the temporal-spatial characteristics of typical PM_(2.5)pollution events in 2013 and the risk factors of PM_(2.5)pollution in Beijing-Tianjin-Hebei and surrounding areas,real-time,published data on the national urban environmental air quality and geographic national condition monitoring results were analyzed. The spatial data mining method was used to divide the hot spot areas of PM_(2.5)pollution in Beijing-Tianjin-Hebei and surrounding areas. Using the geographic detector model,the risk factors of PM_(2.5)pollution and the associated influence degree were quantitatively analyzed. The results showed that the pollution in selected cities in the BeijingTianjin-Hebei area followed the order Langfang-Beijing-BaodingTianjin-Chengde-Zhangjiakou. The PM_(2.5)pollution showed zonal distribution characteristics, and there was a spatial migration pattern among the cities in the Beijing-Tianjin-Hebei region during a single pollution event. The spatial hot spot detection indicated that Beijing-Tianjin-Hebei and its surrounding areas were divided into five hot spot areas, with the top three of them being distributed in Beijing, Tianjin, and Hebei-central Shandongregions,with areas of 53,100 square kilometers,102,600 square kilometers and 50,400 square kilometers,respectively. Among the eight PM_(2.5)pollution risk factors,the number of industrial companies( influence index 0. 94),precipitation( 0. 93) and topographic slope( 0. 89) had a significantly higher influence on PM_(2.5)pollution than other risk factors. The influence power index of the other risk factors were as follows: population( 0. 60),number of precipitation days( 0. 57),land cover( 0. 52),relative air humidity( 0. 51) and wind speed( 0. 33). The influence of population on PM_(2.5)pollution was slightly greater than that of number of precipitation days,land cover,relative air humidity and wind speed,but with no significant differences among them. The results showed that the main factor in PM_(2.5)pollution in the Beijing-Tianjin-Hebei region is pollutant emission. Secondly,the annual precipitation of meteorological elements and the terrain slope of the natural geography environment are the important risk factors that affect the PM_(2.5)pollution characteristics.

DOI

[41]
Zou B, Xu S, Sternberg Tet al., 2016. Effect of land use and cover change on air quality in urban sprawl.Sustainability, 8(7): 677-690.Due to the frequent urban air pollution episodes worldwide recently, decision-makers and government agencies are struggling for sustainable strategies to optimize urban land use/cover change (LUCC) and improve the air quality. This study, thus, aims to identify the underlying relationships between PM 10 concentration variations and LUCC based on the simulated PM 10 surfaces in 2006 and 2013 in the Changsha-Zhuzhou-Xiangtan agglomeration (CZT), using a regression modeling approach. LUCC variables and associated landscape indexes are developed and correlated with PM 10 concentration variations at grid level. Results reveal that the overall mean PM 10 concentrations in the CZT declined from 106.74 g/m 3 to 94.37 g/m 3 between 2006 and 2013. Generally, variations of PM 10 concentrations are positively correlated with the increasing built-up area, and negatively correlated with the increase in forests. In newly-developed built-up areas, PM 10 concentrations declined with the increment of the landscape shape index and the Shannon diversity index and increased with the growing Aggregation index and Contagion index. In other areas, however, the reverse happens. These results suggest that LUCC caused by urban sprawl might be an important factor for the PM 10 concentration variation in the CZT. The influence of the landscape pattern on PM 10 concentration may vary in different stages of urban development.

DOI

Outlines

/