Research Articles

Spatiotemporal patterns and characteristics of land-use change in China during 2010-2015

  • NING Jia , 1 ,
  • LIU Jiyuan 1 ,
  • Kuang Wenhui , 1 ,
  • XU Xinliang 1 ,
  • ZHANG Shuwen 2 ,
  • YAN Changzhen 3 ,
  • LI Rendong 4 ,
  • WU Shixin 5 ,
  • HU Yunfeng 1 ,
  • DU Guoming 6 ,
  • CHI Wenfeng 1 ,
  • PAN Tao 5 ,
  • NING Jing 6
Expand
  • 1. Key Laboratory of Land Surface Pattern and Simulation, Institute of Geographic Sciences and Natural Resources Research, CAS, Beijing 100101, China
  • 2. Northeast Institute of Geography and Agroecology, CAS, Changchun 130102, China
  • 3. Cold and Arid Regions Environmental and Engineering Research Institute, CAS, Lanzhou 730000, China
  • 4. Institute of Geodesy and Geophysics, CAS, Wuhan 430077, China
  • 5. Xinjiang Institute of Ecology and Geography, CAS, Urumqi 830011, China
  • 6. Northeast Agricultural University, Harbin 150030, China

Author: Ning Jia (1987-), PhD, specialized in land use and cover change and climatic effect. E-mail:

*Corresponding author: Kuang Wenhui (1978-), PhD, E-mail:

Received date: 2017-11-30

  Accepted date: 2018-01-22

  Online published: 2018-03-30

Supported by

National Key Research and Development Program, No.2017YFC0506501

National Key Basic Research Program of China, No.2014CB954302

Copyright

Journal of Geographical Sciences, All Rights Reserved

Abstract

Land use/cover change is an important theme on the impacts of human activities on the earth systems and global environmental change. National land-use changes of China during 2010-2015 were acquired by the digital interpretation method using the high-resolution remotely sensed images, e.g. the Landsat 8 OLI, GF-2 remote sensing images. The spatiotemporal characteristics of land-use changes across China during 2010-2015 were revealed by the indexes of dynamic degree model, annual land-use changes ratio etc. The results indicated that the built-up land increased by 24.6×10³ km2 while the cropland decreased by 4.9×10³ km2, and the total area of woodland and grassland decreased by 16.4×10³ km2. The spatial pattern of land-use changes in China during 2010-2015 was concordant with that of the period 2000-2010. Specially, new characteristics of land-use changes emerged in different regions of China in 2010-2015. The built-up land in eastern China expanded continually, and the total area of cropland decreased, both at decreasing rates. The rates of built-up land expansion and cropland shrinkage were accelerated in central China. The rates of built-up land expansion and cropland growth increased in western China, while the decreasing rate of woodland and grassland accelerated. In northeastern China, built-up land expansion slowed continually, and cropland area increased slightly accompanied by the conversions between paddy land and dry land. Besides, woodland and grassland area decreased in northeastern China. The characteristics of land-use changes in eastern China were essentially consistent with the spatial govern and control requirements of the optimal development zones and key development zones according to the Major Function-oriented Zones Planning implemented during the 12th Five-Year Plan (2011-2015). It was a serious challenge for the central government of China to effectively protect the reasonable layout of land use types dominated with the key ecological function zones and agricultural production zones in central and western China. Furthermore, the local governments should take effective measures to strengthen the management of territorial development in future.

Cite this article

NING Jia , LIU Jiyuan , Kuang Wenhui , XU Xinliang , ZHANG Shuwen , YAN Changzhen , LI Rendong , WU Shixin , HU Yunfeng , DU Guoming , CHI Wenfeng , PAN Tao , NING Jing . Spatiotemporal patterns and characteristics of land-use change in China during 2010-2015[J]. Journal of Geographical Sciences, 2018 , 28(5) : 547 -562 . DOI: 10.1007/s11442-018-1490-0

1 Introduction

Land use/cover change is the most direct manifestation of the impact of human activities on the earth’s surface system and is very important in the global environmental change process (Lawler et al., 2014; Wulder et al., 2008; Mooney et al., 2013). Human activities influence directly or indirectly the surface albedo, surface energy, surface roughness, and evapotranspiration through interaction between the biosphere and atmosphere and thus have a profound impact on the surface radiation energy balance, biogeochemical cycles, and eco-system services (Zhu et al., 2014; Deng et al., 2014; Meyfroidt et al., 2013). Land use/cover change is also one of the important factors characterizing the response of human activities to global change. It is an important input parameter to simulate global climate and biogeochemical effects. The measurement and simulation of its spatiotemporal process and understanding of the dynamic mechanisms have reached the forefront of scientific attention. The Land Use and Cover Change Science Research Program and Global Land Project, developed jointly by the International Geosphere and Biosphere Program (IGBP) and International Human Dimensions Program (IHDP) in 1995 and 2005 respectively, take land use/cover change as the core of global change research (Lambin et al., 1995; Turner et al., 1995; GLP, 2005; Howells et al., 2013; Wright and Wimberly, 2013). The International Council for Science (ICSU) and International Social Science Council (ISSC) launched the “Future Earth” research program in 2012. The measurement of land use and cover spatiotemporal processes has become important to deepen the understanding of the research plan of the Dynamic Planet and to achieve future sustainability objectives (Future Earth, 2013). The monitoring and simulation of land use/cover change has gradually become a focus of research.
Since the beginning of the 21st century, with sustained and rapid socio-economic development, China has entered a rapid urbanization and industrialization stage and a critical period of strategic transformation. In order to protect and develop land resources, optimize the development structure, strengthen land spatial-pattern control and ecological protection, China has implemented a series of land management strategies in its 12th Five-Year Plan period (2011-2015). In 2010, the State Council issued the Major Function-oriented Zones Planning. In this plan, national land is divided into four main function zones, namely optimal development, key development, restricted development and forbidden development, according to development methods. The government chooses reasonable means to develop and protect national land based on the main function zone locations (Fan, 2015). At the same time, an ecological civilization construction plan is implemented, which focuses on the protection and management of national key ecological function zones, biodiversity conservation priority zones, nature reserves, and other important ecological regions. The implementation of a series of major national strategic decision-making factors will have a profound impact on land-use change. Remote sensing satellite images have become an important data source for land-use change monitoring because of their long-term monitoring ability and high spatial resolution (Pflugmacher et al., 2012). In the present study, we carried out long-term land-use change monitoring at national scale, obtaining the spatiotemporal pattern and change characteristics of land use at that scale. This has important strategic significance for scientific and effective development of future national land management strategies and implementation of sustainable development goals (Wang et al., 2012; Kuang et al., 2016; Kuang et al., 2013).
To master and reveal the spatiotemporal patterns and dynamic characteristics of land-use change in China, the land-use change database at national scale of the late 1980s was built based on satellite remote sensing image data. The land-use change data have been updated every 5 years based on the same satellite remote sensing information source (Liu, 1996; Liu et al., 2003a; Liu et al., 2003b; Liu et al., 2010; Liu et al., 2014; Liu et al., 2017). Recently, our research group has released the latest 2010-2015 national land-use change database and latest research results of dynamic monitoring. We have completed six national land-use vector databases at 1:1 million scale and a 1-km proportional composition classification grid database from 1990 to 2015. Our study systematically reveals spatiotemporal patterns and new aspects of China’s land-use change in 2010-2015 for the first time, which lays a solid foundation for understanding the national law for land-use change during the 12th Five-Year Plan period, and provides valuable spatial information for global change and sustainable development research.

2 Data and methods

2.1 Land use/cover change data update at national scale

Land-use change data were updated based on remote sensing satellite imagery data, such as Landsat 8 OLI and GF-2, with reference to China’s land-use remote sensing mapping system (Liu, 1996; Liu et al., 2003a; Liu et al., 2003b; Liu et al., 2010; Liu et al., 2014). Using a high-resolution remote sensing-UAV-ground survey observation system, we constructed the latest land-use vector status dataset of 2015 via human-computer interaction, based on geographic knowledge. Then, we obtained a land-use dataset on a 1-km grid for 2015 (Figure 1) and built a national land-use database for the past 25 years, including land use in 1990, 1995, 2000, 2005, 2010 and 2015. Based on the above database, land-use change polygons from 2000 to 2010 and 2010 to 2015 were drawn, and comprehensive characteristics of national land-use change and differences of land-use change types over 2010-2015 were mapped and analyzed.
In order to ensure quality and consistency of interpretation of land-use data in each period, we performed uniform quality control and checking of the dataset. Firstly, nationwide subgroup field trips were taken for investigation of land use in the provinces, and a large number of field investigation records, photos, and UAV aerial images were obtained. Secondly, within the partition, according to stratified random sampling, we improved data quality through GF-2, UAV images, and field survey data onsite verification. Finally, we conducted unified integration and quality inspection in the country, and data quality was further improved by the identification of peer experts. The classification and overall accuracies were ultimately evaluated through the confusion matrix. The comprehensive evaluation accuracy of the first level of land use is > 93% and that of the second level is > 90%, which can meet user mapping accuracy demands at a scale of 1:1 million.
Figure 1 National land use map of China in 2015

2.2 National development zones

In order to better reveal regional characteristics and differences of land-use change, we divided the country into four regions, i.e., eastern coastal region, central region, western region, and northeastern region. The northeastern region (NER) includes Heilongjiang, Jilin and Liaoning provinces, and has an area of ~79.0×10⁴ km2. The eastern coastal region (ECR) includes provinces (municipalities and special administrative regions), Beijing, Tianjin, Hebei, Shandong, Jiangsu, Shanghai, Zhejiang, Fujian, Guangdong, Hainan, Hong Kong, Macao, and Taiwan, with an area of ~95.5×10⁴ km2. The central region (CR) includes provinces of Shanxi, Henan, Anhui, Hubei, Hunan and Jiangxi, with an area of ~102.8×10⁴ km2. The western region (WR) includes autonomous regions (provinces and municipality) Inner Mongolia, Shaanxi, Gansu, Ningxia, Qinghai, Xinjiang, Chongqing, Sichuan, Guizhou, Yunnan, Guangxi, and Tibet, with an area of ~682.7×10⁴ km2.

2.3 Indicators of land-use change

To better analyze characteristics of land-use change and reveal its rate, we used four indicators for each land-use change type. These are net total area of change, annual area of change, annual rate of change, and dynamic degree.
The equation for calculating the annual rate of change (Ki) of land-use type i was
where Si is the area of i at the start of monitoring, ΔSi,j is the total net area of other changed land-use types j from and to i, and t is the time period. Ki reflects the annual change rate of i within the study area during t.
The equation for calculating the dynamic degree (Si) of i was
where Sa is the total study area, |ΔSi,j| is the total area of absolute value of other changed land-use types j from and to i. Si reflects the change intensity of i within the study area during t.

3 Dynamic characteristics of land-use change in China

Based on the dynamic model of land-use change and a map visualization method, the spatial distribution of the main land-use change types in China from 2010 to 2015 was mapped (Figure 2). The major land-use change in that period was built-up land expansion (Table 1), with a total area of ~2.57×10⁴ km2 at the expense of other land-use types. It was followed by cropland reclamation, with a total area of ~1.10×10⁴ km2 of woodland and grassland conversion to cropland. There was ~8.29×10³ km2 of dry land converted from and to paddy land. Water body shrinkage and expansion was also substantial.
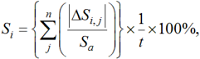
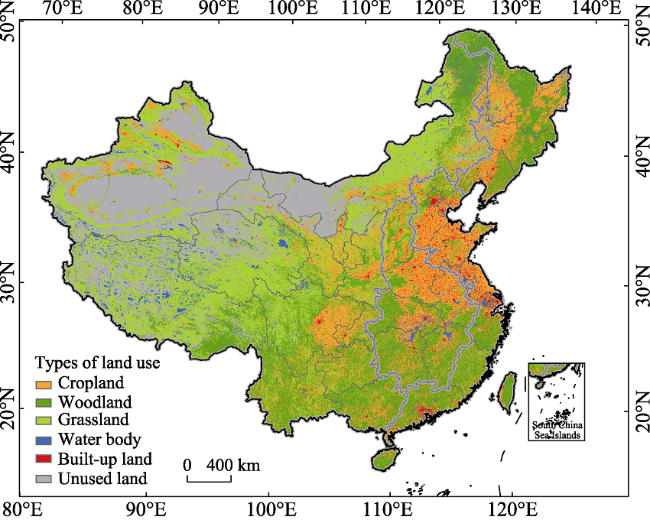
Figure 2 Distribution of dominant land-use conversion in China during 2010-2015
Table 1 Change area of dominant land-change types by region in China during 2010-2015 (×100 km2)
Region Dry land ←→paddy land Cropland
→woodland / grassland
Other land →water body Other land
→built-up
land
Woodland→ cropland Woodland→ grassland Grassland→
cropland
Grassland→ woodland Water body→
other land
NER 76.00 1.06 0.75 10.43 4.17 0.00 3.95 0.02 8.63
ECR 5.71 2.46 8.81 70.09 1.00 4.05 0.32 1.64 0.26
CR 0.31 0.49 6.52 68.74 1.17 4.24 0.18 1.77 0.15
WR 0.87 14.67 36.97 107.39 4.61 5.00 94.84 3.60 66.43
Total 82.89 18.68 53.05 256.65 10.95 13.29 99.29 7.03 75.47
From the spatial distribution, built-up land expansion in the country was vigorous over 2010-2015. The largest area of such expansion was in the western region, accounting for ~41.8% of the national expansion area. However, the largest area proportion of built-up land expansion was found in the eastern and central regions, accounting for about 0.734% and 0.669% of those regions, respectively. The conversion of woodland to cropland was mainly in the northeastern and western regions. The total area of conversion of woodland to cropland in the two regions accounted for > 80% of the total area of that change nationally. The change from grassland into cropland mainly occurred in the northwest Xinjiang oasis area, constituting >95.5% of the national total change. The change from cropland into grassland and woodland was mainly in the Loess Plateau. There was a slight change in Xinjiang and northeastern regions. The area of change from cropland into grassland and woodland in the western region accounted for nearly 80% of the national total area of such change. The change between dry land and paddy land mainly occurred in the northeastern region, making up ~91.7% of the total area of national change. The expansion of water body across the country was mainly in the western and northeastern regions.
Compared with the spatial distribution of land-use change in 2000-2010, there were new features. In the northeastern region, dry land changed into paddy land continuously. The range narrowed, and the change concentrated on the Sanjiang and Songnen plains. In the southeastern coastal region, the built-up land expansion was accelerated continuously, with expansion of both large urban agglomerations and small cities and towns. In the central region, built-up land expansion was also accelerated. In the western region, the range of change from cropland into woodland shrank, only concentrating in the southern ecotone between agriculture and animal husbandry in Inner Mongolia and southern Loess Plateau. The reclamation center of the western region concentrated on the northwest oasis agricultural area, with cropland mainly converted from grassland. Cropland reclamation in eastern Inner Mongolia and Gansu Province was rare. Built-up land expansion in the western region was mainly found in relatively developed areas such as the Sichuan Basin and Loess Plateau. The scope of water body expansion in the western region was enlarged.

4 Dynamic characteristics of regional land-use change

4.1 Northeastern region

In 2015, the main land-use types in the northeastern region were woodland and cropland, with ~33.7×10⁴ km2 and ~31.2×10⁴ km2, accounting for 42.7% and 39.5% of the total area of the northeast, respectively. Built-up land occupied ~3.1×10⁴ km2, about 3.9% of the total area of the northeast. From 2010 to 2015, the total area of land-use change in the northeastern region was ~2.9×10³ km2, or 0.4% of its total area (Table 2). Cropland area in the region continued to increase, by ~0.5×10³ km2 over the afore-mentioned period. The area of woodland and grassland decreased slightly, ~0.7×10³ km2, and the expansion of built-up land was only ~1.0×10³ km2. In this region, the expansion of built-up land exceeded that of other types of land-use change. However, compared with other regions, this expansion was relatively small.
Table 2 Change area of land-change types in northeastern China during 2010-2015 (km2)
2010 2015
Cropland Woodland Grassland Water body Built-up land Unused land Total
Cropland - 93.86 12.32 33.51 840.62 7.88 988.19
Woodland 417.22 - 0 5.23 96.17 6.86 525.48
Grassland 395.08 1.78 - 11.52 60.53 2.31 471.22
Water body 36.85 0 3.71 - 24.77 17.07 82.40
Built-up land 5.84 0.02 0 0.61 - 0 6.46
Unused land 634.91 1.13 179.34 24.80 23.07 - 863.25
Total 1489.90 96.79 195.37 75.67 1045.16 34.12 2937.00

*Only land-use change between the first class of land-use types was considered, without conversion between the two land-use types in the first class

The main types of land-use change in the northeastern region were from cropland into built-up land and unused land into cropland, with ~840.6 km2 and ~634.9 km2 respectively, or 28.6% and 21.6% of the land-use change area in the region. This was followed by change from woodland and grassland into cropland with ~417.2 km2 and ~395.1 km2, respectively, or 14.2% and 13.5% of the land-use change in the region.

4.2 Eastern coastal region

In 2015, the main land-use types in the eastern region were cropland and woodland with ~39.4×10⁴ km2 and ~33.2×10⁴ km2, accounting for 41.3% and 34.8% of the region, respectively. The proportion of built-up land was relatively large with ~10.8×10⁴ km2, making up 11.3% of the total area in the region. From 2010 to 2015, the total area of land-use change in the eastern region was ~9.6×10³ km2, or 1.0% of the total regional area (Table 3). Built-up land in the region continued to increase, about ~7.0×10³ km2 from 2010 to 2015, but cropland area continued to decrease, by ~5.5×10³ km2.
Table 3 Change area of land-change types in eastern China during 2010-2015 (km2)
2010 2015
Cropland Woodland Grassland Water body Built-up land Unused land Total
Cropland - 231.88 14.01 563.47 5503.62 3.75 6316.72
Woodland 99.75 - 407.35 18.41 873.21 4.69 1403.42
Grassland 32.21 165.77 - 28.02 176.50 1.16 403.66
Water body 259.18 3.76 74.39 - 399.55 3.08 739.96
Built-up land 446.87 71.12 18.33 165.42 - 6.50 708.25
Unused land 14.20 0.79 0 1.02 7.27 - 23.28
Total 852.21 473.32 514.08 776.34 6960.15 19.18 9595.29

*Only land-use change between the first class of land-use types was considered, without conversion between the two land-use types in the first class

The main type of land-use change in the eastern region was cropland into built-up land, with an area of ~5.5×10³ km2, or 57.4% of total regional land-use change. It was followed by the conversion of woodland to built-up land and grassland, with ~873.2 km2 and ~407.4 km2 respectively, or 9.1% and 4.2% of total land-use change in the eastern region.

4.3 Central region

In 2015, land-use types in the central region were dominated by woodland and cropland with ~43.0×10⁴ km2 and ~40.9×10⁴ km2, accounting for 41.9% and 39.8% of the total area of the region, respectively. Built-up land occupied 6.18% of the total regional area with ~6.3×10⁴ km2. From 2010 to 2015, the total area of land-use change in central China was ~8.6×10³ km2, making up 0.8% of the total area of that region (Table 4). Built-up land in the central region continued to increase over the study period, by ~6.9×10³ km2. Cropland area continued to decrease, by ~5.2×10³ km2.
Table 4 Change area of land-change types in central China during 2010-2015 (km2)
2010 2015
Cropland Woodland Grassland Water body Built-up land Unused land Total
Cropland - 35.10 14.10 529.06 4906.73 14.39 5499.38
Woodland 117.06 - 424.27 70.98 1569.34 15.92 2197.56
Grassland 18.10 175.43 - 24.21 242.30 3.75 463.78
Water body 101.11 5.40 6.06 - 159.03 12.69 284.29
Built-up land 105.21 9.11 10.60 19.77 - 2.40 147.09
Unused land 0 0.63 0.12 13.64 0.35 - 14.74
Total 341.48 225.67 455.15 657.66 6877.75 49.15 8606.84

*Only land-use change between the first class of land-use types was considered, without conversion between the two land-use types in the first class

The main types of land-use change in the central region were cropland into built-up land, constituting 57.0% of the total area of land-use change in the region, followed by the conversion of woodland to built-up land, accounting for 18.2% of the total land-use change in the region.

4.4 Western region

In 2015, land-use types in the western region were dominated by grassland and unused land with ~246.1×10⁴ km2 and ~217.2×10⁴ km2, constituting 36.6% and 32.3% of the region’s total, respectively. The proportion of built-up land was relatively small with ~6.1×10⁴ km2, accounting for only 0.9% of the total area of the western region. From 2010 to 2015, the total area of land-use change in the region was ~33.9×10³ km2, or 0.5% of the total regional area (Table 5). Built-up land in the western region obviously increased, by ~10.8×10³ km2 from 2010 to 2015, and cropland area increased by ~5.2×10³ km2. The area of woodland and grassland continued to decrease, by ~13.2×10³ km2.
Table 5 Change area of land-change types in western China during 2010-2015 (km2)
2010 2015
Cropland Woodland Grassland Water body Built-up land Unused land Total
Cropland - 150.51 1316.95 627.74 5394.10 127.35 7616.65
Woodland 461.37 - 497.59 373.16 924.88 43.83 2300.84
Grassland 9489.45 360.13 - 1324.36 3363.35 463.72 15001.01
Water body 127.45 4.79 330.23 - 107.59 1663.74 2233.80
Built-up land 15.40 20.79 21.36 36.61 - 4.99 99.14
Unused land 2743.03 363.82 1238.42 1335.55 970.26 - 6651.08
Total 12836.70 900.04 3404.55 3697.42 10760.18 2303.63 33902.52

*Only land-use change between the first class of land-use types was considered, without conversion between the two land-use types in the first class

The main type of land-use change in the western region was grassland into cropland. A total of ~10,000 km2 of grassland was converted to cropland, accounting for 28.0% of the region’s total land-use change area. This was followed by change from cropland to built-up land, representing ~16.0% of the total area of land-use change in the region. The area of change from grassland to cropland and that from unused land to cropland was ~3.4×10³ km2 and ~2.7×10³ km2, respectively. There exist many differences between the characteristics of regional land-use changes during 2000-2010 and 2010-2015 (Table 6).
Table 6 Regional characteristics of land-use change across China during 2000-2010 and 2010-2015
Region Land-use features
from 2000 to 2010
Land-use features
from 2010 to 2015
Variations in regions between the two periods
1. NER The main land-use change type was conversion from cropland to built-up land, with ~0.9×10³ km2. It was followed by change from woodland and grassland to cropland, with 0.7×10³ and 0.6×10³ km2 respectively. The main land-use change type was conversion from cropland to built-up land and from unused land to cropland. That was followed by change from woodland and grassland to cropland. There was little difference in area of the main land-use change types. The change area from cropland to the woodland decreased. The change area from unused land into cropland increased.
2. ECR The main land-use change type was conversion from cropland to built-up land, with ~14.5×10³ km2. It was followed by change from woodland to built-up land, with ~2.2×10³ km2. The main land-use change type was conversion from cropland to built-up land. It was followed by change from woodland to built-up land and grassland. The area of dynamic land-use change declined. The area of cropland and woodland change into built-up land greatly decreased.
3. CR The main land-use change type was conversion from cropland and woodland to built-up land, accounting for 5.6×10³ and 1.2×10³ km2 respectively. It was followed by cropland change into woodland, ~0.8×10³ km2. The main land-use change type was conversion from cropland to built-up land. It was followed by change from woodland to built-up land. The change from cropland and woodland to built-up land showed small differences, but the conversion area from cropland into woodland shrank.
4. WR The main land-use change type was conversion from grassland to cropland, accounting for 16.1×10³ km2. It was followed by change from cropland to grassland, and from grassland to woodland, both accounting for 6.4×10³ km2. The main land-use change type was conversion from grassland to cropland. It was followed by change from cropland and grassland to built-up land. Reclamation of unused land was also substantial. The area of grassland change to cropland decreased. In addition, the area of cropland return to woodland and grassland decreased obviously.

5 Change of main land-use types

5.1 Expansion characteristics of built-up land

Built-up land in China from 2010 to 2015 increased by ~24.6×10³ km2. The largest area of increase was observed in the western region, where there was an increase by 10.6×10³ km2, or 43.0% of the total increase area of built-up land in China. The second largest increase area was in the central region, with ~6.7×10³ km2. The smallest increase area was in the northeastern region, only 1.0×10³ km2. The expansion of built-up land was mainly at the expense of cropland, with ~67.5% of new built-up land coming from the expropriation of cropland. There was 14.0% and 15.6% of new built-up land originating from the occupation of woodland and grassland. The expansion of built-up land in the western region was mainly in flat-terrain, relatively developed areas such as the Sichuan Basin, Loess Plateau, and national key development zones under strategic deployment of the Major Function-oriented Zones Planning (Figure 3). The expansion of built-up land in the central region was mainly in the Central Plains, Wuhan, and Changsha-Zhuzhou-Xiangtan urban agglomerations. The expansion was mainly in economically developed and densely populated areas such as the Beijing-Tianjin-Hebei, Yangtze and Pearl river delta urban agglomerations, plus other large and medium-sized cities.
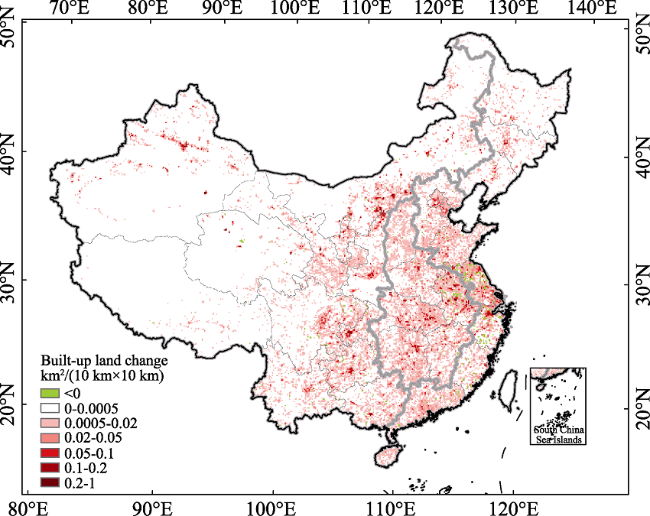
Figure 3 Distribution of built-up land change in China during 2010-2015
Compared with 2000-2010, the spatial pattern of built-up land change during 2010-2015 was almost the same, still featuring the “Concentrate in the eastern region and spread to the central and western regions”. However, the change area and rate of built-up land had major differences between 2010-2015 and 2000-2010 (Figure 4). Considering the total area of change, the increase area of built-up land in the eastern region reduced greatly from 2010 to 2015, while it reduced slightly in the central region. The increase area of built-up land in both the northeastern and western regions shows an increasing trend. The new built-up land has shifted from the eastern region during 2000-2010 to the western region during 2010-2015.
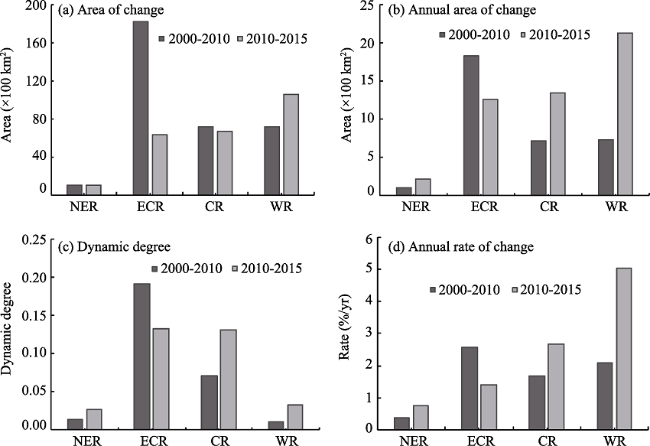
Figure 4 Statistical histogram of built-up land change by region during 2000-2010 and 2010-2015
The average annual change area, dynamic degree and annual rate of built-up land change in the northeastern and western regions during 2010-2015 were sharply greater than those of during 2000-2010. Those in the eastern region were smaller during 2010-2015. In the latter period, the dynamic degree of built-up land increase in the central region was nearly the same as in the eastern region. However, the annual rate of change in the central region was much larger than that of the eastern region. This shows that during 2010-2015, the expansion rate of built-up land in the eastern region declined, while the expansion rate in the northeastern, central and western regions increased substantially.
Therefore, the change of built-up land in China from 2010 to 2015 was such that the eastern region was still the core, but spread to the central and western regions. The eastern expansion slowed, and expansion accelerated in the northeastern, central and western regions. Built-up land development in the eastern and central regions was equal, but both were greater than in the northeastern and western regions. That development in the western region accelerated overall, and the rate was much higher than in the central and eastern regions.

5.2 Change of cropland

The total area of cropland in China decreased by 4.9×10³ km2 over 2010-2015, among which the conversion area of cropland to other land-use types was ~20.4×10³ km2, and the conversion area of other land-use types to cropland was 15.5×10³ km2. Cropland in the eastern and central regions declined by 5.5×10³ km2 and 5.1×10³ km2, respectively, and in the northeastern and western regions increased continuously, by 0.5×10³ km2 and 5.2×10³ km2 respectively. The decrease of cropland was mainly from the occupation of built-up land, and the area of this occupation accounted for 81.5% of cropland reduction in the country. The increase of cropland was mainly from occupation by grassland and reclamation of unused land. The conversion from grassland and unused land to cropland represented 64.0% and 21.9% of the new cropland area, respectively. The decrease of cropland in the eastern coastal region was largely from occupation by built-up land (Figure 5). The reduction of cropland in the central region was mainly from large-scale expansion of built-up land and the conversion of cropland to woodland and grassland. This occurred under the influence of the “Rise of Central China” strategy and implementation of national ecological protection projects. A small increase in cropland in the northeastern region mainly owed to the reclamation of the Northeast China Plain. In the western region, implementation of ecological projects to return cropland to woodland and grassland on the Loess Plateau and in the Sichuan Basin increased cropland area. In Xinjiang, because of the development of oasis agriculture, substantial surrounding cropland was reclaimed. The intensity and area of reclamation was much greater than returning cropland to woodland and grassland. Therefore, cropland area in the western region substantially increased.
Compared with 2000-2010, the spatial pattern of cropland change during 2010-2015 was nearly the same. It continued a trend toward “increase in the north and decrease in the south, with the center of increasing cropland moving from northeast to northwest”. The change rate and area had major differences between the two periods (Figure 6). Total change areas in the eastern, central and western regions during 2010-2015 were all less than those of the period 2000-2010, but change in the northeastern region was greater in this period. Meanwhile, the decrease rate in the eastern region declined, while in the central region it accelerated. The increase rate in the northeastern and western regions rose.
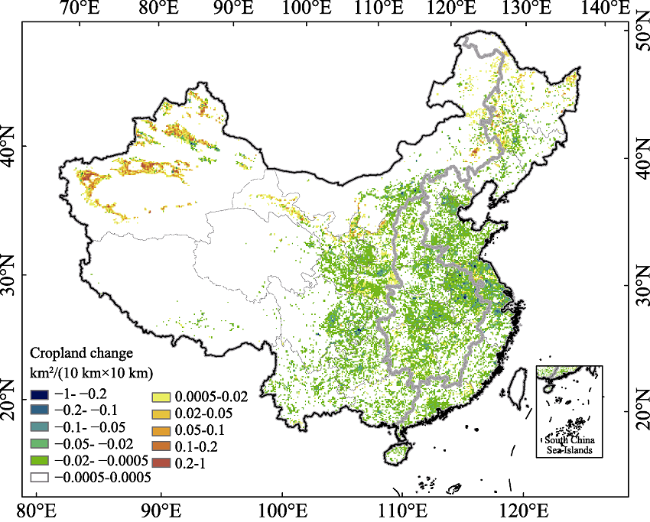
Figure 5 Distribution of cropland change in China during 2010-2015
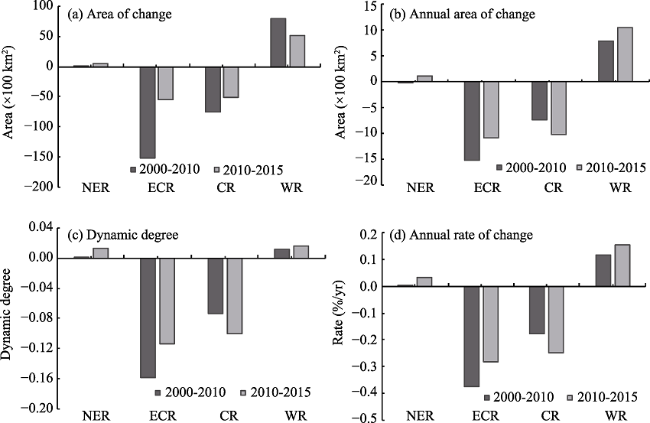
Figure 6 Statistical histogram of cropland change by region during 2000-2010 and 2010-2015
Therefore, cropland change in China from 2010 to 2015 showed a southward decrease and northward increase, and the total amount of cropland was nearly unchanged. The center of new cropland moved gradually from northeast to northwest. Cropland in the eastern and central regions continued to decrease, while in the northeastern and western regions it continued to increase. The decrease slowed in the western region and accelerated in the central region. The increase accelerated in both the northeastern and western regions.

5.3 Change of woodland and grassland

The area of woodland and grassland in China decreased by 16.4×10³ km2 over 2010-2015, in which the conversion of woodland and grassland to other land area was 20.7×10³ km2; other land conversion to woodland and grassland area was 4.3×10³ km2. The largest area of decline was in the western region, at 13.0×10³ km2, much greater than the other three regions. This was followed by the central region, with a total reduction of 2.0×10³ km2, while the eastern and northeastern regions had a smaller woodland and grassland areas of decrease of <1000 km2. The reduction of woodland and grassland was mainly by reclamation from cropland and built-up land expansion. Cropland reclamation and built-up land expansion accounted for 53.2% and 35.2% of the total decrease area of grassland and woodland. The increase of woodland and grassland was mainly caused by conversion of cropland and unused land, accounting for 44.2% and 42.2% of the increased area of woodland and grassland, respectively. In the western region, the woodland and grassland increase concentrated in the Xinjiang oasis area, Loess Plateau, Sichuan Basin, and other regions (Figure 7). In oasis of Xinjiang, a large amount of woodland and grassland changed because of cropland reclamation, which greatly reduced the area of woodland and grassland. In some areas, such as the Loess Plateau and Sichuan Basin, the expansion of built-up land occupied large areas of woodland and grassland because of the strategic influence of the Major Function-oriented Zones Planning of the country. From 2010 to 2015, the scale and scope of national ecological protection projects somewhat decreased. The projects focused on supplementation and consolidation, such as the return of cropland to woodland and grassland. Therefore, the entire area of woodland increase was relatively small. Projects for returning cropland to woodland and grassland have been implemented in western China, augmenting the area of grassland and woodland. However, that area was small compared with the cropland reclamation and built-up land expansion. The decrease of woodland and grassland in central China was mainly in the national key development zones. This occurred under the strategic deployment of the Major Function-oriented Zones Planning, and was mainly caused by the expansion of built-upland. The decrease of woodland and grassland in the northeastern and eastern regions was less, mainly due to the expansion and occupation of built-up land.
Compared with 2000-2010, the spatial pattern of woodland and grassland change during2010-2015 was nearly the same. However, the range of woodland increase area gradually decreased, and the range of woodland decrease area gradually increased. This shows that “the increase area in the central region shrank, while the decrease area in the eastern and western regions expanded”. There were large differences in the change rate of woodland and grassland between 2010-2015 and 2000-2010 (Figure 8). The total area of woodland and grassland decrease in the eastern and northeastern regions declined during 2010-2015, especially in the former region. However, the decrease area in the central and western regions increased.
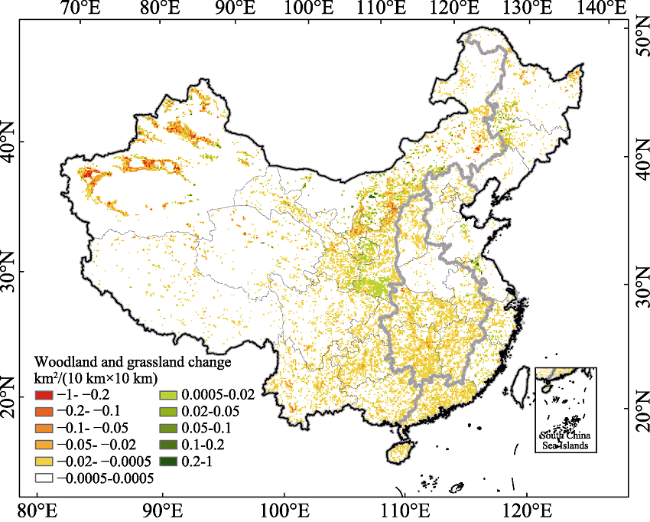
Figure 7 Distribution of woodland and grassland change in China during 2010-2015
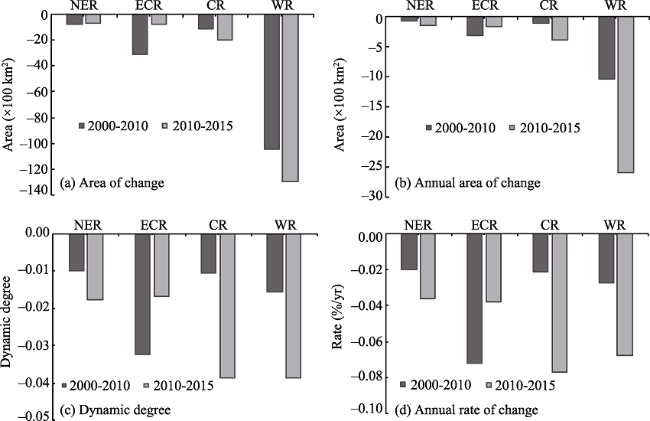
Figure 8 Statistical histogram of woodland and grassland change by region during 2000-2010 and 2010-2015
The decrease area of woodland and grassland in the western region was much smaller than that in the central region. The dynamic degree of woodland and grassland in the central and western regions was nearly identical, considering the difference of regional area and area of woodland and grassland in the central and western regions. The annual rate of woodland and grassland reduction in the central region was slightly higher than that in the western region. The dynamic degree of grassland and woodland decrease in the northeastern region was slightly greater than that in the eastern region, while the annual rate of woodland and grassland reduction in the northeastern region was almost the same as that in the eastern region. This indicates that the reduction rate of grassland and woodland in the eastern region slowed during 2010-2015, but that rate in the northeastern, central and western regions accelerated. The annual rate of woodland and grassland reduction in the central region was slightly higher than in the western region and much higher than in the eastern and northeastern regions. The dynamic degree of woodland and grassland change in the central region was almost the same as in the western region, and both were much greater than in the eastern and northeastern regions.
Therefore, the change of woodland and grassland in China over 2010-2015 was such that the increase area in the central region declined, while the decrease area in the eastern and western regions expanded. The decrease rate in the eastern region slowed, while the decrease rate in the northeastern, central and western regions accelerated. The reduction in the western and central regions was almost equal, and both were greater than in the eastern and northeastern regions. The reduction rate of the central region was much higher than in the western, eastern and northeastern regions.

6 Conclusions and discussion

Based on satellite remote sensing image data and the national land-use change database of China from the late 1980s to 2010, we updated land-use change data of 2015 by artificial interactive interpretation. Compared with the spatiotemporal patterns of land-use change from 2000 to 2010, we analyzed those patterns and new features of land-use change in China over 2010-2015.
Compared with 2000-2010, the regional spatial pattern of land-use change in China during 2010-2015 was basically the same. However, new characteristics appeared in regional land-use change. The main features of that change are as follows. Built-up land in eastern China expanded and cropland shrank, but the rate of change decreased. Built-up land expansion and cropland shrinkage in central China accelerated. In western China, built-up land expansion obviously accelerated. The increase rate of cropland accelerated. The shrinkage rates of both woodland and grassland accelerated. In northeastern China, built-up land expansion continued to slump, cropland increased steadily, and the area of woodland and grassland decreased slightly.
From 2010 to 2015, the characteristics of land-use types varied greatly. Built-up land expansion was such that the eastern region remained the core and radiated to the central and western regions. Expansion in the eastern region slowed, while the northeastern, central and western regions showed acceleration. The development of built-up land in the eastern and central regions was basically flat, while that in the western region accelerated. The change of cropland was such that cropland decreased in the northern region and increased in the southern, with the total area basically in balance. The center of new cropland moved farther from the northeast toward the northwest. Cropland in the eastern and central regions continued to decline, while that in the northeastern and western regions continued to increase. The decrease of cropland in the eastern region slowed. There was cropland reduction in the central region, while an increase of cropland in the northeastern and western regions accelerated. The decrease area in the western region was similar to that of the central region, but both were larger than in the eastern and northeastern regions. The decrease rate in the central region was higher than in the western, eastern and northeastern regions.
In the Major Function-oriented Zones Planning implemented during the 12th Five-Year Plan, the national optimal development and key development zones are mainly in the eastern coastal and northeastern regions. The main type of land-use change in the eastern region during 2010-2015 was built-up land expansion, but at a decreasing rate. These characteristics basically match the spatial pattern of land management requirements of the national optimal development and key development zones. Agricultural production and key ecological function zones were mainly in the western and central regions. Land-use change in those regions over the same period showed that local governments of central and western regions face severe challenges in effectively protecting land-use types associated with the key ecological function and agricultural production zones. Therefore, it is necessary to further increase effective control of land development patterns by central and western governors.

The authors have declared that no competing interests exist.

[1]
Deng L, Liu G B, Shangguan Z P, 2014. Land-use conversion and changing soil carbon stocks in China’s ‘Grain-for-Green’ Program: A synthesis.Global Change Biology, 20(11): 3544-3556.

DOI

[2]
Fan J, 2015. Draft of major function oriented zoning of China.Acta Geographica Sinica, 70(2): 186-201. (in Chinese)Major Function Oriented Zoning(MFOZ) is the blueprint for the future developmnt and protection pattern of China's territory, and has been raised to from major function zones planning to major function zoning strategy and major function zoning institution. From 2004 to2014, the author organized a series of research projects to compose MFOZ for the country,studied basic theory of regional function and MFOZ technical process, and proposed that space controlling zones of national and provincial scales can be divided into four types: urbanized zones, foodstuff-security zones, ecological safety zones, cultural and natural heritage zones. On this basis, major function zones of county scale should be transferred to optimized, prioritized,restricted, and prohibited zones. In this paper, a regional function identification index system comprising nine quantitative indicators(including water resources, land resources, ecological importance, ecological fragility, environment capacity, disaster risk, economic development level, population concentration and transport superiority) and one qualitative indicator of strategic choice is developed. Based on the single index evaluation, comprehensive evaluation using regional function suitability evaluation index is conducted, aiming at testing several key parameters including lower limit of protection zones and upper limit of development zones at the provincial level. In addition, a planning-oriented zoning method of major function zones is also discussed, which has brought the first MFOZ planning in China. According to the MFOZ caliber, it is forecasted that national spatial development intensity will rise from 3.48% in 2010 to 3.91% in 2020. Furthermore, according to caliber of the provincial integrated MFOZ planning, the area of optimized, prioritized and restricted zones accounts for 1.48%, 13.60%and 84.92%, respectively, and that of urbanized, foodstuff-security and ecological safety zones accounts for 15.08%, 26.11% and 58.81%, respectively. In combination of analyses of development level, resources and environmental carrying status and quality of the people's livelihood, the main characteristics of MFOZ were identified. Through verification, MFOZ draft of national and provincial scales, which is interactively accomplished with "MFOZ Technical Process" put forward by the author, is mostly above 80% identical with what have been forecasted.

DOI

[3]
Future Earth, 2013. Future Earth Initial Design: Report of the Transition Team. Paris: International Council for Science (ICSU).

[4]
GLP, 2005. Science Plan and Implementation Strategy. IGBP Report No. 53/IHDP Report No. 19, Stockholm. 64.

[5]
Howells M, Hermann S, Welsch M , et al. 2013. Integrated analysis of climate change, land-use, energy and water strategies. Nature Climate Change, 3(7): 621-626.Land, energy and water are our most precious resources, but the manner and extent to which they are exploited contributes to climate change. Meanwhile, the systems that provide these resources are ...

DOI

[6]
Kuang W H, Liu J Y, Dong J W , et al. 2016. The rapid and massive urban and industrial land expansions in China between 1990 and 2010: A CLUD-based analysis of their trajectories, patterns, and drivers.Landscape and Urban Planning, 145: 21-23.The past two decades saw rapid and massive urbanization and industrialization in China. Despite much research has been reportedly done at local and regional scales, little has been reported on the trajectories, patterns, and drivers of these two intertwining processes at the national level. This is mainly due to the fact that until recently, high resolution spatial data of land use and land cover change were not available at national level. The research reported in this paper aimed to fill this knowledge gap. Employing the China Land Use/Cover Dataset (CLUD), a national land use/cover change database our research team developed over the past decade, we analyzed the two intertwining processes at a 5 year interval from 1990 to 2010 to identify their trajectories, spatiotemporal patterns, and driving forces. Among out key findings are that (1) the nation's urban and industrial land areas increased from 4.8502×0210 4 02km 2 in 1990 to 9.0802×0210 4 02km 2 in 2010; (2) compared to those in the 1990s, the expansion rates of urban land and industrial land in the 2000s were respectively 2.15 and 5.79 times higher; (3) the expansion rates varied significantly across regions, revealing a distinctive spatial pattern with coastal regions being the fastest and the northeastern the slowest; (4) national development strategies and regional land-use policies had prominent impacts on land expansions; while (5) socioeconomic factors along with local and regional land-use policies explained the regional variations.

DOI

[7]
Kuang W H, Liu J Y, Zhang Z X , et al. 2013. Spatiotemporal dynamics of impervious surface areas across China during the early 21st century.Chinese Science Bulletin, 58(14): 1-11.There are several kinds of epigenetic networks in the human body including the cell differentiation epigenetic network(DiEN) and the host adaptation epigenetic network(AdEN).DiEN networks are static and cell/tissue-specific.AdEN networks are variable and dependent upon environmental factors.DiEN and AdEN alterations can respectively serve as biomarkers for different kinds of diseases.Cancer is a consequence of accumulated pathophysiological adaptations of tissue stem cells to exposure of environmental carcinogens.Cancer cells are de-differentiated cells that obtain the capacity of unrestricted proliferation,local invasion,and distant migration/metastasis.Both DiEN and AdEN changes can be observed in cancer tissues.Alterations of DNA methylation are the most stable epigenetic modifications and can be sensitively detected in a small cell population.These advantages make DNA methylation the optimal biomarkers for detection of initiated cells in precancerous lesions and metastasis stem cells in cancer tissues.It has been proven that p16 methylation can be used as a diagnostic biomarker to determine malignant potential of epithelium dysplasia in many organs including the stomach.In a large-scale validation study on the DNA methylome of gastric carcinomas(GC),the methylation status of more than 90 CpG islands has been analyzed by DHPLC.Furthermore,GFRA1 demethylation and methylation of SRF and ZNF382 are frequent events during gastric carcinogenesis and consistently correlate to GC metastasis and overall survival of GC patients from China,Japan,and Korea,respectively.In a population study,it has been demonstrated that gradual increasing of plasma miR-211 and other miRNA levels may be an early risk predictor for GC development.

DOI

[8]
Lambin E F, Baulies X, Bockstael N , et al. 1995. Land-use and land-cover change (LUCC): Implementation strategy. A core project of the International Geosphere-Biosphere Programme and the International Human Dimensions Programme on Global Environmental Change. IGBP Report 48. IHDP Report 10. IGBP, Stockholm, 125.

[9]
Lawler J J, Lewis J D, Nelson E , et al. 2014. Projected land-use change impacts on ecosystem services in the United States.Proceedings of the National Academy of Sciences, 111(20): 7492-7497.Providing food, timber, energy, housing, and other goods and services, while maintaining ecosystem functions and biodiversity that underpin their sustainable supply, is one of the great challenges of our time. Understanding the drivers of land-use change and how policies can alter land-use change will be critical to meeting this challenge. Here we project land-use change in the contiguous United States to 2051 under two plausible baseline trajectories of economic conditions to illustrate how differences in underlying market forces can have large impacts on land-use with cascading effects on ecosystem services and wildlife habitat. We project a large increase in croplands (28.2 million ha) under a scenario with high crop demand mirroring conditions starting in 2007, compared with a loss of cropland (11.2 million ha) mirroring conditions in the 1990s. Projected land-use changes result in increases in carbon storage, timber production, food production from increased yields, and >10% decreases in habitat for 25% of modeled species. We also analyze policy alternatives designed to encourage forest cover and natural landscapes and reduce urban expansion. Although these policy scenarios modify baseline land-use patterns, they do not reverse powerful underlying trends. Policy interventions need to be aggressive to significantly alter underlying land-use change trends and shift the trajectory of ecosystem service provision.

DOI PMID

[10]
Liu J Y, 1996. Macro-scale Survey and Dynamic Study of Natural Resources and Environment of China by Remote Sensing. Beijing: China Science and Technology Press. (in Chinese)

[11]
Liu J Y, Kuang W H, Zhang Z X , et al. 2014. Spatiotemporal characteristics, patterns, and causes of land-use changes in China since the late 1980s.Journal of Geographical Sciences, 24(2): 195-210.Land-use/land-cover 变化(LUCC ) 有连接到人和自然相互作用。瓷器 Land-Use/cover 数据集(CLUD ) 从 1980 年代末在 5 年的间隔定期被更新到 2010,与基于 Landsat TMETM+ 图象的标准过程。陆地使用动态区域化方法被建议分析主要陆地使用变换。在国家规模的陆地使用变化的空间与时间的特征,差别,和原因然后被检验。主要调查结果如下被总结。越过中国的陆地使用变化(LUC ) 在最后 20 年(19902010 ) 里在空间、时间的特征显示了一个重要变化。农田变化的区域在南方减少了并且在北方,而是仍然是的全部的区域增加了几乎未改变。回收农田从东北被转移到西北。布满建筑物陆地很快膨胀了,主要在东方被散布,并且逐渐地展开到中央、西方的中国。树林首先减少了,然后增加但是荒芜的区域是反面。草地继续减少。在中国的 LUC 的不同空间模式被发现在之间迟了第 20 世纪并且早第 21 世纪。原版 13 个 LUC 地区在一些地区被边界的变化由 15 个单位代替。包括的这些变化(1 ) 的主要空间特征加速的扩大布满建筑物在 Huang-Huai-Hai 区域,东南的沿海的区域,长江的中流区域,和四川盆登陆;(2 ) 从东北中国和东方内部蒙古在北方转移了陆地开垦到绿洲在西北中国的农业区域;(3 ) 从在到稻的东北中国的喂雨的农田的连续转变回答;并且(4 ) 为在内部蒙古,黄土高原,和西南的多山的区域的南部的农业牧剧的交错群落的格林工程的谷物的有效性。在最后二十年,尽管在北方的气候变化在农田影响了变化,政策规定和经济驱动力仍然是越过中国的 LUC 的主要原因。在第 21 世纪的第一十年期间,在陆地使用模式驾驶了变化的人为的因素从单程的陆地开发转移了强调到开发和保存。动态区域化方法被用来在单位的 zoning 边界,地区的内部特征,和生长和减少的空间17

DOI

[12]
Liu J Y, Liu M L, Zhuang D F , et al. 2003a. Study on spatial pattern of land-use change in China during 1995-2000.Science in China Series D-Earth Sciences, 46(4): 373-384.It is more and more acknowledged that land-use/cover dynamic change has become a key subject urgently to be dealt with in the study of global environmental change. Supported by the Landsat TM digital images, spatial patterns and temporal variation of land-use change during 1995 -2000 are studied in the paper. According to the land-use dynamic degree model, supported by the 1km GRID data of land-use change and the comprehensive characters of physical, economic and social features, a dynamic regionalization of land-use change is designed to disclose the spatial pattern of land-use change processes. Generally speaking, in the traditional agricultural zones, e.g., Huang-Huai-Hai Plains, Yangtze River Delta and Sichuan Basin, the built-up and residential areas occupy a great proportion of arable land, and in the interlock area of farming and pasturing of northern China and the oases agricultural zones, the reclamation of arable land is conspicuously driven by changes of production conditions, economic benefits and climatic conditions. The implementation of - eturning arable land into woodland or grassland- policies has won initial success in some areas, but it is too early to say that the trend of deforestation has been effectively reversed across China. In this paper, the division of dynamic regionalization of land-use change is designed, for the sake of revealing the temporal and spatial features of land-use change and laying the foundation for the study of regional scale land-use changes. Moreover, an integrated study, including studies of spatial pattern and temporal process of land-use change, is carried out in this paper, which is an interesting try on the comparative studies of spatial pattern on change process and the change process of spatial pattern of land-use change.

DOI

[13]
Liu J Y, Zhang Z X, Xu X Let al.2010. Spatial patterns and driving forces of land use change in China during the early 21st century.Journal of Geographical Sciences, 20(4): 483-494.

DOI

[14]
Liu J Y, Zhang Z X, Zhuang D F , et al. 2003b. A study on the spatial-temporal dynamic changes of land-use and driving forces analyses of China in the 1990s.Geographical Research, 22(1): 1-12. (in Chinese)Supported by the key knowledge innovation projects,i.e., a preliminary study on the theories and techniques of the remotely sensed temporal-spatial information and digital Earth; and a study on the integration of national resources and environment and data sharing, the authors have set up a spatial-temporal information platform by the integration of the corresponding scientific and research achievements during the periods of the 8th- and 9th-Five Year Plan, which comprehensively reflected the features of land-use change, designed a series of technical frameworks on the spatial-temporal database construction based on remote sensing techniques, e.g., the construction of remotely sensed database and land-use spatial database of the mid-1980s, the mid-1990s and the end of the 1990s, which laid a foundation for the dynamic monitoring of land-use change and the corresponding studies. In this paper,the authors have analyzed comprehensively the features of land-use change in the 1990s, revealed the spatial-temporal change of land use supported by remote sensing and GIS technologies as well as analyzed the geophysical and socio-economic driving factors.The findings are as follows: the arable land has been increased in total amount, the balance of decrease in the south and increase in the north was resulted from the reclamations of grassland and forest land. On the whole, the forest land area had a process of decrease, and the decreased area was mainly distributed in the traditional forest areas. Areas with plentiful precipitation and heat in the south, however, had distinct effects of reforestation. The rural-urban construction land had a situation of persistent expansion, and the general expansion speed has been slowed down during the last five years of the 1990s with the exception of the Western China where the expansion speed has been accelerated. The land use change in China in the 1990s had distinct temporal and spatial differences due to two main reasons, which were policy control and economic driving. Hereby, conclusions and proposals brought forward by the authors were as follows: the spatial diversity rules of the modern land use change in China must be fully considered in the future land use planning. At the same time, the pertinence of physical geographical zones must be considered during the planning of eco-environment construction. And, based on the increasingly maturity of the infrastructure, the traditional thoughts on planning and management of resources must be shifted so as to fully realize the optimized allocation of land resources at regional scale.

DOI

[15]
Liu W C, Liu J Y, Kuang W H , et al. 2017. Examining the influence of the implementation of Major Function-oriented Zones on built-up area expansion in China.Journal of Geographical Sciences, 27(6): 643-660.中国实现了国家策略让主要面向功能的地区(MFOZ ) 自从 2010,实现国家持续开发的目标。分析并且比较时间空间的特征和差别在的这研究布满建筑物为用一个中国 s 陆地使用数据库(CLUD ) 的瓷器 MFOZ 的区域在 2000-2010 和 2010-2013 的时期源于高分辨率的遥远地察觉到的图象。总结:(1 ) 百分比布满建筑物在每 MFOZ 的区域是显著地不同的,基于主要函数的分发揭示国家陆地开发的坡度特征。(2 ) 年度生长在布满建筑物,在最佳的发展地区(ODZ ) 的区域与时期 2000-2010 相比在 2010-2013 期间显著地减少了年度生长在布满建筑物在重要进展地区(KDZ ) 的区域,农业生产地区(APZ ) 和关键生态的功能地区(KEFZ ) 显著地增加了。(3 ) 在 ODZ,的平均年度增加布满建筑物在长江三角洲区域的区域比在另外的区域显著地高;平均区域增加和增加的率布满建筑物在 KDZ 的区域比在另外的区域在西方的区域是更快的;平均年度区域生长布满建筑物在在东北的 APZ 的区域,中央、西方的区域平均象以前的十年一样两次高;在动态度的变化和增加的年度率布满建筑物区域在在中央区域的 KEFZ 是很著名的。(4 ) 空间模式和特征布满建筑物在时期 2010-2013 的区域扩大为 MFOZ 反映了计划的坡度特征。但是率局部地增加在布满建筑物在 ODZ, APZ 和 KEFZ 的区域是快的,有效措施必须因此在国家、地区性的政策的实现被采用。结论显示了这些方法,结果为在在中国优化国家陆地开发的未来规定策略是有意义的。

DOI

[16]
Meyfroidt P, Lambin E F, Erb K , et al. 2013. Globalization of land use: Distant drivers of land change and geographic displacement of land use.Current Opinion in Environmental Sustainability, 5: 438-444.Several streams of research have recently converged to identify the growing importance of distant drivers of land change, interconnections between social-ecological systems that are separated geographically, and the indirect consequences of land use changes. Local to national-scale interventions to promote sustainable land use may have unintended effects owing to a displacement of land use within and across countries. Such leakage or ‘indirect land use change’ critically depends on international geographies of trade. Computing various material flows and environmental indicators embodied in international trade highlights the differences between producer and consumer-based biophysical accounting. Causal attribution of the links between material and monetary flows across countries, and actual land changes and environmental impacts at local level requires a combination of economic simulation models, statistical studies, place-based empirical studies, value chain analyses, and biophysical accounting.

DOI

[17]
Mooney H A, Duraiappah A, Larigauderie A, 2013. Evolution of natural and social science interactions in global change research programs.Proceedings of the National Academy of Sciences, 110(1): 3665-3672.Efforts to develop a global understanding of the functioning of the Earth as a system began in the mid-1980s. This effort necessitated linking knowledge from both the physical and biological realms. A motivation for this development was the growing impact of humans on the Earth system and need to provide solutions, but the study of the social drivers and their consequences for the changes that were occurring was not incorporated into the Earth System Science movement, despite early attempts to do so. The impediments to integration were many, but they are gradually being overcome, which can be seen in many trends for assessments, such as the Intergovernmental Platform on Biodiversity and Ecosystem Services, as well as both basic and applied science programs. In this development, particular people and events have shaped the trajectories that have occurred. The lessons learned should be considered in such emerging research programs as Future Earth, the new global program for sustainability research. The transitioning process to this new program will take time as scientists adjust to new colleagues with different ideologies, methods, and tools and a new way of doing science.

DOI

[18]
Pflugmacher D, Cohen W B, Robert E K, 2012. Using Landsat-derived disturbance history (1972-2010) to predict current forest structure.Remote Sensing of Environment, 122: 146-165.78 Integration of Landsat MSS and TM/ETM+ for annual time-series analyses. 78 Revised Tasseled Cap coefficients for new MSS post-calibration coefficients. 78 We derived disturbance and recovery metrics from spectral trajectories. 78 Disturbance metrics predicted live biomass better than single-date Landsat data. 78 Disturbance metrics were good predictors of dead woody biomass.

DOI

[19]
Turner B L, Skole D, Sanderson S , et al. 1995. Land Cover Change Science/Research Plan, IGBP Report No.35, IHDP Report 7. IGBP of the ICSU and IHDP of the ISSC, Stockholm and Geneva.

[20]
Wang J, Chen Y Q, Shao X M , et al. 2012. Land-use changes and policy dimension driving forces in China: Present, trend and future.Land Use Policy, 29(4): 737-749.China has extremely scarce land resources compared to the world average. There is an urgent need for studies of the current situation and the trends in land-use change and assessment of the performance of land policies in China. Assessment of land-use change has long been hindered by a lack of accurate and reliable data. This paper uses the data obtained from the national land surveys of 1996 and land-use change surveys from 1997 to 2008, to analyze changes in land use and the policy dimension driving forces related to the changes, especially cultivated land, forestry land, grassland, as well as developed land. The aim of this analysis will be to derive the physical, social and economical driving forces of those changes to grasp the trends in land-use change and the effects of land policies and to formulate strategies for the protection and sustainable use of agricultural land. The results indicate that, although the overall change in land use was not large, cultivated land was significantly reduced and developed land rapidly increased. A great deal of high quality cultivated land was changed to developed land and low quality cultivated land generated from unused land, which has resulted in a serious threat to food supplies in China. Predictions using the methods of linear extrapolation and a BP neural network indicate that it is impossible to keep to a target of 0.12 billion hectares of cultivated land in the future under the mode of economic development used between 1996 and 2008. The results also indicate that the implementation of the laws and regulations about controlling the developed land and preserving cultivated land had significant effects on changes in land use, especially cultivated land and developed land. The results suggest that the changes in land use are closely related to economic fluctuation and the enaction and implementation of these land policies had a little time lag for cultivated land protection. There is a pressing need for China to use its limited land resources more efficiently and effectively by enacting or re-enforcing the laws and regulations on land resources protection and economic development, not only for its own growing population, but also the world. Therefore, we must formulate strategies for the protection and sustainable use of agricultural land.

DOI

[21]
Wright K C, Wimberly M C, 2013. Recent land use change in the Western Corn Belt threatens grasslands and wetlands.Proceedings of the National Academy of Sciences, 110(10): 4134-4139.

DOI

[22]
Wulder M A, White J C, Goward S N , et al. 2008. Landsat continuity: Issues and opportunities for land cover monitoring.Remote Sensing of Environment, 112: 955-969.Initiated in 1972, the Landsat program has provided a continuous record of earth observation for 35 years. The assemblage of Landsat spatial, spectral, and temporal resolutions, over a reasonably sized image extent, results in imagery that can be processed to represent land cover over large areas with an amount of spatial detail that is absolutely unique and indispensable for monitoring, management, and scientific activities. Recent technical problems with the two existing Landsat satellites, and delays in the development and launch of a successor, increase the likelihood that a gap in Landsat continuity may occur. In this communication, we identify the key features of the Landsat program that have resulted in the extensive use of Landsat data for large area land cover mapping and monitoring. We then augment this list of key features by examining the data needs of existing large area land cover monitoring programs. Subsequently, we use this list as a basis for reviewing the current constellation of earth observation satellites to identify potential alternative data sources for large area land cover applications. Notions of a virtual constellation of satellites to meet large area land cover mapping and monitoring needs are also presented. Finally, research priorities that would facilitate the integration of these alternative data sources into existing large area land cover monitoring programs are identified. Continuity of the Landsat program and the measurements provided are critical for scientific, environmental, economic, and social purposes. It is difficult to overstate the importance of Landsat; there are no other systems in orbit, or planned for launch in the short-term, that can duplicate or approach replication, of the measurements and information conferred by Landsat. While technical and political options are being pursued, there is no satellite image data stream poised to enter the National Satellite Land Remote Sensing Data Archive should system failures occur to Landsat-5 and -7.

DOI

[23]
Zhu Z, Woodcock C E, 2014. Continuous change detection and classification of land cover using all available Landsat data.Remote Sensing of Environment, 144: 152-171.61A new algorithm for Continuous Change Detection and Classification of land cover61All available (a total of 519) Landsat images from Path 12 Row 31 were used.61It can detect many kinds of land cover change continuously.61It can provide land cover maps for any given time.61The results were accurate both in change detection and classification.

DOI

Outlines

/