
Journal of Geographical Sciences >
Spatio-temporal pattern changes of land space in Hengduan Mountains during 1990-2015
Author: Shi Zhenqin (1988-), PhD, specialized in regional development and land space management in mountain areas. E-mail: kevinszq@163.com
*Corresponding author: Deng Wei (1957-), Professor, specialized in mountain environment and regional development.
E-mail: dengwei@imde.ac.cn
Received date: 2017-10-31
Accepted date: 2017-12-20
Online published: 2018-03-30
Supported by
Major State Basic Research Development Program of China, No.2015CB452706
Copyright
Hengduan Mountains offer land space for a variety of ecological services. However, the sustainable development and management of land space has been challenged by increased human activities in recent years. This paper performs the spatial pattern analysis of the quantitative and structural changes of various landscapes at different altitudes, and uses the land use data in 1990, 2000, 2010 and 2015 to reveal how various land patterns have changed. The results show that, within the production-living-ecological space schema, the ecological space dominates Hengduan Mountains, while the production and living space was mainly distributed in south region. During 1990-2015, the production-living-ecological spatial changes had been gradually accelerated and the regional differences had become more prominent. The agricultural production space had continuously decreased by 1132.31 km2, and the industrial and mining production space had rapidly increased by 281.4 km2 during 1990-2015. The living space had steadily increased, and the ecological space had increased with fluctuations. The land space pattern in Hengduan Mountains was greatly restricted by the terrain, such as altitude and slope. The implementations of China Western Development Strategy and the Returning Farmland to Forest Program had favorably promoted the changes of land spatial pattern in Hengduan Mountains.
SHI Zhenqin , ZHANG Shaoyao . Spatio-temporal pattern changes of land space in Hengduan Mountains during 1990-2015[J]. Journal of Geographical Sciences, 2018 , 28(4) : 529 -542 . DOI: 10.1007/s11442-018-1488-7
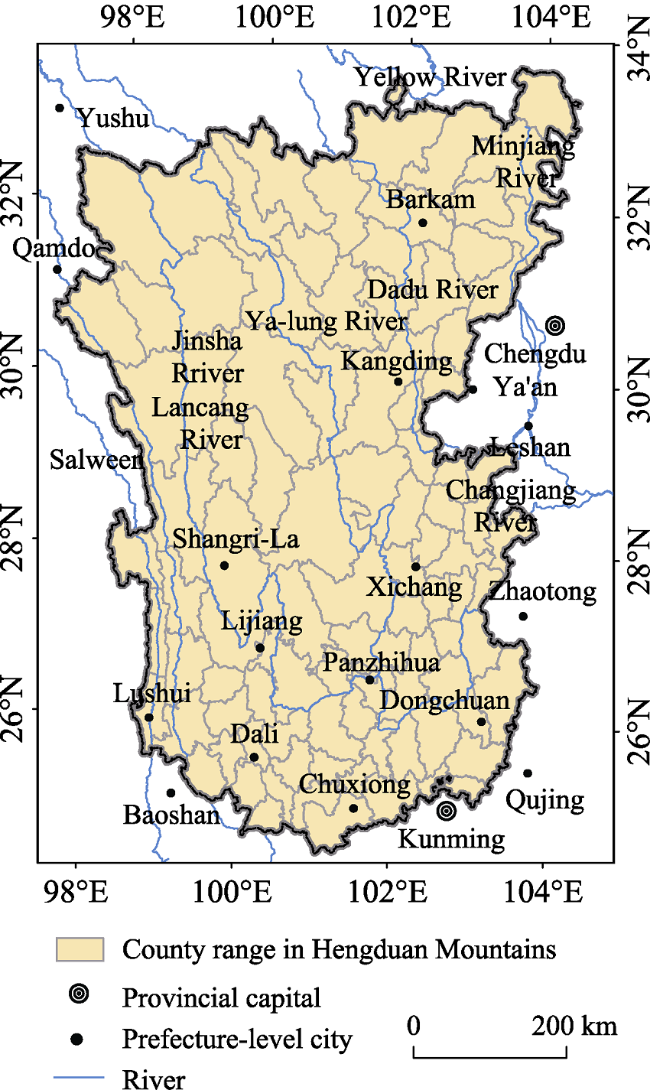
Figure 1 Location and area of Hengduan Mountains |
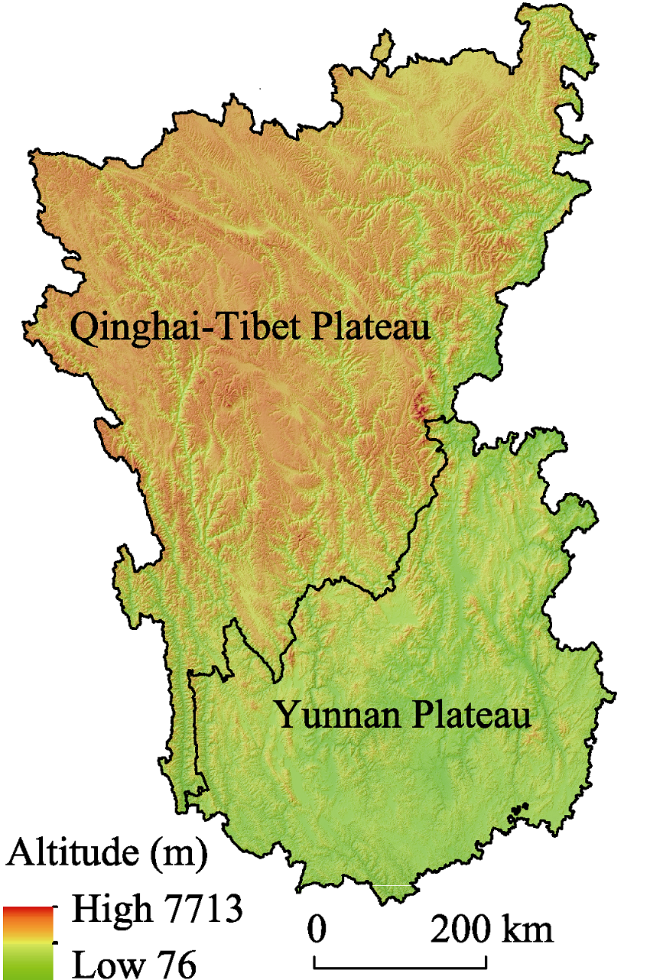
Figure 2 Hengduan Mountains terrain map |
Table 1 Connection between the classification system of territory space and land use |
| The production-living-ecological land space classification | The production-living- ecological land space, secondary classification | Second national land survey classification | Chinese Academy of Sciences land classification |
|---|---|---|---|
| Production space (PP) | Agricultural production space (APS) | 011 paddy field, 012 irrigated field, 013 dry land, 021 orchard, 022 tea garden, 023 other fields, 104 rural road, 122 agricultural facility land, 123 field ridge | 11 paddy field, 12 dry land |
| Industrial and mining production space (IMPS) | 061 industrial field, 062 mining field, 063 warehouse field, 101 railroad field, 102 highway land, 105 airport land, 106 port and dock land, 107 pipeline transportation land, 118 waterwork field, 204 mining field | 53 other construction field | |
| Service production space(SPS) | 088 scenic site facility field, 205 scenic site and special field | ||
| Living space (LP) | City and town living space (CTLS) | 201 city, 202 organizational town, 103 street and lane field, 087 park and green land, 21 idle land | 51 city and town land |
| Rural living space (RLS) | 203 village, 072 rural residential land | 52 rural residential area land | |
| Ecological space (EP) | Green ecological space (GES) | 031 forest land, 032 shrub land, 033 other woodland, 041 natural grassland, 042 artificial grassland, 043 other grassland | 21 forest land, 22 shrub land, 23 sparse woodland, 24 other woodland, 31 high coverage grassland, 32 medium coverage grassland, 33 low coverage grassland |
| Water ecological space (WES) | 111 river surface, 112 lake surface, 113 water reservoir surface, 114 pit and pod surface, 115 coastal shoal, 116 inland shoal, 119 glacier and firn, 125 swampland | 41 river and canal, 42 lake, 43 water reservoir, pit and pod, 44 glacier and firn, 45 sea shoal, 46 beach land | |
| Other ecological space (OES) | 124 saline and alkaline land, 126 sandy land, 127 bare land | 1 sandy land, 62 saline and alkaline land, 64 marshland, 65 bare land, 66 bare rock land, 67 others |
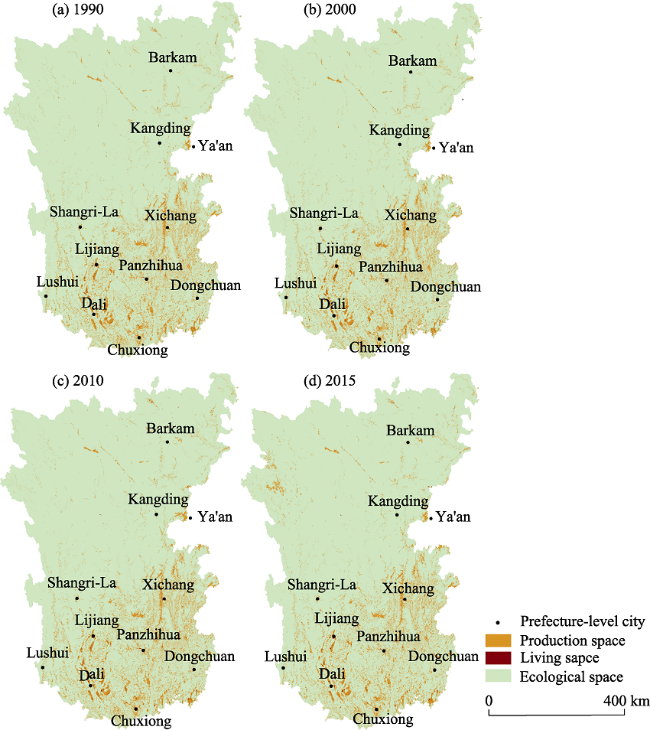
Figure 3 The production-living-ecological space pattern of Hengduan Mountains in four periods of time (a. 1990; b. 2000; c. 2010; d. 2015) |
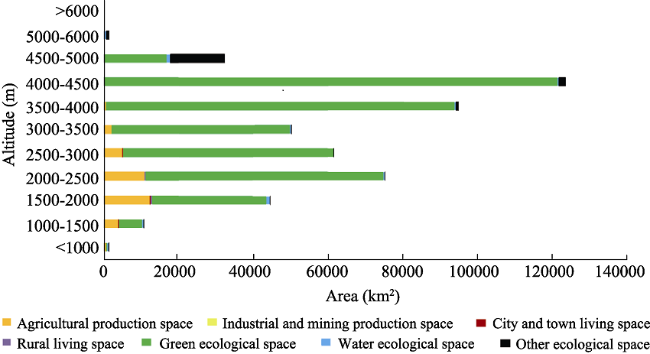
Figure 4 The changes of production-living-ecological space area at different altitudes |
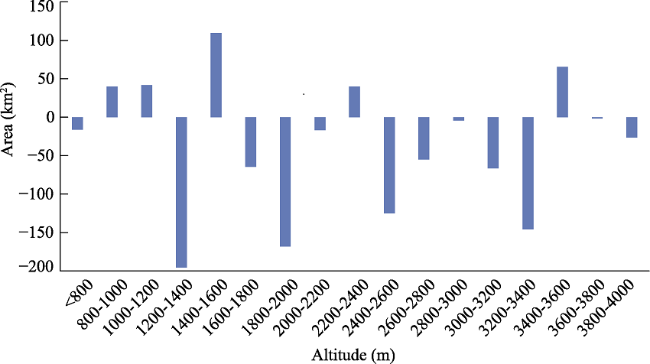
Figure 5 Area changes of agricultural production space each at 200 m altitude |
Table 2 The proportion of production-living-ecological space in the past 25 years (%) |
| 1990 | 2000 | 2010 | 2015 | |
|---|---|---|---|---|
| Production space | 7.70 | 7.65 | 7.65 | 7.55 |
| Living space | 0.17 | 0.19 | 0.23 | 0.24 |
| Ecological space | 92.13 | 92.16 | 92.12 | 92.21 |
Table 3 Annual changes of the ecological-production-living space from 1990 to 2010 (%) |
| Space type | 1990-2000 | 2000-2010 | ||||
|---|---|---|---|---|---|---|
| All | Qinghai-Tibet Plateau | Yunnan plateau | All | Qinghai-Tibet Plateau | Yunnan plateau | |
| Agricultural production space | -0.07 | 0.14 | -0.11 | -0.06 | 0.30 | -0.13 |
| Industrial and mining production space | 0.49 | 4.83 | 0.39 | 35.14 | 239.43 | 28.70 |
| City and town living space | 4.65 | 1.32 | 5.43 | 5.52 | 8.54 | 5.01 |
| Rural living space | 0.51 | 0.06 | 0.57 | 1.41 | 2.53 | 1.27 |
| Green ecological space | 0.01 | -0.01 | 0.05 | -0.01 | -0.02 | 0.00 |
| Water ecological space | -1.27 | 0.24 | -2.38 | 3.36 | 6.49 | 0.26 |
| Other ecological space | 0.11 | 0.11 | -0.05 | -0.28 | -0.30 | 0.26 |
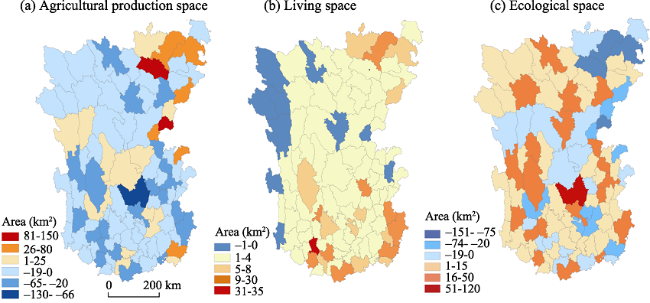
Figure 6 The difference of spatial change of the production-living-ecological space from 1990 to 2015 (a. agricultural production space; b. living space; c. ecological space) |
Table 4 Conversion matrix of land space of Hengduan Mountains from 1990 to 2015 (km2) |
| Year 2015 | Year 1990 | ||||||
|---|---|---|---|---|---|---|---|
| APS | IMPS | CTLS | RLS | GES | WES | OES | |
| APS | 28520.12 | 12.57 | 8.11 | 188.09 | 6495.86 | 128.81 | 20.75 |
| IMPS | 123.67 | 41.33 | 0.63 | 2.52 | 175.78 | 2.18 | 0.78 |
| CTLS | 168.31 | 0.36 | 121.63 | 6.53 | 29.24 | 1.96 | 0.38 |
| RLS | 156.43 | 1.77 | 0.97 | 349.26 | 72.61 | 8.11 | 0.17 |
| GES | 6835.38 | 4.07 | 5.33 | 46.93 | 422397.51 | 921.09 | 6108.36 |
| WES | 200.87 | 1.44 | 0.89 | 4.15 | 615.26 | 2214.58 | 43.71 |
| OES | 20.28 | 0.00 | 0.60 | 2.71 | 3264.26 | 31.32 | 13292.07 |
Table 5 Conversion matrix of land space area of Hengduan Mountains from 1990 to 2000 (km2) |
| Year 2000 | Year 1990 | ||||||
|---|---|---|---|---|---|---|---|
| IPS | IMPS | CTLS | RLS | GES | WES | OES | |
| APS | 35702.76 | 0.08 | 0.41 | 3.25 | 475.13 | 28.88 | 0.96 |
| IMP | 4.94 | 47.35 | 0.00 | 12.83 | |||
| CTLS | 61.64 | 136.97 | 1.49 | 4.02 | 0.30 | ||
| RLS | 26.00 | 1.57 | 609.55 | 4.17 | 7.12 | ||
| GES | 622.08 | 1.00 | 0.08 | 1.10 | 433296.83 | 574.62 | 237.20 |
| WES | 56.45 | 13.68 | 0.44 | 1.66 | 102.61 | 2744.67 | 11.91 |
| OES | 0.00 | 460.01 | 1.72 | 19252.74 | |||
Table 6 Conversion matrix of land space area of Hengduan Mountains from 2000 to 2010 (km2) |
| Year 2010 | Year 2000 | ||||||
|---|---|---|---|---|---|---|---|
| APS | IMPS | CTLS | RLS | GES | WES | OES | |
| APS | 33932.62 | 2.97 | 14.75 | 25.87 | 1985.39 | 36.41 | 8.39 |
| IMPS | 94.98 | 51.44 | 1.95 | 1.82 | 138.56 | 4.53 | 0.74 |
| CTLS | 110.93 | 0.09 | 177.82 | 6.70 | 21.09 | 0.55 | 0.18 |
| RLS | 92.42 | 1.88 | 2.80 | 591.34 | 49.54 | 1.51 | 0.06 |
| GES | 1896.59 | 8.00 | 5.47 | 14.92 | 429574.16 | 139.79 | 2567.86 |
| WES | 73.38 | 0.62 | 0.94 | 4.69 | 641.53 | 2744.57 | 453.11 |
| OES | 16.64 | 0.10 | 0.70 | 3.09 | 2444.73 | 4.90 | 16686.88 |
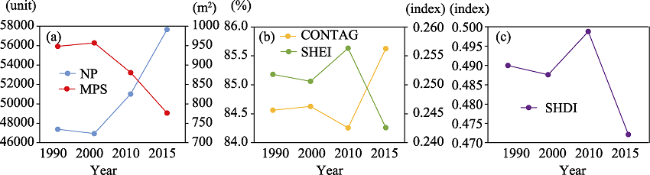
Figure 7 Landscape pattern index variation of territorial space in Hengduan Mountains |
Table 7 The parameters of standard deviational ellipse of the living space pattern in Hengduan Mountains |
| Year | Area (km2) | X axis standard deviation (km) | Y axis standard deviation (km) | Rotation angle (°) |
|---|---|---|---|---|
| 1990 | 139494.08 | 150.21 | 295.62 | 7.09 |
| 2000 | 139297.11 | 150.26 | 295.1 | 7.36 |
| 2010 | 145819.36 | 151.76 | 305.88 | 7.51 |
| 2015 | 150733.23 | 156.95 | 306.74 | 7.61 |
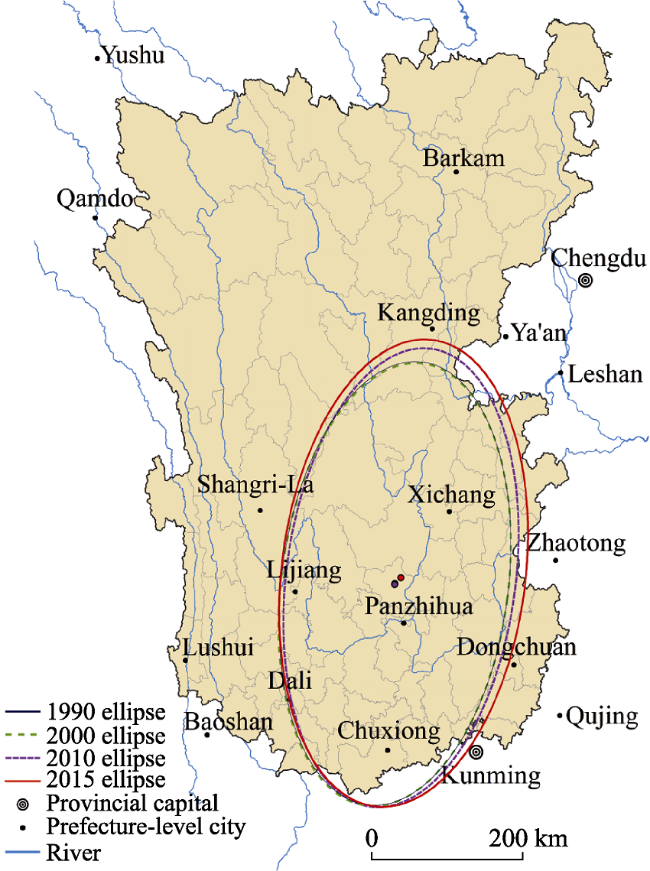
Figure 8 Change in standard deviational ellipse of living space in Hengduan Mountains |
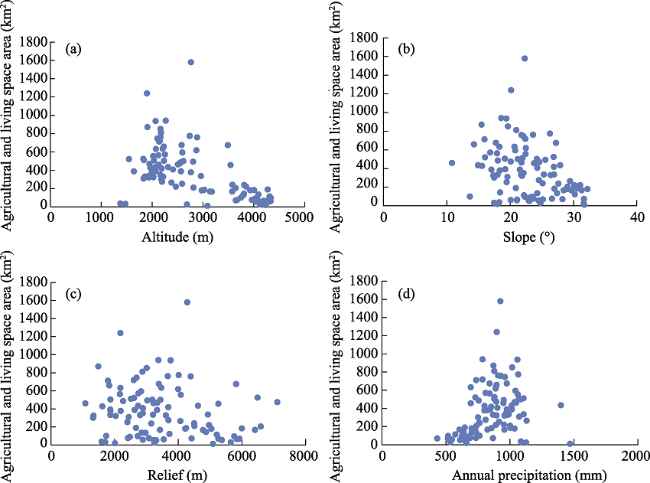
Figure 9 Relationship among natural elements, agricultural production and living space in Hengduan Mountains in 2010 (a. altitude; b. slope; c. relief; d. annual precipitation) |
Table 8 Coefficients of the production space regression model in Hengduan Mountains in 2010 |
| Variable | Unstandardized coefficient | Standardized coefficient | t | Sig. | |
|---|---|---|---|---|---|
| B | Std. Error | Beta | |||
| Grain yield | 0.003 | 0.000 | 0.705 | 10.731 | 0.000 |
| Elevation | -0.081 | 0.023 | -0.252 | -3.457 | 0.001 |
| Road network density | -7.250 | 2.289 | -0.192 | -3.167 | 0.002 |
| (Constant) | 433.936 | 86.152 | 5.037 | 0.000 | |
Notes: Dependent Variable: Production space areas R2=0.729 Adjusted R2=0.721 |
Table 9 Coefficients of the living space regression model in Hengduan Mountains in 2010 |
| Variable | Unstandardized coefficient | Standardized coefficient | t | Sig. | |
|---|---|---|---|---|---|
| B | Std. Error | Beta | |||
| Permanent residents | 0.00004 | 0.000 | 0.461 | 5.523 | 0.000 |
| Slope | -0.600 | 0.189 | -0.215 | -3.177 | 0.002 |
| Urban employment rate | 1.941 | 0.960 | 0.256 | 2.022 | 0.046 |
| Population density | -0.033 | 0.007 | -0.627 | -4.452 | 0.000 |
| Road network density | 0.902 | 0.322 | 0.504 | 2.801 | 0.006 |
| Urban per capita disposable income | 0.001 | 0.000 | 0.130 | 2.111 | 0.037 |
| (Constant) | -1.899 | 9.935 | -0.191 | 0.849 | |
Notes: Dependent Variable: Living space areas R2=0.732 Adjusted R2=0.715 |
The authors have declared that no competing interests exist.
| [1] |
|
| [2] |
|
| [3] |
|
| [4] |
|
| [5] |
|
| [6] |
|
| [7] |
|
| [8] |
|
| [9] |
|
| [10] |
|
| [11] |
|
| [12] |
|
| [13] |
|
| [14] |
|
| [15] |
|
| [16] |
|
| [17] |
|
| [18] |
|
| [19] |
|
| [20] |
|
| [21] |
|
| [22] |
|
| [23] |
|
| [24] |
|
| [25] |
|
| [26] |
|
| [27] |
|
| [28] |
|
| [29] |
|
| [30] |
|
| [31] |
|
| [32] |
|
| [33] |
|
| [34] |
|
/
| 〈 |
|
〉 |