
Journal of Geographical Sciences >
An analysis of the differentiation rules and influencing factors of venture capital in Beijing-Tianjin-Hebei urban agglomeration
Author: Fang Jiawen (1993-), Master’s Candidate, specialized in urban development and planning. E-mail: fangjiawen@g.ucla.edu
Received date: 2017-06-06
Accepted date: 2017-08-10
Online published: 2018-03-30
Supported by
Major Program of the National Natural Science Foundation of China, No.41590842
Copyright
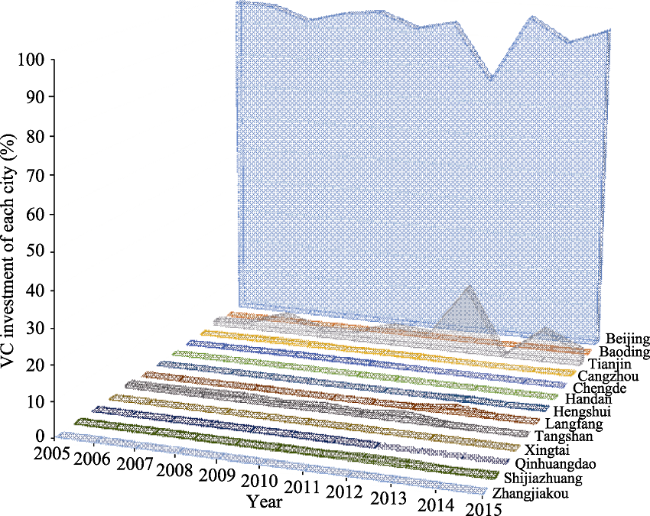
Under China’s innovation-driven development strategy, venture capital has become an important driving force in urban agglomeration integration and collaborative innovation. This paper uses social network analysis to analyze spatiotemporal differences of venture capital in the Beijing-Tianjin-Hebei urban agglomeration for the period 2005-2015. A gravity model and panel data regression model are used to reveal the influencing factors on spatiotemporal differences in venture capital in the region. This study finds that there is a certain cyclical fluctuation and uneven differentiation in the venture capital network in the Beijing-Tianjin-Hebei urban agglomeration in terms of total investment, and that the three centers of venture capital (Beijing, Shijiazhuang and Tangshan) have a stimulatory effect on surrounding cities; flows of venture capital between cities display certain networking rules, but they are slow to develop and strongly centripetal; there is a strong positive correlation between levels of information infrastructure development and economic development and venture capital investment; and places with relatively underdeveloped financial environments and service industries are less able to apply the fruits of innovation and entrepreneurship and to attract funds. This study can act as a reference for the Beijing-Tianjin-Hebei urban agglomeration in building a world-class super urban agglomeration with the best innovation capabilities in China.
FANG Jiawen . An analysis of the differentiation rules and influencing factors of venture capital in Beijing-Tianjin-Hebei urban agglomeration[J]. Journal of Geographical Sciences, 2018 , 28(4) : 514 -528 . DOI: 10.1007/s11442-018-1487-8
Figure 1 Total annual venture capital investment in the Beijing-Tianjin-Hebei urban agglomeration |
Table 1 Share of venture capital investment of each city in Beijing-Tianjin-Hebei (BTH) urban agglomeration |
| City | 2005 | 2010 | 2015 | |||||||||
|---|---|---|---|---|---|---|---|---|---|---|---|---|
| Total VC | % of national total | % of BTH | Rank in BTH | Total VC | % of national total | % of BTH | Rank in BTH | Total VC | % of national total | % of BTH | Rank in BTH | |
| Beijing | 142349.7 | 36.1 | 97.1 | 1 | 86339.3 | 19.8 | 92.1 | 1 | 63527.8 | 11.4 | 94.3 | 1 |
| Tianjin | 0.0 | 0.0 | 0.0 | 10 | 40.0 | 0.0 | 0.0 | 9 | 214.7 | 0.0 | 0.3 | 5 |
| Shijiazhuang | 1849.2 | 0.5 | 1.3 | 2 | 5079.0 | 1.2 | 5.4 | 2 | 2684.8 | 0.5 | 4.0 | 2 |
| Baoding | 300.0 | 0.1 | 0.2 | 5 | 300.0 | 0.1 | 0.3 | 5 | 297.0 | 0.1 | 0.4 | 4 |
| Cangzhou | 250.0 | 0.1 | 0.2 | 6 | 250.0 | 0.1 | 0.3 | 6 | 16.0 | 0.0 | 0.0 | 9 |
| Chengde | 0.0 | 0.0 | 0.0 | 10 | 0.0 | 0.0 | 0.0 | 13 | 4.0 | 0.0 | 0.0 | 12 |
| Hengshui | 48.0 | 0.0 | 0.0 | 8 | 48.0 | 0.0 | 0.1 | 8 | 205.0 | 0.0 | 0.3 | 6 |
| Langfang | 0.0 | 0.0 | 0.0 | 10 | 15.0 | 0.0 | 0.0 | 11 | 14.5 | 0.0 | 0.0 | 10 |
| Tangshan | 1250.6 | 0.3 | 0.9 | 3 | 1232.9 | 0.3 | 1.3 | 3 | 30.4 | 0.0 | 0.0 | 7 |
| Xingtai | 20.0 | 0.0 | 0.0 | 9 | 20.0 | 0.0 | 0.0 | 10 | 18.9 | 0.0 | 0.0 | 8 |
| Qinhuangdao | 126.7 | 0.0 | 0.1 | 7 | 126.7 | 0.0 | 0.1 | 7 | 6.0 | 0.0 | 0.0 | 11 |
| Handan | 349.2 | 0.1 | 0.2 | 4 | 330.0 | 0.1 | 0.4 | 4 | 330.2 | 0.1 | 0.5 | 3 |
| Zhangjiakou | 0.0 | 0.0 | 0.0 | 10 | 10.0 | 0.0 | 0.0 | 12 | 0.0 | 0.0 | 0.0 | 13 |
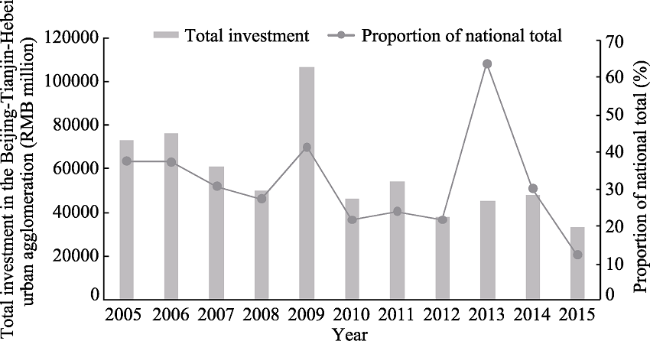
Figure 2 Annual changes in venture capital investment in cities of the Beijing-Tianjin-Hebei urban agglomeration |
Figure 3 Spatiotemporal distribution of venture capital in the Beijing-Tianjin-Hebei urban agglomeration |
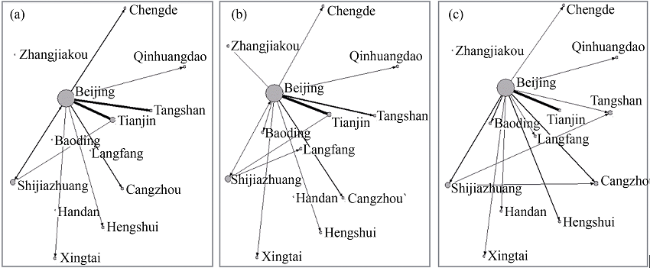
Figure 4 Venture capital network connections between cities in the Beijing-Tianjin-Hebei urban agglomeration |
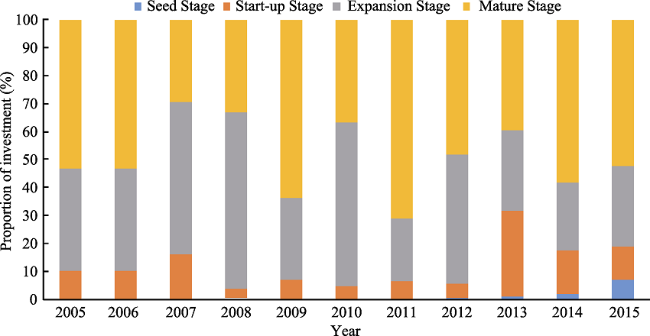
Figure 5 Distribution of venture capital in different stages of companies |
Table 2 Corresponding data indicators and explanations for influencing factors of venture capital in the Beijing-Tianjin-Hebei urban agglomeration |
| Variable type | Variable name | Data processing method | Corresponding data indicator | Data source |
|---|---|---|---|---|
| Dependent variable VC | Investment intensity VC | Inter-city investment VC | Inter-city investment VC | Zero 2 IPO Group China City Statistical Yearbook |
| Independent variable G | Economic Strength GE | 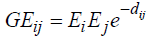 | GDP E | China City Statistical Yearbook |
| Service Strength GS | 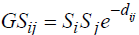 | Proportion of tertiary industry S | China City Statistical Yearbook | |
| Communication Strength GT | 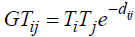 | Number of telephone and Internet users T | China City Statistical Yearbook | |
| Innovation Strength GC | 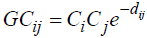 | Number of patents C (including invention patents, appearance designs and utility models) | China Patent Database | |
| Financial Strength GF | 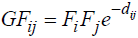 | Total deposits and loans of financial institutions at end of year F | China City Statistical Yearbook |

Table 3 Results of the panel data regression |
| Influencing factor | β (Urban gravity regression coefficient) |
|---|---|
| GE (Economic Strength) | 0.0399* |
| GS (Service Strength) | -0.2960* |
| GF (Financial Strength) | -0.0505* |
| GT (Communication Strength) | 0.0385*** |
| GC (Innovation Strength) | -0.1440*** |
| Cons (Constant) | 0.0014 |
| R2 (Overall) | 0.3511 |
t statistics in parentheses * p < 0.05, ** p < 0.01, *** p < 0.001 |
The authors have declared that no competing interests exist.
| [1] |
|
| [2] |
|
| [3] |
|
| [4] |
|
| [5] |
|
| [6] |
|
| [7] |
|
| [8] |
|
| [9] |
|
| [10] |
|
| [11] |
|
| [12] |
|
| [13] |
|
| [14] |
|
| [15] |
|
| [16] |
|
| [17] |
|
| [18] |
|
| [19] |
|
| [20] |
|
/
| 〈 |
|
〉 |