Research Articles

Regional inequality, spatial spillover effects, and the factors influencing city-level energy-related carbon emissions in China

  • SU Wensong , 1, 2, 3 ,
  • Liu Yanyan , 4 ,
  • WANG Shaojian 5 ,
  • ZHAO Yabo , 6 ,
  • SU Yongxian 7 ,
  • LI Shijie 5
Expand
  • 1. Institute of Geographic Sciences and Natural Resources Research, CAS, Beijing 100101, China
  • 2. University of Chinese Academy of Sciences, Beijing 100049, China
  • 3. Zhongguancun Development Group Co., Ltd., Beijing 100080, China
  • 4. School of Geography and Tourism, Guangdong University of Finance and Economics, Guangzhou 510320, China
  • 5. Guangdong Provincial Key Laboratory of Urbanization and Geo-simulation, School of Geography and Planning, Sun Yat-sen University, Guangzhou 510275, China
  • 6. School of Architecture and Urban Planning, Guangdong University of Technology, Guangzhou 510090, China
  • 7. Guangzhou Institute of Geography, Guangzhou 510070, China

Author: Su Wensong (1982-), PhD, specialized in urban geography. E-mail:

*Corresponding author: Liu Yanyan (1985-), PhD, E-mail:

Received date: 2017-05-01

  Accepted date: 2017-09-01

  Online published: 2018-03-30

Supported by

National Natural Science Foundation of China, No.41601151

Guangdong Natural Science Foundation, No.2016A030310149

Copyright

Journal of Geographical Sciences, All Rights Reserved

Abstract

Data show that carbon emissions are increasing due to human energy consumption associated with economic development. As a result, a great deal of attention has been focused on efforts to reduce this growth in carbon emissions as well as to formulate policies to address and mitigate climate change. Although the majority of previous studies have explored the driving forces underlying Chinese carbon emissions, few have been carried out at the city-level because of the limited availability of relevant energy consumption statistics. Here, we utilize spatial autocorrelation, Markov-chain transitional matrices, a dynamic panel model, and system generalized distance estimation (Sys-GMM) to empirically evaluate the key determinants of carbon emissions at the city-level based on Chinese remote sensing data collected between 1992 and 2013. We also use these data to discuss observed spatial spillover effects taking into account spatiotemporal lag and a range of different geographical and economic weighting matrices. The results of this study suggest that regional discrepancies in city-level carbon emissions have decreased over time, which are consistent with a marked spatial spillover effect, and a ‘club’ agglomeration of high-emissions. The evolution of these patterns also shows obvious path dependence, while the results of panel data analysis reveal the presence of a significant U-shaped relationship between carbon emissions and per capita GDP. Data also show that per capita carbon emissions have increased in concert with economic growth in most cities, and that a high-proportion of secondary industry and extensive investment growth have also exerted significant positive effects on city-level carbon emissions across China. In contrast, rapid population agglomeration, improvements in technology, increasing trade openness, and the accessibility and density of roads have all played a role in inhibiting carbon emissions. Thus, in order to reduce emissions, the Chinese government should legislate to inhibit the effects of factors that promote the release of carbon while at the same time acting to encourage those that mitigate this process. On the basis of the analysis presented in this study, we argue that optimizing industrial structures, streamlining extensive investment, increasing the level of technology, and improving road accessibility are all effective approaches to increase energy savings and reduce carbon emissions across China.

Cite this article

SU Wensong , Liu Yanyan , WANG Shaojian , ZHAO Yabo , SU Yongxian , LI Shijie . Regional inequality, spatial spillover effects, and the factors influencing city-level energy-related carbon emissions in China[J]. Journal of Geographical Sciences, 2018 , 28(4) : 495 -513 . DOI: 10.1007/s11442-018-1486-9

1 Introduction

Changes in global climate are most notably manifest as global warming, and are the result of the large-scale consumption of fossil fuels. This effect has become the most critical international environmental issue; since the signing of the ‘Kyoto Protocol’, a low carbon mode of economic development has gradually been accepted as important by most countries, while participating states at the 2009 Copenhagen World Climate Conference reached a basic consensus on emission reductions. China is the first developing country to propose energy saving and emission reduction aims; the Chinese government has committed to reduce the intensity of national carbon emissions to between 55% and 60% of the 2005 level by 2020 (Wang et al., 2017). In November 2014, the government also announced that China intends to reach a carbon emission peak around 2030 and that efforts will be made to realize this maximum level as soon as possible (The China-U.S. Joint Statement on Climate Change; Liu et al., 2016; Wang et al., 2016c, 2016d). In addition, numerous local governments within China have also developed their own low-carbon action plans, highlighting national determination in this area.
China has developed into one of the largest carbon emitting countries in the world because of the huge national level of energy consumption and the combined effects of an extensive model of development, an economic structure that emphasizes secondary industries, poor performance at reducing emissions, and inefficient environmental government (Cheng et al., 2013). A combination of energy savings and emission reductions are key to slowing global warming, and are also critical pathways for transforming the mode of economic development and upgrading industrial structures. However, the socioeconomic factors that are also implicated in carbon emissions are numerous (Zhang et al., 2013); thus, in the context of reducing emissions, it is helpful to both identify and quantify the factors that influence carbon emissions as well as their mechanisms in order to effectively formulate practical measures for mitigation (Deng et al., 2014). Research in this area is problematic, however, because the Chinese national department of statistics only discloses consumption balance tables for provinces and a few developed cities because of the national top-down energy system. Current research on Chinese carbon emissions is therefore restricted at both the national and regional level, and systematic studies on the mechanisms that influence emissions and strategies to reduce city-level CO2 production have rarely been undertaken (Su et al., 2013). Previous research has nevertheless demonstrated that between 60% and 80% of global energy is consumed by urban areas, and that more than 70% of greenhouse gas emissions around the world are derived from these areas. Urban areas have therefore become key targets for energy-saving and emission-reduction initiatives (GEA, 2012; IEA, 2012), and it is of paramount theoretical and practical significance to guide the development of low- carbon economies to perform research on the mechanisms that influence carbon emission reduction strategies by considering cities as basic analytical units.
Domestic and international scholars have carried out a great deal of recent research on carbon emissions and their development at different scales by applying four distinct methods. The first of these research themes has been focused on distinguishing the factors that influence carbon emissions via their structural decomposition analysis (SDA), an approach that is based on the analysis of input-output tables and models (Zhang, 2009; Wang, 2014; Wang et al., 2014a). For example, Wang et al. (2016a) performed research on the factors that influence carbon emissions in Xinjiang Province using improved IO-SDA technology and demonstrated that economy size and population are the key indexes that control carbon emission fluctuations. Similarly, in an earlier study, Feng et al. (2015) noted that economic growth in the United States between 1997 and 2007 was the most significant factor underlying increasing carbon emissions, while a change in energy structure between 2007 and 2013 was important because it led to a decrease. This kind of research is limited, however, because it is reliant on input-output tables for discontinuous intertemporal analyses; the influence of multiclass socioeconomic indicators cannot be fully investigated because the types of influencing factors included are limited. In contrast, the second research theme in this area has been founded on analysis of the extended and improved Kaya identity to understand the elements of energy consumption that make up carbon emissions via techniques such as index decomposition analysis (IDA) (He et al., 2012; Zhu et al., 2016). Thus, using LMDI for example, Wang et al. (2016b) were able to demonstrate that both population size and economic output efficiency have contributed to increasing carbon emissions from energy consumption in Xinjiang Province, while energy substitution and structural effects have contributed to reductions. Similarly, Yao et al. (2014) used IDA to show that economic and population growth are the most significant factors driving growth in the carbon emissions of G20 countries, while increases in energy efficiency and reductions in the intensity of emissions are key to curbing the ever expanding release of carbon into the atmosphere (Yao et al., 2014). The IDA method cannot be used, however, to perform residual decomposition of carbon emissions via identical transformation, while associated socioeconomic factors (e.g., transportation and trade) have seldom been taken into account (Yuan et al., 2013). The third research theme in this area is based on application of the computable general equilibrium model (CGE) which can be used to analyze combinations of economic structural optimization, levels of technology, the rate of clean energy alternatives, and differences in reduction policies. However, although the relationship between socioeconomic factors and carbon emissions can be simulated using a CGE model under general equilibrium conditions, these analyses are again based mainly on input-output tables, and it is therefore difficult to study variations in carbon emissions over time (Fan et al., 2010; Wang et al., 2015a, 2015b, 2015c). The fourth theme in this research area is based on the use of econometric models applied to analyze the different factors that influence carbon emissions (Wang et al., 2014a, 2015a) and includes metrological analyses that are applied to determine the time series of socioeconomic factors so that the dynamic effects of multiple indicators on carbon emissions can be investigated. It is noteworthy, however, that the four methods outlined above largely treat carbon emission units as homogeneous entities that are independent of one another and so ignore any spatial links and correlations. Although a small number of studies have addressed this issue (Zheng et al., 2011; Cheng et al., 2013), this research area comprises a form of spatial econometrics which does not take into account the ‘path dependence’ characteristics of carbon emissions or the ‘endogenous’ problem of the explanatory variable. At the same time, a spatial weight approach is also the simplest kind of adjacency matrix that can be constructed, so the effects of different weight matrices on results are not taken into account (Shao et al., 2016).
Building on the background presented above, this paper addresses the emissions of city units within China by utilizing a dynamic spatial panel data model to evaluate regional differences, spatial spillover effects, and the mechanisms underlying the release of carbon into the atmosphere. The Gini coefficient and Theil index were used initially to analyze regional differences in city-level carbon emissions, and a weight matrix encompassing three kinds of distance-space (i.e., geography, economy, and geography-economy) was constructed. The spatial spillover effects of city-level carbon emissions across China were then analyzed using spatial autocorrelation and Markov-chain methods, and a comprehensive factorial analysis was also carried out using a system generalized method of moments (SGMM) approach in order to take spatiotemporal and lags, as well as spatiotemporal hysteresis effects into account. Regional differences and spatial spillover effects in city-level carbon emissions across China are also summarized in this paper and the key factors that influence carbon emissions are highlighted in order to provide a scientific basis for the development of Chinese energy saving and emission reduction policies.

2 Data and methods

2.1 The spatial agglomeration characteristics of carbon emissions based on global and local autocorrelation analysis

The spatial spillover effects of city-level carbon emissions were tested in this study via ESDA spatial autocorrelation analysis. Global spatial autocorrelation is normally performed using Moran’s I coefficient, as follows (Wang et al., 2016c):
where m denotes the number of cities in the whole country, while ωij is the spatial weight matrix, and \(\overline{x}\)is the national average city-level carbon emissions. Building on this, and in order to perform a more comprehensive evaluation of the spatial correlation characteristics of city-level carbon emissions, a further two spatial weight matrices were established based on previous work. The first of these is the geospatial weight matrix (W1) in which weight (ωij) is represented by the reciprocal of distance between cities. Thus, taking into account the spatial associations between the economies of different cities, and to enhance the comparability of results, an economic distance weight matrix (W2) was also applied in this study; in this case, weight (ωij) is the inverse of the absolute difference between the per capita income of cities i and j. However, because deviation might also occur if spatial correlation is simply weighted geographically or economically, a nested matrix (W3) of these weights was also applied, as follows:
W3 = (1‒α)W1 + αW2 (2)
where α ranges between 0 and 1 and reflects the proportion of weights constructed by the economy. An α value of 0.5 was used in this study to reflect the fact that geospatial and economic weight are thought to be equal; however, the influence of geospatial weight is also considered in W3 which reflects the presence of a spatial spillover effect at the economic level and therefore enables the development of a comprehensive and objective correlation model for the carbon emissions of a city.
It is noteworthy that the atypical spatial characteristics of regional spaces are ignored in global spatial autocorrelation, while the use of this approach at the local level can compensate for this deficiency. Local Moran’s I index is commonly used in this context, as follows (Shao et al., 2016):
An Ii value greater than zero in this expression indicates the spatial clustering of high and low carbon emission cities forms high-high and low-low patterns, while an Ii less than zero is indicative of spatial dislocation, with cities forming high-low and low-high patterns.

2.2 Spatial spillover effects of carbon emissions based on Markov-chains

Spatial Markov-chain methods can be used to analyze the spatial interactions of city-level carbon emissions (i.e., spatial spillover effects). As a Markov-chain is a discrete process within this set (Pu et al., 2005), city-level per capita carbon emissions were initially divided into K types so that the probability of the total number occupied by each type as well as their future transition probability could be calculated (Wang et al., 2015c). Thus, the element mijt denotes the probability that city-level per capita carbon emissions will revert from type i to type j during a year from t to t+1. The probability matrix relationship of two adjacent years can therefore be expressed as follows:
Rt+1 = M × Rt (4)
where M is the transfer matrix of K × K, while Rt is the probability matrix of type K in year t (Wang et al., 2015c).
A spatial Markov-chain is formed from the combination of the standard method and spatial lag (Wang et al., 2015c). This kind of chain decomposes the traditional transfer matrix into a conditional one such that the element mijt(k) represents the transition probability of the carbon emission type from i to j in the year t+1, where the city-level per capita carbon emission type conforms to the spatial lag condition i in year t.
Comparing corresponding elements between spatial and non-spatial matrices makes it possible to determine the relationship between the probability of carbon emission transfer between neighboring cities. This approach also reveals the spatial spillover effects in city-level carbon emissions when different types of agglomerations neighbor one another; thus, if the type of carbon emissions from a neighboring city do not transfer in a given case, then all the corresponding elements in the two matrices will be the same (Wang et al., 2015c). Building on previous research in this area, the spatial spillover effect analysis presented here is based mainly on per capita indicators (Pu et al., 2005; Wang et al., 2015c).

2.3 Econometric models to explore the factors determining city-level carbon emissions

In order to more accurately reveal the factors that influence city-level carbon emission spillover effects, two dynamic panel data models were improved in this research to detect spatial dependence and error characteristics. City-level carbon emissions are expressed as follows (Shao et al., 2016):
In these expressions, CE refers to the per capita carbon emissions of a city, while i is the city cross-section, t is the year, X is the eigenvector formed with an independent variable, α1 and β1 are coefficient independent variable vectors, φit = εit and μit, εit, and μit are disturbance items which conform to normal distributions, ρ is the current spatial lag coefficient, γ is the lagged one phase lag effect coefficient, and λ is the spatial error coefficient.
The prerequisites of equations (5) and (6) are that city-level carbon emissions will change according to the factors influencing this variable and that there will be no hysteresis effect between the independent and dependent variables. In real situations, however, evolutionary trends in socioeconomic variables, including carbon emissions, exhibit obvious path dependent features; in other words, current changes are bound to be influenced by background levels at earlier times, while some of the key factors that affect city-level carbon release (e.g., population density, industrial structure, foreign direct investment) also exhibit obvious lag and dependency characteristics which may delay any expected changes in emissions. It is therefore of great practical significance to detect time lag effects in city-level carbon emissions; equations (5) and (6) were therefore locally adjusted to determine spatial hysteresis and error effects on the dynamic panel data model, as follows:
In these expressions, θ and θ' are the time lag coefficients used to measure the intensity of the time lag effect. As these indicate the effect of carbon emissions from the year before on current levels, it is worth noting that a dynamic spatial panel data model can be utilized to more comprehensively investigate the lag effect of city-level carbon emissions. The hysteresis effect detected in this study includes time, spatial, and spatiotemporal lags.

2.4 Variable selection

Environmental Kuznets curve (EKC) theory and the IPAT model were both applied in this study as they are the most common methods used to determine the factors that influence environmental stress. The panel form of the STIRPAT, an extended form of the IPAT model, is as follows:
where I, P, A, and T denote environmental pressure, population data, per capita income, and technological level, respectively, while e is the error term. The logarithm of both sides of this equation means that this model can be expressed as follows (Wang et al., 2016c):
One advantage of the STIRPAT model is that the coefficients a, b, c, and d can be estimated as parameters, which allows for the decomposition of variables. Thus, the term I in this expression denotes city-level per capita carbon emissions (CE), while one factor that influences the right side of this equation is population density (POPD). This variable was used to replace city-level population scale in this equation in order to explore the impact of agglomeration size on carbon emissions, as this factor usually exerts an influence via scale effects; on the one hand, an increase in population scale is bound to result in increased direct and indirect energy consumption which increases emissions, while on the other, because of population agglomeration effects, the level of science and technology will be improved to a certain extent, thereby reducing emissions. The second factor of interest that influences this relationship is economic growth (GDPPC), usually expressed on the basis of per capita gross domestic product (GDP). In order to test the traditional EKC hypothesis, the presence, or absence, of an inverted U-shaped curve can be determined between city-level per capita carbon emissions and economic growth; one of the aims of this study is to explore the relationship between carbon emissions and economic growth depending on linear and quadratic entries in per capita GDP. The third variable that is of interest in terms of the relationship expressed in equation (10) is technical level (TC). This is evaluated here on the basis of research and development investment which would be expected to increase in concert with TC even though relevant data on this variable is generally lacking at the city scale. The fourth variable of interest is industrial structure (SIND), a critical factor because the burning of fossil fuels from secondary industries (especially heavy industries) is a key component of anthropogenic carbon emissions. The ratio of added value of a secondary industry to GDP is used in this study to reflect the impact of industrial structures on city-level carbon emissions. The fifth variable of interest considered here is road network density (ROAD); this is important because when the traffic volume is the same, a higher density road network will mean lighter traffic congestion and thus a higher efficiency of vehicle exhaust emissions. Highway mileage per unit area was used in this study to explore the impact of traffic-related factors on city-level carbon emissions. The sixth variable considered of interest in this study is fixed asset investments (FAI); this variable is important because the bulk of Chinese city-level economic growth is investment-driven and so this exerts a significant impact on industrial restructuring and improvements in technological levels. City-level FAI was used in this study to evaluate the impact of carbon emissions that derive from investments. Finally, the seventh variable considered of interest in this study is ‘opening up to the world’ (TO). This was expressed here in terms of the proportion of actual foreign investment to GDP as a proxy for a correlation between the rate of economic ‘opening up’ and city-level carbon emissions. It is clear that the use of foreign capital can have two effects on carbon emissions; on the one hand, some researchers have argued that foreign investment will result in the importation of more environmentally friendly technology to improve energy efficiency and therefore reduce carbon emissions, while others have argued that this variable improves the carbon emissions of energy utilization via the transformation of high energy consumption and industries within the host country.

2.5 Data sources

Because of a national top-down energy statistical system, Chinese consumption balance tables are only available at the regional level, with the exception of a handful of developed cities. Two approaches were therefore applied to address missing data in historical city-level carbon emissions, the use of existing energy statistics and the inversion of nighttime light data (Liu et al., 2012; Su et al., 2014; Wang and Liu, 2017). Thus, the IPCC greenhouse gas emissions inventory and energy consumption carbon emissions based on city-level energy consumption data were initially utilized, followed by DMSP/OLS nighttime light images, city night light data, and statistics that compare gross nighttime light values. These data were then fitted to corresponding carbon emission statistics. In order to ensure the reliability of our carbon emission simulation values, comparisons were carried out for cities at the prefectural-level cities based on available statistical data; results show that the relative error between simulated and calculated carbon emission values is 7.65%. In other words, the accuracy of carbon emission proxies based on nighttime optical data is good and can be applied with relative accuracy to determine regional differences and impact mechanisms. In addition to city-level carbon emissions, other relevant data was extracted from the China City Statistical Yearbook, the China Statistical Yearbook for Regional Economy, and annual data compilations from relevant provinces and cities.

3 Results and discussion

3.1 Regional differences and spatial spillover effects in city-level carbon emissions

The initial focus of this study is on trends in city-level carbon emissions and the identification of regional differences. The data presented in Figure 1 reveal that city-level carbon emission per capita have increased year-by-year across China; between 1992 and 2013, national city-level carbon emissions per capita increased from 1.72 t to 10.37 t, an average annual growth rate of 8.93%. At the same time, however, values for the Gini coefficient reveal that regional differences in city-level carbon emissions have gradually narrowed over this time period; values for the Gini coefficient have gradually decreased from 0.72 in 1992 to 0.32 in 2013. Thus, although national city-level per capita carbon emissions have increased, differences between cities have gradually narrowed.
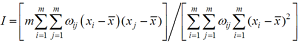
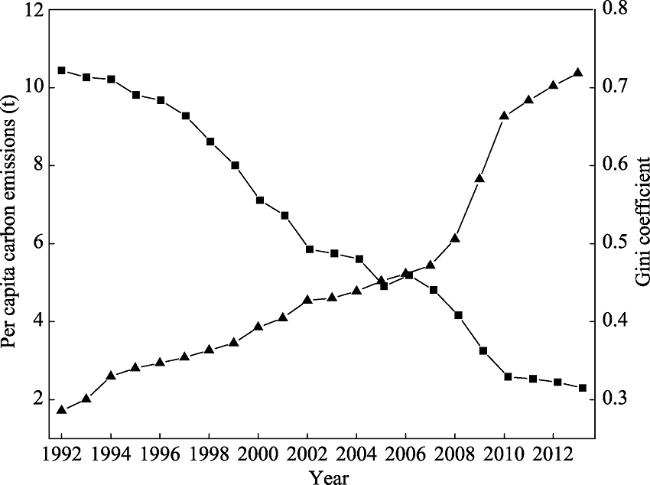
Figure 1 Average per capita carbon emissions at the city-level across China between 1992 and 2013 plotted alongside corresponding values for the Gini index
The Tyler index is another method that is commonly applied to measure regional differences; indeed, this approach is preferable to the use of Gini coefficients because regional inequalities within, and between, groups can be identified and thus this index is often used to analyze these contributions relative to overall regional differences. Analysis of regional inequalities in city-level per capita carbon emissions across the eastern, central, western, and northeastern regions of China (Figure 2) reveals that between 1992 and 1995, per capita carbon emission differences in eastern cities made the largest contribution to overall differences in city-level per capita totals, followed by western, central, inter-regional areas, and the northeast. In contrast, between 1995 and 2013, the contribution rate of per capita carbon emissions from western Chinese cities was the largest and gradually increased, while this rate among eastern cities gradually reduced, and weak fluctuations were seen in the contributions from all other regions. Although the per capita carbon emissions of eastern cities gradually increased over this time period, differences between the values for different agglomerations gradually narrowed, indicating that both the energy consumption and industrial structures of cities in this region converged and gradually transitioned to renewable energy and service industry-dominated structures. At the same time, the per capita carbon emissions of cities in western China have increased, as have their divergences; these data reveal significant differences in the degree of fossil fuel-based energy dependence in western Chinese cities throughout their economic growth.
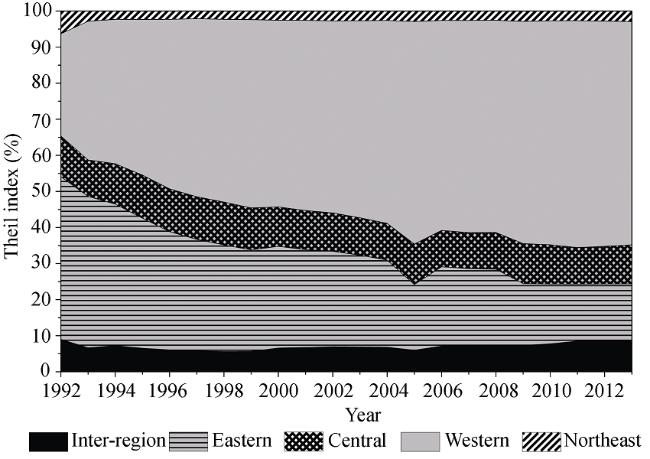
Figure 2 Contributions of regional inequalities within, and between, groups versus overall values of city-level per capita carbon emissions across China between 1992 and 2013
Although these results are clear, spatial correlations in data are not incorporated into the Gini coefficient, the Tyler index, or decomposition. This is important because the first law of geography notes that anything distributed in space is related to its associated attributes, and that this correlation is inversely proportional to spatial distance. Thus, if this spatial autocorrelation is neglected during analyses of the regional evolution of entities, our results will be seriously affected or biased. Spatial autocorrelations at different weights (i.e., W1, W2, and W3) were therefore calculated, and results reveal global Moran's I values​​ that are all greater than zero and have significance not less than one percent given the W1 and W3 weight matrices; this indicates that city-level per capita carbon emissions are positively correlated spatially between high-value and low-value agglomeration areas. In contrast, however, values for global Moran's I are not significant given the W2 economic weight matrix; this result indicates that city-level per capita carbon emissions do not share spatial correlation characteristics with economic differences, but rather are autocorrelated with the geographical and synthetic geography-economy spaces. This global spatial autocorrelation reflects the overall relationships within these data, but often ignores atypical characteristics within local areas. A further aim of this article is therefore to explore the characteristics of spatial per capita carbon emission clustering within local cities via the monitoring of these autocorrelations. A scatter plot of national city-level per capita carbon emissions within a geospatial weight matrix for three representative years is shown in Figure 3; the vertical axis in this figure denotes the spatial lag of city-level per capita carbon emissions, while the horizontal axis denotes standardized city-level per capita emissions. These data show (Figure 3) that most Chinese cities are located within the first and third quadrants in this matrix, which further highlights the fact that per capita carbon emissions exhibit both significant high and low group characteristics.
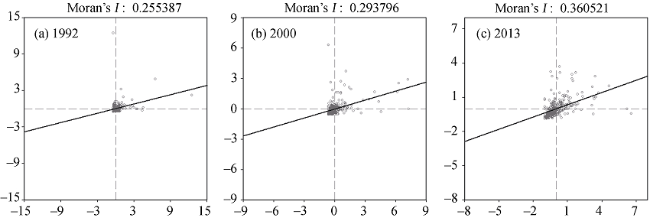
Figure 3 Scatter plots to show city-level per capita carbon emissions (Moran’s I) within a geospatial weight matrix for three selected years
Although spatial autocorrelation analysis can reveal the global and local spatial clustering characteristics of city-level per capita carbon emissions, this approach does not incorporate spatial spillover effects. To address this, comparisons between the results of Markov-chain transitional matrices and their spatial counterparts will help to better understand the dynamic spatial spillover effects of city-level per capita carbon emissions. In the first place, city-level per capita carbon emissions were classified as either at a low level (i.e., per capita carbon emissions at the national average of 50% or below), at a medium-to-low level (i.e., per capita carbon emissions within the national average range between 51% and 100%), at a medium-to-high level (i.e., per capita carbon emissions within the national average range between 101% and 150%), or at a high level (i.e., per capita carbon emissions above the national average of 150%). Next, in order to facilitate a comparative analysis, the research period encompassed by this study was divided into two, between 1992 and 2000 and between 2001 and 2013 (Figure 4 and Table 1). The elements on the diagonal in Table 1 denotes the probability that the type of city-level per capita carbon emissions remain unchanged, while all other components correspondingly indicate the probability of a change in the type of city-level per capita carbon emissions. All the diagonal elements in Table 1 are higher than their non-diagonal counterparts, which indicates that city-level carbon emissions are more likely to remain unchanged; indeed, the diagonal value is between 0.848 and 0.970, indicating a minimum probability of 84.8% that city-level carbon emissions will not transfer. In contrast, the maximum value on this diagonal is 0.071, indicating that the maximum probability of transformation in city-level carbon emissions is just 7.1%; data further reveal that even if the city-level carbon emission type changes, this transition will occur between two adjacent types. Leaps forward in the development of city-level carbon emissions are barely present in these data as the probability of such a transfer is almost zero; a city with an initially high level of carbon emissions is also characterized by a 92.8% probability that this will be retained in subsequent years, and an associated probability of just 7.2% that this level will fall. In contrast, a city with an initially low level of carbon emissions also has a minimum 94.9% probability of maintaining this into the future alongside a maximum probability of just 5.1% that emissions will increase. These results also show that distinct types of city-level carbon emissions are also characterized by a spatial spillover effect that converges with the evolutionary process. In general, the probability of city-level carbon emissions increasing was 17.9% between 1992 and 2000, while the probability of a reduction was 19%. Similarly, between 2001 and 2013, the probability of an increase was 13.5% and the probability of a reduction was 9.3%. The presence of these two distinct phases in transfer results for city-level carbon emissions indicates that the negative spillover effect of the first phase is significantly higher than that of the second.
Table 1 Markov-chain transitional matrices for Chinese city-level per capita carbon emissions between 1992 and 2013
n P (≤ 50%) L (between 51%
and 100%)
D (between 101%
and 150%)
R (≥ 150%)
Between 1992 and 2013
P 3,098 0.957 0.042 0.000 0.000
L 2,002 0.023 0.936 0.040 0.000
D 872 0.006 0.054 0.873 0.068
R 1,252 0.005 0.006 0.034 0.955
1992-2000
P 1,342 0.949 0.049 0.001 0.001
L 657 0.038 0.906 0.055 0.002
D 323 0.015 0.065 0.848 0.071
R 430 0.014 0.014 0.044 0.928
2001-2013
P 1,756 0.964 0.036 0.000 0.000
L 1,345 0.016 0.951 0.033 0.000
D 549 0.000 0.047 0.887 0.066
R 822 0.000 0.001 0.029 0.970

Abbreviations: P, low level; L, medium-to-low level; D, medium-to-high level; R, high level.

The spatial Markov-chain transitional matrix calculated in this study for Chinese per-capita city-level carbon emissions is presented in Table 2. The data presented in Tables 1 and 2 reveal that the probability of an upward movement in per capita carbon emissions is higher in cities adjacent to other high level ones, while the probability of a downward transfer is low, and vice versa. Between 1992 and 2000, for example, the probability of an upward transfer in a low-level city was 0.051, but this increased to 0.087 and 0.098 when an agglomeration was located adjacent to either a medium-to-low or medium-to-high level counterpart, and fell to 0.038 when two low level cities were located adjacent to one another. The probability of a high-level city downward transfer between 2001 and 2013 was 0.030, but this fell to 0.007 when two cities of this type were located adjacent to one another. Thus, the spillover effect direction between city-level neighbors exerts a significant impact on the development of an agglomeration and leads to the phenomenon of developmental path dependence. In general, both standard and spatial Markov-chain models provide a realistic and clear theoretical basis to understand path dependence in city development.
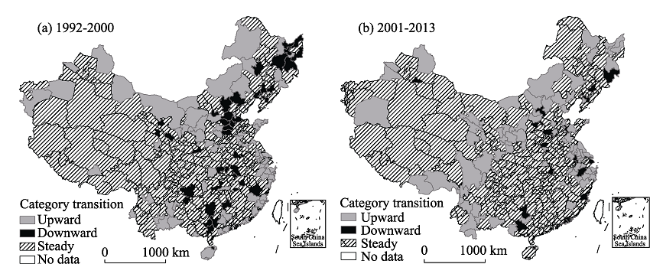
Figure 4 Spatial patterns in Chinese per capita carbon emissions at the city-level between 1992 and 2000 (a) and between 2001 and 2013 (b)
Table 2 Spatial Markov-chain transitional matrices for Chinese city-level per capita carbon emissions between 1992 and 2013
Between 1992 and 2000 Between 2001 and 2013
P L D R P L D R
P P 0.962 0.038 0.000 0.000 0.972 0.028 0.000 0.000
L 0.043 0.904 0.053 0.000 0.091 0.904 0.025 0.000
D 0.057 0.096 0.836 0.011 0.000 0.112 0.864 0.024
R 0.000 0.000 0.000 1.000 0.000 0.000 0.000 1.000
L P 0.913 0.087 0.000 0.000 0.946 0.054 0.000 0.000
L 0.027 0.926 0.047 0.000 0.042 0.942 0.016 0.000
D 0.017 0.154 0.818 0.011 0.000 0.063 0.916 0.021
R 0.000 0.000 0.066 0.934 0.000 0.000 0.064 0.936
D P 0.902 0.098 0.000 0.000 0.868 0.132 0.000 0.000
L 0.015 0.931 0.054 0.000 0.061 0.928 0.011 0.000
D 0.000 0.139 0.813 0.038 0.000 0.088 0.884 0.018
R 0.000 0.000 0.072 0.928 0.000 0.000 0.036 0.964
R P 1.000 0.000 0.000 0.000 0.784 0.216 0.000 0.000
L 0.015 0.931 0.054 0.000 0.075 0.914 0.011 0.000
D 0.000 0.108 0.863 0.029 0.000 0.000 0.908 0.092
R 0.000 0.000 0.013 0.987 0.000 0.000 0.007 0.993

Abbreviations as in Table 1.

3.2 Factors influencing city-level carbon emissions and policies for their reduction

The robust LM test was used in this study to compare spatial lag and the spatial error models and to determine which is more suitable for use in determining the key factors that influence city-level carbon emissions. Most previous studies of this type have compared the significance of the LM and robust LM statistics (LeSage et al., 2009); however, the data presented in Table 3 show that robust LM test results based on the spatial lag model are significantly higher than those derived from the spatial error model under the geospatial weight matrix (W1) and the geographically nested matrix of weight-economic weight (W3) which suggests that the former is more suitable for model parameter estimation than the latter. The results of the spatial lag model are therefore used as the basis for the analyses presented in this study, and it is also more effective to apply a system generalized distance estimation (Sys-GMM) approach to estimate a dynamic space panel model because of the endogenous problem of variables than to apply a general estimation method. The Sys-GMM approach also relies on time change trends in variables to automatically identify reasonable tools without having to specify a particular one.
Estimated results for the two spatial weight matrices, W1 and W3, are presented in Table 4. These data show that previous results published by Sargan and Arellano-Bond are in line with the requirements of Sys-GMM, and therefore corroborate the validity of the tool variables selected for use in this model. It is also noteworthy that when the sample tool variable is weak, this selection process might lead to an impact on, or cause a deviation from, Sys-GMM results. Results derived from a panel mixed least square method (PLOS) and panel fixed effect model (FE) are compared in this study to further corroborate Sys-GMM data; observations show that estimation coefficients derived from the PLOS method tend to transfer upwards, while those from the FE method tend to estimate downward result transfers. Thus, in cases where the estimated coefficients from Sys-GMM fall between the two, the validity of these results can be further corroborated. The data presented in Table 4 show that the city-level carbon emission time lag coefficient based on Sys-GMM is larger than that derived from PLOS estimations, and is smaller than that derived from FE; these results also show that Sys-GMM estimations are not anymore valid because of the choice of tool variables, and that coefficients based on this approach tend to be significantly higher than those from the other two methods. This suggests that the variable endogenous problem exerts an important effect on model estimation results. We therefore chose to apply a dynamic spatial panel data model to analyze the time reflection and spatial lag effects of city-level carbon emissions, while processing the variable endogenous problem via a Sys-GMM model. Further discussion is focused on the results estimated using the Sys-GMM model.
Table 3 LM test results using spatial panel models
LM test W1 weight matrix W3 weight matrix
χ2 p-value χ2 p-value
No lag 1675.474 0.000 1684.328 0.000
No lag (robust) 25.856 0.000 26.732 0.002
No error 1671.253 0.000 1669.529 0.000
No error (robust) 18.712 0.248 14.967 0.169
The time effect results generated in this study show that the lag coefficient, θ, for Chinese city-level per capita carbon emissions is both highly significant and positive with respect to geographic and geo-economic weights, which indicates the presence of a path dependence in these emissions; in other words, current levels of carbon emissions will have a certain impact on future ones. Results show that for every 1% increase in the current levels of carbon emissions, there will be a 0.7% increase in the next phase. Second, results show that the spatial lag coefficient, ρ, is also highly significant and positive with respect to geographic and geo-economic weights, which reflects the obvious spatial agglomeration characteristics of city-level per capita carbon emissions. Given W1 and W3 weight matrix settings, per capita carbon emissions will increase by about 1.08% for every 1% increase in neighboring cities. Third, the spatiotemporal lag coefficient, γ, of city-level per capita carbon emissions is significantly positive at the 1% level, again with respect to geographic and geo-economic weights; this indicates that a higher level of previous emissions in adjacent geographic or geo-economic areas will lead to a reduction in the emission levels of a given city.
This paper initially examined relationships in the EKC curve between economic growth and per capita carbon emissions. The data presented in Table 4 show that the primary coefficient of economic growth is significantly positive while the corresponding quadratic coefficient is significantly negative; these results are indicative of an inverted U-shaped relationship between city-level per capita carbon emissions and economic development. The per-capita carbon emission calculations presented in this study clearly reveal that most Chinese cities are still in a growth phase as their per capita GDP values are located to the left of the inflection point in this U-shaped curve; in other words, both carbon emission levels and the economic growth of these cities will continue to grow positively for some time into the future. The ‘decoupling’ phase between emissions and growth predicted by the traditional EKC hypothesis is not yet evident in these Chinese cities, but nevertheless further emphasizes the importance and urgency of both energy-saving and emissions reduction. The constraints of economic development have meant that growth is the primary focus for the vast majority of local governments; this is an issue because rapid economic growth is bound to lead to concomitant increases in carbon emissions. Cities cannot rely solely on the expense of economic growth to reduce their levels of carbon emissions, even in light of international and domestic pressure. This means that sustainable development should be emphasized in the future, and urban residents must be guided towards choosing low-carbon travel and green modes of consumption in order to reach a win-win situation of stable economic growth combined with a continued reduction in carbon emissions.
The negative effects of population density on city-level carbon emissions are also clear; in general, increases in population density influence carbon emissions in two main ways. The first of these is referred to as the agglomeration effect while the second is referred to as the scale effect. An increase in population density tends to lead to agglomeration effects, which increase the levels of technology, the shared proportion of public transport, and energy efficiency, while at the same time promoting the sharing of emission reduction facilities to reduce the release of carbon. At the same time, however, an increase in population density can also directly, or indirectly, lead to increasing energy consumption, the primary factor responsible for enhanced carbon emissions. A population density increase will also enhance traffic congestion, which also causes an increase in carbon emissions increase because of the inadequate combustion of motor vehicle fuel. The estimates presented in this study suggest that the agglomeration effect of population density is significantly higher than the scale effect; thus, any increase in energy efficiency brought about by population agglomeration is significantly greater than the corresponding increase in carbon emissions brought by a change in population scale. More attention should therefore be focused on enhancing the role of population agglomeration in energy efficiency in order to alleviate the impacts of associated scale effects on the future levels of carbon emissions.
Data reveal the significant negative effect of technological progress on city-level carbon emissions; progress in this area can have an impact via both production and emission reduction technologies. The former mainly acts on the productivity efficiency of various factors, while emission reduction technologies emphasize intensity; in other words, technological progress can promote reductions in energy intensity as well as lower carbon emissions, but also promote economic growth and increase carbon emissions. The results of this paper show that scientific expenditure across China has been effective in improving the levels of energy saving technology which has led to improvements in the efficiency of energy utilization, and has constrained city-level carbon emissions. This result also reminds us, however, to continue to increase investment in technological innovation and to improve research intensity as these variables play effective roles in both energy saving and the reduction of emissions.
An increase in the proportion of secondary industries across China has also had a significantly positive effect on city-level carbon emissions. As a result of the rapid development of industrialization, secondary industries, especially energy and high carbon intensive heavy industries, have developed rapidly to become the main driving force underlying Chinese economic development. Although positive, these industries are also the main contributors to city-level carbon emissions; these emission levels can be mitigated via industrial structural upgrades to phase out and eliminate out of date and traditional production techniques and replace them with high technological, value-added, intensive industries. The Chinese government promotes the optimization, transformation, and upgrade of industrial structures and has increased support for green industries as these are effective approaches to reduce carbon emissions.
Another way to significantly inhibit carbon emissions is to increase the density of the road network by more than 1%; thus, given the same volume of traffic, the higher the ROAD, the lighter the traffic congestion, and complete combustion of motor vehicle fuel also becomes more likely. The development of convenient and efficient public transport networks should also be a future priority as this enhances transport capacity, and the government should vigorously promote and enhance the low-carbon travel awareness of urban residents. All of these initiatives are important measures that can reduce carbon emissions.
The results of this study show that the estimated coefficient of fixed asset investment across China is significantly positive at the 1% level. This indicates that an increase in this kind of investment has also raised carbon emission levels; indeed, the rapid growth of Chinese city-based economies is driven by investment and thus energy dependence on fossil fuels is also increasing. Fixed asset investment in China is also mainly concentrated on secondary industries, the most energy-dependent sector of the economy characterized by carbon emissions that are much larger than those of their primary or tertiary counterparts. Extensive investment in secondary industries is also unfortunately not conducive to industrial restructuring as injections of funds are mainly used to enhance the use of technology in production rather than green processes. This has therefore resulted in an expansion in production and has had a positive influence on city-level carbon emissions. Chinese city governments should screen FAIs, prioritize low-carbon options, and improve thresholds for environmental funding in order to more actively promote progress in green technologies. Policies such as these would also serve to enhance the role of technological progress in mitigating some of the scale effects associated with carbon emissions.
An overall increase in the openness of China has also had a significant effect on reducing city-level carbon emissions. Indeed, the use of foreign capital can improve environmental quality via income and technology spillover effects, while increases in non-indigenous investment tends to expand the scale of production and improve the income levels of local residents, enabling funds to guarantee energy savings and emission reductions. The ecological awareness and desire for high quality environments of residents will also be enhanced in concert with increasing income levels, and this informal environmental regulation will force improvements and consequent reductions in city-level carbon emissions. Foreign direct investment (FDI) also introduces new environmentally friendly products and technologies which drive associated spillover effects, enhance green application levels, and reduce Chinese carbon emissions. City governments should therefore incorporate low-carbon screening into their vetting of FDI in order to improve its environment threshold. Full advantage should be taken of both technological benefits and spillover effects in improving environmental quality, as an approach to actively develop the function of FDI in reducing carbon emissions.
Table 4 Estimated results from the dynamic spatial panel data models applied in this study
Variable W1 weight matrix W3 weight matrix
PLOS FE Sys-GMM PLOS FE Sys-GMM
ln(CEt‒1(θ)) 0.864*** 0.266*** 0.703*** 0.864*** 0.268*** 0.702***
ωln(CE(ρ)) 1.455*** 1.622*** 1.082*** 1.396*** 1.624*** 0.179***
ωln(CEt‒1(γ)) 0.688*** 0.247*** 0.726*** 0.687*** 0.249*** 0.724***
ln(GDPPC) 0.578* 0.642*** 0.594*** 0.580 0.638*** 0.596***
ln(GDPPC)2 ‒0.017* 0.034** 0.026*** 0.019 0.035** 0.025***
ln(POPD) 0.142 ‒0.247** ‒0.386*** 0.104 ‒0.246** ‒0.388***
ln(TC) ‒0.053*** ‒0.049*** ‒0.064*** ‒0.054*** ‒0.048*** ‒0.064***
ln(SIND) 0.099*** 0.163*** 0.254*** 0.104*** 0.164*** 0.255***
ln(ROAD) ‒0.067* ‒0.123*** ‒0.154*** ‒0.066** ‒0.123** ‒0.155***
ln(FAI) 0.057*** 0.086*** 0.066*** 0.057*** 0.085*** 0.067***
ln(TO) ‒0.023* ‒0.018*** ‒0.027*** 0.023* ‒0.019*** ‒0.028***
Sargan P 0.675 0.663
AR(2) P 0.816 0.892

Abbreviations: *, significant at the 10% level; **, significant at the 5% level; ***, significant at the 1% level.

4 Conclusions

The analyses presented in this study are based on remote sensing data simulations of the carbon emissions of Chinese cities between 1992 and 2013. Regional differences in these emissions were initially analyzed using the Gini coefficient; results show that although per capita carbon emissions have increased over time, the differences between cities have gradually narrowed. Application of a decomposition model based on the Tyler index reveals that the differences among western Chinese cities have contributed to the largest extent to overall differences in carbon emissions, followed by contributions from eastern and central regions. The smallest contribution to overall emissions across China has been from interregional and northeastern regions. The application of three different spatial weight matrices shows that city-level carbon emissions across China are not characterized by the correlation features characteristic of economic development differences, but rather the presence of a group of high emission cities clustered within a geospatial and geo-economically integrated space. Dynamic analysis of classical Markov and spatial Markov matrices demonstrates that the evolution of city-level carbon emission types within China are also characterized by obvious features indicative of spatial spillover effects and path dependence, and that type transfers are significantly affected by the presence of adjacent cities. The probability of an upward transfer is enhanced when a city is located adjacent to one with higher-level emissions, while the reverse is true of downward transfers.
The application of a dynamic spatial panel data model in this study has enabled the quantitative identification of the key factors that influence city-level carbon emissions as well as a discussion of policies that could be applied to reduce emissions, given the constraints of time and spatial lag as well as the spatiotemporal hysteresis effect. The results of this study reveal the presence of a significant inverted U-shaped relationship between per capita carbon emissions and GDP, as well as the fact that levels of the former in most cities are still at a stage where they are certain to increase because of future economic growth. City-level per capita carbon emissions are also strongly influenced by secondary industry-oriented structures and an extensive increase in investment at this level. Although the results of this study show that the population agglomeration effect is higher than that of scale on city carbon emissions there is nevertheless a significant inhibitory effect even though its impact is small. Increases in the level of science and technology, openness, and road transportation network intensity all promote reduction in city-level carbon emissions. In future policy, it will be necessary to curb the factors that lead to increases while at the same time developing those that lead to decreases in order to effectively reduce city-level carbon emissions across China. The conclusions of this study are of great policy significance if we are to manage the low-carbon development of Chinese cities via socioeconomics. The national government should continue to optimize industrial structures, streamline extensive investment, increase the intensity research and development, and promote the accessibility of roads in order to realize future energy saving and emissions reduction targets.

The authors have declared that no competing interests exist.

[1]
Cheng Yeqing, Wang Zheye, Zhang Shouzhiet al., 2013. Spatial econometric analysis of carbon emission intensity and its driving factors from energy consumption in China. Acta Geographica Sinica, 68(10): 1418-1431. (in Chinese)The economic and social development has been facing with serious challenge brought by global climate change due to carbon emissions. As a responsible developing country, China pledged to reduce its carbon emission intensity by 40%- 45% below 2005levels by 2020. The realization of this target depends on not only the substantive transition of society, economy and industrial structure in national scale, but also the specific action and share of energy saving and emissions reduction in provincial scale. Based on the method provided by the IPCC, this paper examines the spatio-temporal dynamic patterns and domain factors of China's carbon emission intensity from energy consumption in 1997- 2010 using spatial autocorrelation analysis and spatial panel econometric model. The aim is to provide scientific basis for making different policies on energy conservation and carbon emission reduction in China. The results are shown as follows. Firstly, China's carbon emissions increased from 4.16 Gt to 11.29 Gt in 1997-2010, with an annual rate of 7.15%, which was much slower than that of annual growth rate of GDP(11.72%); therefore, China's carbon emission intensity tended to decline. Secondly, the changing curve of Moran's I indicated that China's carbon emission intensity from energy consumption has a continued strengthening tendency of spatial agglomeration at provincial scale. The provinces with higher and lower values appeared to be path-dependent or space-locked to some extent. Third, according to the analysis of spatial panel econometric model, it can be found that energy intensity, energy structure, industrial structure and urbanization rate were the domain factors that have impact on the spatio- temporal patterns of China's carbon emission intensity from energy consumption. Therefore, in order to realize the targets of energy conservation and emission reduction, we should improve the utilizing efficiency of energy, and optimize energy and industrial structure, and choose the low- carbon urbanization way and implement regional cooperation strategy of energy conservation and emissions reduction.

DOI

[2]
Deng Jixiang, Liu Xiao, Wang Zheng, 2014. Characteristics analysis and factor decomposition based on the regional difference changes in China’s CO2 emission.Journal of Natural Resources, 29(2): 189-200. (in Chinese)Based on the research and analysis about the characteristics and the law of evolution of CO2emission in the past 16 years(1995鈥2010) in China's eight regions, using the method of LMDI decomposition, the effects of China's CO2emission was decomposed into four influencing effects, which were population size effect, economic development effects, energy intensity effect and energy structure effect, the reason why China's CO2 emission showing regional differences was found. The results show that: 1) the amount of carbon emissions and per capita carbon emissions of eight regions showed an upward trend in the past 16 years. 2) The proportion of carbon emissions in the regions of Northeast China, Beijing and Tianjin as well as the eastern coastal zone showed a declining trend, other regions were showing an opposite trending or remaining unchanged. 3) Economic development effects have the strongest positive impact on carbon emissions, energy intensity effect has the strongest negative effect on carbon emissions. And 4) population size effect has a greater positive impact on the growth of CO2emission in regions including municipalities, economic development effects have a weaker positive impact on the growth of CO2emission in developed regions than other regions, energy intensity effect has an inhibition impact to the regions having an active economic restructuring, energy structure effect was affected by macroeconomic and national energy policy, which has a big fluctuation impact on carbon emissions.

DOI

[3]
Fan Ying, Zhang Xiaobing, Zhu Lei, 2010. Estimating the macroeconomic cost of CO2 emission abatement in China based on multi-objective programming.Advances in Climate Change Research, 6(2): 130-135. (in Chinese)The macroeconomic cost of CO2 emission abatement may be greatly different for countries in different development phases.Estimating this cost scientifically is of important scientific and practical significance.This paper estimates the macroeconomic cost of carbon dioxide (CO2) emission abatement in China,employing the inputoutput analysis with the multi-objective programming approach.The results show that the effect of abating CO2 emission on China's economy is significant.Under the present conditions,the estimated macroeconomic cost of CO 2 emission abatement for China in 2010 is approximately between 3100 RMB/t and 4024 RMB/t.The stronger the abatement actions are,the higher the macroeconomic cost of per unit emission reduction would be.Mining,oil industry,chemical industry,and metal smelting industry are high CO2-emission industries,but meanwhile they have more potential to abate their CO2 emissions.

DOI

[4]
Feng K S, Davis S J, Sun L Xet al., 2015. Drivers of US CO2 emissions 1997-2013.Nature Communications, 6: 7714.Fossil fuel CO2 emissions in the U.S. decreased by about 11% between 2007 and 2013, from 6,023 to 5,377 Mt. This decline has been widely attributed to a shift from coal to natural gas in U.S. electricity production. However, the factors driving the decline have not been quantitatively evaluated; the role of natural gas in the decline therefore remains speculative. Here, we analyze the factors affecting U.S. emissions from 1997 to 2013. Prior to 2007, rising emissions were primarily driven by economic growth. After 2007, decreasing emissions were largely a result of economic recession with changes in fuel mix (e.g., substitution of natural gas for coal) playing a comparatively minor role. Energy-climate policies may therefore be necessary to lock-in the recent emissions reductions and drive further decarbonization of the energy system as the U.S. economy recovers and grows.

DOI PMID

[5]
GEA, 2012. Global Energy Assessment: Toward a Sustainable Future. Cambridge, UK: Cambridge University Press.

[6]
He Xiaogang, Zhang Yaohui, 2012. Influence factors and environmental Kuznets curve relink effect of Chinese industry’s carbon dioxide emission: Empirical research based on STIRPAT model with industrial dynamic panel data. China Industrial Economy, (1): 26-35. (in Chinese)

[7]
IEA, 2012. World Energy Outlook 2012. Paris: International Energy Agency (IEA).

[8]
IPCC, 2007. Summary for Policymakers of Climate Change: The Physical Science Basis. 2007-06-30. [2017-04-10].

[9]
LeSage J P, Pace R K, 2009. Introduction to Spatial Econometrics, Boca Raton: Taylor and Francis.

[10]
Liu Z, Feng K S, Davis S Jet al., 2016. Understanding the energy consumption and greenhouse gas emissions and the implication for achieving climate change mitigation targets.Applied Energy, 184: 737-741.Understanding the energy consumption and greenhouse gas emissions and the implication for achieving climate change mitigation targets

DOI

[11]
Liu Z F, He C Y, Zhang Qet al., 2012. Extracting the dynamics of urban expansion in China using DMSP-OLS nighttime light data from 1992 to 2008.Landscape and Urban Planning, 106: 62-72.Timely and accurate information about the dynamics of urban expansion is vital to reveal the relationships between urban expansion and the ecosystem, to optimize land use patterns, and to promote the effective development of cities in China. Nighttime stable light data from the Defense Meteorological Satellite Program's Operational Line-scan System (DMSP-OLS) Nighttime Lights Time Series dataset provide a new source of information that can quickly reveal the dynamics of urban expansion. However, the DMSP-OLS sensor has no on-board calibration, which makes it difficult to directly compare time series data from multiple satellites. This study developed a new method for systematically correcting multi-year multi-satellite nighttime stable lights data and rapidly extracting the dynamics of urban expansion based on this corrected data for China from 1992 to 2008. The results revealed that the proposed method effectively reduced abnormal discrepancy within the nighttime stable light data and improved continuity and comparability. The dynamics of urban expansion in China from 1992 to 2008 were extracted with an average overall accuracy of 82.74% and an average Kappa of 0.40.

DOI

[12]
Pu Yingxia, Ma Ronghua, Ge Yinget al., 2005. Spatial-temporal dynamics of Jiangsu regional convergence with spatial Markov-chain approach.Acta Geographica Sinica, 60(5): 817-826. (in Chinese)Based on the per capita GDP dataset at the county level in Jiangsu province from1978 to 2000, this paper attempts to apply spatial Markov chains to investigate the spatial andtemporal characteristics of regional convergence in Jiangsu. Firstly, all the per capita GDPdata in Jiangsu are classified into 4 different classes by annual provincial average. Due to thechanges in the regional development strategies over time, the whole period is then dividedinto two sub-periods (1978-1990 and 1990-2000), and two Markov transition probabilitymatrices for these two periods are estimated respectively for comparison. Secondly, two kindsof maps are accordingly made in order to visualize spatial patterns of class transitions, one forregion, and the other for region and its neighbors. Finally, conditioning on each region'sspatial lag at the beginning of each year, spatial Markov matrices for the two different periodsare constructed. The conclusions are drawn as follows: (1) The process of regionalconvergence in Jiangsu has been globally characterized by "convergence clubs" since 1978,but this trend in the 1990s is sharpened and statistically different from that of the period from1978 to 1990. (2) Those regions and their neighbors that both experience upward mobility arelocated in southern Jiangsu, while the regions or their neighbors that move downwardly aremostly found in northern Jiangsu. (3) Regional per capita GDP class transitions in Jiangsu arehighly constrained by their geographical neighbors. If a poor region is surrounded by poorregions, the probabilities of moving upward for the periods from 1978 to 1990 and 1990 to2000 decrease to 0.148 and 0.025 respectively, while they average 0.2 and 0.042 in traditionalMarkov matrices. It suggests that poor regions are negatively affected when surrounded byother poor regions. Conversely, if a rich region is surrounded by rich neighbors, theprobabilities of moving upward for those two sub-periods increase to 1 and 0.991, while theyare 0.987 and 0.984 on average in traditional Markov matrices. It suggests rich regions arepositively influenced by other rich regions being surrounded. These empirical analyses providea spatial explanation to "convergence clubs" detected in traditional Markov method.

[13]
Shao Shuai, Li Xin, Cao Jianhuaet al., 2016. China’s economic policy choices for governing smog pollution based on spatial spillover effects. Economic Research, (9): 73-88. (in Chinese)Using PM2. 5concentrations data at China's provincial level over 1998鈥2012,we adopt dynamic spatial panel model and SGMM to empirically identify the key determinants of smog pollution and discuss the corresponding smog-governing policies. The results indicate that China's smog pollution presents an obvious spatial spillover effect and high-emission"club"agglomeration. There is a significant U-shape curve relationship between smog pollution and economic growth,and smog pollution is worsening with economic growth in most eastern provinces. Due to high-proportion secondary industry,coaldominated energy structure,rapid population agglomeration,and increasing highway traffic intensity,China's smog pollution is increasingly heavy,while the improvement of RD intensity and energy efficiency do not play an expectant role in mitigating smog pollution. Therefore,the underlying cause of heavy smog pollution is that its promotion factors are not effectively restrained while its mitigation factors are not significantly performed. China's smog pollution presents the characteristics of the snowball effect,leakage effect,and warning effect. Hence,smog-governing policy should be implemented based on the strategies of unswerving effort,regional joint prevention and control,and punishing one to warn others.

[14]
Su Yongxian, Chen Xiuzhi, Ye Yuyaoet al., 2013. The characteristics and mechanisms of carbon emissions from energy consumption in China using DMSP/OLS night light imageries.Acta Geographica Sinica, 68(11): 1513-1526. (in Chinese)It is critical for China to make the emission reduction targets and development of the scientific emission reduction planning in the future.On the basis of the DMSP/OLS night light imageries,this research estimates the China's city-level carbon emissions from 1992 to 2010.This makes up the vacancies of statistical carbon emission data and overcomes the inconsistence of statistical carbon emission methods.Analysis results from three scales(the whole mainland of China,4 economic regions and 6 urban agglomerations) show that the national CO2 emissions grew continually,but varied from place to place.What is more,the spatial agglomeration of China's CO2 emissions has become more and more obvious,which have led to the current CO2 emission pattern鈥"high-high concentration in eastern coastal cities and low-low concentration in western undeveloped cities".The carbon emission intensity of per capita basically maintains as the "Eastern Northeastern Western Central" pattern.The carbon emission intensity of per GDP shows the "Higher in Northeastern and Western China" and "Lower in Eastern and Central China" pattern.Growth rate of GDP is the major factor affecting the increasing speed of carbon emissions.Energy structures,energy efficiencies,industrial structures are the three main factors influencing the carbon intensities.As for the Western and Northeastern regions,whose industries are mainly energy-related and heavy ones,their best mitigation policies should be optimizing the energy structure and increasing energy use efficiently.

DOI

[15]
Su Y X, Chen X Z, Li Yet al., 2014. China’s 19-year city-level carbon emissions of energy consumptions, driving forces and regionalized mitigation guidelines.Renewable and Sustainable Energy Reviews, 35: 231-243.Due to the lack of city-level energy consumption statistics and the inconsistency between national, provincial and city-level data, we developed a normalized approach for assessing China07s city-level CO2 emissions of energy consumptions using DMSP/OLS nighttime light imageries and explored major driving forces for proposing feasible mitigation policies. China07s CO2 emission process was always consistent with its economic development and was classified into two rapid periods (1999–2002 and 2007–2010) and two slow periods (1992–1999 and 2002–2007). Most cities in Western, Central and Northern China belonged to the slow growth type, while most cities in Eastern China belonged to the rapid growth type. Cities with huge CO2 emissions mainly congregated in southern and eastern coastal areas. Contrarily, cities with small amount of CO2 emissions were mainly located in southwestern inlands. The CO2 emission per capita (PCCE) in Northeastern and Eastern China was higher than that of Western and Central China. While the CO2 emission per GDP (PGCE) of Northeastern and Western China was higher than that of Eastern and Central China. GDP increment was the major factor determining the carbon-emission growth rate, while industry structures and energy efficiencies were the major factors influencing regional CO2 emission intensities. Therefore, in order to decrease the growth rate of China07s CO2 emissions but not hinder its economic development, major efforts should be focused on optimizing the industrial structures in Eastern and Central China where industries mainly belonged to technology-intensive, labor-intensive and light industry types, and guiding companies to increase the energy efficiencies in Northeastern and Western China, where industries mainly belonged to heavy and energy-related types. In particular, more attention should be paid to prevent the CO2 emissions per energy consumption (PECE) of underdeveloped cities or provinces from increasing rapidly rather than only focusing on reducing the PECE of developed regions.

DOI

[16]
Wang Changjian, Wang Fei, Zhang Hongou, 2016a. The process of energy related carbon emissions and influencing mechanism research in Xinjiang.Acta Ecologica Sinica, 36(8): 2151-2163. (in Chinese)

[17]
Wang Changjian, Zhang Xiaolei, Zhang Hongouet al., 2016b. Influencing mechanism of energy-related carbon emissions in Xinjiang based on IO-SDA model.Acta Geographica Sinica, 271(7): 1105-1118. (in Chinese)Global warming and climate change are issues that have aroused widespread attention, and the need for a transition to a low-carbon economy has become the consensus of the international community. China has become one of the world's largest energy consumers, as well as one of the biggest emitters of greenhouse gases. This further highlights the importance and urgency of research on carbon emissions from energy consumption. Based on regional perspectives of the impacts of carbon emissions, the analysis of mechanisms responsible for carbon emissions has become an important research topic. Xinjiang, an important Chinese energy production base, is currently going through a period of strategic opportunities for rapid development. It is critical to ensure stable socioeconomic development as well as to achieve energy savings and meeting emission reductions targets, thus the harmonious development of "society- economy- energy- environment," is the key issue currently facing the region. This study, based on the input- output theory, presents a structural decomposition analysis of the factors affecting energy consumption and carbon emissions in Xinjiang from 1997- 2007. This analysis employs a hybrid input- output analysis framework of "energy- economy- carbon emissions," and uses an extended IO- SDA model. The data for this study come from the Xinjiang input-output table for 1997-2002-2007. Population, economic, and energy source data are derived from the Statistical Yearbook of the Xinjiang Uygur Autonomous Region.(1)Xinjiang's carbon emissions from energy consumption increased from 20.70 million tons in1997 to 40.34 million tons in 2007; carbon emissions growth was mainly concentrated in the production and processing of energy resources, the mining of mineral resources, and the processing industry.(2) The analysis of the direct effects of the influencing factors on carbon emissions shows that the change in per capita GDP, final demand structure, population scale,and production structure were the important factors causing an increase in carbon emissions,while the decrease in carbon emission intensity during this period was an important factor in stopping the growth of carbon emissions. This shows that while Xinjiang's economy and population were growing, the economic structure had not been effectively optimized and production technology had not been improved, which results in a rapid growth of carbon emissions from energy consumption.(3) An analysis of the indirect effects of the factors influencing carbon emissions shows that inter- provincial transfers, gross fixed capital formation, and consumption by urban residents had significant influence on the changes in carbon emissions from energy consumption in Xinjiang.(4) The growth of investments in fixed assets of carbon-intensive industry sectors, as well as the growth of inter-provincial transfers of energy resource products, makes the transfer effect of inter- area "implicit carbon" very significant.

DOI

[18]
Wang Lei, 2014. Prediction of carbon emissions in Tianjin based on the input-output model.Ecological Economy, 30(1): 51-56. (in Chinese)Tackling climate change has become the current international environmental issues in the world. Based on measurement of historical carbon emissions and analysis of main factors that affect regional carbon emission levels in Tianjin, economic energy input-output model that fully consider hidden carbon dioxide emissions from intermediate products using was build to make multi-scene scientific predictions of regional carbon emissions for policy enacting and prediction method innovation of low carbon.

[19]
Wang S J, Fang C L, Guan X Let al., 2014a. Urbanization, energy consumption, and carbon dioxide emissions in China: A panel data analysis of China’s provinces. Applied Energy, 136: 738-749.Global warming resulting from rapid economic growth across the world has become a worldwide threat. The coordination of development of urbanisation, energy consumption, and carbon dioxide (CO2) emissions therefore forms an important issue; it has attracted considerable attention from both governments and researchers in recent years. This study investigated the relationship between urbanisation, energy consumption, and CO2 emissions over the period 1995鈥2011, using a panel data model, based on the data for 30 Chinese provinces. The potential to reduce CO2 emissions was also analysed. The results indicated that per capita CO2 emissions in China were characterised by conspicuous regional imbalances during the period studied; in fact, per capita CO2 emissions decrease gradually from the eastern coastal region to the central region, and then to the western region. Urbanisation, energy consumption, and CO2 emissions were found to present a long run bi-directional positive relationship, the significance of which was discovered to vary between provinces as a result of the scale of their respective economies. In addition, a bi-directional causal relationship was found to exist between urbanisation, energy consumption, and CO2 emissions: specifically, a bi-directional positive causal relationship exists between CO2 emissions and urbanisation, as well as between energy consumption and CO2 emissions, and a one way positive causal relationship exists from urbanisation to energy consumption. Scenario simulations further demonstrated that whilst China鈥檚 per capita and total CO2 emissions will increase continuously between 2012 and 2020 under all of the three scenarios developed in this study, the potential to achieve reductions is also high. A better understanding of the relationship between urbanisation, energy consumption, and CO2 emissions will help China to realise the low-carbon economic development.

DOI

[20]
Wang S J, Fang C L, Ma H Tet al., 2014b. Spatial differences and multi-mechanism of carbon footprint based on GWR model in provincial China. Journal of Geographical Sciences, 24(4): 804-822.Global warming has been one of the major concerns behind the world's high-speed economic growth. How to implement the coordinated development of the carbon footprint and the economy will be the core issue of the world's economic and social development, as well as the heated debate of the research at home and abroad in recent years. Based on the energy consumption, integrated with the "Top-Down" life cycle approach and geographically weighted regression(GWR) model, this paper analyzed the spatial differences and multi-mechanism of carbon footprint in provincial China in 2010. Firstly, this study calculated the amount of carbon footprint of each province using "Top-Down" life cycle approach and found that there were significant differences of carbon footprint and per capita carbon footprint in provincial China. The provinces with higher carbon footprint, mainly located in northern China, have large economic scales; the provinces with higher per capita carbon footprint are mainly distributed in central cities such as Beijing, Shanghai and energy-rich regions and heavy chemical bases. Secondly, with the aid of GIS and spatial analysis model(GWR model), this paper had unfolded that the expansion of economic scale is the main driver of the rapid growth of carbon footprint. The growth of population and urbanization also acted as promoting factors for the increase of the carbon footprint. Energy structure had no considerable promoting effect for the increase of the carbon footprint. Improving energy efficiency is the most important factor to inhibit the growing carbon footprint. Thirdly, developing low-carbon economies and low-carbon industries, as well as advocating low-carbon city construction and improving carbon efficiency would be the primary approaches to inhibit the rapid growth of carbon footprint. Moderately controlling the economic scale and population size would also be required to alleviate carbon footprint. Meanwhile, environmental protection and construction of low-carbon cities would evoke extensive attention in the process of urbanization.

DOI

[21]
Wang S J, Fang C L, Wang Y, 2016c. Spatiotemporal variations of energy-related CO2 emissions in China and its influencing factors: An empirical analysis based on provincial panel data.Renewable & Sustainable Energy Reviews, 55: 505-515.This paper examines carbon dioxide (CO2) emissions from the perspective of energy consumption, detailing an empirical investigation into the spatiotemporal variations and impact factors of energy-related CO2 emissions in China. The study, which is based on a provincial panel data set for the period 1995鈥2011, used an extended STIRPAT model, which was in turn examined using System-Generalized Method of Moments (Sys-GMM) regression. Results indicate that while per capita CO2 emissions in China were characterized by conspicuous regional imbalances during the period studied, regional inequality and spatial autocorrelation (agglomeration) both decreased gradually between 1995 and 2011, and the pattern evolutions of emissions evidenced a clear path dependency effect. The urbanization level was found to be the most important driving impact factor of CO2 emissions, followed by economic level and industry proportion. Conversely, tertiary industry proportion constituted the main inhibiting factor among the negative influencing factors, which also included technology level, energy consumption structure, energy intensity, and tertiary industry proportion. Importantly, the study revealed that the CO2 Kuznets Curve (CKC), which describes the relation between CO2 emissions and economic growth, in fact took the form of N-shape in the medium- and long-term, rather than the classical inverted-U shape of the environmental Kuznets Curve (EKC). Specifically, an additional inflection appeared after the U-shape relationship between economic growth and CO2 emissions, indicating the emergence of a relink phase between the two variables. The findings of this study have important implications for policy makers and urban planners: alongside steps to improve the technology level, accelerate the development of tertiary industry, and boost recycling and renewable energies, the optimization of a country鈥檚 energy structure that can in fact reduce reliance on fossil energy resources and constitute an effective measure to reduce CO2 emissions.

DOI

[22]
Wang Shaojian, Fang Chuanglin, Wang Yanget al., 2013. The directions and mechanisms of regional inequality in Guangdong province.Geographical Research, 32(12): 2244-2256. (in Chinese)Regional inequality is an important issue in geographical research and regional development studies. China's market reform and economic growth have aroused considerable attention to the issue of inequality and social justice. The recent research on economic geography indicates that regional inequality has been playing an important part in coordinated development of regional economy. Although regional inequality is a hot issue in research at home and abroad,the current research ignores the directions as well as the main scalar for regional inequality. With the availability of data,this paper,based on the framework of "Optimal scale,Overall trend,Direction for inequality,Mechanism factors",employs conventional global inequality indexes,scale variance,particular direction index and multi-level regression analysis to examine the regional inequality in Guangdong province from 1978 to 2011. Firstly,with the scale variance and its decomposition,we find that there is an increasing sequence according to the scale variances and their decomposition,which reveals that the scalar variance lower at the smaller scale contributes more to the whole regional inequality. Secondly,we use conventional global inequality indexes including coefficient variance,Gini coefficient,Theil index,Global entropy index and Atkinson Index to explore the overall changing trends of regional inequality in Guangdong and find that since the reform and open-up,they all experienced increasing trends and fluctuated change. Thirdly,using the particular direction index(PDI index),we discover that the main direction of regional inequality in Guangdong is the "core-periphery" structure direction,and the gap between the core-periphery is increasing. However,the regional inequalities of the coast-inland and center-periphery are weakly rising and lessened respectively. Lastly,with the multi-level regression analysis,we discovered that globalization,decentralization,investment and marketization are the four important mechanisms which result in regional inequality. Globalization coupled with decentralization has become the most important mechanism that causes regional inequality between countries and between the core-peripheral areas. Fiscal decentralization,despite its effectiveness in creating a growth-oriented environment in Guangdong,tends to have a negative impact on the equitable development and indirectly aggravates regional inequality. Marketization has potential to mediate the uneven development in Guangdong.

DOI

[23]
Wang S J, Fang C L, Wang Yet al., 2015a. Quantifying the relationship between urban development intensity and carbon dioxide emissions using a panel data analysis.Ecological Indicators, 49: 121-131.As a factor associated with urban management and planning, urban development intensity (UDI) could in fact form the basis for a new rationale in coordinating urban sustainable development and reducing CO2 emissions. However, existing literature engaging in the task of quantifying the impacts of urban development intensity on CO2 emissions is limited. Therefore, the goal of this study is to quantify the relationship between urban development intensity and CO2 emissions for a panel made up of the five major cities in China (Beijing, Shanghai, Tianjin, Chongqing and Guangzhou) using time series data from 1995 to 2011. Firstly, this study calculated CO2 emissions for the five selected cities and presented a comprehensive index system for the assessment of the level of urban development intensity based on six aspects (land-use intensity, economic intensity, population intensity, infrastructure intensity, public service intensity and eco-environmental intensity) using locally important socioeconomic variables. Panel data analysis was subsequently utilised in order to quantify the relationships between urban development intensity and CO2 emissions. The empirical results of the study indicate that factors such as land-use intensity, economic intensity, population intensity, infrastructure intensity and public service intensity exert a positive influence on CO2 emissions. Further, the estimated coefficients suggest that land-use intensity is the most important factor in relation to CO2 emissions. Conversely, eco-environmental intensity was identified as having a major inhibitory effect on CO2 emission levels. The findings of this study hold important implications for both academics and practitioners, indicating that, on the path towards developing low-carbon cities in China, the effects of urban development intensity must be taken into consideration.

DOI

[24]
Wang S J, Li Q Y, Fang C Let al., 2016d. The relationship between economic growth, energy consumption, and CO2 emissions: Empirical evidence from China.Science of the Total Environment, 542: 360-371.Abstract Following several decades of rapid economic growth, China has become the largest energy consumer and the greatest emitter of CO2 in the world. Given the complex development situation faced by contemporary China, Chinese policymakers now confront the dual challenge of reducing energy use while continuing to foster economic growth. This study posits that a better understanding of the relationship between economic growth, energy consumption, and CO2 emissions is necessary, in order for the Chinese government to develop the energy saving and emission reduction strategies for addressing the impacts of climate change. This paper investigates the cointegrating, temporally dynamic, and casual relationships that exist between economic growth, energy consumption, and CO2 emissions in China, using data for the period 1990-2012. The study develops a comprehensive conceptual framework in order to perform this analysis. The results of cointegration tests suggest the existence of long-run cointegrating relationship among the variables, albeit with short dynamic adjustment mechanisms, indicating that the proportion of disequilibrium errors that can be adjusted in the next period will account for only a fraction of the changes. Further, impulse response analysis (which describes the reaction of any variable as a function of time in response to external shocks) found that the impact of a shock in CO2 emissions on economic growth or energy consumption was only marginally significant. Finally, Granger casual relationships were found to exist between economic growth, energy consumption, and CO2 emissions; specifically, a bi-directional causal relationship between economic growth and energy consumption was identified, and a unidirectional causal relationship was found to exist from energy consumption to CO2 emissions. The findings have significant implications for both academics and practitioners, warning of the need to develop and implement long-term energy and economic policies in order to effectively address greenhouse effects in China, thereby setting the nation on a low-carbon growth path. Copyright 脗漏 2015 Elsevier B.V. All rights reserved.

DOI PMID

[25]
Wang S J, Liu X P, 2017. China’s city-level energy-related CO2 emissions: Spatiotemporal patterns and driving forces.Applied Energy, 200(15): 204-214.Global cities produce more than 70% of the world’s CO2 emissions and thus play an important role in addressing climate change. Few statistics are available with respect to national city-level energy consumption in China—as such, in this study we apply spatiotemporal modeling in order to assess China’s city-level CO2 emission levels using DMSP/OLS nighttime light imagery. We examine the spatiotemporal variations and determinants of CO2 emissions using a series of distribution dynamic approaches and panel data models for proposing feasible mitigation policies, the results of which show that while per capital CO2 emissions were characterized by significant regional inequalities and self-reinforcing agglomeration during the study period, regional disparities decreased and spatial agglomeration gradually increased between 1992 and 2013. The results of our estimation further reveal the importance of economic development, population growth, industrial structure, and capital investment as the factors positively affecting China’s city-level per capita CO2 emissions. Conversely, FDI is found to exert a negative impact. Our results also strongly support the existence of an inverted U-shaped relationship between per capita CO2 emissions and economic development, thereby confirming the EKC hypothesis. The findings obtained in this study could provide important decision-making support in the task of building China’s low-carbon cities of the future.

DOI

[26]
Wang S J, Liu X P, Zhou C Set al., 2017. Examining the impacts of socioeconomic factors, urban form, and transportation networks on CO2 emissions in China’s megacities. Applied Energy, 185: 189-200.In addition to socioeconomic factors, urban planning and transportation organization are beginning to play an increasingly important role in the reduction of CO 2 emissions. However, little attention has been paid to the ways in which this emerging role can be framed. Therefore, this study aims to examine the combined impacts of socioeconomic and spatial planning factors on CO 2 emissions in cities that have experienced rapid urbanization, using an econometric model and a comprehensive panel dataset incorporating socioeconomic, urban form, and transportation factors for four Chinese megacities鈥擝eijing, Tianjin, Shanghai and Guangzhou, 鈥攊n the period 1990鈥2010. Making use of remote sensing land-use data, the digitization of transportation maps, and a set of socioeconomic data, we developed an extended STRIPAT model in order to empirically estimate the impacts of the selected variables on CO 2 emission levels in these cities. The results indicate that the socioeconomic factors of economic growth, urbanization, and industrialization will lead to increased CO 2 emissions, while the service level and technology level can contribute to the reduction of CO 2 emissions. The results also suggest that the expansion of urban land use and increases in urban population density should be controlled through urban planning measures in order to reduce CO 2 emissions. In addition, pursuing compact urban development patterns would also help to reduce CO 2 emissions. Transportation factors including urban road density and the traffic coupling factor were both found to have exerted significant negative effects on CO 2 emission levels, indicating that increases in the coupling degree between urban spatial structure and traffic organization can also contribute to reducing such emissions. Our results cast a new light on the importance of practices of urban planning and spatial optimization measures in achieving CO 2 emission reductions. The findings obtained in this study are seen as providing important decision support in building low-carbon cities in China.

DOI

[27]
Wang Shaojian, Liu Yanyan, Fang Chuanglin, 2015b. Review of energy-related CO2 emission in response to climate change.Progress in Geography, 34(2): 151-164. (in Chinese)Climate change has in recent years become an environmental issue globally. Through deepening research into and analysis of the phenomenon, most climate scientists now identify greenhouse gases, most notably CO2 emissions, as constituting the main cause of global warming. Based on literature study and comparative analysis, this article discusses the progress of the research of CO2 emissions from a multidisciplinary perspective and analyzes the calculation methods, intensity, performance, influencing factors, and forecasting methods of CO2 emissions. This article also discusses the remaining issues and future directions of the research on CO2 emissions. Results indicate that the research of CO2 emissions has gained fruitful achievements and has experienced rapid development in recent years. CO2 emission is an integrated, complex, interdependent system engineering of numerous variables interplay between different factors. Under the framework of multidisciplinary integration, geographical and spatial factors have however received insufficient attention. Research scale has mainly focused on global and international levels, although recent studies have begun to highlight multi-scale research and pay attention to scale effect. Panel study of provincial and city scales is still scarce. Panel data are gradually receiving attention; however, dynamic analysis and comparative assessment still need improvement. Future research should focus on creating more detailed and comprehensive datasets, exploring multi-scale integrated research, and highlighting city scale analysis. Furthermore, future study should emphasize adapting theories to localized practices, employing systemic thinking and methods for differentiated trend research.

DOI

[28]
Wang Shaojian, Wang Yang, Zhao Yabo, 2014c.GIS-based multi-scale and multi-mechanism research on regional inequality in Guangdong province.Scientia Geographica Sinica, 30(10): 1184-1192. (in Chinese)Regional inequality is an important issue in geographical research and regional development studies. China is the largest developing country in the world and its economy has undergone rapid and continuous expansion since the Chinese economic reform in 1978. China has achieved great success in economic development with an annual growth rate at 9.9%. However, behind the economic success in China, the country also faces serious challenges arising from imbalanced growth and intensifying social injustice. Since regional inequality may threaten national unity and social stability, it is a hot issue in research internationally and domestically. Almost all previous studies of the regional inequality have transformed static, qualitative measurement into a dynamic and quantitative evaluation. Most of the research in China has focused on lateral comparisons at a national level, only a few have addressed the provincial level. Added this above, this article analyses the regional inequality in Guangdong Province from 1990 to 2010 and follows a GIS-based multi-scale and multi-mechanism framework. Conventional global inequality indexes, spatial autocorrelation and spatial multi-level regression are utilized in the article to examine the regional inequality in Guangdong Province. Conventional global inequality indexes (including Coefficient variance, Gini coefficient, Theil index) analysis reveal that since the early 1990s, the regional inequalities at county level, municipality level, regional level and urban-rural level are experiencing increasing tends and fluctuated change. Geographical scale and spatial organization play an important effect on regional inequality. Based on GIS, spatial autocorrelation finds that spatial agglomeration-"convergence club" exists in the process of economic growth of Guangdong, which is attributing to intensity the regional inequality. The spatial multi-level regression analysis reveals that globalization, decentralization and investment are the three important mechanisms for understanding the regional inequality in Guangdong Province, and marketization has remitted the regional inequality effectively. What more, urban-rural and geomorphology are also the elements of the regional inequality, but the impact is not significant.

DOI

[29]
Wang Shaojian, Wang Yang, Zhao Yabo, 2015c. Spatial spillover effects and multi-mechanism for regional development in Guangdong province since the 1990s.Acta Geographica Sinica, 70(6): 965-979. (in Chinese)Under the background of global economic integration, regional economic growth is not isolated in geographical space. Economic growth relies on both internal and external factors. At the regional level, global economic integration shows the form of regional and local economic cooperation and integration. In the open economic system, regions struggle for more benefits through adjusting local development policies. Propelled by the new round of economic growth and urbanization, China's regional economic development presents a trend of much more profound regional cooperation. Therefore, this paper intends to explore the spatial spillover effects of regional economic growth by analyzing the case of Guangdong province from 1990 to 2010. Located in South China, Guangdong has witnessed dramatic development since the reform and opening-up started, and has become the largest economic region in China. However, behind its economic success, it is facing great challenges arising from unbalanced growth and intensified social injustice. Generally, Guangdong can be divided into four parts, namely, the Pearl River Delta, eastern Guangdong, western Guangdong and northern Guangdong, among them, the Pearl River Delta developed much better and faster. This is because the Pearl River Delta region attracted more capital investments and human resources with better natural resources, location conditions and supporting policies. As a result, increasing regional inequality and differences threatens national unity and social stability to some extent. Hence, regional disparity becomes an important issue in Guangdong's geographical research, as well as in regional development studies. In this paper, the scale variance analysis and statistics showed that the regional development at the county level made the greatest contribution among the three scales of county, municipality and region. The Kernel density estimation indicated that there was an increasing inequality in GDP per capita at county level from 1990 to 2010. Moreover, the inequality in 2000-2010 was larger than that in 1990-2000. The spatial Markov chain analysis revealed that the spatial spillover effects did exist in economic development at county-level, which means, if a county is adjacent to a richer county, its economy has a relatively high possibility to increase, and vice versa. The spatial lag regression model and the geographically weighted regression analyses indicated that globalization, decentralization and investments were the core driving forces of Guangdong's spatial spillover effects, and marketization, urbanization and savings were the secondary driving forces for increasing the regional inequality.

DOI

[30]
Wang Y, Li G D, 2017. Mapping urban CO2 emissions using DMSP/OLS ‘city lights’ satellite data in China.Environmental and Planning A, 49(2): 248-251.China, the world0964s top CO 2 emitter, is faced with pressure of energy-saving emission reduction. In the 2015 Paris Climate Conference (COP21), China announced its plan, aiming to cut down CO 2 emissions by 60%09“65% per unit of GDP in comparison to 20050964s level by 2030. To achieve this ambitious goal, reliable national, provincial, and city-level statistics are fundamental for multi-scale mitigation policy-makings as well as for the allocation of responsibilities among different administrative units. However, China implemented a top-down energy statistical system. The National Bureau of Statistics only publishes annually both national and provincial energy statistics. Only part of cities released their statistics, which results in missing data in city-level energy statistics. This also affects data transparency and accuracy of energy and CO 2 emission statistics, and as a result, increases difficulty in allocation of CO 2 emission reduction responsibilities. In order to fill this lacuna, we employed a standardized remote sensing inversion approach for estimating China0964s city-level CO 2 emissions from energy consumptions by integrating DMSP/OLS 0900city lights0964 satellite data and statistical data. The end product is a map of city-level CO 2 emissions in China. The most topping CO 2 emitters are located in the major urban agglomerations along the more economically developed eastern coast (e.g. Yangtze River Delta, Beijing09“Tianjin09“Hebei, Shandong Peninsula, and Pearl River Delta). Other regions with high CO 2 emissions are Shanxi and Henan in Central China, as well as the Chengdu09“Chongqing and Shaanxi in West China. Regions with low CO 2 emissions are western China, and most of Central China and South China.

DOI

[31]
Yao C R, Feng K S, Hubacek K, 2014. Driving forces of CO2 emissions in the G20 countries: An index decomposition analysis from 1971 to 2010.Ecological Informatics, 26: 93-100.The results show that the driving forces of CO 2 emissions are significantly different in advanced economies versus emerging economies. In general, economic growth was the main factor for increasing CO 2 emissions. Apart from economic growth, population growth shows the strongest effect on CO 2 emission growth in the emerging economies such as Mexico, South Africa, Brazil, Turkey, and Argentina. This growth in emissions was partly compensated by improved energy efficiency and reduced carbon intensity in most advanced economies and some emerging economies, whereas in other G20 countries, such as France, Brazil, Mexico, South Africa, and Saudi Arabia, energy intensity was increasing. Our results imply that different countries require different policies to do justice to the differences in trajectories and factors influencing CO 2 emissions.

DOI

[32]
Yuan Lu, Pan Jiahua, 2013. Disaggregation of carbon emission drivers in Kaya identity and its limitations with regard to policy implications.Advances in Climate Change Research, 9(3): 210-215. (in Chinese)The Kaya identity has been widely used to disaggregate and identify the drivers for the variations in carbon emissions,providing an important role in understanding historical emissions change at macro-level.Kaya identity,with a simple mathematical form,can decompose drivers without residuals.However there are also some limitations with respect to its policy implications.First,Kaya identity can only explain the changes in carbon emissions flow,with limited or no attention to the existing stock of carbon emissions.Second,drivers in Kaya identity are proximate and it's difficult to assess their actual impacts on the total emissions.Third,policy implications derived from the conclusions using Kaya identity decomposition can be fuzzy and in conflict with common understanding and practice in reality.This indicates that Kaya identity as an analytical tool requires further examination and investigation with respect to its policy implications.

[33]
Zhang Y, 2009. Structural decomposition analysis of sources of decarbonizing economic development in China: 1992-2006. Ecological Economics, 68(8/9): 2399-2405.To analyze and understand decarbonizing economic development in China, this paper undertakes a structural decomposition analysis of the historical change in energy-related carbon intensity in China between 1992 and 2006. The results show that the energy-related carbon intensity in China decreased by about three-fourths between 1992 and 2006 and reduced carbon emissions by about two billion tons. The decline in the energy-related carbon intensity was mainly caused by changes in production pattern, especially changes in energy intensity within each sector between 1992 and 2002. However, the most important driving force of carbon intensity from 2002鈥2006 was not the energy intensity within each sector but the input mix. On the other hand, changes in demand pattern pushed up the carbon intensity. To further decarbonize the economy in the future, it is important for China to further enforce policies on shaping the production pattern, such as reducing energy intensity, and pay more attention to increasing the sustainability of the demand pattern at the same time.

DOI

[34]
Zhang Zhenghua, Peng Diyun, 2013. Review on the empirical research on the impact factors of China’s carbon dioxide emissions.Ecological Economy, (6): 50-54. (in Chinese)

[35]
Zheng Changde, Liu Shuai, 2011. Empirical research of carbon emission and economic growth in China based on the spatial econometric analysis.China Population, Resources and Environment, 21(5): 80-86. (in Chinese)This paper adopts the method of spatial econometrics to analysis the relationship between carbon emission and economic development of China,and our study showed that the spatial distribution of carbon emission in China presented spatial autocorrelation.The provinces whose amount of carbon emission was the highest usually locate in the most developed coastal regions,such as the littoral area of Bohai,Yangtze River Delta area and Peal River Delta area.The provinces whose amount of carbon emission take the second status locate in the less developed regions,such as Shanxi,Hubei,Hunan,Jiangxi,Anhui and southwestern regions.Besides,the spatial distribution of carbon emission in China presented spatial clusters.The littoral area of Bohai presented a high spatial cluster,while some provinces presented a low spatial ctuster,such as Tibet,Xinjiang,Gansu and Qinghai.The relationship between economic growth and carbon emission showed a positive correlation;the high carbon emission areas are located in the developed coastal regions and the low carbon emission areas in the economically backward inland areas.China's economic development showed a strong dependence on carbon emission,and the elasticity coefficient between China's economic development and carbon emission is about 0.8;thus it's difficult to implement the low-carbon emission economic development model.

[36]
Zhu Yuen, Li Lifen, He Sisiet al., 2016. Peak year prediction of Shanxi Province’s carbon emissions based on IPAT modeling and scenario analysis.Resources Science, 38(12): 2316-2325. (in Chinese)

DOI

Outlines

/