Research Articles

Characteristics of nonpoint source pollution load from crop farming in the context of livelihood diversification

  • SHAO Jing’an , 1, 2 ,
  • HUANG Zhilin 3 ,
  • DENG Hua 4
Expand
  • 1. College of Geography and Tourism, Chongqing Normal University, Chongqing 400047, China
  • 2. Key Laboratory of Surface Process and Environment Remote Sensing in the Three Gorges Reservoir Area, Chongqing 400047, China
  • 3. Institute of Forest Ecological Environment and Protection, CAF, Beijing 100091, China
  • 4. Chongqing Youth Vocational & Technical College, Chongqing 400712, China;

Author: Shao Jing’an (1976-), Professor, specialized in regional environment evolution and climate responses.E-mail:

Received date: 2017-03-11

  Accepted date: 2017-05-05

  Online published: 2018-03-30

Supported by

Chongqing University Innovation Team for 2016, No.CXTDX201601017

Chongqing Research Program of Basic Research and Frontier Technology, No.cstc2017jcyjBX0024

Copyright

Journal of Geographical Sciences, All Rights Reserved

Abstract

Based on objective data collected from interviews in typical villages of the Three Gorges Reservoir Area, the present study devised three livelihood scenarios related to rural transformation development: agriculturally dominant livelihood, multiple-type livelihood and non-agriculturally dominant livelihood. Moreover, the present study reports the trend characteristics of nonpoint source pollution load of crop farming in relation to the transformation of dominant livelihood types, and discussed the primary factors which affect livelihood type transformations. Results indicated the following: (1) The current farmland pattern shows a trend of diversification as self-cultivation, cropland transfer and fallow in the sample region. Dynamic characteristics of cultivated land present a special feature that is more “transfer-into” than “transfer-out”. Various scales of planting are represented among the various households, according to the following decreasing order: half-labor household > non-labor household > adequate labor household. (2) The highest pollution loading produced by crop farming occurs in half-labor households while the lowest occurs in non-labor households. With increasing labor, the pollution load per unit area tends to first increase and then decrease within families with enough labor. (3) As the type of livelihood transitions from agriculturally dominant to non-agriculturally dominant, the maximum reduction of total pollution loading produced by the agricultural industry can reach 72.01%. Compared to agriculturally dominant livelihoods, multiple-type livelihoods produce a pollution load reduction yield of 19.61%-29.85%, and non-agriculturally dominant livelihoods reduce the pollution load yield by 35.20%-72.01%. However, the rate of reduction of total nitrogen is not the same as total phosphorus. (4) The non-agricultural characteristics of labor allocation and income promote the transformation from dominant livelihood types to non-agricultural livelihoods, while potential revenue conversion follows a similar trend. In addition, different household types do not display identical conversion rates, according to the following decreasing order: enough labor household > half-labor household > non-labor household. (5) During rapid urbanization and the building of new industrial systems, the livelihood types of rural households have been further transformed to off-farm household types in the mountainous region; this process will lead to the further reduction of pollution load generated by planting and agriculture. Hence, significant decreases in the planting pollution load necessitate the development of control measures to enhance transformations from agricultural to off-farm livelihoods.

Cite this article

SHAO Jing’an , HUANG Zhilin , DENG Hua . Characteristics of nonpoint source pollution load from crop farming in the context of livelihood diversification[J]. Journal of Geographical Sciences, 2018 , 28(4) : 459 -476 . DOI: 10.1007/s11442-018-1484-y

1 Introduction

Environmental impact of crop farming (CF) becomes increasingly prominent in rural China. An investigation into this issue can help relieve the environmental pressure faced by rural areas. As was pointed out at the Central Rural Work Conference in 2014 held by China’s Communist Party Central Committee and State Council, the ecological environment has given a warning to agricultural development and extensive farming, which is characterized by high yield, high quality and high economic efficiency, had exerted considerable negative impact on rural environment (Liang et al., 2010). In view of current stage of agricultural and rural development in China, maximization of households’ welfare and income, driven by policy orientation as well as development and transformation of rural economy, plays a critical role in resource allocation and household livelihood strategies in rural areas (Rozelle and Boisvert, 1995; Liu, 2007). It leads to a shift of main livelihood to non-agricultural activities, diversified farm operators (Shui, 2013) and growth of precision (Ganesh et al., 2012) and multi-functional agriculture (Walford, 2005). However, nonpoint source (NPS) pollution, considered one of the main factors affecting rural environment, is an unavoidable and sensitive issue that rural China must face at present and in the future (Yang et al., 2013). Related studies suggest that pollution load from agricultural production is one of the main nonpoint sources of pollution (Li et al., 2010) and the application of fertilizers has a great impact on water quality in local water environment (Zhang et al., 2012). Some scholars argue that the influences of fertilizer application vary significantly between operating entities (Zhong et al., 2014) and peasant households’ attitudes towards inputs to farmland greatly affect their decisions on fertilizer use (Gong et al., 2008) and their management behavior has an important influence on NPS pollution in rural areas (Feng et al., 2005; Hou et al., 2012).
It is no doubt true that the growing wages paid for migrant workers boosts mass migration of labor from rural areas (Sharma et al., 2006; Zhang et al., 2009; Zhao et al., 2013; Long et al., 2014). In mountainous rural areas, agricultural production is at a marked comparative disadvantage due to topographical restrictions and people’s livelihoods depend less on land. Therefore, labor is migrating out of these areas at impressively rapid rates (Li and Ma, 2014). This survey finds that migrant workers from mountainous countryside are mostly aged below 50 and their rational judgments and decisions on livelihood are largely aimed at maximizing income. Most of the left-behind laborers are aged between 50 and 65. They are primarily engaged in subsistence agriculture and exhibit low degree of participation in the market. The left-behind peasants older than 65 only mostly rely on vegetable gardens or subsistence agriculture for their livelihood, which are characterized by limited land sizes and intensive land use. The migrant rural workers were generally employed in non-agricultural sectors, while the left-behind ones are primarily engaged in both agriculture and supplementary sidelines concurrently or merely agriculture. Rural households with different livelihood strategies vary widely in environmental awareness (Zhao, 2012), attitude towards land, and inputs to agricultural production (Ouyang et al., 2004; Luo et al., 2013). This variability has an inevitable effect on the level of NPS pollution in rural areas. Therefore, it is very necessary to investigate how the nonpoint sources of pollution caused by CF vary as household livelihoods change and to implement control of pollution from nonpoint sources at the household level.
The variability in peasant households’ responses to livelihood changes and in their attitudes towards inputs to farmland ultimately causes variations in the levels of NPS pollution from CF in rural areas. In view of this, this study investigated the pattern of variation in NPS pollution produced by CF during the evolution of peasant households’ main livelihoods and the resulting responses of various household types under the framework of income maximization. It is suggested that adaptive control policies should be formulated based on a weighing of diversified livelihood options and inputs to farmland, in order to provide guidance to various operators, such as peasant households, cooperatives, and enterprises, on proper agricultural inputs and to prevent NPS pollution in rural areas through control of sources.

2 Materials and methods

2.1 Overview of the sample areas

The sample areas include Futian and Longxi towns in Wushan County as well as the Baima and Changba Towns in Wulong County. Both counties are typical mountainous areas within the Three Gorges Reservoir Area. Wushan County is located within the Northeast Chongqing Ecological Conservation and Development Zone and next to the Daning River, while Wulong County is located within the Southeast Chongqing Ecological Protection and Development Zone and close to the Wujiang River (Figure 1). Both rivers are main tributaries of the Yangtze River. Overall, the sample area in Wushan County slopes steeply towards the northeast and its terrain is primarily composed of middle and low mountains. It has a subtropical humid monsoon climate that varies significantly across this area, with an annual precipitation of 1041 mm and annual mean temperature of 18.4℃. Futian Town is about 60 km from the county seat. Local staple crops are corn, rice and sweet potato and double cropping is practiced there. Located 10.3 km from the county seat, Longxi Town is largely forested and mainly produces corn, sweet potato and sesame. About 46.49% of local labor has migrated to urban areas in search of non-agricultural jobs. The sample area in Wulong Town gently slopes from southeast to northwest and its terrain is characterized by flat river valleys, deep hills and low mountains. It also has a subtropical humid monsoon climate with an annual precipitation of around 1100 mm and a frost-free season of 260 days. Changba Town is 38 km away from the county seat and accessible by National Highway 319. It has a relatively solid foundation for agricultural production with rice, corn and rapeseed being local staple crops. Around 24 km from the county seat, Baima Town has relatively developed infrastructure such as transport and water conservation facilities and produces corn, rice, flue-cured tobacco, rapeseed, etc.
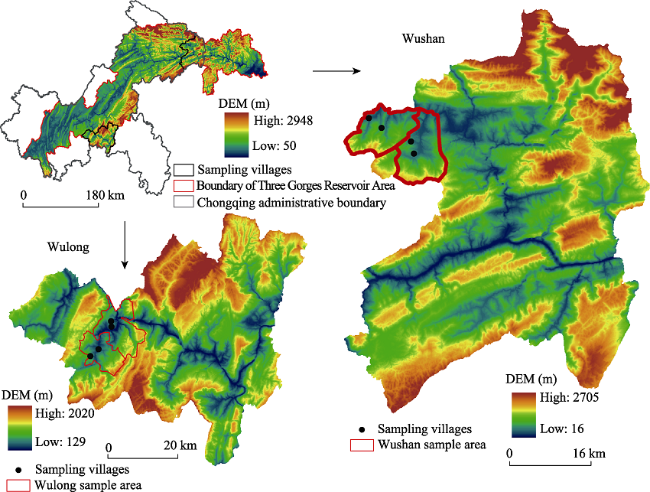
Figure 1 Location of the study site and distribution of the sampling villages
This study focused on eight typical villages, including Lianhua, Shuangtang, Shuanghe, and Laoya in Wushan County as well as Eguan, Qianjin, Dongsheng, and Chepan in Wulong County, and involved 2814 people. Local contracted farmland per capita over the research period was 11.21×10⁻² hm2, 4.40×10⁻² hm2 of which was left uncultivated. Annual income from land per unit area was between 819.67 and 1464.29 yuan and the subsidies for each farmer ranged from 593.96 to 1775.10 yuan. Annual income per capita among the migrant workers from these areas was 20,101.02 yuan, and the left-behind farmers with sidelines earned 5801.54 to 14,686.07 yuan a year. Occupations of labor force in the sample villages varied significantly between age groups (Table 1).
Table 1 The situations of labor resource allocation among different ages (person)
Age group
(years old)
Labor resource allocation
Migrant
workers
Non-working people Agricultural workers Main migrant workers Main agricultural workers Total
<16 3 536 7 546
16-50 607 168 414 198 15 1402
50-65 25 23 427 45 9 529
>65 1 77 253 4 2 337
Total 636 804 1101 247 26 2814

2.2 Data sources

Survey data: This study mainly used survey data acquired by means of participatory rural appraisal (PRA), which was carried out over about 60 days in July and August 2012. Peasant households randomly sampled from the villages were asked to fill in a questionnaire and return it. A total of 691 valid copies were collected, with 98, 92, 98, 86, 77, 81, 80, and 79 copies from Laoya, Shuanghe, Lianhua, Shuangtang, Eguan, Qianjin, Chepan, and Dongsheng, respectively. This survey focused on the livelihood assets (including human assets, natural assets, physical assets, etc.) and livelihood strategies of the households. Additionally, this study also used data from a questionnaire survey conducted in some districts (counties) of Chongqing within the Three Gorges Reservoir Area between June and October 2013. A total of 758 copies of the questionnaires were submitted to households in 46 villages, 23 townships (towns) and 752 valid copies were collected. This survey examined the status quo of the households, structure of CF, land area under cultivation, fertilizer application, management mode, structure of husbandry, and rural life.
Spatial data: Spatial data, such as county-level digital elevation model (DEM) data as well as data about the Yangtze River system, the administrative divisions of the Three Gorges Reservoir Area, and the administrative boundary of Chongqing were downloaded from the Geospatial Data Cloud website (http://www.gscloud.cn/). The 1:10,000 topographic maps of the village, land use maps, village-level road map, settlement distribution maps, and drainage patterns were provided by land offices at the township (town) level or bureaus of land and resources at the county level. The spatial distribution of the survey points in the sample villages was obtained by inserting their GPS coordinates into the above-mentioned maps.

2.3 Data processing

(1) Classification of peasant household types (HH type)
The household samples in this study were classified into three types based on household composition: households with able-bodied laborers (HH type 1), households with semi-able-bodied laborers (HH type 2), and households with no laborer (HH type 3). A household with able-bodied laborers refers to a household that has able-bodied members (aged between 16 and 50) engaged in production. A household only with semi-able-bodied laborers has no able-bodied adult but has semi-able-bodied members (aged between 50 and 65) engaged in production. In a household with no laborer, all adults are older than 65 and engaged in certain agricultural production.
(2) Livelihood types in different scenarios (LH type)
The peasant households’ livelihoods were classified into three types according to their attitude towards land, dominant livelihood strategy, dependence of livelihood on family-contracted farmland, and inclination to adopt a diversified livelihood strategy (see more details in Table 2).
Table 2 The scenario classification of different farmer livelihood types
Farmer livelihood scenario types Major livelihood
assets
Leading livelihood strategy Land dependence degree Land transfer
intensity
Main farm household income
LH type 1 Natural assets Agriculture High Low Agricultural products
LH type 2 Natural assets and human capital Agriculture and sidelines Relatively high Relatively strong Non-farm income and agricultural products
LH type 3 Human capital and social assets No-agriculture Low Strong Non-farm income

Note: The meaning of farmer livelihood types is explained in the following page.

LH type 1: Livelihood dominated by agriculture. In this scenario type, the peasant households earned their livelihood primarily from land resources, especially the family-contracted farmland which provided the fundamental income to support a family’s daily life. They usually carried out single types of activities for a means of living and sought to maximize farm output per unit land area in pursuit of maximum income from farmland. Hence, farmers were not engaged in other non-agricultural jobs and their land was retained or transferred on a small scale. Land resources were fully developed and utilized and no land was left uncultivated.
LH type 2: Livelihood dominated by sidelines. In this scenario type, the peasant households’ livelihood partly relied on the limited land resources and the labor could flow freely between industries. The able-bodied workers regarded agricultural production as the worst choice for their livelihood. Land transfer became increasingly active. However, as there was a lack of established guarantee mechanism to protect peasants’ rights and interests during land transfer, various farm operators had a wait-and-see attitude towards farmland. As a result, part of the land was transferred, while the rest was farmed or left uncultivated. In this scenario type, the bulk of the able-bodied laborers chose better-paid occupations and attached little importance to land. Therefore, their land was most likely to be transferred. Only a small part of the semi-able-bodied laborers worked as migrant workers, while the rest earned their livelihood from both farming and supplementary sidelines. The attitudes of the farmers with sidelines towards farmland depended on their income from farmland. Land transfer was more likely to occur if it could bring greater economic benefits; otherwise, the peasants were more likely to retain their land. The attitudes of those aged over 65 towards land rested with their family status and their earnings after land transfer. These people generally supported compensatory land transfer.
LH type 3: Livelihood dominated by non-agricultural activities. In this scenario type, land transfer took place in a more mature manner and was protected by related support mechanisms. Peasants had not to worry about their livelihood after transferring their land. Both operating entities and households could obtain expected profits from land. Additionally, the companies and other high-level operating entities that took over land from individual households were able to make best use of land resources, significantly improving land use efficiency.
As the households changed their principal livelihood, the operating entities of farmland developed into high-level operators. In this scenario type of agriculture-based livelihood, farmland was operated by contracted farmers and big families engaged in farming. In the second type described above, the operating entities included contracted farmers, big families engaged in farming, cooperatives and companies, and the farmland was under cultivation, transferred, or left uncultivated. In the third type, cooperatives or companies replaced individual households to manage agricultural production in an organized manner.
(3) Calculation of income/welfare of households with different livelihood strategies
As a result of economic transformation and growth in rural areas, the sources of households’ livelihood tend to be diversified. The survey found that the incomes of the households mainly came from non-agricultural activities, agricultural production, sidelines, contracted farmland, as well as assistance from the government, relatives and friends. According to the rational peasant hypothesis and the maximum objective decision function, household income can be expressed as follows:
where Incomej represents the total income of a type j household; OF is the income from non-agricultural sources; Fm is the income from agriculture; CB is the income from sidelines; L is the income from farmland; and AF is the income from assistance (e.g. government subsidies and assistance offered by friends and relatives). The expressions for the incomes from different sources are as follows:
CBJ, 
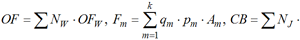
, and where Nw is the number of migrant workers;OFW is the average annual income from non-agricultural sources; qm is the unit price of the mth crop (animal) product; pm is the yield of the mth crop (or animal) product per unit land area; Am is the area of land used to produce the mth crop (animal) product; Nj is the number of peasants with sidelines; CBJ is the average annual income from sidelines; AL is the area of land that brings the Lth income; LaL is the Lth income from farmland per unit area; and AFf is the income from the fth assistance.
(4) Correction for coefficient of river pollutant input for different household types
Pollutants generated by CF in different spatial units are carried by surface runoff to receiving water bodies. This process is mainly controlled by surface roughness and the component of gravity parallel to surface slope (Long et al., 2013). Besides, the distance between a pollutant-producing unit and a receiving water body also affects the likelihood and rate of pollutant input into the receiving water body. The shorter the distance, the less varied the topography and land use types in the area between the pollutant source and the receiving water body. Thus the pollutants are more likely to enter the receiving water body rather than be intercepted or absorbed by land. Therefore, the coefficient of river pollutant input increases with increasing component of gravity along the surface slope and decreasing distance from a pollutant source to a receiving water body. Since topographical index can reflect the component of gravity parallel to the slope of a spatial unit (Beven and Kirkby, 1979), it was used to correct the distance between a spatial unit and a receiving water body as follows:
where Di and di are the corrected distance and Euclidean distance between spatial unit i and the receiving water body, respectively; 
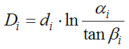
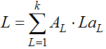
is topographic index; αi is the catchment area per unit contour length within unit i (m2); and tanβi is the slope of unit i (°).
where λn is the coefficient of river pollutant input from sample point n; \(\overline{\lambda}\) is the average coefficient of river pollutant input; \(\overline{D}\) is the average distance between farmland and the receiving water body; and Dn is the distance from sample point n to the receiving water body. The value of \(\overline{\lambda}\) can be obtained from the results of research conducted by the agro-environmental monitoring stations in Chongqing and Hubei (Chen et al., 2008; Zhong et al., 2015). The coefficients of TN (total nitrogen) and TP (total phosphorus) inputs were determined to be λTN = 0.1007 and λTP = 0.0599, respectively. Table 3 lists the coefficients of river pollutant input from the survey points in the study areas.
Table 3 The value range of river load ratio of pollutants resulted by planting of different farmers
Sampling site TN value range TN mean value TP value range TP mean value
Wushan 0.0675-0.3902 0.1221 0.0401-0.2321 0.0726
Wulong 0.0485-0.4906 0.1006 0.0289-0.2919 0.0598
(5) Calculation of NPS pollution produced by CF in various scenario types
As a growing portion of rural labor entered non-agricultural sectors, the dominant livelihood of the peasant households in the study areas changed from agriculture to sidelines and then to non-agricultural work. The NPS pollution load from CF can be calculated using the following equation:
where PLj is the total pollution load resulting from CF conducted by household with type j livelihood; PLn is the total pollution load from CF at sample point n, given by
where λn is the corrected coefficient of river pollutant input from point n, Ai is
the area of land used for type i CF at point n, and Fi is the input to farmland for type i crop farming. Their values can be determined based on findings of previous research (Zhong et al., 2014).

3 Results and analysis

3.1 Farmland use and pollution load from CF by different household types

(1) Farmland use by different types of rural households
In the study areas, part of the farmland was cultivated by original farmers, while the rest was transferred or left uncultivated. The scale of farmland operation varied significantly between different types of rural households. Table 4 reveals that the total area of farmland newly acquired by the households was smaller than the sum of the areas of uncultivated land and land transferred by the households. This indicates that the mountainous areas studied had sufficient available farmland due to the increased off-farm employment among local labor, providing relatively rich opportunities for the households to acquire high- quality farmland. This also implies that some households may have been involved in transferring farmland, leaving some farmland uncultivated, and acquiring new farmland simultaneously. The transfer of farmland, driven by the pursuit of maximum efficiency of farming, can greatly help optimal allocation and reallocation of arable land in mountainous areas.
The average land area under cultivation per capita among HH type 2 households, i.e. hou-seholds with semi-able-bodied laborers, was 11.02×10⁻² hm2, greater than the 8.66×10⁻² hm2 among HH type 3 households and 6.45×10⁻² hm2 among HH type 1 households. Despite their sufficient numbers of laborers, HH type 2 households were deprived of the opportunity to choose better livelihood strategies due to limitations such as oldness, low educational levels and physical conditions. Therefore, they carried out farming on a larger scale and were more dependent on land than the other two types. Due to a shortage of manpower and “fixation on land”, HH type 3 households which had no working-age adult normally earned their livelihood from large-scale farming and thus were highly dependent on land for their livelihood. However, with limited physical ability, their family members were often engaged in agricultural production near their homes. The HH type 1 households exhibited the smallest average land area under cultivation per capita, because workers in these households were shifting away from agriculture in large numbers for the comparative disadvantage of agricultural production. Additionally, for an HH type 1 household, an increase in its laborer number further diminished its land area under cultivation per capita, indicating that rural households with more laborers were less dependent on farmland.
Table 4 Farmland use of different household livelihood types and nonpoint source pollution load resulted by planting
Household type Labors per household (person) Farmland area under actual cultivation* Family-
contracted farmland area*
Transferring into farmland area* Transferring out farmland area * Returning farmland area* Abandoned farmland area* TN** TP** Total load **
HH type 1 1 9.02 17.93 1.11 2.16 6.69 1.17 35.70 18.02 53.72
2 6.44 9.77 1.18 0.73 3.05 0.72 34.15 19.30 53.45
3 7.00 9.22 1.67 0.96 2.22 0.70 38.45 20.19 58.64
4 4.72 7.96 1.18 0.85 3.00 0.55 35.69 21.70 57.39
5 4.79 8.38 0.38 0.13 3.00 0.84 28.77 19.09 47.86
HH type 2 1 10.43 25.16 1.52 4.16 9.72 2.36 33.02 23.06 56.08
2 11.34 22.55 1.81 1.57 9.82 1.64 37.53 23.40 60.92
HH type 3 - 8.66 24.89 1.82 3.10 11.74 3.21 30.35 16.85 47.20
Mean value - 6.81 11.21 1.31 1.06 3.79 0.87 35.59 19.98 55.57

Note: * The unit is 10-2·hm2/person, and ** the unit is kg×hm-2.

(2) Pollution load from CF by different household types
The average pollution load from CF per unit land area was 58.50 kg×hm-2 among HH type 2 households, compared with 54.21 kg×hm-2 among HH type 1 households and 47.20 kg×hm-2 among HH type 3 households. The TN and TP from farmland per unit area followed the same pattern (Figure 2). Moreover, as the number of laborers in an HH type 1 household increased, the total pollution load, TN, and TP from CF increased and then decreased (Table 4). The increased laborer numbers ensured adequate labor input to agricultural production. The heavy use of fertilizers driven by the pursuit of maximum profit increased the pollution load from CF. However, as the number of laborers increased to a certain level, comparatively low incomes from farming inevitably forced the households to shift away from agriculture to non-agricultural sectors. The massive labor shift resulted in declines in the number and work ability of laborers available for agricultural production. This substantially restricted fertilizer inputs, thereby reducing the CF-related pollution load.
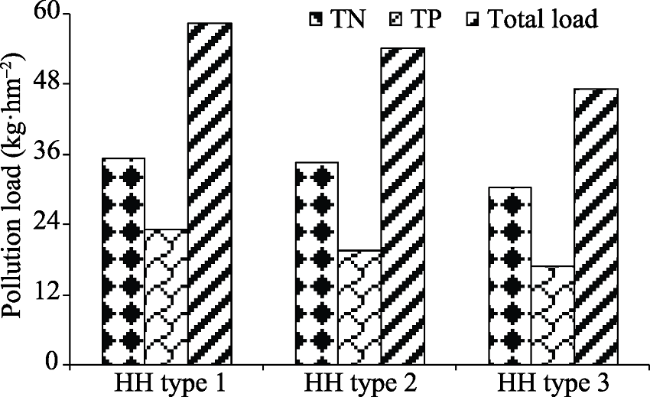
Figure 2 Pollution load per unit area of different farmer livelihood types^Note: The means of type 1, type 2 and type 3 are shown in the part of classification of peasant households.

3.2 Variation in pollution load from CF with livelihood changes

(1) Characteristics of variation in pollution load from CF
The pollution load from CF decreased as the rural households changed their main livelihood. This trend was especially evident in TN. Table 5 shows that the livelihood transition from agricultural to non-agricultural activities resulted in a maximum reduction of 12.40 t, or 72.01%, in the pollution load from CF. However, TN and TP decreased at different rates: TN by 9.62 t (83.00%) and TP by 3.61 t (64.12%). The TN reduction caused by livelihood changes accounted for the highest proportion of the total reduction in the pollution load from CF, at 77.58%. During the livelihood change process, the individual households gradually shifted from agriculture and agricultural management tended to be more advanced and more specialized (Xu et al., 2004). Moreover, different operators exhibited very different attitudes towards land and fertilizer application habits (and rates) (Zhong et al., 2014). This contributed to the significant variation in the pollution load from CF per unit land area among different operators, as illustrated in Figure 3.
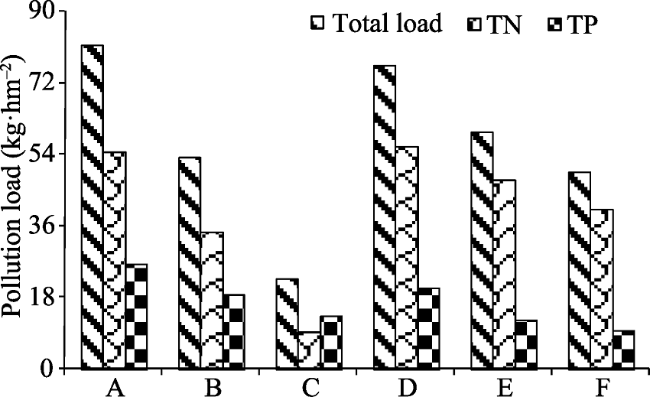
Figure 3 Pollution load per unit area among different main agricultural operating bodies^Note: The meanings of A, B, C, D, E and F are generally scattered households, big planting households, corporation, big breeding households, big planting and breeding households and cooperatives, respectively.
Table 5 Nonpoint source pollution load resulted by planting among different farmer livelihood types
Farmer livelihood types Total load (t) TN (t) TP (t)
LH type 1 17.22-16.22 11.59-11.88 5.63-4.33
LH type 2 13.04-12.08 9.45-8.76 3.58-3.33
LH type 3 10.51-4.82 8.49-1.97 2.02-2.85
The pollution load from CF varied significantly between stages of livelihood changes. In LH type 1 where agriculture was the main livelihood of the households, contracted farmers acted as the independent operators. In order to maximize output per unit land area, they applied fertilizers to farmland in large quantities. The resulting total pollution loads were relatively high, ranging from 17.22 to 16.22 t (TN: 11.59-11.88 t; TP: 5.63-4.33 t). In LH type 2 where the households’ livelihood was dominated by sidelines, the peasants became more involved in the market and gradually entered the secondary and tertiary sectors in search of comparative benefits. Meanwhile, the semi-able-bodied peasants took a wait-and-see attitude towards farmland. The emerging operating entities were at a stage of transition in the context of economic transformation. The land was independently farmed by contracted farmers or transferred to others or left uncultivated. Compared to LH type 1, the pollution load from CF decreased by 3.18 to 5.14 t, or 19.61% to 29.85%; TN and TP decreased by 2.14 to 3.12 t and 0.75 to 2.30 t, respectively, with their maximum reduction rates exceeding 25.0%. In LH type 3 where the households’ livelihood was dominated by non-agricultural activities, the land transfer market was active and the operators had transitioned to higher-level forms. The pollution load from CF significantly dropped to relatively low levels compared to LH type 1. The total pollution load reduced by 5.71 to 12.401 t, or 35.20% to 72.01%. The reductions in TN and TP fell within the ranges of 3.10 to 9.91 t and 1.48 to 3.61 t, respectively, with their maximum reduction rates exceeding 60.0%.
(2) Response of pollution load from CF to livelihood changes
During the livelihood shift process, the reductions in pollution load from CF varied drastically between household types. As Table 6 shows, the rates of reduction in pollution load from CF ranged from 18.64% to 28.84% among HH type 1 households, 15.96% to 23.12% among HH type 2 households, and 21.13% to 39.47% among HH type 3 households. The three household types were ranked in descending order of maximum reduction rate as follows: HH type 3 households, HH type 1 households, and HH type 2 households. In terms of absolute amount of pollution reduction, HH type 1 households ranked the highest while HH type 3 households ranked the lowest.
Table 6 The evolution characteristics of pollution load produced by planting in different farmer livelihood types, associating with the change of leading livelihood types
Family type Farmer livelihood type Total load (t) TN (t) TP (t)
HH type 1 LH type 1 14.46-13.63 9.73-9.98 4.73-3.64
LH type 2 11.09-10.29 8.04-7.45 3.05-2.84
LH type 3 8.83-4.05 7.13-1.65 1.70-2.39
HH type 2 LH type 1 1.99-1.88 1.34-1.38 0.65-0.50
LH type 2 1.58-1.53 1.10-1.06 0.48-0.47
LH type 3 1.22-0.56 0.98-0.23 0.23-0.33
HH type 3 LH type 1 0.76-0.71 0.51-0.52 0.25-0.19
LH type 2 0.56-0.46 0.44-0.37 0.11-0.09
LH type 3 0.46-0.21 0.37-0.09 0.09-0.13
As the main livelihood changed from agriculture to sidelines, HH type 3 households were most likely to transfer their farmland due to a lack of laborer. Most of the transferred farmland was then cultivated on a moderate scale with less fertilizer use per unit land area, thereby substantially reducing the pollution load from CF. HH type 1 households had adequate manpower or time available for agricultural production besides sidelines. Therefore, the time and intensity of farm work per unit land area were relatively high among them. They applied large amounts of fertilizers for the purpose of maximizing outputs per unit land area, resulting in relatively high pollution loads. In LH type 2, the laborers within HH type 1 households engaged in sidelines were no longer concentrated in agriculture, reducing their labor inputs (including laborers, work time and intensity) to agricultural production compared to LH type 1. The additional sideline incomes slightly slowed their pursuit of higher yields, thereby cutting the use of fertilizers to some extent. Therefore, the pollution loads from CF were lower among HH type 1 households with sidelines also lower than among HH type 1 households relying on agriculture. A fraction of the semi-able-bodied laborers were involved in sideline activities in LH type 2. However, agriculture remained the main livelihood for HH type 2 households due to their limited labor resources, just like in LH type 1. In order to meet basic necessities and maximize output per unit land area, they still invested heavily in farmland. Therefore, these households exhibited the lowest rates of pollution load reduction.
As the livelihood shifted from sidelines to non-agricultural activities, the pollution load from CF was reduced from 23.31% to 63.48% among type 1 households, 20.26% to 64.56% among type 2 households, and 0 to 62.50% among HH type 3 households. In this scenario, individual households had moved away from agriculture and thus the pollution loads from CF were generally low. The highest reduction rate occurred among type 2 households, indicating that the stock of pollutants produced by HH type 2 households was greater than those by the other two types of households. This is consistent with the fact that labor allocation optimization accompanying the dominant livelihood changes led to considerable variations in the labor inputs to crop farming and thereby noticeable variability in pollution load reduction.
The analysis above reveals that the reduction in pollution load from CF by HH type 3 households was most sensitive to the livelihood shift from agriculture to sidelines, and that by HH type 2 households was most sensitive to the shift from sidelines to non-agricultural activities.

3.3 Driving factors behind household livelihood shifts

The varying rates of pollution load reduction among the households raised two questions: what were the factors contributing to the variability in the trajectory of dominant livelihood among the households and how strong were these factors’ effects? An investigation was necessary to find the answers so as to provide a basis for working out measures to address or reduce pollution load from CF during the transformation of agriculture.
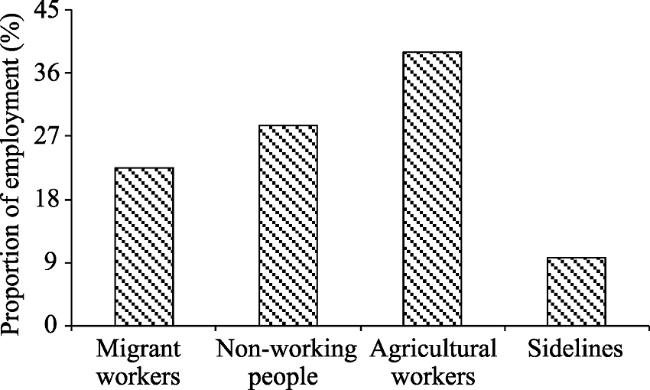
Figure 4 Employment structure of the labor resource
(1) Off-farm employment impelled the livelihood shifts
There was high non-agricultural employment among the households. As Figure 4 shows, the average laborer number per household in the sample areas was 4.07. Agricultural and migrant workers constituted 39.13% and 22.60% of local population, respectively, and only 9.70% had sidelines. Non-working people made up 30.56% of the population. The non-agricultural employment was high at 32.30%. Figure 5 demonstrates that the major components of different occupational groups differed greatly. More than 95% of the migrant workers were able-bodied laborers. Semi-able-bodied laborers and those aged over 65 together accounted for 61.76% of the peasants that were engaged only in agriculture. Able-bodied workers accounted for 78.02% of the peasants with sidelines. A significant component (66.67%) of the non-working population was under 16 years old. The trend away from agriculture was becoming increasingly marked as a result of the transformation of agriculture, exploitation of peasants’ potential for getting non-agricultural jobs and the entry of potential workers into the labor force.
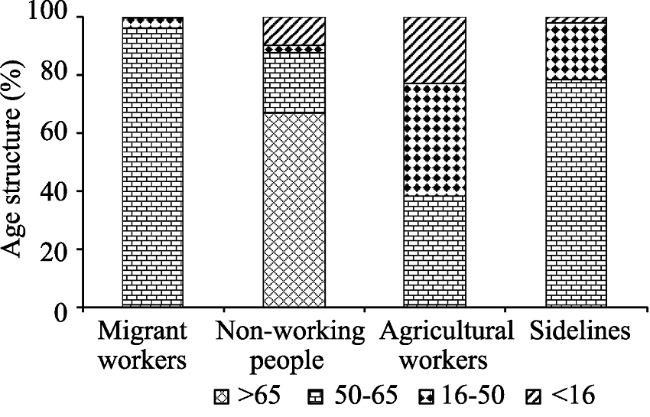
Figure 5 Age structure of labor resource allocation
The proportion of non-agriculturallaborers varied between household types. Figure 6 reveals that the average proportion of non-agricultural laborers (migrant workers and members with sidelines) among HH type 1 households reached 34.80%, significantly higher than the 9.34% among HH type 2 households and 0.00% among HH type 3 households. The average proportions of agricultural workers in family members were high among HH type 2 and HH type 3 households, both exceeding 80%, implying their high dependence on farmland. Moreover, for an HH type 1 household, the number of non-agricultural workers linearly increased with increasing number of able-bodied laborers; the relationship y = 0.447x + 0.477 well fits the data, with R2 = 0.94 (Table 7). This finding suggests that the number of laborers in a household has a significant effect on the household’s decision on whether to turn to non-agricultural sectors and the rising non-agricultural employment can decrease the dependence of peasant households on farmland and thereby propel the livelihood shifts.
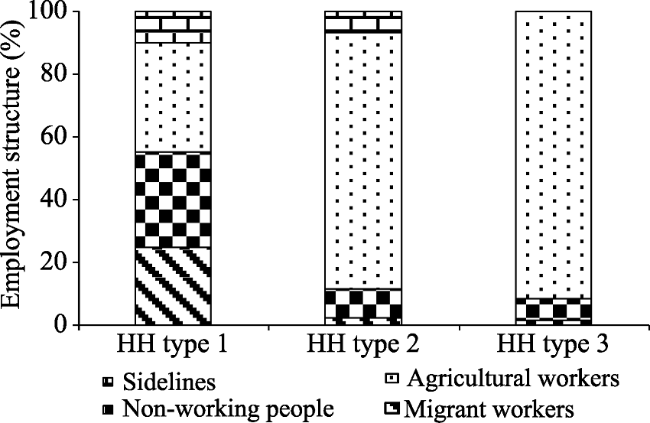
Figure 6 Employment structure of the labor resource in the different farmer livelihood types
Table 7 Labor resource allocation among different family types (person/household)
Family type Household’s labor (person) Average people of every household* Migrant
workers*
Non-working
people*
Agricultural workers* Main migrant with agricultural workers* Main agricultural with migrant workers*
HH type 1 1 2.95 0.61 0.48 1.55 0.29 0.01
2 4.66 0.97 1.57 1.65 0.40 0.06
3 4.65 1.10 1.47 1.56 0.48 0.04
4 5.52 2.01 1.49 1.48 0.52 0.01
5 6.35 2.06 2.00 1.76 0.53
HH type 2 1 1.73 0.03 0.16 1.35 0.14 0.05
2 2.11 0.05 0.20 1.75 0.11
HH type 3 1.76 0.02 0.12 1.61
Mean value 4.07 0.92 1.16 1.59 0.36 0.04

*Note: Their values are per household, and their units are person per household.

(2) Non-agricultural sources of livelihood boosted the livelihood shifts
Non-agricultural sources accounted for a significant share of household income/livelihood. The annual per capita income in the study areas was 8677.01 yuan, with 75.61% coming from non-agricultural activities, and 16.49% from agriculture, and 7.89% from assistance such as government subsidies. This demonstrates that non-agricultural activities have dominated the livelihoods of the households (Table 8). The high proportion of non-agricultural sources of income/livelihood is the product of rural economic transformation, outflow of labor, and livelihood diversification and it will further promote the livelihood transition towards non-agricultural work.
Table 8 Income characteristics of different family types (yuan/person)
Family type Household’s labor (person) Off-farm
income*
Planting income* Breeding
income*
Subsidized
income*
Total income*
HH type 1 1 6335.43 244.25 921.22 1248.00 8748.90
2 6565.66 579.68 700.35 681.03 8526.73
3 7167.32 667.82 1246.90 438.14 9520.18
4 8242.03 638.33 436.72 402.26 9719.34
5 9952.04 669.19 655.09 255.39 11531.71
HH type 2 1 1098.44 360.31 928.78 1501.07 3888.60
2 1347.46 348.56 1674.15 1547.25 4917.42
HH type 3 523.60 305.22 759.58 1775.10 3363.50
Mean value 6561.05 560.84 870.35 684.79 8677.01

*Note: Their values are per capita, and their units are yuan per capita.

The proportion of non-agricultural income varied between household types. As Figure 7 shows, HH type 1 households exhibited the highest proportion of non-agricultural income at 77.94%, compared to HH type 2 households’ 27.66% and HH type 3 households’ 15.57%. Agricultural income was an important source of income for HH types 2 and 3 households: its average share in a household’s total income was 38.74% among HH type 2 household and 31.65% among HH type 3 households. Besides, assistance such as that provided by the government, relatives and friends was also an important source of income for HH types 2 and 3 households. In particular, HH type 3 households were very dependent on assistance, which made up 52.78% of their family income. The proportion of agricultural income in household income was below 40% among the three household types, indicating a growing share of non-agricultural sources in household livelihood. This trend can boost the livelihood shifts towards non-agricultural activities.
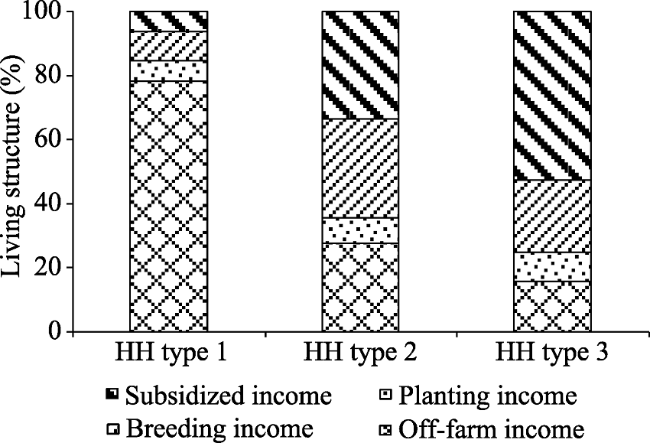
Figure 7 Source structure of different farmer livelihood types
(3) Weighing of household income/welfare in various livelihood scenarios stimulated the livelihood shifts
In the course of livelihood change, household income showed an upward trend and varied widely between various household types. Table 9 shows that the annual average household income in LH type 1 was only 9071.32 yuan, much lower than the 46,360.19 yuan in LH type 2 and 49,658.75 yuan in LH type 3. The annual per capita income in LH type 1 was 2,227.53 yuan, compared with 11,384.11 yuan in LH type 2 and 12,194.10 yuan in LH type 3. The potential economic benefits lured the households away from agriculture. Both annual household and per capita incomes grew as the livelihood shifted from agriculture, through sidelines, to non-agricultural work.
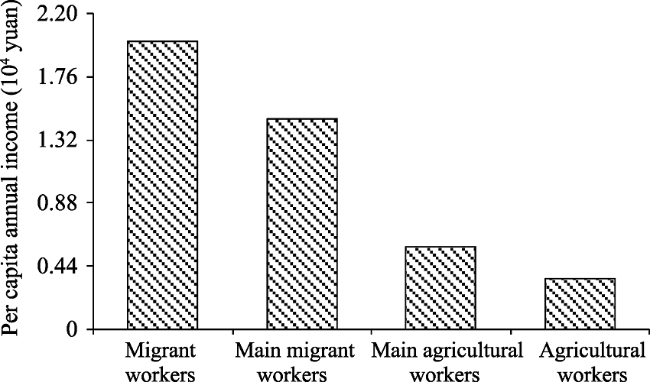
Figure 8 Per capita income of different employment
Table 9 Farmers income accounting of different leading livelihood types (yuan/year)
Farmer livelihood type Type 1 Type 2 Type 3
Per household Per capita Per household Per capita Per household Per capita
LH type 1 9650.16 2099.66 7565.44 3865.86 4623.30 2632.71
LH type 2 55,906.36 12,164.00 7565.44 3865.86 4669.72 2659.14
LH type 3 58,935.70 12,823.12 13,930.70 7118.44 4669.72 2659.14
In LH type 1, the household incomes were low and varied slightly between household types. Annual household incomes ranged between 4623.30 and 9650.16 yuan and per capita incomes were between 2099.66 and 3865.86 yuan. In LH type 2, household incomes were generally high and varied significantly among household types. Annual household incomes fell within the range of 4669.72 to 55,906.36 yuan, and per capita income varied between 2659.14 to 12,164.00 yuan. In LH type 3, the households differed greatly in income, with the widest household income gap at 54,265.98 yuan and the widest per capita income gap at 10,163.97 yuan. It is noteworthy that the peasants aged over 65 lived in relative poverty. Figure 8 suggests that the wide income gaps were attributed to differences in the nature of various occupations and the households were lured by economic benefits, and led by the market, into non-agricultural sectors to make a living.
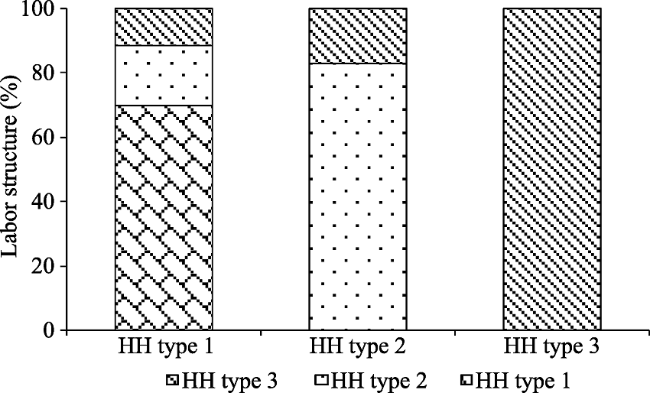
Figure 9 Labor structure of different farmer livelihood types
Livelihood changes had varied effects on household income growth depending on household types. Table 9 reveals that HH type 1 households were most influenced by livelihood changes. The household incomes were up more than five-fold maximum; the widest gaps in annual household income and per capita income reached 49,285.54 and 10,723.45 yuan, respectively. HH Type 2 households were less affected by livelihood shifts. The average household income nearly doubled. The widest gaps in household income and per capita income were 6365.26 yuan and 3252.58 yuan, respectively. Average household income grew only about 1% among HH type 3 households, indicating that these households benefited the least from livelihood shifts. Figure 9 shows that the variability in the effects of livelihood changes was caused by the differences in the number of workers between the three types of households.
The three findings above demonstrate that the manpower differences between households were the endogenous force driving the livelihood shifts while the comparative disadvantage of agriculture was the external driving force behind the changes in livelihood strategies. The off-farm employment and incomes were important indicators of livelihood shifts, while the weighing of household income/welfare in different scenarios was the major impetus for the livelihood shifts. Furthermore, the rapid modern urbanization and the establishment of an innovation-oriented industrial system can further boost the livelihood shifts, thereby further reducing pollution loads from crop farming. Therefore, in order to substantially reduce pollution produced by crop farming, it is necessary for the authorities to formulate regulatory policies that are favorable to household livelihood shifts towards non-agricultural sectors in mountainous rural areas.

4 Conclusions

(1) In the sample areas, part of the farmland was cultivated by contracted families, while the rest was transferred or left uncultivated. The households with semi-able-bodied laborers showed the largest land area under cultivation per capita, at 11.02×10⁻² hm2, compared with 8.66×10⁻² hm2 among the households with no laborer and 6.45×10⁻² hm2 among the households with able-bodied laborers. The highest pollution load from crop farming per unit land area occurred in the households with semi-able-bodied laborers, while the lowest load was observed in the households with no laborer. Among the households with able-bodied laborers, the pollution load from crop farming increased and then decreased with increasing laborer number.
(2) Overall, the total pollution load from crop farming decreased with the livelihood shifts, with the maximum rate of pollution load reduction reaching 72.01%. The reduction in TN was more remarkable than TP reduction. The pollution load from crop farming peaked in the scenario where the household livelihood was dominated by agriculture. In the scenario where the household livelihood was dominated by sidelines, the rates of reduction in pollution load from crop farming ranged from 19.61% to 29.85%, compared with 35.20% to 72.01% in the scenario where the livelihood was dominated by non-agricultural activities. The reduction in pollution load from farming by the households with no laborer was most sensitive to the livelihood shift from agriculture to sidelines and that by the households with semi-able-bodied laborers were most sensitive to the shift from sidelines to non-agricultural activities.
(3) The high off-farm employment and high proportion of non-agricultural income propelled the shifts of dominant livelihoods towards non-agricultural activities. Potential weighing of household income/welfare in the course of livelihood shifts stimulated the households to pursue livelihood strategies that were dependent on non-agricultural activities. The types of households were ranked in descending order of sensitivity to livelihood shifts as follows: households with able-bodied laborers, households with semi-able-bodied laborers, and households with no laborer. Additionally, the rapid modern urbanization and the establishment of an innovation-oriented industrial system can further boost the livelihood shifts, thereby further reducing pollution loads from crop farming. Therefore, in order to substantially reduce pollution produced by crop farming, it is necessary for the authorities to formulate regulatory policies that are favorable to household livelihood shifts towards non-agricultural sectors in mountainous rural areas.

The authors have declared that no competing interests exist.

[1]
Beven K, Kirkby M J, 1979. A physically based, variable contributing area model of basin hydrology.Hydrological Science Bulletin, 24(1): 43-69.

DOI

[2]
Chen Yucheng, Yang Zhimin, Chen Qinghuaet al., 2008. Source apportionment of agricultural non-point source pollution in Chongqing based on pressure-response system.Scientia Agricultura Sinica, 41(8): 2362-2369. (in Chinese)Objective】The case of 39 districts (counties) was used to determine the primary pollutants, the primary pollution source, the primary affecting factors and the primary contaminated area of the agriculture non-point source pollution (NPSP) in Chongqing. 【Method】According to developing strategy of One-Hour Economic Circle and Two Wings, the discharge amounts of COD, BOD5, total nitrogen (TN) and total phosphorus (TP) was accounted by the list analysis on the scale of districts (counties) from the 8 sources of NPSP such as chemical inorganic fertilizers, organic fertilizers, crops straw, stockbreeding, aquiculture, domestic sewage, domestic wastes and soil erosion, and the loading of NPSP was apportioned by the pressure-response indexes system. 【Result】The absolute discharge amount of COD, BOD5, TN and TP from NPSP were 601.3, 296.2, 162.2, and 32.9 thousand ton per year, indicating this loading excess that of industrial and domestic pollution source. The discharge concentration of COD, BOD5, TN and TP from NPSP were 20.72, 10.64, 5.58, and 1.27 mg·L-1, respectively, and water quality had been seriously polluted, in details, that in the One-Hour Economic Circle, Two Wings was heavily, moderately polluted.【Conclusion】The primary pollutants were TP and TN, the primary pollution source were stockbreeding and chemical inorganic fertilizers, the primary affecting factors were agricultural production general value, the primary contaminated districts (counties) were Shapingba, Dadukou, Hechuan, Yongchuan, Rongchang, Tongliang, Bishan and Dazu based on pollution pressure-response system.

DOI

[3]
Feng Xiaojie, Wei Chaofu, Xie Detiet al., 2005. Effects of farm households’ management behavior upon non-point pollution of agriculture and model analysis.Chinese Agricultural Science Bulletin, 21(12): 354-358. (in Chinese)This article analyses the effect of farm household's behavior upon nonpoint pollution of agriculture, at same time the economic mechanism of nonpoint pollution of agriculture is also discussed by the environmental economics model. The result shows that farm household's management behavior has a important influence on nonpoint pollution of agriculture in our country, the load of nonpoint pollution of agriculture can be divided into three parts, one comes from disagreement between private profit maximization and social welfare maximization, the second one comes from decision mechanism of farm household, another comes from the action of policy, institution, technology and population etc. So, to control nonpoint pollution of agriculture efficiently, we should take corresponding measures according to these sources.

[4]
Ganesh C B, John F N, David C R, 2012. Energy savings by adopting precision agriculture in rural USA.Energy, Sustainability and Society, 22(2): 1-5.Background Energy input in agriculture has increased tremendously and accounts for about 17% of total energy consumed in the USA. Precision agriculture involves knowledge-based technical management systems to optimize application of fertilizer, chemicals, seeds, and irrigation resources to reduce input costs and to enhance crop yield while simultaneously reducing harmful environmental impacts associated with inefficient use of agricultural inputs. It also uses GPS-based auto-guidance systems in agricultural vehicles to reduce overlapping of equipment and tractor passes, thus saving fuel, labor, time, and soil compaction with environmental benefit. Methods This study was undertaken to quantify the fuel and labor savings resulting from adoption of precision agricultural technology in the upper mid-west state of North Dakota in the USA. A survey was conducted with responses from farmers of various demographics about savings of time and fuel in their agricultural vehicle by the use of GPS guidance and autosteering systems. Results It was found that 34% farms used GPS guidance systems, reducing machine time and fuel consumption by 6.04% and 6.32%, respectively. Twenty-seven percent of the farms used autosteering systems, which further reduced machine time by 5.75% and fuel consumption by 5.33%. GPS guidance and autosteering systems can save an average of 1,647 and 1,866 L of fuel per farm respectively. The monetized values of time saved for the average farm are US$733.85 and US$851.27 for GPS guidance and autosteering systems, respectively. Conclusions The farm energy savings in terms of fuel and time by using GPS guidance and/or autosteering systems in farm vehicles in the Upper-Midwest region of the USA was estimated from the survey results. Based on the perceptions of farmers adopting precision agriculture, the two technologies investigated in this research provided a positive return on investment and would be beneficial to North Dakota鈥檚 agricultural sector if adopted more widely.

DOI

[5]
Gong Qianwen, Zhang Junbiao, Li Jin, 2008. Impact factor of fertilizer inputs decision based on analysis of the survey data in Hubei Province.Agricultural Economic Question, (10): 65-70. (in Chinese)

[6]
Hou Jundong, Lv Jun, Yin Weifeng, 2012. Effects of farmer households’ production and operation behaviors on rural eco-environment.China Population Resources and Environment, 22(3): 30-35. (in Chinese)The production and operation behaviors of farmer households concern the reasonable utilization and allocation of the production resources and affect the protection of rural ecological system and its sustainable development.With 650 respondents of farmer households from Wuhan Urban Circle and Changsha-Zhuzhou-Xiangtan Urban Agglomeration as the valid sample,this paper,by means of econometric model,analyzes the impacts of production and operation behaviors of the farmer households on rural eco-environment and their five representation forms.The results show that:(1) income source and per capita income per family in labor force input behavior have significantly negative effects on agricultural non-point source pollution,and family permanent population and annual per capita income per family have significantly positive and negative effects on domestic garbage pollution respectively;(2) the higher the educational attainments of the farmers,the better they realize the rural ecological environment pollution problems;(3) the larger the scale of operation,the more serious the agricultural non-point source pollution,and meanwhile,they have no significant effects on other four forms;(4) the more the agricultural investment,the more serious the agricultural non-point source pollution and rural water pollution caused by increase in yield;(5) in the operation and organization behaviors of farmer households,the application of organic fertilizers will result in agricultural non-point source pollution,and these unapplied organic fertilizers aggravate domestic garbage pollution.The more the organic fertilizers applied,the worse the agricultural non-point source pollution and the rural water pollution.In addition,the participation in agrotechnical training will reduce the agricultural non-point pollution and water pollution.Therefore,the production and operation behaviors of farmer households mainly affect agricultural non-point source pollution,water pollution and domestic garbage pollution while insignificantly affecting the air-noise pollution and industrial transferred pollution.

[7]
Li Bin, Ma Jiujie, 2014. The study on impact of labor force transfer on innovation in agricultural production and operation organization innovation and impact of this innovation on change of urban-rural income gap.China Soft Science Magazine, (7): 60-76. (in Chinese)Based on the peasant households' survey data in Hubei province and Chongqing city,Structural Equation Modeling was constructed to research how labor force transfer affected agricultural production and operation organization innovation and how agricultural production and operation organization innovation affected urban-rural income gap from the perspective of peasant households.The analysis results of model confirmed,under the circumstances of labor supply becoming tighter,labor force transfer in labor output areas had significant negative influence on agricultural production and operation organization innovation and agricultural production and operation organization innovation had significant positive influence on urban-rural income gap convergence.Further analysis showed labor force transfer effect on household income was greater than agricultural production and operation organization innovation,and there was an alternative relationship between the two effects.In the above analysis foundation,the article put forward corresponding policy recommendations.

DOI

[8]
Li Xiufen, Zhu Jinzhao, Gu Xiaojunet al., 2010. Current situation and control of agricultural non-point source pollution.China Population Resources and Environment, 20(4): 81-84. (in Chinese)Through analysis on research documents and references about agricultural non-point source pollution in China and abroad,the article concluded that agricultural non-point source pollutes included chemical fertilizers,pesticides,agricultural film,straw combustion,animal husbandry,and soil and water erosion,etc.Arable land were degraded by agricultural non-point source pollution.There were 12% of 1.2 billon hm2 degraded arable land were caused by agricultural non-point source pollution in the world.Agricultural non-point source pollution was the main polluted source of rivers and lakes,and caused that 40% of rivers and lakes were not qualified for the basic use in America.Agricultaral non-point source pollution was also the main reason of P and N eutrophication for water bodies.P discharged from agricultaral non-point source pollution took account of 24%-71% of the total ground water in European countries.Pollution from agricultural non-point sources were more serious than that from urban and industrial point source pollution in China.The best farmland management,constructed wetlands,and vegetation filter were believed as effective measures for agricultural non-point source pollution controlling.It was proposed that in China agricultural activities should be standardized by policies and laws,headwater pollution control with advanced theories and technology should be used at first,and pollution control in middle and lower reaches should be used as assistance.

DOI

[9]
Liang Liutao, Qu Futian, Feng Shuyi, 2010. Study on eco-environmental problems and management system innovation in the process of rural development.Soft Science, 24(8): 53-57. (in Chinese)This paper aims to build a theoretical framework of rural eco-environmental management on the basis of rural eco-environment problem analysis.Then from the view of building the rural ecological environment management model,it sets up a set of practical rural eco-environment decision-making and management system and change the rural economic development mode to improve the rural ecological environment management.

[10]
Liu Yansui, 2007. Rural transformation development and new countryside construction in eastern coastal area of China.Acta Geographica Sinica, 62(6): 563-570. (in Chinese)With the implementation of reform and opening up policies, rapid industrialization and urbanization in the eastern coastal area of China has not only promoted the development of regional economy, enhanced the international competitiveness, but also influenced the vast rural area deeply, bringing great changes to the rural industrial structure, employment structure and agricultural production pattern, and the development of the coastal rural area has come into a new period of transformation and upgrade. The proportion of the primary industry decreased from 23.3% to 7.9% and that of the tertiary industry increased from 19.8% to 40.5%, while the proportion of agricultural labor force decreased from 90.8% to 47.9% during 1978-2005. Analysis shows that proportions of both production value of coastal agriculture in GDP and agricultural labor force in rural labors will continue to decrease to 8.0% and 44.5% by 2010 and to 6.0% and 32.2% by 2020. From 1990 to 2005, the average elasticity coefficient of cultivated land and labor force in the eastern coastal area came to 1.84, which means that the transfer of agricultural labor force is faster than the decrease of cultivated land and the labor productivity is increasing steadily. At the corresponding period, rural population decreased from 306 million to 219 million while rural construction land use per capita increased, indicating that the transfer of rural population failed to be linked to the decrease of rural residential land. The new countryside construction in the eastern coastal area must obey the rules of rural transformation and development, lay stress on scientific plan and regionalization, promote rural productivity and foster interactive and harmonious development between city and countryside by optimizing urban and rural land use and developing modern agriculture and rural characteristic economy.

DOI

[11]
Long Dongping, Li Tongsheng, Miao Yuanyuanet al., 2014. Spatio-temporal characteristics and impacting factors of non-agriculturalization of China’s rural population.Progress in Geography, 33(4): 517-530. (in Chinese)Rural population non- agriculturalization is a geographical phenomenon conforming to the development trend and social progress of rural areas,and its study can provide important insights on the modernization of Chinese agriculture,acceleration of urban development,and resolution of the "Three Rural Issues".China's rural population non-agriculturalization reflects the evolution of the economic and social structures of the countryside.The prominent feature of this change is the transfer of rural laborers to non-agricultural sectors on a large scale.According to the "Report on the Development of China's Floating Population in 2010",China's proportion of non-agricultural employment will reach 65% by 2015 and 70% by 2020;the population of urban residents will rise to 77% by 2050,which means that hundred millions of rural population will transform into urban residents in the next 30 or 40 years.From a cross-disciplinary perspective,this study uses statistical data since the reform and opening up of the late 1970s and the exploratory spatial data analysis(ESDA) and partial least squares(PLS) regression analysis methods to explore the spatial-temporal patterns of the rural population non-agriculturalization process and its impacting factors,for making appropriate policies and taking proper measures to facilitate the future development of non-agricultural employment of the rural population.The results indicate that:(1) In the temporal dimension,the non-agriculturalization of rural population has experienced three distinctive stages:nationwide and in the four regions,its growth rate has gone through an "inverted U- shaped" process of growth鈫抐luctuating growth鈫抯teady growth since 1978.(2) Spatially,China's rural population non-agriculturalization shows clear regional differences.(3) Rural population non-agriculturalization has an apparent spatial polarization character鈥攖he growth hotspots moved from the north to the south and then to the central region,that is,the growth hotspots were first in two core agglomerations,then concentrated in one core area,and later diffused from a center of growth to the periphery in declining intensity.(4) The spatio-temporal differences of China's rural population non-agriculturalization is mainly controlled by the level of industrialization,urbanization,development of service industries,education,and agricultural modernization and the interaction of these factors,and the role each factor played during different time periods varied significantly.(5) Confronted with the new situations and challenges of non-agriculturalization of rural population in the transitional period at present,the research community of geography should come up with necessary theoretical frameworks for the study of this process and countermeasures for problems that occur.

DOI

[12]
Long Tianyu, Cao Huailiang, An Qianget al., 2013. Spatial distribution of transfer pollution absorbed phosphorus load in slope farmland of purple soil in Three Gorges Reservoir Region.Transactions of the Chinese Society of Agricultural Engineering (Transactions of the CSAE), 29(4): 157-164. (in Chinese)Adsorbed nonpoint source(NPS) pollution in the Three Gorges Reservoir Region,China has been increasingly recognized as a threat to aquatic environment in recent years due to the eutrophication problem of its tributary.The origin of the adsorbed NPS pollution is soil erosion.The Three Gorges Reservoir receives a significant sediment yield from soil erosion,and slope farmland is its main source.Many water and soil conservation measures have been suggested for controlling soil erosion and NPS pollution in slope farmland.Computer-based modeling is considered as a cost-effective tool for predicting the effect of measures prior to their implementation.Therefore,in this study,based on the topographic index,the spatially distributed equation of pollutant export coefficient was proposed to study the spatial distribution characteristics of absorbed phosphorus load of slope farmland in the Three Gorges Reservoir Region and predict abatement effects of new cultivation modes on pollution load in the entire Three Gorges Reservoir Region.Then the model composed of absorbed pollution load model with improved pollutant export coefficient and RUSLE was constructed and the simulation results of the model were verified.Based on this,the spatial distributions of absorbed phosphorus load from 2001 t0 2010 in the Three Gorges Reservoir Region were simulated by applying the model and GIS technology.The results showed that spatial distributions of absorbed phosphorus load were very obvious in the Three Gorges Reservoir Region and the regions of Kaixian,Yunyang,Fengjie and Zigui produced more absorbed phosphorus loads than the other regions.Furthermore,the model was also applied to predict the effect of new cultivation mode,that is,the mode of large cross slope combined with small along slope and mode of ridge combined with hedgerow,on reducing the absorbed phosphorus load of purple soil in the Three Gorges Reservoir Region.Under climatic and land use condition from 2001 to 2010 in the Three Gorges Reservoir Region,for slope farmland with purple,average absorbed phosphorus load for traditional farming technology was 15 309.70 t/a,unit grids(1 km 2) absorbed phosphorus load was 1.62 t/km 2.Compared with the traditional mode of farming,the absorbed phosphorus pollution load for the mode of large cross slope combined with small along slope and ridge combined with hedgerow,has reduced to 9 032.72 t/a and 5 511.49 t/a,unit grids(1 km 2),absorbed phosphorus pollution load was 0.96 and 0.58 t/km 2.The absorbed phosphorus load would be decreased by 41% for the mode of large cross slope combined with small along slope or 64% for the mode of ridge combined with hedgerow if the mode was used.

DOI

[13]
Luo Xiaojuan, Feng Shuyi, Reidsma Pytriket al., 2013. Simulation of agricultural and environmental policy response based on the farmer’s bio-economic model: A case study of Taihu River Basin.Chinese Rural Economy, (11): 74-87. (in Chinese)

[14]
Ouyang Jinliang, Song Chunmei, Yu Zhenronget al., 2004. The farm household’s choice of land use type and its effectiveness on land quality and environment in Huang-Huai-Hai Plain.Journal of Natural Resources, 19(1): 1-11. (in Chinese)Under the Household Responsibility System,farm households have become the basic and main micro-level decision making units on human activities in agriculture that affect s ustainable land use and environment in China since1978.Households affect s oil quality and environment via their resources consumption behavior,especiall y agricultural households,via their production decision in choice of land use t ype.The analysis of farm households鈥檆hoice of land use type and its effectiven ess based on farm household classification could give a high light on the relat ionship between the land use behaviors of farm household and the sustainability of land use and be helpful for the sustainable land use at regional level and n ational level.With the variance analysis and the analysis of different farm ho usehold types,farm households鈥檆hoice of land use type and its effectiveness we re studied based on the household survey.The spatial calculation of soil qualit y change was analyzed with soil quality data of79surveyed plots in1999(pa rt of data were collected in2000),the underground water table of179surv eyed wells in1999and the soil census data in1980.The household data of 172farms from46villages in2000were collected with classification isome tric sampling based on the ecoeconomic zones,and some other household data in 1995and1998were use d for analysis of household behaviors as well.Some conclusions can be distingu ished as following:Firstly,There were some differences in the choice of land use type amongst farm household types,because off-farm,income,land size,and education level of farm households were the key factors affecting farm household鈥檚 choice of land use type.The choice of land use type of the farmers with on-farm employment and low-income was multi-choice of land use type,while that of the farmers with off-farm employment,high-income and good education was the choice of land use type with high economi c benefit and of time-saving.Secondly,land use type choice of farm households at plot level was based on land quality,plot size,etc.Finally,different farm household types had different effectiveness on land quality and environment because of their d ifference s in the choice of land use type,fertilizer input,water resource use ,and treatment of straw.Farm鈥檚 behavior in the choice of land use is guided by multiple,often confiding,household objectives,subject to the available res ources,possible productive activities,and external economic and biophysical co nstraints.The government should have some policy to impel the farm households to choose the land use type of sustainability.

DOI

[15]
Rozelle S, Boisvert R N, 1995. Control in a dynamic village economy: The reforms and unbalanced development in China’s rural economy.Journal of Development Economics, 46(2): 233-252.A dynamic control framework is used to model the Chinese village economy in order to explain the rural sector's unbalanced growth in the post reform period. Village leaders are assumed to maximize a multi-attribute utility function by manipulating local policy instruments subject to the structural relationships in the economy. The model's parameters are estimated econometrically using a data set from forty villages in eastern China. The empirical results identify important linkages between agriculture and rural industry in village economies. Unbalanced growth can partially be explained by the way economic incentives induce individuals in rural areas to move resources toward the rural industrial sector and away from agriculture.

DOI

[16]
Sharma D K, Ghosh D, Alade J A, 2006. A fuzzy goal programming approach for regional rural development planning.Applied Mathematics and Computation, 176(1): 141-149.This paper presents a fuzzy goal programming (FGP) model for handling fuzzy goals such as production and income of farmers in rural development planning. The model is applied to assess employment opportunity in rural area by way of minimizing operational cost and increasing economic activities of the rural farmers. An attempt has been made to apply the model at the Balagarh Block of Hooghly District of West Bengal in India for increasing economic activities of rural farmers and generating local employment opportunities. The data for the model has been taken from the government statistical publication for the Hooghly District of West Bengal. A comparison of the result has been made with the result obtained from the lexicographic goal programming (LGP).

DOI

[17]
Shui Shangnan, 2013. Options for agricultural business model: Capital farm or co-operative.Issues in Agricultural Economy, (8): 32-36. (in Chinese)In view of the sustainable development of the modern industrialized intensive agriculture and globalization,this study raises the issue of rethinking the Chinese smallholder farm.By comparative analysis of the business practices in agricultural production,which were embodied changes from the smallholder farm operation,the study further explored the alternative agricultural business model under the status quo of China's economy.

[18]
Walford N, 2005. Multifunctional agriculture a new paradigm for European agriculture and rural development.Land Use Policy, 22(4): 387.This book discusses how the multifunctionality approach can be implemented through legislation and public policies, how farmers can respond to it, and whether multifunctionality presents new opportunities for less competitive or even marginal farms in Europe. It is divided in 5 parts. Part 1 discusses the link between multifunctionality and rural development policies and practices. Part 2 looks...

DOI

[19]
Xu Ping, Zhang Zhengbin, Wang Jianzhonget al., 2004. Development directions of Chinese agriculture in future.World Sci-tech R & D, 26(6): 65-68. (in Chinese)The development of Chinese agriculture is the key problem in the world, also is the research key problem in Chinese modern history. As developing of society and science and technology, the development directions of Chinese agriculture in future are as follows:the first is developing from signal untie agriculture to conglomerate agriculture then to special large model agriculture; the second is developing from grain crop agriculture to economy crop agriculture then to special feature agriculture; the third is developing from agriculture to business then to industry; the forth is developing from traditional agriculture to informational agriculture then to scientific agriculture ; the fifth is setting up alignment between government and high university and college and research institute; the sixth is setting up economy system composed by government and company and order and farmer; the seventh is developing ecology agriculture and subsistence agriculture.

[20]
Yang Linzhang, Shi Weiming, Xue Lihonget al., 2013. Reduce-retain-reuse-restore technology for the controlling the agricultural non-point source pollution in countryside in China: General Countermeasures and Technologies.Journal of Agro-Environment Science, 32(1): 1-8. (in Chinese)

[21]
Zhang Wuwei, Zhang Fuming, Yang Xuecheng, 2009. The relationship between the transfer of surplus rural labor force and its land disposal: An analysis based on the survey data of 2421 agricultural transfer labor force in Shandong Province.Chinese Rural Economy, (3): 85-90. (in Chinese)

[22]
Zhang Yan, Gao Xiang, Zhang Hong, 2012. Association study between water quality of Chaohu lake and resources input in agriculture of basin.Environmental Sciences, 33(9): 3009-3013. (in Chinese)In order to discuss the association between the water quality of Chaohu Lake and the resources input in agriculture of the basin,factors that may affect the lake eutrophication are chosen,such as surplus fertilizer,irrigated area with saved water,agricultural films,water and soil loss control and so on.The methods of correlation analysis and stepwise regression are used.Furthermore,a new method,combined with the Technique for Order Preference by Similarity to Ideal Solution(TOPSIS) method,calculating the surplus fertilizer is designed.The results indicate that among various resources input in agriculture of the basin the surplus fertilizer,irrigated area with saved water and agricultural films have a great influence on Chaohu Lake eutrophication.And one year's lag phase between the water quality of Chaohu Lake and the surplus fertilizer is confirmed.Therefore,it is necessary to raise the utilization efficiency of fertilizer,to improve the irrigation way and to decrease the agricultural water consumption in order to conserve resources and to reduce the influence of agricultural production on the water quality of Chaohu Lake.

PMID

[23]
Zhao Chunyu, Su Qin, Fang Jueshu, 2013. The research system and methods of the rural labor’s environment cognition in the employment transference’s process.Geographical Research, 32(5): 891-901. (in Chinese)Based on the viewpoints of behavioral geography and the relative literature review at home and abroad,the behavior process of the rural labour's employment transference was analyzed and it was considered that the employment decision-making behavior was the intention of employment transference based on specific motivation through environment cognition's filtering.And the rural labour's environment cognition referred to the exterior perception,the comprehensive understanding and integrated interpretation of rural labour's varied working place and its environment.According to geographic cognitive theories,this paper presented a research system about the rural labour's environment cognition in the employment transference's process.Firstly,based on the aim and the process of employment transference in the environment cognition's research,it discussed the influence of the motivation and goals on the environment cognition and how this environment study relied on the process of employment transference.Secondly,on the basis of individual characteristics and the group cultural factors,it focused on the analysis of differences between the individual and the group rural labour's environment cognitive process,especially from the angles of household,gender and young generation.Thirdly it conducted studies on environment cognition's levels,namely the environment feature's perception,the environment object's cognition,the environment pattern's cognition and the relationship among them.The methods of the environment cognition research were also discussed in this paper.Based on questionnaires and major groups,the data mainly rely on the micro individual experience.Through the factor analysis,structure equation,spatial decision model and so on,the relationship among the environment cognitive factors and the relationship among environment cognition,motivation and decision-making was discussed.Moreover,the reasons were explored through the ethnography method in combination of qualitative and quantitative analyses.Through the research of micro environment cognition and space path,we can establish ties with social macro space behavior research.It was predicted that the research of the rural labour's environment cognition would promote the development of the mixed research ways.

DOI

[24]
Zhao Xueyan, 2012. Environmental perception of farmers of different livelihood strategies: A case of Gannan Plateau.Acta Ecologica Sinica, 32(21): 6776-6787. (in Chinese)Environmental perception has been drowning more and more attention all over the world.Through stratified random sampling survey,participatory rural appraisal and investigation of plots,117 household are investigated and sampled.Farmers are divided into three types:the farmer household,the household with combined occupation and the off farming household.Using the investigation data,the paper analyzes the environmental perception of the farmers of different livelihood strategies in the Gannan Plateau.The results show:(1)the farmers鈥 livelihood diversification is low,the livelihood diversification index of the farmers is 1.76,and of in the pure pasturing area,the farming-pastoral area and the farming area,the non-agricultural level is higher than its predecessor,but the non-agricultural activity is mainly doing work for others;(2) the farmers鈥 ecological attention is high,but the cognition of ecology protection is low,the ecological attention declines from the farmer household to the household with combined occupation and then to the off farming household,the index of ecological attention is 2.80,2.72 and 2.65 respectively,but the cognition of ecology protection increases accordingly,the index of the cognition is 2.00,2.22 and 2.26 respectively;(3) The majority of interviewees(nearly 76.92 per cent) consider that the local eco-environment is worse than recent years before,the farmer household鈥 environmental deterioration perception is the first,the secondary is the household with combined occupation,the third is the off farming household,the index of ecological change perception is 1.20,1.37 and 1.44;(4)The perception of grassland degradation and water resource shortage declines from the farmer household to the household with combined occupation and then to the off farming household;(5)The majority of interviewees(nearly 86.32 per cent) are willing to take part in the environment protection activity,the participation willing of the household with combined occupation is higher than the off farming household and the farmer household.

DOI

[25]
Zhong Jianbing, Shao Jing’an, Xie Detiet al., 2014. Evaluation and changing characteristics of fertilizer input in different agricultural systems in the Three Gorges Reservoir Area.Chinese Journal of Eco-Agriculture, 22(11): 1372-1378. (in Chinese)As environmental issues have become increasingly prominent in rural development, researches on investment in different agricultural systems and the transformation processes of agricultural products are critical in resolving non-point source pollution issues of rural environment. They also contribute to the development of targeted programs for controlling non-point source pollution.In this paper, the PRA(Participatory Rural Appraisal) method was used to assess fertilizer input of different modes of management of agriculture in the Three Gorges Reservoir Area of Chongqing. Based on the investigated materials and the results of comprehensive assessment of the research area, agricultural production and operation modes were divided into general farmers(GF), big farming households(BF), company enterprises(CE), big breeding households(BB), big farming and breeding households(FB) and co-operative farmers(CF). By accounting for fertilizer input per unit land area in different agricultural operation modes, the distinctvariation characteristics of the quantity and structure of fertilizers were identified in the research area. The results showed that: 1) The total amount of fertilizer consumption increased from 1997 to 2011, while the total amount of compound fertilizer grew significantly in recent years. 2) Although different agricultural operation modes had different structures of fertilizers, there were some internal similarities existed among GF, BB and FB and also among BF, CE and CP. While GF, BB and FB farmers used large proportions of conventional fertilizers, BF, CE and CP farmers used more emerging fertilizers like organic fertilizer, K fertilizers, etc. 3) The structures of fertilizer in the research area were dominated by conventional fertilizers, with significantly higher N and P input per unit land area under GF and BF than under CE, BB, FB and CP. 4) The variations in planting structures were due to variations in agricultural operation modes. GF, BB, and FB modes were mainly of traditional crops like corn, rice, sweet potato and irish potato,showing a small but comprehensive characteristics. While BF, CE and CP had the great breakthrough in terms of technological support, commercial production operations in some areas turned to the production of distinct crops. The order of fertilizer input per unit land area for different corps of the agricultural operating modes in the Three Gorges Reservoir Area of Chongqing was corn vegetables potatoes other crops sweet potatoes fruit garden paddy.

[26]
Zhong Jianbing, Shao Jing’an, Yang Yuzhu, 2015. Spatial distribution characteristics of pollution load of crop farming in the Three Gorges Reservoir Area (Chongqing).Acta Scientiae Circumstantiae, 35(7): 2150-2159. (in Chinese)Abstract Due to the great influence of crop farming to water environment, it's significant to analyze the spatial distribution characteristics of pollution load, which help to prevent and control non-source pollution in the Three Gorges Reservoir Areas. On the basis of statistic data of land use and farmer interview, and by using ARCGIS and stepwise regression method, this paper analyzes the spatial distribution characteristics of pollution load of crop farming in the Three Gorges Reservoir Area (Chongqing). The indicators include fertilizer use intensity, pollution load per unit area, and crop variety. The results indicate that: (1) The pollution load caused by fertilizer in study area is quite high, reaching 3.54 t路km-2; (2) The spatial distribution of pollution load caused by crop farming varies a lot in study area, and it closely related to the farming variety and distribution; (3) The closer the farming area to the downtown, the heavier the pollution load, showing the distribution characteristics of "class-point source"; (4) The crop type index, proportion of agricultural workers, output value per unit area of arable land and farmland conversion rate have significant impact on total pollution load, TN and TP; (5) Other factors have positive impact on total pollution load, TN and TP except cultivated land circulation.

DOI

Outlines

/