Research Articles

Sandwich mapping of rodent density in Jilin Province, China

  • LIU Tiejun 1, 2, 3 ,
  • XU Cheng 4 ,
  • ZHANG Hongyan 6 ,
  • XU Chengdong 1
Expand
  • 1. State Key Laboratory of Resources and Environmental Information System, Institute of Geographic Sciences and Natural Resources Research, CAS, Beijing 100101, China
  • 2. University of Chinese Academy of Sciences, Beijing 100049, China
  • 3. China Siwei Surveying & Mapping Technology Co. Ltd., Beijing 100048, China;
  • 4. Prevention and Control Base of Plague and Brucellosis, Chinese Center for Disease Control and Prevention, Jilin 137000, Jilin, China
  • 5. Chinese Center for Disease Control and Prevention, Beijing 102206, China
  • 6. School of Geographical Sciences, Northeast Normal University, Changchun 130024, China

Author: Liu Tiejun, PhD, specialized in spatial sampling and data analysis. E-mail: liutj@lreis.ac.cn

*Corresponding author: Wang Jinfeng, Professor, E-mail: wangjf@lreis.ac.cn
Ma Jiaqi, E-mail: majq@chinacdc.cn

www.geogsci.com www.springerlink.com/content/1009-637x

Received date: 2017-05-05

  Accepted date: 2017-07-27

  Online published: 2018-03-30

Supported by

National Natural Science Foundation of China, No.41531179,No.41421001,No.41271404

MOST, No.2016YFC1302504

Special Scientific Research Fund of Public Welfare Profession of China, No.GYHY20140616

Copyright

Journal of Geographical Sciences, All Rights Reserved

Abstract

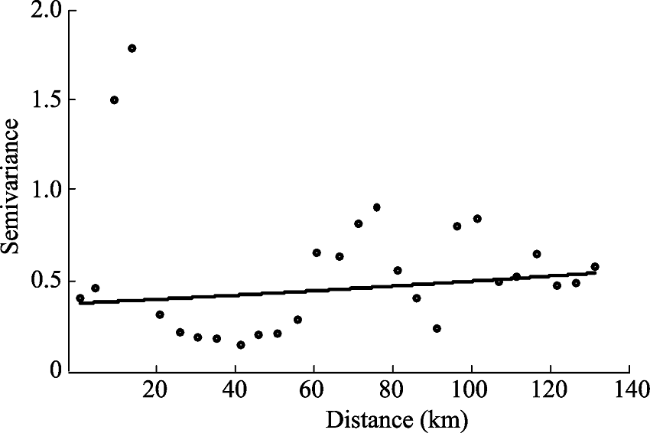
Rodents are the main host animals that spread plague, and Spermophilus dauricus (S. dauricus) is the most common rodent in North China. In this study, a rodent density survey was carried out in China’s Jilin Province from April to August 2005. Moran’s I and semivariogram curves were used to investigate the spatial distribution characteristics of the sampling data. We found that the spatial auto-correlation index was low and failed to generate a meaningful semivariogram curve. In this case, commonly used interpolators, such as kriging, were not suitable for mapping density over the study area. However, the Sandwich model, which is based on spatial stratified heterogeneity, could be applied to our data. Our results showed that the type of soil and land use significantly influenced the distribution of rodent density, and the interactive effect of these variables was much stronger than that of each variable alone. The Sandwich-estimated rodent density map showed that rodent density increased from the southeast to the northwest in Jilin Province. Finally, a framework of a rodent density survey using the Sandwich model was introduced.

Cite this article

LIU Tiejun , XU Cheng , ZHANG Hongyan , XU Chengdong . Sandwich mapping of rodent density in Jilin Province, China[J]. Journal of Geographical Sciences, 2018 , 28(4) : 445 -458 . DOI: 10.1007/s11442-018-1483-z

1 Introduction

Plague is a natural epidemic disease with foci that are widely distributed on every continent, excluding Australia (Gage and Kosoy, 2005; Peset, 2015). Given its sudden onset, infectiousness, rapid spread, and high fatality rate, plague is a deadly infectious disease that causes serious damage to humans. Historical records show three incidents of global prevalence of plague, which resulted in at least 160 million deaths (Perry and Fetherston, 1997).
Plague has resurged on a global level since the 1980s. Monitoring results show that the natural epidemic foci and extent of areas affected by plague gradually increase. Plague has been reactivated in animals and still poses a threat to humans. Consequently, in 2000, the World Health Organization listed plague as a resurgent infectious disease. In China, the number of human cases of plague increased from 16 in 1999 to 254 in 2000. It declined after 2000, but the fatality rate multiplied by 25 times overall, reaching 100% in critical areas (Zhou and Yang, 2010). Therefore, the prevention and control of the spread of plague remains an important public health concern. The relationship between the distribution of animals, such as rodents, and the prevalence of plague has long been established (Garnham, 1949). Since various rodents are potential primary hosts facilitating the spread of plague, and rodent density is a common indicator in evaluating the risk of a plague outbreak (Lotfy, 2015; Wang and Li, 1997; Yang et al., 2000), monitoring and the statistical inference of this indicator directly affect the evaluation of the risk of plague outbreaks (Gage and Kosoy, 2005; Stenseth et al., 2008).
Several scholars have studied rodent distribution (Jiang et al., 2007; Liu et al. 2007; Li et al., 2012; Zhao, 2012; Wang et al., 2013). In these studies, the impact of geographic changes (e.g., soil, vegetation, and terrain) on rodent density was considered when determining monitoring spots; however, most of them focused on the relationship between rodent density and its environmental factors, few interpolated maps are presented, probably due to the high spatial stratified heterogeneity of the target, which is different from the principle of spatial autocorrelation assumed by most existing interpolation models. Fan et al. (2016) used the empirical Bayesian kriging model to map the spatial distribution of Spermophilus dauricus (S. dauricus) in Manchuria, but they did not evaluate the suitability of such a model in their study—after all, spatial statistics, such as kriging and geographically weighted regression (GWR), are believed to only be suitable for the modeling of inherently continuous features (Diggle, 2003). Besides geostatistical techniques, point pattern analysis (such as kernel smoothing techniques) (Wand and Jones, 1994), generalized linear models (GLM) (Thuiller, 2003), and ecological-niche factor analysis (ENFA) (Hirzel and Guisan, 2002), etc., are also widely used. Moreover, Hengl et al. (2009) suggested an optimized method by combining the point pattern analysis, ENFA, and GLM techniques, which was believed to be more promising as it would exploit the advantages of each. However, its output map was found to be too greatly affected by the distribution of the samples rather than the environmental predictors, while the predictors could be accurately selected, the result would likely be biased if the samples’ distributions were unjustified. Furthermore, if rodent density were distributed heterogeneously, and the values of the environmental predictors were categorical variables (such as types of vegetation or land use), then it would be difficult to implement the GLM process if there were too many categories (Salim and Daoud, 2003).
The Sandwich model (Wang et al., 2002, 2013) is a simple and applied technique for the study of subjects with remarkably distinct spatial characteristics, and has been used in the fields of environmental survey and public health etc. Chen et al. (2012) analyzed soil Cr content according to the concept of the Sandwich model at the stage of setting up samples, and they found that the samples obtained by Sandwich sampling achieved the minimum kriging estimation error. Wu et al. (2016) performed a regional precipitation survey in the same way as Chen et al. (2012), where Sandwich sampling was also found to be the best approach. However, at the statistical interpolation stage, both sets of researchers relied on kriging to provide an interpolation model rather than the Sandwich model; this might be caused by the researchers’ inexperience with the Sandwich model. Hu et al. (2015) mapped the schistosomiasis risk in China’s Anhui Province by using the Sandwich model with a knowledge layer of land use, which was a well-recognized factor closely related to the distribution of schistosomiasis, whereas the geographical detector model proposed by Wang et al. (2010b) was used to check the spatial stratification of the schistosomiasis risk. The results showed that the spatial distribution of land use could explain 71% of the risk variation.
Northwest Jilin Province, China, is the natural focus of plague, and S. dauricus is its main source of plague and a harmful rodent species in this location (Zhang et al., 2004; Zhang et al., 2006; Jiang et al., 2007; Liu et al., 2007). In the present study, taking four municipal cities in western Jilin as study regions, a sample survey was performed to investigate the distribution of S. dauricus density in the study regions by using the Sandwich model. Similar to Hu et al.’s (2015) study, the geographical detector model (Wang et al., 2010b) was used to select the best influencing factors of rodent distribution which were then taken as knowledge layers before implementing the Sandwich model. However, this study went one step further to optimize the knowledge layer by studying the interaction effects of alternative factors, according to the concept of geographical detectors. Additionally, a framework was developed to streamline the general process of carrying out a rodent density survey through the use of the Sandwich model, which could provide guidance to future researchers.
This paper is organized as follows: Section 2 describes the characteristics of the rodent survey data and the methods used in estimating multiregional rodent density and obtaining optimized knowledge layers of the Sandwich model. Section 3 presents the Sandwich mapping results. Section 4 presents the discussion and concluding remarks.

2 Data and method

2.1 Rodent survey data

In this study, 50 survey areas were selected randomly in the study area. The study was conducted from 2nd April to 7th August, 2005. The quadrat method was used to survey rodent density in each of the survey areas. Within each survey area, 0.5% of the sampling quadrats were 100 m * 100 m in size and were selected by considering their differences in geomorphology. In each quadrat, one bow clip (see Figure 1a) was installed at each rodent hole and was checked every 2 hours from sunrise to sunset every day. The bow clips with caught rodents were replaced with new ones. Thus, rodent density was defined as the number of rodents caught in each quadrat in one day.
Figure 1 Photographs of the field survey
Rodent populations in arid and semi-arid regions usually vary according to the season (Liu et al., 2007). S. dauricus is a dormant species that comes out of hibernation in April and enters hibernation in early September. The species reaches its yearly population minima in early April and achieves it maxima between July and August (Luo and Zhong, 1990). To avoid the influence of seasonal change on the modeling result, survey data from July with 627 sampling quadrats distributed in 14 survey areas were chosen from the total of 2676 samples to compute the entire study area’s rodent density.
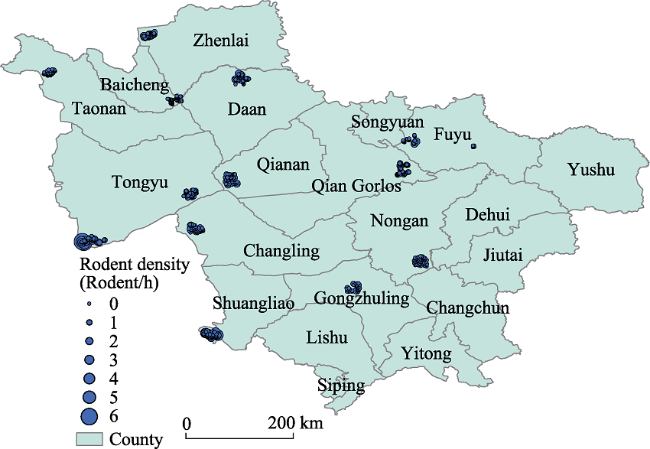
Figure 2 Distribution of rodent density from survey data
Figure 2 illustrates the positions of the survey points. Rodent density at a sample point is represented by the size of that point. Samples with the highest rodent density were found in Tongyu. Figure 3 is a histogram of sampled rodent density; more than 92% samples are zero, and only two samples are 6.
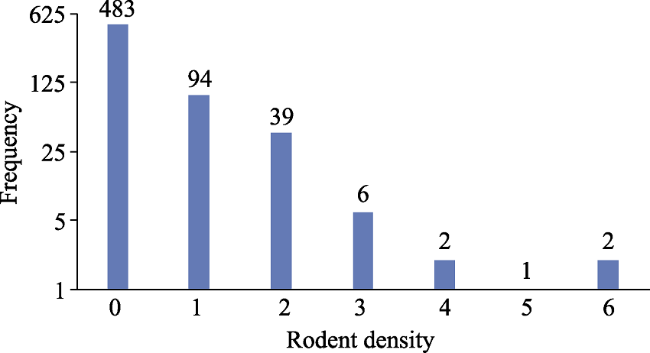
Figure 3 Histogram of rodent density samples

2.2 Analysis of the spatial distribution characteristics

Testing the distribution of the spatial characteristics of the study subjects is essential for selecting an appropriate sampling and statistical method. First, the Moran’s I of the samples was investigated to observe the autocorrelation of rodent density distribution. The spatial adjacency matrix used in the calculation was established using the inverse distance weighting method, that is, a farther distance corresponds to a smaller weight. In the present study, the Moran’s I value was 0.24, which means that the spatial correlation of the rodent density survey data was not high.
Furthermore, the semivariogram curve of the survey data was obtained through a spherical model (Figure 4) to determine the distribution pattern of the samples. The variation function curve showed that no stable semivariogram could be established to model the distribution of the rodent density samples.
Figure 4 Semivariogram curve of rodent density survey data in Jilin (Spherical model, Nugget 0.30, Partial Sill 0.69, Range 468185.40)
The results of the exploratory data analyses conducted indicated that kriging, which relies on global spatial correlation, was not suitable for analyzing our data. This might be a consequence of the conditions under which the sampling quadrats were aggregated. In the 14 scattered areas sampled (see Figure 2), the average distance between each pair of the nearest neighbored quadrats was about 2 km in each area, whereas the distance between the nearest neighbored areas was 30 km; thus, the semivariance curve could not be modeled because of a lack of data in the medium range. Thus in this analysis, we used the Sandwich model which relies on spatial heterogeneity.

2.3 Geographical detector

The geographical detector model can be used to quantitatively assess spatial heterogeneity and the influence of potential driver factors (Wang et al., 2010b; Hu et al., 2015). For instance, in this study it was used to detect the influence (qualified by the q-value) of a set of selected knowledge layers on the distribution of rodent density. The higher the q-value, the stronger the determinant power of the knowledge layer. The q-value is found to follow the noncentral F probability density distribution (Wang et al., 2016). Besides the factor detector, the interactive detector is given by the geographical detector, which is used to evaluate the combined determinant power of the two knowledge layers.
The q-value of a given knowledge layer can be expressed as follows:
where σ2 refers to the dispersion variance in the entire study region, Nh refers to the number of subpopulations in the knowledge unit, N refers to the number of populations in the whole region.σ2h is the dispersion variance in knowledge unit h. The second item at the right side of the equation is the weighted sum of variance of each knowledge unit. q ∈[0,1]; if the attributes of all subpopulations in each of the knowledge units are the same, then q is equal to 1, if the population is random, then the second item at the right side of the equation is 1, and q is equal to 0. With respect to the interactive detector, a new knowledge layer is generated by overlaying two given knowledge layers; thus, h and L in formula (1) are the unit and unit number of the new knowledge layer, respectively.

2.4 Sandwich model-based mapping

The Sandwich mapping model is based on the concept of spatial stratified heterogeneity. It consists of sampling, knowledge, and reporting layers. The knowledge layer is essential to determine the accuracy of the statistical inference for the Sandwich model, and this layer can be established using a priori knowledge, historical data, or proxy variable analysis (Li et al., 2008; Wang et al., 1997). In this study, this model established the transfer of information and variance from the sampling quadrats to the reporting layer (county regions) via knowledge layers to eliminate the stiff link between sampling and statistical inference.
First, the mean value of rodent density \(\overline{y}_z\) and its variance v\(\overline{y}_z\) of the zth unit of the knowledge layer were calculated. Then, the mean value and its variance of the rth county were calculated from the knowledge layer on the basis of the feature of stratified sampling (Cochran, 1977),
where r = 1, …, Nr, and Wrz refers to the weight of the zth unit of knowledge layer in the r reporting unit.
The total observed variance of reporting unit r can be expressed as:
Hence, the mean and its variance in the reporting layer were estimated on the basis of the knowledge layer instead of the sampling layer.

2.5 Selection and optimization of knowledge layers

As discussed earlier, the performance of Sandwich mapping is determined by the knowledge layers that are generated by prior knowledge of the spatial distribution of S. dauricus. Generally, S. dauricus thrives in habitats with broad, non-cultivated, and overgrown dunes, in dwarf crop lands on either side of earthen roads, in field spaces, and in meadow steppes. The density of S. dauricus varies depending on the soil, vegetation, and geomorphology. Recently, human activity was found to dramatically affect the density of S. dauricus (Gang et al., 2006; Zhou et al., 2007; Luo and Zhong, 1990). Rodent density is high where soil texture and terrain are appropriate, and where plants and fruits serve as rich food sources. Brown calcic soil in gently sloping Caragana microphylla hills, and areas with tuft grass and Artemisia frigida are conducive habitats for S. dauricus. Additionally, soil water conditions were found to have a negative relationship to S. dauricus density, as the species prefers short grass or dry soil habitats (Wang et al., 2003). Among the abovementioned factors, the datasets of soil, land use, vegetation, and Normalized difference vegetation index (NDVI) were selected as alternative knowledge layers (Figure 5), where soil data reflects the distribution of different soil types, land use data represents conditions of geomorphology and human activity (since land use is the outcome of the interaction between geomorphic conditions and human activity, etc.), vegetation data reflects the distribution of different vegetation types, and NDVI data reflects the abundance of vegetation cover.
The q-values and their statistical significances of the four knowledge layers and their interactive effects are shown in Table 1.
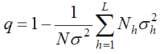
Table 1 q-values of single variables and their interactive effect
Soil Land use NDVI Vegetation
Soil 0.323***
Land use 0.412*** 0.288***
NDVI 0.237*** 0.347*** 0.255***
Vegetation 0.374*** 0.296*** 0.290*** 0.168***

Significance level: *** 0.01

Table 2 Summary of samples laid in the soil layer
Name Sample count Mean (rodent/h) Variance
Luvisols 14 0.07 0.07
Pedocal 297 0.29 0.34
Primarosols 153 0.48 0.7
Hydromorphic 118 0.12 0.19
Saline-alkali 41 0.98 2.52
Anthrosol* 0 0 0
Lake/River 4 0 0

*Since the anthrosol area accounted for only 1.2% of the study area, there were no anthrosol samples which were neglected in the q-value and Sandwich calculations.

It is noteworthy that there will be too many units generated in new knowledge layers after overlaying two given layers, and that a lot of units will have no samples, thus the q-value will fail to be calculated. To avoid such results, a two-step cluster command was performed in SPSS to merge the knowledge units. The unit number of combined knowledge layers was set to nine, which was determined by the unit number of the vegetation classification with the most units among the four knowledge layers. The significance of the q-value was calculated following Wang et al. (2016).
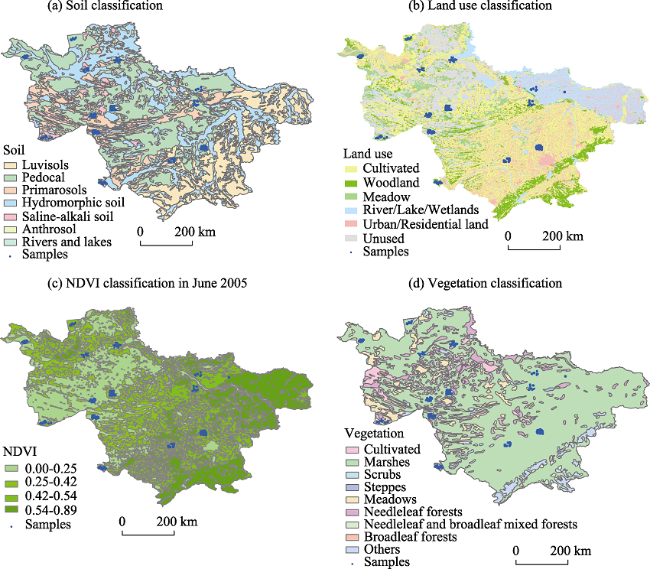
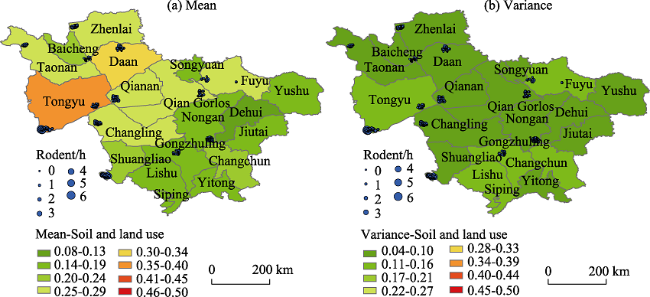
Figure 5 Alternative knowledge layers in the study area
A comparison of the q-values of the four knowledge layers implies that soil (0.323) and land use (0.288) classifications are the top two; the summaries of samples laid in each unit of the two layers are listed in Tables 2 and 3. Intuitively, soil is the preferred knowledge layer in this study, and land use is secondary. However, the combined q-value of soil and land use (0.412) is much higher than that of soil alone, which means that the determinant power is raised significantly by the combined effect of the two layers. Consequently, it is reasonable to optimize the knowledge layer of the Sandwich estimation of the rodent density by combining the soil and land use layers (Figure 6).
Figure 6 Combination of soil and land use layers
Table 3 Summary of samples laid in the land use layer
Name Sample count Mean (rodent/h) Variance
Cultivated 305 0.16 0.21
Woodland 61 0.77 0.95
Meadow 134 0.59 0.88
River/Lake/Wetlands 51 0.1 0.17
Urban area 19 0 0
Unused 57 0.61 1.31

3 Sandwich mapping

The results of the Sandwich mapping of rodent density in 20 county administrative units in the study area, which were generated by Sandwich software found on the website www.sssampling.org/sandwich, are shown in Figures 7-10, where four types of knowledge layers, including soil, land use, NDVI, and vegetation type, were used. The domain division in the mean statistical thematic maps considered the comprehensive minimum (0.08) and maximum (0.5) values as the initial value and final value, respectively. Then, eight division levels were set at the average interval. In this way, the colors of all mean thematic maps were comparable, and the differences in the spatial distributions of the estimated results between the different knowledge layers were expressed.
Typically, the reliability of an estimate (\(\hat{\mu}\)) is assessed by mean squared error (MSE) (Cochran, 1977: 15), which is defined as
MSE(\(\hat{\mu}\))= V(\(\hat{\mu}\))+B2 (4)
where V(\(\hat{\mu}\)) is the variance of \(\hat{\mu}\), and B is the sampling bias. Since the Sandwich model is based on stratified sampling (Wang et al., 2013) that is theoretically unbiased (Cochran, 1977: 91), i.e. B = 0, the variances of estimates V(\(\hat{\mu}\)) generated by the four knowledge layers of the Sandwich model could be used as the indictors of their performance, where a smaller variance represents a more reliable estimate (Cochran, 1977; Haining, 1988; Griffith et al., 1994; Wang et al., 2010a; Wang et al., 2013). In this study, the variances of the statistical thematic maps were presented together with the mean map. The variance maps were drawn in the same way as the mean map, with the minimum value being 0.04 and maximum value being 0.5.
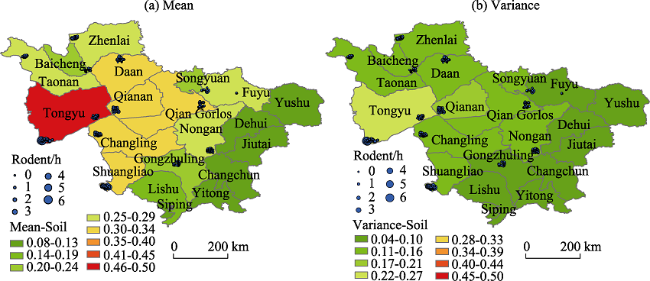
Figure 7 Sandwich estimating result based on the soil knowledge layer
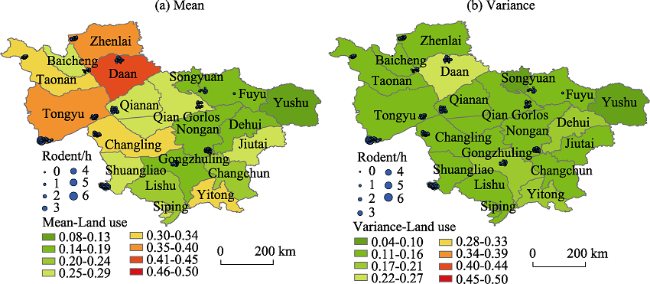
Figure 8 Sandwich model estimates based on the land use knowledge layer
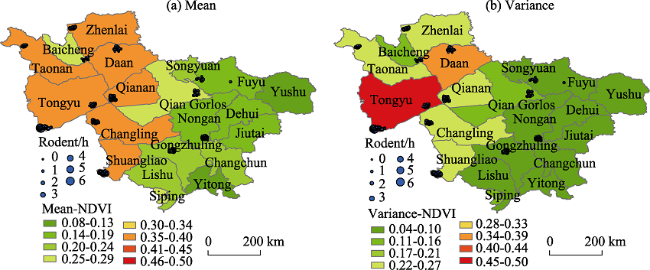
Figure 9 Sandwich model estimate result based on the NDVI knowledge layer
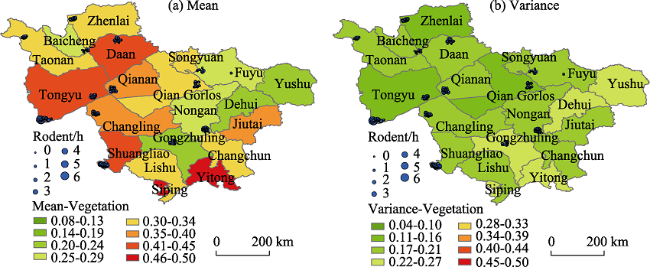
Figure 10 Sandwich model estimate based on the vegetation knowledge layer
Comparative analysis of the statistical results from the four knowledge layers showed that the vegetation layer yielded, on average, the highest variance (average variance of the mean of all the counties reached 0.192), followed by the NDVI (0.149), and the land use (0.134) layers. The soil type layer yielded the lowest average variance (0.099). Generally, the reliability of the estimated values from the four knowledge layers were in the order of soil type > land use > NDVI > vegetation type, which was the same as the order of their q-values. This finding highlighted the fact that the q-value could be used as a reference in finding suitable knowledge layers during the process of Sandwich mapping.
As mentioned before, combining the soil type and land use layers might optimize the Sandwich mapping of rodent density. The thematic maps of the estimated means and variances from the combined knowledge layers are shown in Figure 11. The classification rule is consistent with that of the four previous knowledge layers.
Figure 11 Sandwich model estimates based on the combined knowledge layer
A comparison of the statistical variance map between the Sandwich model estimates from the combined knowledge layers and the four single layers shows that the variance of the estimated mean values in the whole study area from the combined knowledge layer (0.085) is less than that of the individual layers. This indicates that the results from the combined knowledge layers are the most reliable.
From the mean statistical map using the combined knowledge layer, the overall trend in the distribution of rodent density was higher in the northwestern counties than it was in the southeastern counties. The rodent densities in each of the counties varied from 0.122/h to 0.373/h, with an area weighted mean of 0.22/h. Tongyu, Daan, Changling, Zhenlai, and Taonan counties, located in the northwest of the study area, were the top five counties with the highest rodent density. Rodent densities of counties without samples, such as Lishu, Siping, Jiutai, etc., were still estimated using the Sandwich model based on the bridge of the knowledge layers. This result was similar to that of both Jiang (2007) and Zhou (2007) who studied rodent density survey data in 16 counties in northwestern Jilin from 2005 to 2006 and found that the counties of Tongyu, Qianan, Taonan, and Shuangliang (located in the northwest of the study area) had the highest rodent density; the mean rodent density was 0.27/h. It is noteworthy that the results differed a little from ours, probably because the survey periods were different; additionally, the mean value in our study was calculated indirectly from the knowledge layer of the Sandwich model, instead of from the samples themselves.
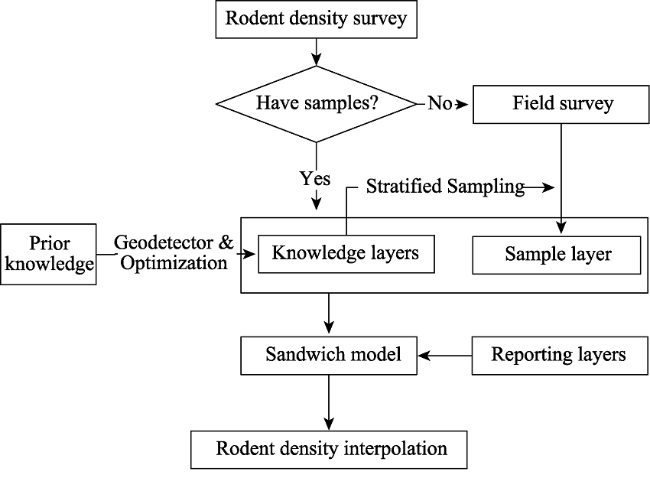
Figure 12 The rodent density survey framework using the Sandwich model.

4 Discussion and conclusions

This study introduced an applied method of mapping rodent density in 20 counties in northwestern Jilin by considering the ecological habits and distribution law of S. dauricus—the main rodent species in the entire study area. Soil type was found to be the most reliable explanatory variable for Sandwich model estimates of rodent density; however, the performance of the combined layers of soil type and land use was even better than that of soil type alone. The advantages of this study in comparison with previous studies are discussed below.
First, since the spatial distribution of the sampling quadrats was not even, spatial correlation was impractical for the estimation of rodent density in blank areas; hence, spatial correlation-based models, such as kriging, were not suitable for this study (Wang et al., 2012; Wang et al., 2013). However, the distribution pattern of samples was not a problem for the Sandwich model. Unlike kriging, the Sandwich model can incorporate spatial heterogeneity by following a concept similar to stratified sampling, which assumes that the inner value of a given stratum (unit of knowledge layer) is homogeneous (Cochran, 1977). In this way, sampling information can be transferred from areas with samples to areas without samples via the knowledge layer; as a result, the rodent density of counties (units of reporting layer) without samples laid can also be reliably inferred.
Secondly, the geographical detector model was used in this study to evaluate the influence of various natural and human factors on rodent distribution and their interactive effects. By comparing q-values, the factors with the greatest effects were selected (Huang et al., 2014), which was important for setting sampling quadrats and for the Sandwich model estimation. By extrapolating these results, the next time when a new rodent density survey is performed in an area like northwestern Jilin Province, given the existing knowledge layers of soil type and land use, only a few sampling quadrats will be needed in each unit of the knowledge layer, because the rodent density across one unit is thought to be approximately the same. In the Sandwich model estimation, the variances of the estimated means of the reporting units were determined by the quality of the knowledge layer (Wang et al., 2010a). The geographical detector model is an applied tool to ensure the accuracy of the Sandwich model.
Finally, the Sandwich model used in this study fully considered the priori knowledge of rodent habitat and community structure. We started with prior knowledge of the natural and human factors that were closely related to the distribution of rodents. Then, we used the sampling data to verify the representativeness of the knowledge layer instead of the sample itself. This process effectively used previous knowledge and incorporated it into the calculation process of the model, thus avoiding bias and reducing our dependence on data sampling (Li and Wang, 2004; Zhang et al., 2013). Therefore, the reliability of the obtained result was high.
The most significant result of this study was that we used Sandwich mapping to extrapolate our sample data to 20 counties, and every county was assigned a rodent density of its own. Thus, local departments of disease control could distribute their deratization material according to the differences in rodent density in each county. This is an efficient means of increasing the effectiveness of deratization, and to prevent the unnecessary wastage of materials.
However, there are also some limitations to this study. Although the results of this study indicate that soil and land use and their combined effect are the most appropriate knowledge layers for S. dauricus surveying, there were several factors worth further study. For example, we compared the q-values of some other factors, such as geomorphology and terrain, which were also thought to be closely related to the distribution of S. dauricus in the study area, but their q-values were much lower than the four factors mentioned above. It may be because the distribution of the quadrats did not fit the zoning of the geomorphology and terrain factors well, thus the inner variances of the units of the factors were much too great for q-value calculation.
In summary, in the fields of public health and ecological environment, etc., several concerns have been raised with regard to applying sampling and inferring models, including how to select the most suitable models, and how to obtain the best results under the existing conditions. Particularly for users who are unfamiliar with sampling methods and theories, these problems impede scientific and stable applications of spatial sampling methods. Based on the findings of this study, a formal process of engaging in a rodent density survey could be raised to answer the questions above, as shown in Figure 12.
In undertaking a task such as a rodent density survey, the first step is to collect prior knowledge, including the spatial distribution law of the rodent and the factors closely related to it. If there are existing samples, then the second step is to utilize Geodetector software to select the best knowledge layer, or optimize it by combining the layers with the largest interactive q-values. Otherwise, stratified sampling should be performed according to the knowledge layer that was chosen based on the prior knowledge. Finally, the sampling, knowledge, and reporting layers are prepared for the Sandwich model, and the mapping of rodent density is obtained.

The authors have declared that no competing interests exist.

[1]
Chen F, Dai H, Hu Y et al.Hu Y , 2012. Study on regional soil spatial sampling method.Geography and Geo-Information Science, 28(6): 53-56. (in Chinese)The comparative study on different spatial sampling method is an important means to find a spatial correlation of the different resources and survey the most appropriate sampling design.In this paper,the soil Cr content in Zengcheng City in Guangdong Province was taken as spatial elements,three kinds of methods for sampling analysis that respectively were the spatial simple random sampling and spatial stratified sampling,spatial Sandwich sampling were discussed.For ease of comparison of three methods of sampling precision,this paper set the same sample size,and then used the Kriging interpolation on the sampling accuracy evaluation,and then did cross-validation after Kriging interpolation.In cross-validation process,|ME| value of the Sandwich space sampling method is the most closet to zero,it is 0.0973,and the value of spatial simple random sampling is the largest.The order of the |RMSE-ASE| value is:spatial simple random samplingspatial stratified samplingspatial Sandwich sampling.The results show that,in the case of more rich of prior knowledge,the sample points which gained by Sandwich sampling attain the minimum Kriging estimation error in the case of predicting the distribution of the contents of heavy metals in soil,Sandwich sampling has higher sampling precision and wider range of application.

[2]
Cochran W G, 1977. Sampling Techniques. 3rd ed. New York: Wiley.

[3]
Diggle P, 2003. Statistical Analysis of Spatial Point Patterns. 2nd ed. Arnold Publishers.

[4]
Fan L, Wu E, Qu Xet al., 2016. Distribution characteristics of Spermophilus dauricus in Manchuria City in China in 2015 through ‘3S’ technology.Biomed Environ. Sci., 29(8): 603-608.Plague is a virulent infectious disease in China. In this study, ‘3S’ technology was used to perform spatial autocorrelation analysis and spatial interpolation analysis for Spermophilus dauricus ( S. Dauricus , a species of ground squirrel) captured in Manchuria City in 2015. The results were visually inspected. During the two-month (May to July) plague surveillance in 2015, 198 S. dauricus individuals were captured in the study area in Manchuria City (48 monitoring areas) by using a day-by-day catching method. Spatial autocorrelation was conducted using the ArcGIS software, and the following significantly different results were obtained: Moran's I =0.228472, Z -score=2.889126, and P <0.05. Thus, a spatial aggregation was observed. In 2015, the distribution of S. dauricus diminished from west to east and from north to south of Manchuria. Geo Detector software was used to analyze the habitat factors affecting the spatial distribution of S. dauricus . This highly clustered species mainly exists in suburban communities, construction sites, and areas surrounding factories. In future studies, plague surveillances should be performed in areas around Manchuria and Zhalainuoer.

DOI PMID

[5]
Gage K, Kosoy M, 2005. Natural history of plague: Perspectives from more than a century of research.Annual Review of Entomology, 50(1): 505-528.For more than a century, scientists have investigated the natural history of plague, a highly fatal disease caused by infection with the gram-negative bacterium Yersinia pestis. Among their most important discoveries were the zoonotic nature of the disease and that plague exists in natural cycles involving transmission between rodent hosts and flea vectors. Other significant findings include those on the evolution of Y. pestis; geographic variation among plague strains: the dynamics and maintenance of transmission cycles; mechanisms by which fleas transmit Y. pestis; resistance and susceptibility among plague hosts; the structure and typology of natural foci: and how landscape features influence the focality, maintenance. and spread of the disease. The knowledge gained from these studies is essential for the development of effective prevention and control strategies.

DOI PMID

[6]
Gang S, Liu Z, Zhang Yet al., 2006. A study on the landscape characteristics of plague infectious areas in Jilin Province.Chinese Journal of Control of Endemic Diseases, 21(5): 257-259. (in Chinese)Objective To study the comprehensive influence of all kinds of landscape major factors on plague natural infectious diseases and evaluate it.Methods Combine GIS,GPS and RS techniques with 1:50 000 topographic maps,numerical apparatus etc to research the landscape of infectious areas.Results Because of the humans economic actions such as cultivating farmlands,planting trees and afforestation,building water conservancy etc,obvious changes have happened in the space structures of plague natural infectious areas of JiLin province.Conclusions Geographical major factors such as landform,soil and vegetation etc effect on the amount and the distribution of plague main host animals.

[7]
Gang S, Liu Z, Zhou Fet al., 2007. Study on present conditions of Jilin province plague nature focus.Chinese Journal of Control of Endemic Diseases, 22(3): 161-166. (in Chinese)Objective To master space structures of focus,suitable environments for existence and areas and variety quantities and distributive of Spemophilus dauricus.To understand changeful variety tendency of rodents and fleas.To programme and determine major region to regulate proper surveillance indexes.To set up JiLin province plague information data and picture storehouses to provide scientific basis for control and surveillance.Methods Carrying out situation investigations of focus using GIS and GPS and with the object of stored hosts of plague.Results Focus areas are 5 644 000 hm2 in JinLin province and in it higher density distributive area of Spemophilus dauricus occupy 6.96%,distributive areas of middle density occupy 19.57%.Lower density areas occupy 30.12%,the lowest density areas occupy 18.77%,no mice occupy 24.57%.Gathering areas of Spemophilus dauricus are 793 286 hm2 in JiLin province and gathering limits are 612 449 to 1 003 149 hm2 and they occupy 14.06% of focus areas.Catulating quantities of Spemophilus dauricus are 1 139 930 singles and changeful limits are 793 072 to 1 488 518 singles.Varieties of rodents have reduced by two families,three genus and nine species.Varieties of have reduced by two families,twelve genus and twenty-eight species.Conclutions Because suitable environments for existence of Spemophilus dauricus have changed,it has led to reduce of gathering areas of Spemophilus dauricus and quantities of Spemophilus dauricus have evidently reduced by.Major surveillance regions exist in windy and sandy grasslands of TongYu~ShuangLiao,BeiDagang grasslands of ZhenLai county,HuangTutai regions of QianAn,local regions of FuYu county and high and middle density distributive areas of other landscope divisions.The most suitable indexes are 300~400 thousand every year.

[8]
Garnham P C, 1949. Distribution of wild-rodent plague.Bulletin of the World Health Organization, 2(2): 271.The author begins by admitting that the name wild-rodent plague is not comprehensive because shrews, opossums, and even carn铆vora, may be affected, but he regards syl vatic or selvatic plague as a misnomer because the disease is not one of forests. Yet he uses the name sylvatic plague freely in the article and is justified in doing so because the Latin word silvaticus, when used of animals, mea...

PMID

[9]
Griffith D A, Haining R, Arbia G, 1994. Heterogeneity of attribute sampling error in spatial data sets.Geographical Analysis, 26: 301-320.This paper considers the standard error of the estimate of the mean of a spatially correlated variable in the case where data are obtained by a process of random sampling. Two distinct mean estimation problems are identified: estimating the area mean and estimating the population mean. Methods are described for obtaining standard error estimates in the two cases and, within the limits of publicly available information, the methods are implemented on average household income data at the census tract scale for Syracuse, New York. The purpose of the paper is to draw attention to issues of data precision in relation to sampled geographic information on averages and in particular to consider the problems of estimating standard errors using such data. The paper also examines the extent to which standard errors vary between census tracts.

DOI

[10]
Haining R, 1988. Estimating spatial means with an application to remote sensing data.Communication Statistics: Theory and Methodology, 17: 537-597.The paper examines alternative estimators for the mean of a spatial process where observations are not independent. Properties of the sample mean and its standard error are contrasted with those of maximum likelihood estimators derived for three spatial models. The information loss caused by spatial dependency in the data is examined. The distribution theory for the estimators is reviewed and the paper concludes with an empirical example illustrating the properties of the estimators and the practical benefits of the maximum likelihood procedure.

DOI

[11]
Hengl T, Sierdsema H, Radović Aet al., 2009. Spatial prediction of species’ distributions from occurrence-only records: Combining point pattern analysis, ENFA and regression-kriging.Ecological Modelling, 220(24): 3499-3511.A computational framework to map species’ distributions (realized density) using occurrence-only data and environmental predictors is presented and illustrated using a textbook example and two case studies: distribution of root vole ( Microtes oeconomus ) in the Netherlands, and distribution of white-tailed eagle nests ( Haliaeetus albicilla ) in Croatia. The framework combines strengths of point pattern analysis (kernel smoothing), Ecological Niche Factor Analysis (ENFA) and geostatistics (logistic regression-kriging), as implemented in the spatstat , adehabitat and gstat packages of the R environment for statistical computing. A procedure to generate pseudo-absences is proposed. It uses Habitat Suitability Index (HSI, derived through ENFA) and distance from observations as weight maps to allocate pseudo-absence points. This design ensures that the simulated pseudo-absences fall further away from the occurrence points in both feature and geographical spaces. The simulated pseudo-absences can then be combined with occurrence locations and used to build regression-kriging prediction models. The output of prediction are either probabilitiesy of species’ occurrence or density measures. Addition of the pseudo-absence locations has proven effective — the adjusted R -square increased from 0.71 to 0.80 for root vole (562 records), and from 0.69 to 0.83 for white-tailed eagle (135 records) respectively; pseudo-absences improve spreading of the points in feature space and ensure consistent mapping over the whole area of interest. Results of cross validation (leave-one-out method) for these two species showed that the model explains 98% of the total variability in the density values for the root vole, and 94% of the total variability for the white-tailed eagle. The framework could be further extended to Generalized multivariate Linear Geostatistical Models and spatial prediction of multiple species. A copy of the R script and step-by-step instructions to run such analysis are available via contact author’s website.

DOI

[12]
Hirzel A, Guisan A, 2002. Which is the optimal sampling strategy for habitat suitability modelling.Ecological Modelling, 157(2-3), 331-341.Designing an efficient sampling strategy is of crucial importance for habitat suitability modelling. This paper compares four such strategies, namely, ‘random’, ‘regular’, ‘proportional-stratified’ and ‘equal-stratified’—to investigate (1) how they affect prediction accuracy and (2) how sensitive they are to sample size. In order to compare them, a virtual species approach (Ecol. Model. 145 (2001) 111) in a real landscape, based on reliable data, was chosen. The distribution of the virtual species was sampled 300 times using each of the four strategies in four sample sizes. The sampled data were then fed into a GLM to make two types of prediction: (1) habitat suitability and (2) presence/absence. Comparing the predictions to the known distribution of the virtual species allows model accuracy to be assessed. Habitat suitability predictions were assessed by Pearson's correlation coefficient and presence/absence predictions by Cohen's κ agreement coefficient. The results show the ‘regular’ and ‘equal-stratified’ sampling strategies to be the most accurate and most robust. We propose the following characteristics to improve sample design: (1) increase sample size, (2) prefer systematic to random sampling and (3) include environmental information in the design.

DOI

[13]
Huang J, Wang J, Bo Yet al., 2014 Identification of health risks of hand, foot and mouth disease in China using the geographical detector technique.International Journal of Environmental Research and Public Health, 11(3): 3407-3423.Hand, foot and mouth disease (HFMD) is a common infectious disease, causing thousands of deaths among children in China over the past two decades. Environmental risk factors such as meteorological factors, population factors and economic factors may affect the incidence of HFMD. In the current paper, we used a novel model-geographical detector technique to analyze the effect of these factors on the incidence of HFMD in China. We collected HFMD cases from 2,309 counties during May 2008 in China. The monthly cumulative incidence of HFMD was calculated for children aged 0-9 years. Potential risk factors included meteorological factors, economic factors, and population density factors. Four geographical detectors (risk detector, factor detector, ecological detector, and interaction detector) were used to analyze the effects of some potential risk factors on the incidence of HFMD in China. We found that tertiary industry and children exert more influence than first industry and middle school students on the incidence of HFMD. The interactive effect of any two risk factors increases the hazard for HFMD transmission.

DOI PMID

[14]
Hu Y, Bergquist R, Lynn Het al., 2015. Sandwich mapping of schistosomiasis risk in Anhui Province, China.Geospatial Health, 10(1): 324.ABSTRACT Schistosomiasis mapping using data obtained from parasitological surveys is frequently used in planning and evaluation of disease control strategies. The available geostatistical approaches are, however, subject to the assumption of stationarity, a stochastic process whose joint probability distribution does not change when shifted in time. As this is impractical for large areas, we introduce here the sandwich method, the basic idea of which is to divide the study area (with its attributes) into homogeneous subareas and estimate the values for the reporting units using spatial stratified sampling. The sandwich method was applied to map the county-level prevalence of schistosomiasis japonica in Anhui Province, China based on parasitological data collected from sample villages and land use data. We first mapped the county-level prevalence using the sandwich method, then compared our findings with block Kriging. The sandwich estimates ranged from 0.17 to 0.21% with a lower level of uncertainty, while the Kriging estimates varied from 0 to 0.97% with a higher level of uncertainty, indicating that the former is more smoothed and stable compared to latter. Aside from various forms of reporting units, the sandwich method has the particular merit of simple model assumption coupled with full utilization of sample data. It performs well when a disease presents stratified heterogeneity over space.

DOI PMID

[15]
Li B, Zhang M, Wang Yet al.2012. Surveys on the population densities of rodent communities in some hilly areas of Changning of Hunan and Xinyu of Jiangxi in China in 2010-2011.Plant Protection, 38(1): 155-157. (in Chinese)To explore the population densities of rodent communities in hilly areas of South China,snap traps were used in farmlands of Changning of Hunan and Xinyu of Jiangxi in 2010.The results showed that the total density from January to April in 2010 was doubled compared to that in Changning in 2009,and trap success reached 12.90% in May 2010.In Changning,Rattus losea and Apodemus agrarius were dominant species,accounting for 61.29% and 29.03%,respectively,and reproductive indices were 2.33 and 2.25,respectively.In Xinyu,trap success was 11.97%,and A.agrarius was dominant species.It was suggested that some control measures should be conducted,and more attention should be paid to the rodent species with big body masses,such as R.norvegicus and R.losea,because they had high population densities in the moment.

[16]
Li L, Wang J, 2004. Integrated spatial sampling modeling of geospatial data.Science China Earth Sciences, 47(3): 201-208.Spatial sampling is a necessary and important method for extracting geospatial data and its methodology directly affects the geo-analysis results. Counter to the deficiency of separate models of spatial sampling, this article analyzes three crucial elements of spatial sampling (frame, correlation and decision diagram) and induces its general integrated model. The program of Spatial Sampling Integration (SSI) has been developed with Component Object Model (COM) to realize the general integrated model. In two practical applications, i.e. design of the monitoring network of natural disasters and sampling survey of the areas of non-cultivated land, SSI has produced accurate results at less cost, better realizing the cost-effective goal of sampling toward the geo-objects with spatial correlation. The two cases exemplify expanded application and convenient implementation of the general integrated model with inset components in an integrated environment, which can also be extended to other modeling of spatial analysis.

DOI

[17]
Li L, Wang J, Cao Zet al., 2008. An information fusion method to regionalize spatial heterogeneity for improving the accuracy of spatial sampling estimation.Stochastic Environmental Research and Risk Assessment, 22: 689-704.While spatial autocorrelation is used in spatial sampling survey to improve the precision of the feature鈥檚 estimate of a certain population at area units, spatial heterogeneity as the stratification frame in survey also often have a considerable effect upon the precision. Under the context of increasingly enriched spatiotemporal data, this paper suggests an information-fusion method to identify pattern of spatial heterogeneity, which can be used as an informative stratification for improving the estimation accuracy. Data mining is major analysis components in our method: multivariate statistics, association analysis, decision tree and rough set are used in data filter, identification of contributing factors, and examination of relationship; classification and clustering are used to identify pattern of spatial heterogeneity using the auxiliary variables relevant to the goal and thus to stratify the samples. These methods are illustrated and examined in the case study of the cultivable land survey in Shandong Province in China. Different from many stratification schemes which just uses the goal variable to stratify which is too simplified, information from multiple sources can be fused to identify pattern of spatial heterogeneity, thus stratifying samples at geographical units as an informative polygon map, and thereby to increase the precision of estimates in sampling survey, as demonstrated in our case research.

DOI

[18]
Liu W, Wang X, Zhong W, 2007. Population dynamics of the Mongolian gerbils: Seasonal patterns and interactions among density, reproduction and climate.Journal of Arid Environments, (68): 383-397.The Mongolian gerbil (Meriones unguiculatus) is one of key rodents widely distributed in semi-arid, typical steppes, and desert grasslands in Inner Mongolia, China. We studied population dynamics of Mongolian gerbils under semi-natural conditions using monthly live trapping from 2001 to 2004 in south-central Inner Mongolia. Mongolian gerbils displayed seasonal fluctuations of density and population growth rate. Reproduction and recruitment of gerbils occurred primarily from March鈥揂ugust with a breeding lull in autumn. Population growth rates of Mongolian gerbils were not related to population density but were negatively related to temperature and precipitation. Enhanced reproductive performance and success of females increased population growth of gerbils in our enclosure. We also found that increased temperature and precipitation during the plant growing season negatively affected recruitment and rate of pregnancy. Mongolian gerbils prefer habitats with short, sparse vegetation and dry, loose and sandy soil. Increases in temperature and rainfall enhance vegetation growth; consequently, tall, dense and moist vegetation might reduce the suitability of habitats and retard population growth of Mongolian gerbils. Pronounced seasonal climatic fluctuations in northern latitudes may be the main cause of seasonal population dynamics of Mongolian gerbils.

DOI

[19]
Liu Z, Zhang Y, Zhang Fet al., 2007. Study on distribution scope and accumulation areas of Spemophilus dauricus on various administrative division in the west of Jilin Province. Chinese Journal of Control of Endemic Diseases, 22(1): 11-13. (in Chinese)Objective TO understand distribution scope and accumulation area of Spemophilus dauricus on various administrative division in the west of Jilin Province.Methods By GIS and GPS researching the area of various administrative division and the distribution scope and quantity of Spemophilus dauricus. Results The dispersal area of Spemophilus dauricus occupies the epidemic focus area 75.42%; The accumulation area of Spemophilus dauricus occupies the epidemic focus area 12.63% in the west of Jilin Province.Conclusions Because Spemophilus dauricus have been captured and killed massively ,As well as its suitable survival environment have been changed,thus the accumulation areas and quantity of Spemophilus dauricus have reduced obviously.

[20]
Lotfy W, 2015. Plague in Egypt: Disease biology, history and contemporary analysis: A minireview.Journal of Advanced Research, 6(4): 549-554.Graphical abstract Plague is a zoonotic disease with a high mortality rate in humans. Unfortunately, it is still endemic in some parts of the world. Also, natural foci of the disease are still found in some countries. Thus, there may be a risk of global plague re-emergence. This work reviews plague biology, history of major outbreaks, and threats of disease re-emergence in Egypt. Based on the suspected presence of potential natural foci in the country, the global climate change, and the threat posed by some neighbouring countries disease re-emergence in Egypt should not be excluded. The country is in need for implementation of some preventive measures.

DOI PMID

[21]
Luo M, Zhong W, 1990. Some data of Citellus dauricus population ecology. J. Anim. Sci., (2): 50-54. (in Chinese)

[22]
Perry R D, Fetherston J D, 1997. Yersinia pestis-etiologic agent of plague.Clin. Microbiol. Rev., 10(1): 35-66.Abstract Plague is a widespread zoonotic disease that is caused by Yersinia pestis and has had devastating effects on the human population throughout history. Disappearance of the disease is unlikely due to the wide range of mammalian hosts and their attendant fleas. The flea/rodent life cycle of Y. pestis, a gram-negative obligate pathogen, exposes it to very different environmental conditions and has resulted in some novel traits facilitating transmission and infection. Studies characterizing virulence determinants of Y. pestis have identified novel mechanisms for overcoming host defenses. Regulatory systems controlling the expression of some of these virulence factors have proven quite complex. These areas of research have provide new insights into the host-parasite relationship. This review will update our present understanding of the history, etiology, epidemiology, clinical aspects, and public health issues of plague.

DOI PMID

[23]
Peset J,2015. Plagues and Diseases in History. International Encyclopedia of the Social & Behavioral Sciences. 2nd ed. 2015: 174-179.

[24]
Salim S, Daoud J I, 2003. Regression Analysis with Dummy Variables. Understanding Regression Analysis. New York: Springer US.

[25]
Stenseth N, Atshabar B, Begon Met al., 2008. Plague: Past, Present, and Future.PLoS Medicine, 5(1): e3.The authors argue that plague should be taken much more seriously by the international health community.

DOI PMID

[26]
Thuiller W, 2003. BIOMOD: Optimizing predictions of species distributions and projecting potential future shifts under global change.Global Change Biology, 9(10): 1353-1362.

DOI

[27]
Wand M P, Jones M C, 1994. Kernel smoothing.Biometrics, 54.

[28]
Wang G, Zhong W, Zhou Qet al., 2003. Soil water condition and small mammal spatial distribution in Inner Mongolian steppes, China.Journal of Arid Environments, (54): 729-737.We studied the roles of soil moisture contents and vegetation structure in the spatial distribution of small mammals in the typical steppes of Inner Mongolia, China, using logistic and linear regressions of a data set collected in a 6-year study. Our results indicated that soil moisture contents remained in the most parsimonious models for Spermophilus dauricus , Cricetulus barabensis , Microtus maximowiczii , M. gregalis , and Ochotona daurica . The relative abundance of C. barabensis , M. maximowiczii , and O. daurica was inversely related to soil moisture contents, while that of M. gregalis and S. dauricus was positively related to soil moisture contents in logistic regressions. Linear regression analyses showed that soil moisture contents and the number of small mammal species were inversely related. The negative effects of wet soil were consistent at both small mammal population and community levels in the semi-arid steppes. Above-ground plant biomass and plant coverage also affected the spatial distribution of small mammals in the typical steppe of Inner Mongolia.

DOI

[29]
Wang J, Jiang C, Hu Met al., 2013. Design-based spatial sampling: Theory and implementation.Environmental Modelling & Software, 40(40): 280-288.Various sampling techniques are widely used in environmental, social and resource surveys. Spatial sampling techniques are more efficient than conventional sampling when surveying spatially distributed targets such as CO 2 emissions, soil pollution, a population distribution, disaster distribution, and disease incidence, where spatial autocorrelation and heterogeneity are prevalent. However, despite decades of development in theory and practice, there are few computer programs for spatial sampling. We investigated the three-fold relationship between targets, sampling strategies and statistical methods in spatial contexture. Accordingly, the information flow of the spatial sampling process was reconstructed and optimized. SSSampling, a computer program for design-based spatial sampling, has been developed from the theoretical basis. Three typical applications of the software, namely sampling design, optimal statistical inference and precision assessment, are demonstrated as case studies.

DOI

[30]
Wang J, Haining R, Cao Z, 2010. Sample surveying to estimate the mean of a heterogeneous surface: reducing the error variance through zoning.International Journal of Geographical Information Science, 24(4): 523-543.中国科学院机构知识库(中国科学院机构知识库网格(CAS IR GRID))以发展机构知识能力和知识管理能力为目标,快速实现对本机构知识资产的收集、长期保存、合理传播利用,积极建设对知识内容进行捕获、转化、传播、利用和审计的能力,逐步建设包括知识内容分析、关系分析和能力审计在内的知识服务能力,开展综合知识管理。

DOI

[31]
Wang J, Haining R, Liu Tet al., 2013. Sandwich estimation for multi-unit reporting on a stratified heterogeneous surface.Environment and Planning A, 45(10): 2515-2534.Spatial sampling is widely used in environmental and social research. In this paper we consider the situation where instead of a single global estimate of the mean of an attribute for an area, estimates are required for each of many geographically defined reporting units (such as counties or grid cells) because their means cannot be assumed to be the same as the global figure. Not only may survey costs greatly increase if sample size has to be a function of the number of reporting units, estimator sampling error tends to be large if the population attribute of each reporting unit can be estimated by using only those samples actually lying inside the unit itself. This study proposes a computationally simple approach to multi-unit reporting by using analysis of variance and incorporating 'twice-stratified' statistics. We assume that, although the area is heterogeneous (the mean varies across the area), it can be zoned (or stratified) into homogeneous subareas (the mean is constant within each subarea) and, in addition, that it is possible to acquire prior knowledge about this partition. This zoning of the study area is independent of the reporting units. The zone estimates are transferred to the reporting units. We call the methodology sandwich estimation and we report two contrasting empirical studies to demonstrate the application of the methodology and to compare its performance against some other existing methods for tackling this problem. Our study shows that sandwich estimation performs well against two other frequently used, probabilistic, model-based approaches to multi-unit reporting on stratified heterogeneous surfaces whilst having the advantage of computational simplicity. We suggest those situations where sandwich estimation might be expected to do well.

DOI

[32]
Wang J, Liu J, Zhuan Det al., 2002. Spatial sampling design for monitoring cultivated land.International Journal of Remote Sensing, 23: 263-284.Updated information on cultivated land is important for Chinese central and local governments. The data can be acquired using aerial photographs and Thematic Mapper (TM) images. But an exhaustive annual survey covering all of China''s territory by these remote sensing images is too expensive, therefore a sampling technique has to be employed. Spatial sampling takes the spatial distribution characteristics of the object to be monitored into account. We propose both direct and indirect spatial sampling models for monitoring spatially discrete distributed objects. For the indirect method, each sampling domain is equal to a specified region but is not directly linked with the reporting unit, consequently, the report unit estimates may have few or perhaps even no samples within the report units. Therefore the indirect sampling model can provide sampling estimates for a large number of report units with a limited number of sample units and a limited sampling budget. The zoning of the monitored object is based on prior knowledge about the controlling factors and the spatial homogeneity of the variable. The method is used to develop a sampling solution for monitoring cultivated land dynamics. The models were tested in Shandon province and Zhaozhuang county.

DOI

[33]
Wang J, Li X, Christakos Get al., 2010. Geographical detectors-based health risk assessment and its application in the neural tube defects study of the Heshun Region, China.International Journal of Geographical Information Science, 24(1): 107-127.Physical environment, man‐made pollution, nutrition and their mutual interactions can be major causes of human diseases. These disease determinants have distinct spatial distributions across geographical units, so that their adequate study involves the investigation of the associated geographical strata. We propose four geographical detectors based on spatial variation analysis of the geographical strata to assess the environmental risks of health: the risk detector indicates where the risk areas are; the factor detector identifies factors that are responsible for the risk; the ecological detector discloses relative importance between the factors; and the interaction detector reveals whether the risk factors interact or lead to disease independently. In a real‐world study, the primary physical environment (watershed, lithozone and soil) was found to strongly control the neural tube defects (NTD) occurrences in the Heshun region (China). Basic nutrition (food) was found to be more important than man‐made pollution (chemical fertilizer) in the control of the spatial NTD pattern. Ancient materials released from geological faults and subsequently spread along slopes dramatically increase the NTD risk. These findings constitute valuable input to disease intervention strategies in the region of interest.

DOI

[34]
Wang J, Stein A, Gao Bet al., 2012. A review of spatial sampling.Spatial Statistics, 2: 1-14.The main aim of spatial sampling is to collect samples in 1-, 2- or 3-dimensional space. It is typically used to estimate the total or mean for a parameter in an area, to optimize parameter estimations for unsampled locations, or to predict the location of a movable object. Some objectives are for populations, representing the 鈥渉ere and now鈥, whereas other objectives concern superpopulations that generate the populations. Data to be collected are usually spatially autocorrelated and heterogeneous, whereas sampling is usually not repeatable. In various senses it is distinct from the assumption of independent and identically distributed (i.i.d.) data from a population in conventional sampling. The uncertainty for spatial sample estimation propagates along a chain from spatial variation in the stochastic field to sample distribution and statistical tools used to obtain an estimate. This uncertainty is measured using either a design-based or model-based method. Both methods can be used in population and superpopulation studies. An unbiased estimate with the lowest variance is thus a common goal in spatial sampling and inference. Reaching this objective can be addressed by sample allocation in an area to obtain a restricted objective function.

DOI

[35]
Wang J, Wise S, Haining R, 1997. An integrated regionalization of earthquake, flood and drought hazards in China.Transactions in GIS, (2): 25-44.Abstract Earthquake, flood, and drought data from different sources are combined in a single data set using the same data structure, projection, and scale. The intensity and frequency of each hazard is classified into severe, heavy, modest, and light, producing a classification with 64 combined states for the three kinds of hazard. These classes are then ranked according to severity. The three hazard coverages arc overlaid and the polygons that are produced are coded by the classification system. A map is produced that shows the distribution of these 64 classes in regions and their areas measured from the spatial topological data file in the GIS. Spatial analysis reveals the spatial association among the three hazards and between the three hazards and human factors. There is a brief discussion of the implications of the regionalized map for hazard monitoring.

DOI

[36]
Wang J, Zhang T, Fu B, 2016. A measure of spatial stratified heterogeneity.Ecological Indicators, 67: 250-256.Spatial stratified heterogeneity, referring to the within-strata variance less than the between strata-variance, is ubiquitous in ecological phenomena, such as ecological zones and many ecological variables. Spatial stratified heterogeneity reflects the essence of nature, implies potential distinct mechanisms by strata, suggests possible determinants of the observed process, allows the representativeness of observations of the earth, and enforces the applicability of statistical inferences. In this paper, we propose a q -statistic method to measure the degree of spatial stratified heterogeneity and to test its significance. The q value is within [0,1] (0 if a spatial stratification of heterogeneity is not significant, and 1 if there is a perfect spatial stratification of heterogeneity). The exact probability density function is derived. The q -statistic is illustrated by two examples, wherein we assess the spatial stratified heterogeneities of a hand map and the distribution of the annual NDVI in China.

DOI

[37]
Wang W, Jiang H, Zhao Yet al., 2013. Analysis on the rat density monitoring results, Qingdao City, 2006-2012.Preventive Medicine Tribune, 19(10): 758-759. (in Chinese)Objective To understand rat distribution,density and seasonal dynamics,so as to provide scientific basis for the control. Methods Rat density surveillance was conducted by night trapping method,with each surveillance site covering a residential area,a special industry and a natural rural village during 2006-2012. Results Over 47 316mousetraps were arranged and 179rats were captured in Qingdao city during 2006-2012.The average rat density was 0.39%.The average rat densities were 0.57%,0.40%,0.23%,0.21%,0.42%,0.33%and 0.59% during 2006-2012.Mus musculus,rattus norvegicus and apodemus agrarius were dominant in Qingdao city,and their component ratio was 51.96%,45.81%,and 2.23%.The peak of mean rat density was 0.49%in October.The density in villages was 0.63%,which was the highest in different condition. Conclusion The rat density has high-low-high trend during 2006-2012.

[38]
Wang W, Li R, 1997. The main fields of study on environment health and development in 21th century in China.Progress in Geography, 16(1): 11-14. (in Chinese)The main fields of the study on environment human health and development in 21th Century in China are briefly discussed in the paper. The main fields include: (1) To control the endemic diseases caused by chemical factors in the environment, the protective methods which is applicable to local environmental conditions must be adopted;(2) The risks to human health from contaminants in water, air, food or commercial products have arised more attention, the study of human populations exposed to potential environmental hazards should be developed; (3) Some citizens are more at risk from urbanization due to the change of lifestyle factors, therefore, the way to protect human health in the process of economic development and urbanization should be explored.

DOI

[39]
Wu J, Liu S, Ma L, 2016. Comparison analysis of sampling methods to estimate regional precipitation based on the kriging interpolation methods: A case of northwestern China.Sciences in Cold and Arid Regions, 8(6): 485-494.The accuracy of spatial interpolation of precipitation data is determined by the actual spatial variability of the precipitation, the interpolation method, and the distribution of observatories whose selections are particularly important. In this paper, three spatial sampling programs, including spatial random sampling, spatial stratified sampling, and spatial sandwich sampling, are used to analyze the data from meteorological stations of northwestern China. We compared the accuracy of ordinary Kriging interpolation methods on the basis of the sampling results. The error values of the regional annual precipitation interpolation based on spatial sandwich sampling, including ME(0.1513), RMSE(95.91), ASE(101.84), MSE(-0.0036), and RMSSE(1.0397), were optimal under the premise of abundant prior knowledge. The result of spatial stratified sampling was poor, and spatial random sampling was even worse. Spatial sandwich sampling was the best sampling method, which minimized the error of regional precipitation estimation. It had a higher degree of accuracy compared with the other two methods and a wider scope of application.

DOI

[40]
Yang L, Chen R, Wang Wet al., 2000. The temporal and spatial distribution of the plague foci since 1840 in China.Geographical Research, 19(3): 243-248. (in Chinese)The spatial distribution of plague foci and plague affected areas in China are studied by GIS spatial analysis methods. The results show that there are two uncontinuous plague foci belts in South and North China. The total plague foci cover an area of about 126 km 2, but the plague affected areas are doubled. Due to the impact of natural environment and human socio economic activities, the ratio of the plague foci covered area to the plague affected areas is significantly higher in South China than in North China. Then using the historical data of plague and 10 year interval data, the 150 years spread history of the plague epidemics in China is rebuilt.

DOI

[41]
Zhang C, Lv J, Pu Q, 2004. The present situation and control countermeasure of Spermophilus Dauricus plague natural foci. Chinese Journal of Control of Endemic Disease, 19(6): 345-348. (in Chinese)

[42]
Zhang G, Zhang G, Zhang Fet al., 2006. A study on the space structure of plague natural infectious areas of Jilin Province.Chinese Journal of Control of Endemic Disease, 21(4): 193-196. (in Chinese)Objective To study the distribution and classification of landscape region,and the living environment of the main host animals of plague natural infectious areas in JiLin province,replan the surveillance important areas and related indexes of animal plague,forecast the dangerous extent of plague appearance,and found informative data bank of plague.Methods By GIS and DPS to research the existing state of plague infectious areas of JiLin province.Results Obvious changes have happened in the space structure of plague natural infectious areas of JiLin province because of the influence of economical actions such as cultivating farmlands,planting trees and afforestation,building water conservancy etc.Conclusions Because of the changes in the space structure of infectious areas,the amount and the distribution of main host animals are influenced directly.

[43]
Zhang J, Zhang L, Gong B, 2013. Application of spatial sampling to remote sensing monitoring of forest cover area. Advanced Materials Research, 610-613: 3732-3737.This study combines the sampling technique, geographic information system and remote sensing technique to conduct a sampling survey on forest cover area of Jinggangshan National Nature Reserve in China on the basis of TM remote sensing image. The spatial simple random sampling, spatial stratified sampling and sandwich sampling model are respectively utilized to establish the sampling design. For the spatial simple random sampling model, the spatial autocorrelation analysis method is adopted to determine the spatial autocorrelation coefficient through calculating Moran's I index, while in the spatial stratified sampling and sandwich sampling model, the yearly maximum NDVI (Normalized Difference Vegetation Index) is utilized to conduct the spatial stratification. Through comparison of the sampling accuracy of three sampling models, a higher precision and more reasonable sampling method and sampling model is provided for remote sensing monitoring of forest cover area. The study results show that: sandwich sampling model is featured as the highest sampling accuracy, followed by the spatial stratified sampling and simple random sampling. Under the requirement of same precision, sandwich spatial sampling model can reduce quantity of the sampling points, and create all kinds of report units according to demands of different spatial area, so it is featured as the better suitability.

DOI

[44]
Zhao A, 2012. Analysis on monitoring result of rat density in Taian in 2010.Chinese Journal of Hygienic Insecticides & Equipment, 18(1): 28-29. (in Chinese)

[45]
Zhou F, Liu Z, Zhang Get al., 2007. Study on Spemophilus Dauricus gathering areas of plague natural focus in Jilin Province. Modern Preventive Medicine, 34(19): 3648-3652. (in Chinese)

[46]
Zhou D, Yang R, 2010. Progress and prospect of research work on plague.Medical Journal of Chinese Peoples Liberation Army, 35(10): 1176-1182. (in Chinese)Plague is an exceedingly virulent infectious zoonosis that constitutes a great threat to public health.The natural foci of plague distribute worldwide.The epidemic situation of plague has been aggravated in recent 20 years both as an interpersonal and epizootic disease,and the World Health Organization has listed plague as a reemerging violent infectious disease.As the pathogen of plague,Yersinia pestis is not only a traditional biological warfare agent,but also a potential biological terrorism agent.The present paper reviewed the progress and prospect on four recognized key points in the research work of plague,namely genetic polymorphisms and microevolution,pathogenesis and trasmission,vaccine,and long-term persistence in nature.

Outlines

/