
Journal of Geographical Sciences >
Spatio-temporal differences in cloud cover of Landsat-8 OLI observations across China during 2013-2016
Author: Xiao Chiwei (1991-), PhD Candidate, specialized in resource utilization and remote sensing of land resource. E-mail: xiaocw@igsnrr.ac.cn
*Corresponding author: Li Peng (1984-), PhD and Associate Professor, E-mail: lip@igsnrr.ac.cn. ORCID ID (https://orcid.org/0000-0002-0849-5955)
Received date: 2017-06-15
Accepted date: 2017-11-16
Online published: 2013-02-11
Supported by
National Natural Science Foundation of China, No.41430861
National Key Research and Development Program of China, No.2016YFC0503500
Opening Fund of Key Laboratory of Poyang Lake Wetland and Watershed Research, Ministry of Education, Jiangxi Normal University, No.PK2016004
Copyright
Currently, the historical archive images of Landsat family sensors are probably the most effective data products for tracking global longitudinal changes since the 1970s. However, the issue of the degree and extent of cloud coverage is always a challenge and varies distinctively worldwide. So far, acquisition probability (AP) analyses of cloud cover (CC) of Landsat observations have been conducted with different sensors at regional scale. To our knowledge, CC probability analysis for the newly-launched Landsat-8 Operational Land Imager (OLI) across China is not reported. In this paper, monthly, seasonal, and annual APs for Landsat OLI (44,228 in total) images over China acquired from April 2013 to October 2016 with various CC thresholds were analyzed. The results showed that: first, the cumulative average APs of all OLI data over China at the CC thresholds ≤30% was about 49.6% which illustrated the availability of OLI imagery across China. Second, the spatial patterns of 10%, 20%, and 30% CC thresholds of OLI observations, coincided well with the precipitation distributions separated by the respective 200 mm, 400 mm, and 800 mm isohyetal lines. Third, the APs of images with the 30% CC threshold are the highest in autumn and winter especially in October of 58.7%, while the corresponding lowest probability occurred in June of 41.0%. Finally, the spatial differences in APs of targeted images with ≤30% CC thresholds were quite significant. At regional scales, the arid and semi-arid areas, Inland River and Songliao River basins, and northwestern side of the Hu Huanyong population line had the larger probabilities of obtaining high-quality images. Our study suggested that OLI imagery satisfy the data requirements needed for land surface monitoring, although there existed obvious spatio-temporal differences in APs over China at the 30% CC threshold.
XIAO Chiwei , Li Peng , FENG Zhiming , WU Xingyuan . Spatio-temporal differences in cloud cover of Landsat-8 OLI observations across China during 2013-2016[J]. Journal of Geographical Sciences, 2013 , 28(4) : 429 -444 . DOI: 10.1007/s11442-018-1482-0
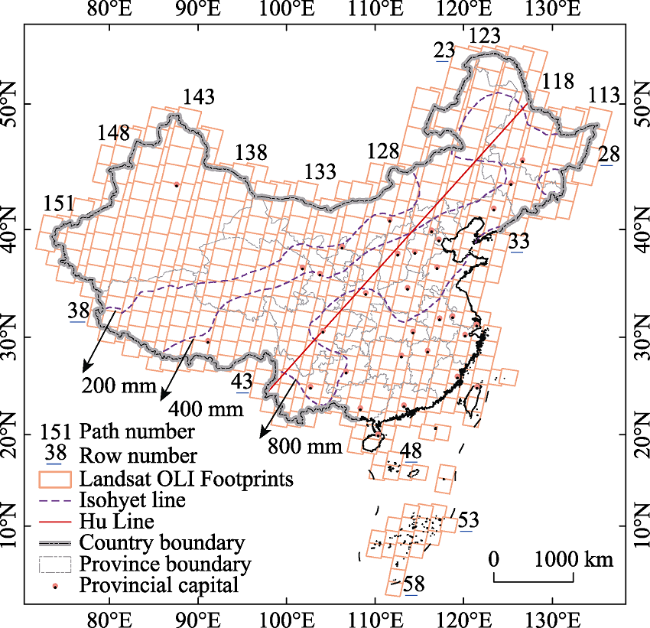
Figure 1 Map showing the location of the dry and wet areas, and the two sides divided by the Hu Line in China, and the 576 Landsat OLI footprints (path/row) over China |
Table 1 Annual Landsat OLI scenes acquisition statistics in China including cloud cover (CC) levels (0-9) in each footprint (path/row) |
| Year | Number of scenes | Proportion (%) | Number of CC level | |||||||||
|---|---|---|---|---|---|---|---|---|---|---|---|---|
| 0 | 1 | 2 | 3 | 4 | 5 | 6 | 7 | 8 | 9 | |||
| 2013 | 8121 | 18.4 | 2546 | 948 | 705 | 634 | 602 | 631 | 608 | 654 | 571 | 222 |
| 2014 | 12671 | 28.6 | 3712 | 1561 | 1185 | 957 | 868 | 884 | 915 | 988 | 1023 | 578 |
| 2015 | 13086 | 29.6 | 3655 | 1570 | 1168 | 962 | 951 | 906 | 1016 | 1153 | 1152 | 553 |
| 2016 | 10350 | 23.4 | 2712 | 1228 | 945 | 808 | 816 | 774 | 843 | 952 | 878 | 394 |
 (1)
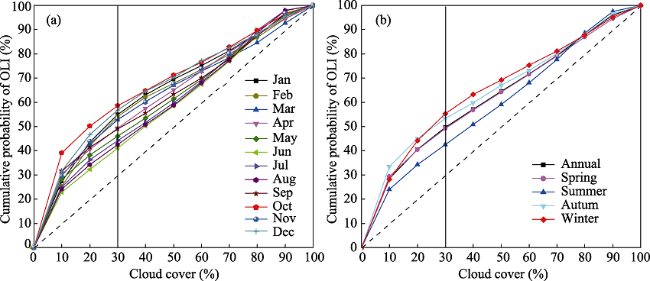
(1)Figure 2 The cumulative average acquisition probabilities (APs) of increasing CC thresholds range from 0-100% for all OLI footprints in China: monthly (a) and annual and seasonal (b) |
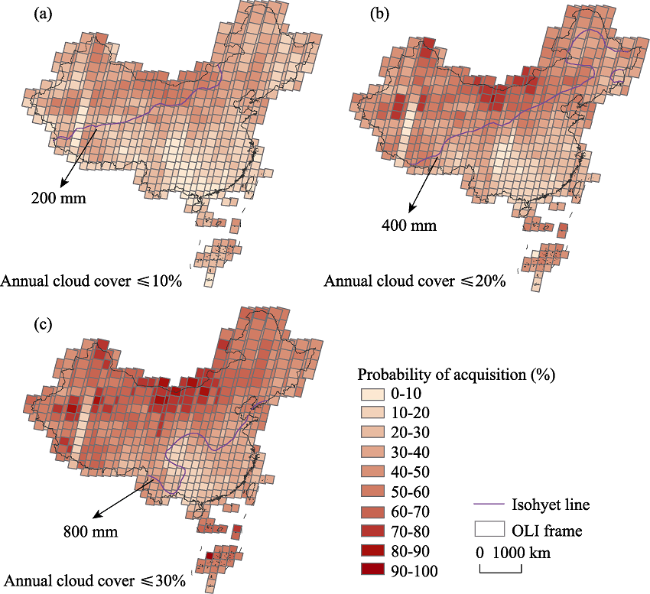
Figure 3 Annual AP with ≤ 30% CC for Landsat OLI sensor images (44,228 scenes) between 2013 and 2016 in China. (a), (b) and (c) represent the annual CC thresholds of 10%, 20%, and 30%, respectively. |
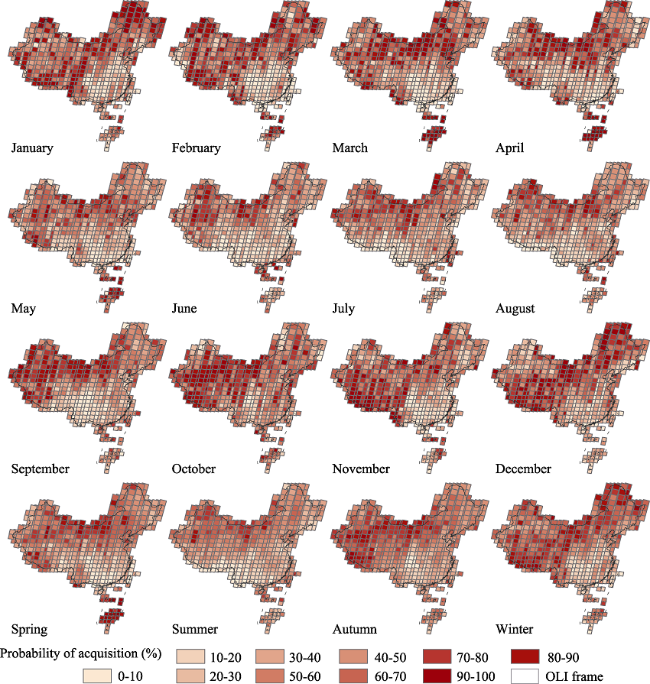
Figure 4 Monthly and seasonal AP for historical Landsat OLI scenes (42,229 scenes) with ≤ 30% CC in China for 2013-2016 |
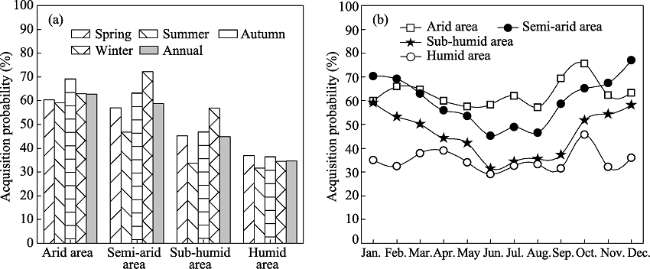
Figure 5 Regional differences in annual and seasonal (a) and monthly (b) average AP at 30% or less CC for all Landsat data. The four arid and humid areas in China are typically separated by the 200 mm, 400 mm, and 800 mm isohyetal lines. |
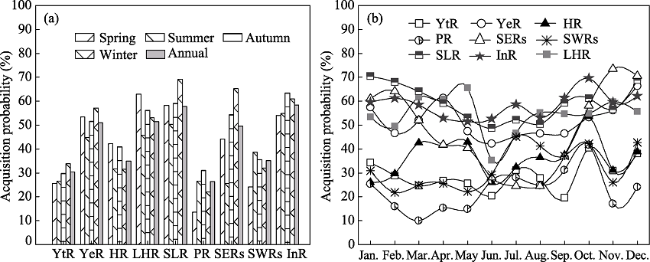
Figure 6 River basin differences in annual and seasonal (a) and monthly (b) average AP at ≤ 30% CC for all Landsat data in China. YtR: Yangtze River; YeR: Yellow River; HR: Huaihe River; LHR: Luanhai River; SLR: Songliao River; PR: Pearl River; SERs: Southeast Rivers; SWRs: Southwest Rivers; InR: Inland River |
Table 2 Differences in monthly average AP at ≤30% CC threshold for OLI data in the nine major river basins of China |
| Major River Basin | AP (%) | |||||||||||
|---|---|---|---|---|---|---|---|---|---|---|---|---|
| Jan | Feb | Mar | Apr | May | Jun | Jul | Aug | Sep | Oct | Nov | Dec | |
| Yangtze River (YtR) | 34.3 | 28.8 | 24.6 | 26.6 | 25.6 | 20.4 | 31.1 | 27.8 | 19.6 | 40.5 | 31.0 | 38.0 |
| Yellow River (YR) | 57.4 | 46.5 | 52.2 | 61.4 | 47.5 | 42.2 | 45.5 | 46.5 | 46.5 | 53.2 | 56.2 | 66.3 |
| Huaihe River (HR) | 26.1 | 29.6 | 42.5 | 41.4 | 42.9 | 25.9 | 32.4 | 36.4 | 37.5 | 53.6 | 31.1 | 38.9 |
| Luanhai River (LHR) | 53.4 | 49.5 | 61.7 | 60.8 | 65.6 | 35.3 | 46.6 | 55.2 | 54.7 | 54.9 | 59.6 | 55.7 |
| Songliao River (SLR) | 70.3 | 67.9 | 64.2 | 59.1 | 53.1 | 48.7 | 52.1 | 50.3 | 59.2 | 61.2 | 56.5 | 68.7 |
| Pearl River (PR) | 25.4 | 16.0 | 10.0 | 15.3 | 14.9 | 26.9 | 28.1 | 24.7 | 31.2 | 41.7 | 17.2 | 24.0 |
| Southeast Rivers (SERs) | 60.9 | 64.1 | 52.0 | 41.8 | 40.3 | 27.9 | 24.4 | 24.4 | 37.0 | 58.1 | 73.5 | 70.5 |
| Southwest Rivers (SWRs) | 31.0 | 21.8 | 25.0 | 25.6 | 22.1 | 29.4 | 45.1 | 41.2 | 37.1 | 42.2 | 26.0 | 42.7 |
| Inland River (InR) | 59.5 | 61.2 | 58.5 | 52.9 | 51.5 | 52.6 | 58.5 | 53.1 | 61.3 | 69.6 | 59.5 | 62.1 |
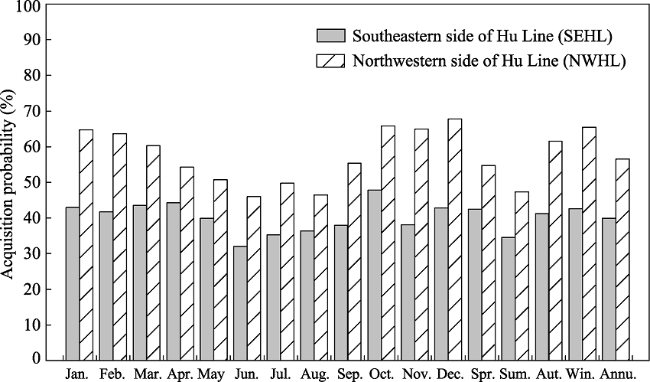
Figure 7 Regional differences in annual, seasonal and monthly average AP at ≤ 30% CC for Landsat OLI data in China on both sides of the Hu Line |
The authors have declared that no competing interests exist.
| [1] |
|
| [2] |
|
| [3] |
Asner,
|
| [4] |
|
| [5] |
|
| [6] |
|
| [7] |
|
| [8] |
|
| [9] |
|
| [10] |
|
| [11] |
|
| [12] |
|
| [13] |
|
| [14] |
|
| [15] |
|
| [16] |
|
| [17] |
|
| [18] |
|
| [19] |
|
| [20] |
|
| [21] |
|
| [22] |
|
| [23] |
|
| [24] |
|
| [25] |
|
| [26] |
|
| [27] |
|
| [28] |
|
| [29] |
|
| [30] |
|
| [31] |
|
| [32] |
|
| [33] |
|
| [34] |
|
| [35] |
|
| [36] |
|
| [37] |
|
| [38] |
|
/
| 〈 |
|
〉 |