Research Articles

Ecosystem assessment and protection effectiveness of a tropical rainforest region in Hainan Island, China

  • ZHAI Jun , 1 ,
  • Hou Peng , 1 ,
  • CAO Wei 2 ,
  • YANG Min 1 ,
  • CAI Mingyong 1 ,
  • LI Jing 1
Expand
  • 1. Satellite Environment Center, Ministry of Environmental Protection of the People’s Republic of China, Beijing 100094, China
  • 2. Institute of Geographic Sciences and Natural Resources Research, CAS, Beijing 100101, China

Author: Zhai Jun (1985-), Associate Professor, specialized in ecological remote sensing. E-mail:

*Corresponding author: Hou Peng (1978-), Professor, specialized in ecological assessment. E-mail:

Received date: 2017-10-13

  Accepted date: 2017-11-30

  Online published: 2018-03-30

Supported by

National Key R&D Program of China, No.2017YFC0506506, No.2016YFC0500206

National Natural Science Foundation of China, No.41501484

Copyright

Journal of Geographical Sciences, All Rights Reserved

Abstract

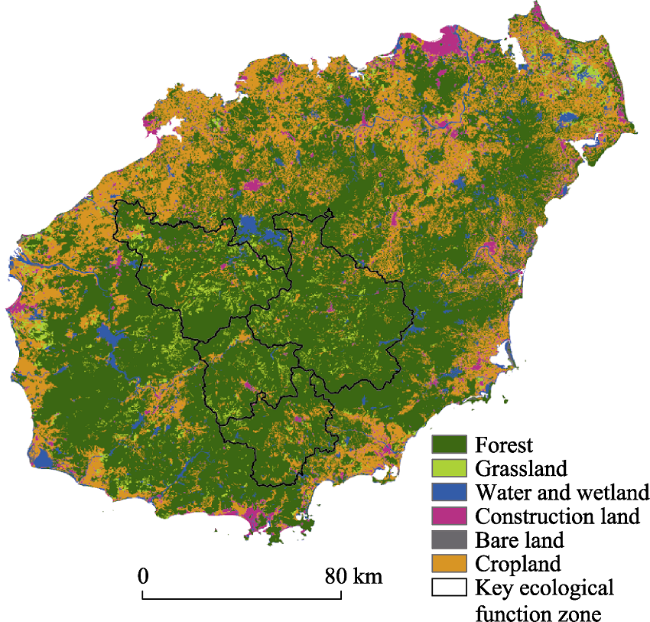
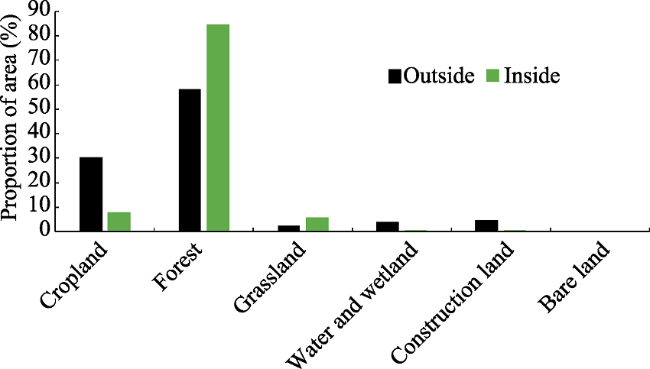
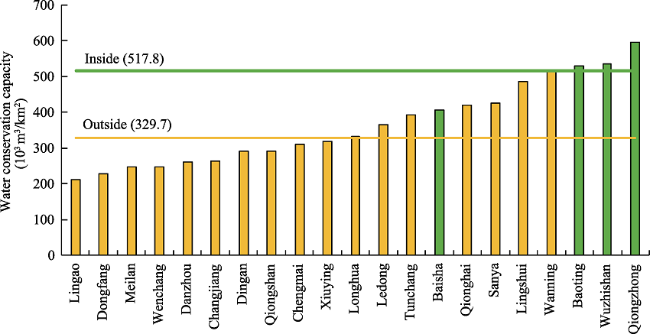
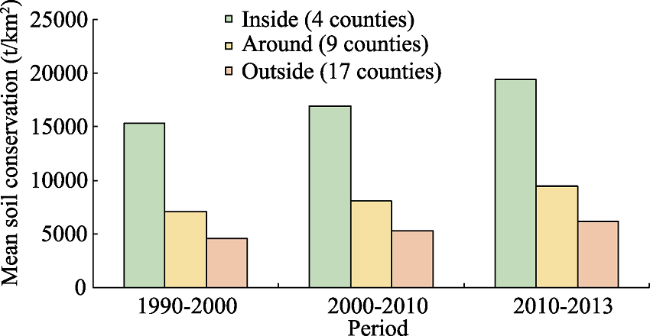
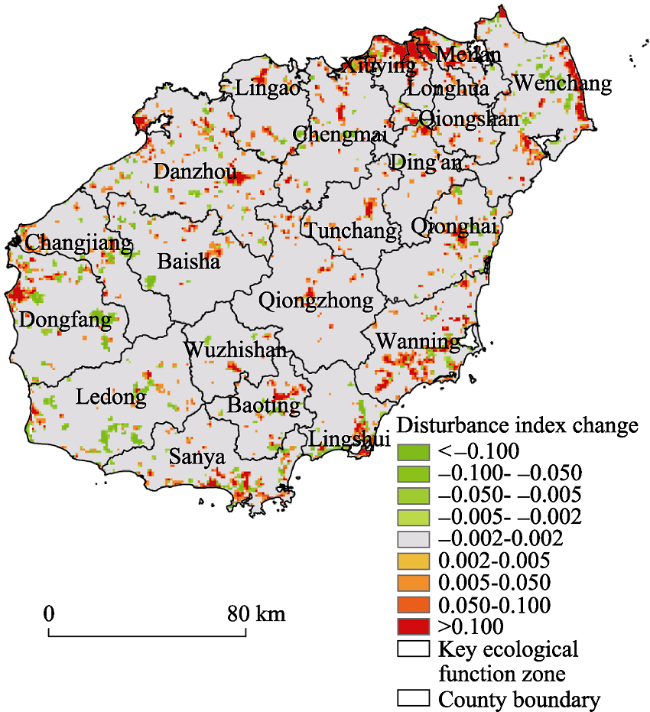
Ecosystem services have become one of the core elements of ecosystem management and evaluation. As a key area of ecosystem services and for maintaining national ecological security, ecosystem changes and implementation effect evaluation are important in national key ecological function zones, for promoting the main function zone strategy and for improving the construction of an ecological civilization. This article studies the ecological zone of a tropical rainforest region in the central mountain area of Hainan Island, China. Multi-source satellite data and ground observation statistics are analyzed with geo-statistics method and ecological assessment model. The core analysis of this paper includes ecosystem patterns, quality and services. By means of spatial and temporal scale expansion and multidimensional space-time correlation analysis, the trends and stability characteristics of ecosystem changes are analyzed, and implementation effect evaluation is discussed. The analysis shows a variety of results. The proportion of forest area inside the ecological zone was significantly higher than the average level in Hainan Island. During 1990-2013, settlement gradually increased inside the ecological zone. After implementation of the zone in 2010, human activity intensity increased, with the main land use being urban construction and land reclamation. Water conservation in the ecological function zone was higher than that outside the zone. In general, it increased slightly, but had obvious fluctuations. Soil conservation inside the zone was also better than that outside. However, it demonstrated dramatic fluctuations and relatively poor stability during 1990-2013. The human disturbance index inside the zone was significantly lower than that outside, and had a lower biodiversity threat level. Especially in 2010-2013, the increased range of the human disturbance index inside the zone was significantly less than that outside.

Cite this article

ZHAI Jun , Hou Peng , CAO Wei , YANG Min , CAI Mingyong , LI Jing . Ecosystem assessment and protection effectiveness of a tropical rainforest region in Hainan Island, China[J]. Journal of Geographical Sciences, 2018 , 28(4) : 415 -428 . DOI: 10.1007/s11442-018-1481-1

1 Introduction

The convening of the United Nations Conference on human environment and United Nations Conference on environment and development has prompted eco-environmental protection action all over the world. China has carried out ecological policies of classification and zoning to fulfil international responsibilities and promote regional ecological protection. Specific measures implemented include the establishment of nature reserves, national key ecological function zones, biodiversity protection priority areas and other types of ecologically important areas. The total area of these regions is 5365.9×103 km2, accounting for 55.89% of China’s land. These areas have played an important role in safeguarding national and regional ecological security (Hou et al., 2013). An increasing amount of research is focusing on assessment of the ecosystem status change and effectiveness analysis in ecologically important areas. Researchers have analyzed these issues from different perspectives to improve the level of regional ecosystem management and protection effectiveness. Related studies include single-type protected area effectiveness assessment using multiple monitoring indicators (Zheng et al., 2012; Yang et al., 2012; Zheng et al., 2012) and evaluation of the ecological security pattern of ecologically important regions by overlay analysis (Hou et al., 2013; Zheng et al., 2012; Yang et al., 2012; Zheng et al., 2012; Hou et al., 2017). Furthermore, some studies have focused on protected objects, by carrying out interference analysis on important areas for ecological protection by constructing sensitive ecological monitoring indexes (Zhao et al., 2014). By coupling spatial and temporal differences, research has also linked sensitive ecological parameters and protection effectiveness using a relative evaluation method (Zhao et al., 2015). The indicators used in monitoring and evaluation are mainly ecosystem type or ecological factor, which mostly describe the changes in the ecosystem pattern and specific ecological parameters.
The relationship between humans and nature has gained a new and deeper understanding with the present ecosystem services concept and in-depth research. With the implementation of the Millennium Ecosystem Assessment Project of the United Nations, ecosystem services based on supply, support, regulation and culture have clearly illustrated the complex relationship between ecosystems and human well-being. Based on this, management decision makers are beginning to pay attention to ecosystem services management. Ecosystem services have therefore become one of the core elements in the comprehensive assessment of ecosystems by the United Nations, international organizations and national governments (Hou et al., 2015; Zheng et al., 2013). In this context, the Chinese government and related departments are constantly exploring and practicing ecosystem services management at the regional scale. In 2010, the State Council promulgated The Major Function-Oriented Zone Planning in China, which identified 25 national key ecological function zones. As one of the key areas of ecosystem services and national ecological security, delineation and implementation of national key ecological function zones are of great significance for promoting regional sustainable development and improving human welfare. Previous studies on the national key ecological function zones have mainly been concentrated at the macro level, for example, ecological compensation (Kong, 2010), transfer payment (Li et al., 2013), development path choice (Wu et al, 2014), ecosystem services (Li et al., 2015) and ecosystem change (Huang et al., 2015). Due to the late delineation time of national key ecological function zones, there has been little research on the comprehensive assessment of the effectiveness of protection by ecosystem services in national key ecological function zones.
The concept of an ecological function protection area was first proposed in The National Outline for Ecological Environment Protection, which was released by the State Council in 2000. Meanwhile, ten national ecological protection areas, including North Yinshan Mountains and Horqin Sandy Land, had been established as pilot areas. The middle mountain area of Hainan Province was listed as a national ecological function protection pilot area in 2001. In 2005, Hainan Province approved the implementation of The National Ecological Function Protection Area Plan of the Middle Mountainous Area in Hainan Province. In 2007, the State Environmental Protection Administration of China issued The Outline of National Key Ecological Function Protection Plan, and, jointly with the Chinese Academy of Sciences, issued National Ecological Function Regionalization, which identified 50 national important ecological function zones. In the 2015 revised edition, the number of these zones increased to 63. After 17 years of continuous exploration and development, China has gradually proposed the important and key zones based on the ecological protection area concept. The tropical rainforest region of central Hainan Island was identified as a national key ecological function zone in the Major Function-Oriented Zone Planning in China, promulgated in 2010. As a rich biodiversity resource region in China, the ecosystem structure and services change of this zone are highly sensitive to local social and economic development.
In this article, multi-source satellite remote sensing data and ground observation statistics data are collected, and geostatistics and ecological assessment model methods are used to generate ecosystem patterns, vegetation growth and ecosystem functions. The main analysis methods are temporal and spatial expansion and multidimensional space-time contrast analysis. The temporal and spatial variation characteristics and conservation effectiveness of the ecological function zone are evaluated using the evaluation model of “comprehensive status and variation trend” (Hou et al., 2015). These could provide a scientific basis for improving the service capacity of the ecosystem in the national key ecological function zones of China.

2 Data and methods

2.1 Research area

The study area of this paper is the tropical rainforest region of central Hainan Island, including Wuzhishan City, Qiongzhong Li and Miao Autonomous County, Baisha Li Autonomous County, and Baoting Li and Miao Autonomous County. The area is located in central and southern Hainan Island and the geomorphic types of the area are mainly medium mountains, low mountains and hills. It covers about 9200 km2, accounting for approximately 27.1% of the total area of Hainan Island. The main ecosystem services are biodiversity conservation and water conservation. The middle mountainous area of Hainan Island is important for biodiversity, river sources, water conservation and soil conservation. It plays an important role in balancing the ecology, mitigating natural disasters and safeguarding ecological security.

2.2 Data

Land use and land cover change data on the study area, from 1990 to 2013, were obtained from the Landsat, CBERS, HJ-1A/B and other satellites (Liu et al., 2014). Then, the ecosystem types of Hainan Island were obtained from the first category of land use and land cover change data.
Normalized Differential Vegetation Index (NDVI) data were obtained from MOD13Q1, one of the moderate-resolution imaging spectrometer (MODIS) series products (https://lpdaac.usgs.gov). The spatial resolution of the product was 250 m, and the temporal resolution was 16 days. A Savitzky-Golay filter was used to remove long time series data noise from clouds and the atmosphere (Chen et al., 2004; Savitzky et al., 1964). Average annual NDVI values were used for the analysis in this article. Meteorological data such as annual rainfall were obtained from the National Meteorological Science Data Sharing Platform (http://data.cma.cn/). The original site data included 19 national ground observation stations, with nine of them distributed in Hainan Island and the other ten in the provincial-level areas of Guangdong and Guangxi around Hainan Island. The Anusplin interpolation method was used to generate the raster data set with 250 m spatial resolution.

2.3 Methods

In this paper, the ecosystem was divided into cropland, forest, grassland, water and wetland, construction land and bare land, based on the land use and land cover change data set, in order to analyze the ecosystem pattern and spatial and temporal distribution characteristics. The proportion of ecosystem in the area was chosen as the statistical indicator. Average annual NDVI was selected for analysis of land vegetation growth characteristics.
Water conservation capacity, the main indicator for assessing water conservation, was evaluated using the precipitation storage method (Zhao et al., 2004). Annual precipitation was generated based on interpolation of data observed by meteorological stations. The observed threshold value of rainfall runoff was taken from some literature. Tropical Rainfall Measuring Mission (TRMM) satellite daily rainfall data of 3 hours were revised by observed daily rainfall data around national meteorological stations. Then, single rainfall values greater than the threshold of the rainfall runoff were cumulated to calculate the proportion of the single point runoff rainfall to annual precipitation. The spatial pattern of the proportion of the regional runoff rainfall to annual precipitation could be calculated from the linear relationship of the single point proportion and the streamflow coefficient. The benefit coefficient of forest runoff reduction was obtained from literature. The rainfall runoff rate of grassland was calculated from the grassland coverage.
Soil conservation capacity, the main indicator for assessing soil conservation, was evaluated using the Revised Universal Soil Loss Equation (RUSLE). The soil conservation capacity was the difference between the amount of soil loss under the extreme degradation condition and the actual amount of soil loss in the ecosystem (Savitzky et al., 1964). Rainfall erosivity was modeled by daily rainfall (Zhang et al., 2002). The Nomo diagram method and 1:100 million soil databases were used to evaluate the soil erodibility factor (Wischmeier et al., 1971). Slope and slope length factors were calculated using the McCool and Liu methods (McCool et al., 1987; Liu et al., 1994). Vegetation coverage and management factors were obtained using the Cai method (Cai et al., 2000).
The human disturbance index of biodiversity, the main indicator for assessing biodiversity maintenance, was calculated by evaluating different ecosystems and levels of disturbance (Zhao et al., 2014). The higher the disturbance index, the greater the threat of human activities to the biological diversity maintenance, and the lower the biodiversity maintenance. Based on the degree of disturbance of different ecosystem types, each ecosystem type was graded. Then, four disturbance classification indexes were obtained (Zhao et al., 2014). The disturbance index considered only the human disturbance of the ecosystem types with natural vegetation. The disturbance index of unused land considered only saline-alkali soil with halophytic vegetation and marshland with hygrophilous vegetation. Ice and snow, sandy land, Gobi, bare land, bare rocks, and other ecosystems with sparse vegetation or no vegetation were not included.

3 Results and analysis

3.1 Ecosystem status assessment

3.1.1 Ecosystem composition and spatial distribution
The distribution of ecosystems in Hainan Island in 2013 is shown in Figure 1. In the central part of Hainan Island, the main ecosystem was forest, at the edge of which were cropland and construction land. The distributions of cropland and construction land were more heavily concentrated in the north than in the south. From the area and proportion of the ecosystems, forest covered the largest area, accounting for 63.6% of the land area of the whole island. This was followed by cropland, with 25.7%. Comparison of ecosystem types inside and outside the function zones showed that the ecosystem in the zone was mainly forest and cropland. Inside the zone, the proportion of forest area was higher than that of the whole island, reaching 84.5%, whereas cropland area accounted for only 8.2%. Outside the zone, cropland accounted for 30.3%, 22.1 percentage points higher than that inside the zone (Figure 2). As a whole, the natural vegetation ecosystem area inside the zone was much higher than that outside of the zone. The ecological background was better inside the zone.
Figure 1 Spatial distribution of ecosystem types (2013)
Figure 2 Statistical characteristics of ecosystem types (2013)
3.1.2 Vegetation growth
Long time series of MODIS NDVI data were used as the evaluation index of the land vegetation growth to identify the spatial and temporal distribution of vegetation growth during 2000-2013. The results showed that the growth of land vegetation inside the zone was obviously better than that outside the zone. NDVI values of 17 counties outside the zone were between 0.58 and 0.70, with a mean of 0.67 NDVI values of four counties inside the zone were greater than 0.74, with a mean of 0.77, 0.10 higher than that outside the zone. The maximum NDVI was 0.78, mainly in Baisha and Qiongzhong counties. The minimum two NDVI values were 0.58 and 0.61, for Meilan and Wenchang counties, respectively (Figure 3).
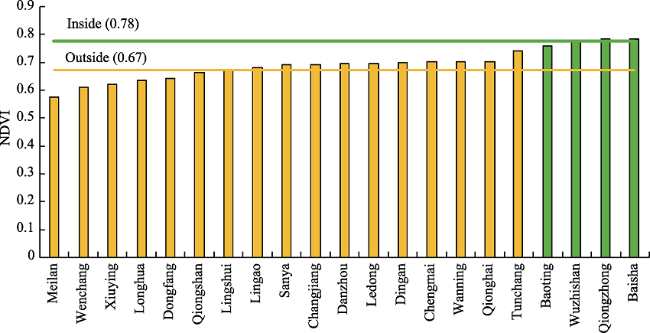
Figure 3 Statistical characteristics of NDVI in districts and counties (2013)
3.1.3 Ecosystem services
The water conservation capacity, simulated by the precipitation storage method, indicated that the mean water conservation capacities were 517.8×10³ m3/km2 and 329.7×10³ m3/km2 inside and outside the zone, respectively. The difference between the two values is 188.1×10³ m3/ km2. In the 21 counties across the island, the three with the largest water conservation capacity (> 530×103 m3/km2) were located inside the zone: Baoting, Wuzhishan and Qiongzhong. Lingao and Dongfang had the minimum water conservation capacities of 210.9×10³ m3/km2 and 226.6×10³ m3/km2, respectively (Figure 4).
The soil conservation capacity, simulated using the RUSLE method, indicated that the mean soil conservation capacities were 19,540 t/km2 and 6339 t/km2 inside and outside the zone, respectively. The difference between the two values is 13,201 t/km2. In the 21 counties across the island, the three with the largest soil conservation capacity (> 18,100 t/km2) were located inside the zone: Qiongzhong, Baoting and Wuzhishan. Longhua and Xiuying Counties had the minimum soil conservation capacities of 577 t/km2 and 931 t/km2, respectively (Figure 5).
The mean human disturbance index in Hainan Island was 0.4597 (Figure 6). The centers of the counties and coastal areas had high human disturbance index values because of their large proportion of construction land. In the central island, the degree of disturbance was relatively low because of its large area of forest and grassland. Meilan had the maximum disturbance index with 0.55, and Wuzhishan had the minimum value with 0.35. There were ten counties whose disturbance indexes were higher than the mean index of the island. In the 21 counties across the island, Wuzhishan, Qiongzhong, Baisha and Baoting, located inside the zone, had the minimum disturbance index values, averaging 0.3663. However, the mean value was 0.4816 outside the zone. Thus, the biodiversity maintenance function outside the zone was more obviously threatened than that inside the zone (Figure 7).
Figure 4 Statistical characteristics of water conservation in districts and counties (2013)
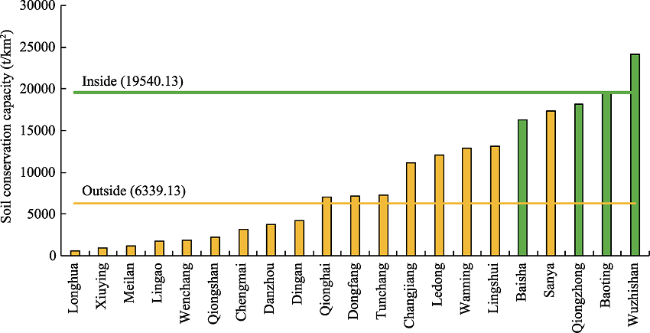
Figure 5 Statistical characteristics of soil conservation in districts and counties (2013)
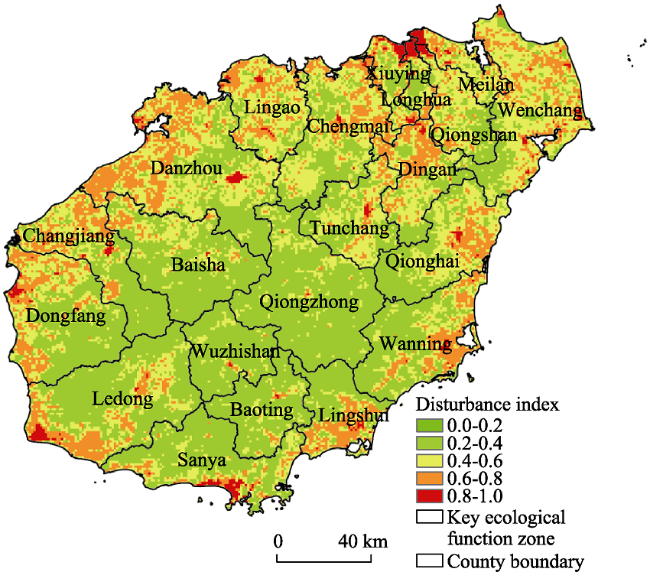
Figure 6 Spatial distribution of human disturbance index (2013)
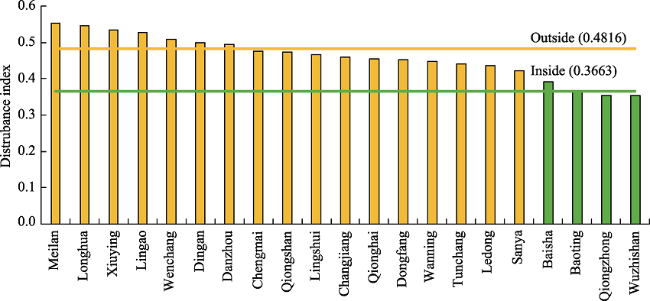
Figure 7 Statistical characteristics of human disturbance index in districts and counties (2013)

3.2 Ecosystem change and effectiveness analysis

3.2.1 Ecosystem temporal and spatial variation and effectiveness analysis
During 1990-2013, forest and cropland outside the zone showed a decreasing trend, and the
area proportion decreased from 58.3% and 31.9% to 58.0% and 30.3%, respectively. Construction land increased, with the area proportion increasing from 2.3% to 4.6%, mainly distributed along the coastline and in cropland in the northern part of the island. The main reasons were urbanization and the gradual release of tourism resources (Figure 8). Inside the ecological zone, the area proportion of forest decreased from 85% to 84.5%, and the area proportion of cropland increased from 7.8% to 8.2%. That of construction land increased slightly, and the major change was during the period 2000-2013, with the area proportion increasing from 0.5% to 0.8%. The main increases were for urbanization and villages. This change was much lower than that outside of the zone, whose construction land area proportion increased from 3.1% to 4.6%. Although human disturbance was less inside the zone, its gradual increase should not be ignored.
3.2.2 Vegetation growth temporal and spatial variation and effectiveness analysis
During 2000-2013, the mean NDVI values inside and outside the zone gradually increased. The mean NDVI inside the zone was about 0.75, and higher than that outside the zone (about 0.6). The stability of the NDVI can be demonstrated using its standard deviation (SD). Figure 9 shows that the SD of the NDVI inside the zone was less than that outside the zone. Although the mean values of the two sample spaces were different, the SD of the NDVI inside the zone showed a gradual decrease and the NDVI was relatively stable from 2000 to 2013. This indicates that the vegetation growth inside the zone was less disturbed, and the stability was better than that outside the zone.
3.2.3 Ecosystem services temporal and spatial variation and effectiveness analysis
During 1990-2013, the mean water conservation capacity both inside and outside the zone increased slightly. During the two periods of 1990-2000 and 2000-2010, the water conservation capacity first decreased and then increased. After 2010, it increased gradually (Figure 10). Figure 10 also indicates that the SD of the water conservation capacity inside the zone was less than that outside. This indicates that the water conservation inside the zone was less disturbed, and the stability was better than that outside.
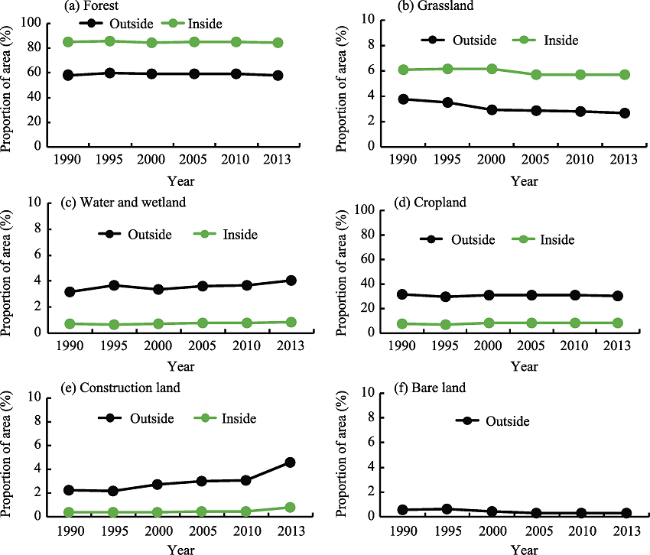
Figure 8 Statistical characteristics of ecosystem composition change in and out of key ecological function zone (1990-2013)
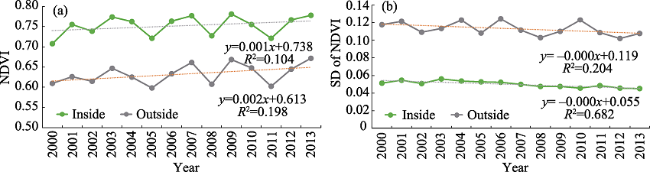
Figure 9 Statistical characteristics of mean and standard deviation change of NDVI in and out of key ecological function zone (1990-2013)
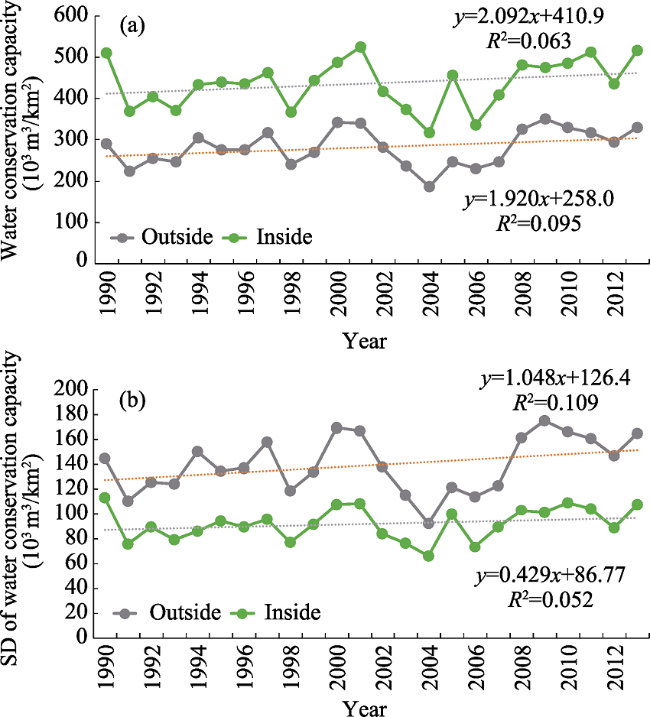
Figure 10 Statistical characteristics of mean and standard deviation change of water conservation in and out of key ecological function zone (1990-2013)
Classification statistics of the water conservation capacity inside the zone were calculated for three periods: 1990-2000 (S1), 2000-2010 (S2) and 2010-2013 (S3). Figure 11 depicts the results of the analysis. During the three periods, the mean values of water conservation capacity inside the zone were higher than those outside. It was showed gradient variation from exterior to interior spatially. The amount of water conservation in Hainan Island had been increased in the three periods, this was consistent with the results shown in Figure 9. The mean values of water conservation capacity inside the zone were 424.8×10³ m3/km2, 428.6× 10³ m3/km2 and 488.8×10³ m3/ km2, for the three periods, respectively, with ranges of variation of 3.8×10³ m3/km2 and 60.22 × 10³ m3/km2. The mean values of water conservation capacity outside the zone were 270.5×10³ m3/km2, 279.1×10³ m3/km2 and 318.2 × 10³ m3/km2, respectively, with ranges of variation of 8.6× 10³ m3/km2 and 39.1×10³ m3/km2 (Figure 11). Consequently, although the mean water conservation capacity increased both inside and outside the zone, the increase inside the zone was apparently higher than that outside the zone from period S2 to S3. This could reflect the impact of the key ecological function zone in promoting water conservation.
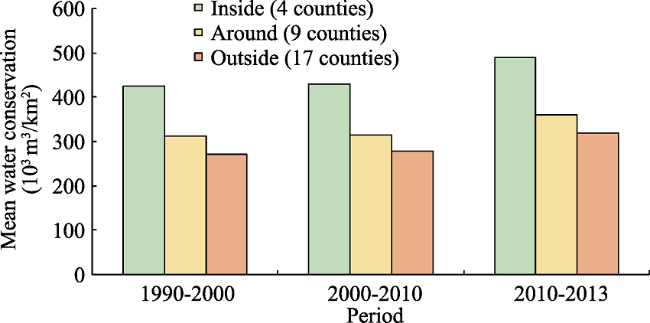
Figure 11 Statistical characteristics of mean water conservation during different time periods
During 1990-2013, the mean soil conservation capacity both inside and outside the zone increased slightly. During the two periods of 1990-2000 and 2000- 2010, soil conservation capacity first decreased and then increased. After 2010, the change decreased outside the zone but increased inside (Figure 12). Note that the soil conservation capacity inside the zone was one order of magnitude higher than that outside. Thus, the SD of the soil conservation capacity inside the zone was higher than that outside.
Classification statistics of the soil conservation capacity inside the zone were again calculated for the three periods: 1990-2000 (S1), 2000-2010 (S2) and 2010-2013 (S3). Figure 13 depicts the results of the analysis. During the three periods, the mean values of soil conservation capacity inside the zone were higher than those outside the zone. The gradient variation from exterior to interior was shown spatially. The amount of soil conservation in Hainan Island had been increased in the three periods, this was consistent with the results shown in Figure 10. The mean values of soil conservation capacity inside the zone were 15,296 t/km2, 16,972 t/km2 and 19,390 t/km2, for the three periods, respectively, with ranges of variation of 1576 t/km2 and 2419 t/km2. The mean values of soil conservation capacity outside the zone were 4560 t/km2, 5328 t/km2 and 6214 t/km2, respectively, with ranges of variation of 769 t/km2 and 886 t/km2 (Figure 13). Consequently, although the mean soil conservation capacity increased both inside and outside the zone, the increase inside the zone was apparently higher than that outside the zone from period S1 to S2 and period S2 to S3. This could reflect the impact of the key ecological function zone in promoting soil conservation.
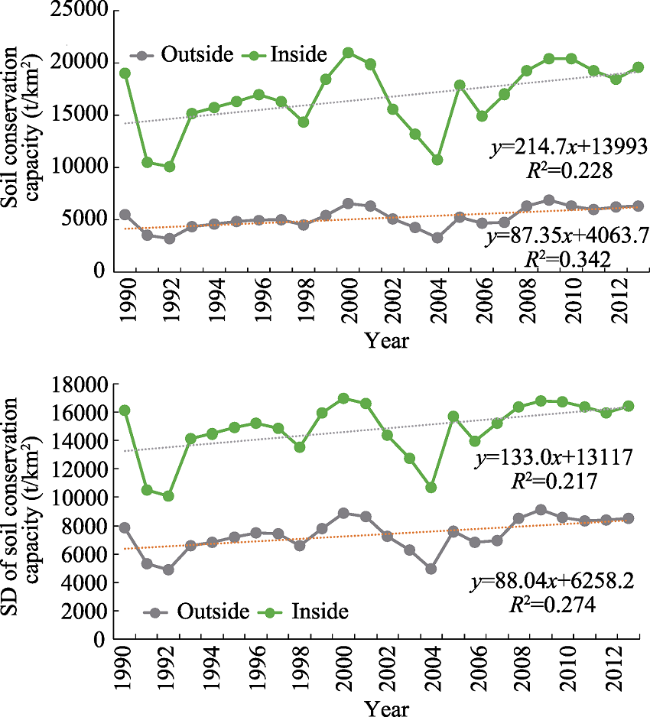
Figure 12 Statistical characteristics of mean and standard deviation change of soil conservation in and out of key ecological function zone (1990-2013)
Figure 13 Statistical characteristics of mean of soil conservation during different time periods
During 1990-2013, the human disturbance index of Hainan Island had increased 0.0129. Because of urbanization, artificial construction land occupied a large area of other ecosystem types in the centers of counties and coastal areas, and human disturbance was obviously increasing. However, the extent of human disturbance decreased in parts of southern and northern Hainan Island. Ledong and Baisha had minimum variations of human distribution, which decreased slightly. However, the remaining 19 counties showed an increasing trend of the index. Longhua had the largest increase in the distribution index (about 0.0749). Four counties, Longhua, Xiuying, Meilan and Qiongshan, had a higher distribution index variation than that of the whole island. The human distribution index variations of Wenchang and Dezhou were similar to that of the whole island. Other counties had lower values (Figure 14).
During 1990-2013, the human disturbance index change inside the zone was 0.0029, but the value of the counties surrounding the zone was 0.0049, about 1.71 times the change inside the zone. The 17 counties outside the zone had a human disturbance index change of 0.0152, which was much higher, about 5.31 times the change inside the zone. This was mainly because urbanization exacerbated the human disturbance outside the zone. During the periods of 1990-2000, 2000-2010 and 2010-2013, the human disturbance index change was smaller inside the zone than that outside. Thus, the extent of the threat of biodiversity inside the zone was less than that outside. The gradient effect was also formed in space. This could reflect the impact of the key ecological function zone in promoting biodiversity maintenance (Figure 15).
Figure 14 Variation characteristics of human disturbance index (1990-2013)
Figure 15 Variation statistical characteristics of human disturbance index during different time periods

4 Discussion and conclusions

Since the concept of ecological function protection was proposed in 2000, a number of national key ecological function zones and supporting policies have been formed after 17 years of continuous exploration and development in China. The zones are also an important basis for dividing ecological redlines and the main components of the strategy implementation of the Major Function-Oriented Zone Planning. This is of great significance to ensure regional ecological security and optimize the spatial pattern of the land. The middle mountain area in central Hainan Island was one of the key management areas. In this article, the tropical rainforest region of central Hainan Island was selected as the study area. Multi-source satellite remote sensing data and ground observation statistics data were collected, and geostatistics and ecological assessment model methods were used to generate ecosystem patterns, vegetation growth and ecosystem functions. The main analysis methods were temporal and spatial scale expansion and multidimensional space-time contrast analysis. Temporal and spatial variation characteristics and conservation effectiveness of the ecological function zone were also evaluated. The main conclusions are as follows.
(1) In 2013, the forest area proportion of Hainan Island was 25.7%, and the proportion inside the zone was 84.5%. The forest area inside the zone was thus significantly higher than the average level of the whole island. During 1990-2013, construction land increased gradually. After implementation of the ecological zone in 2010, the intensity of human activities continued to increase, mainly for urbanization and cropland land reclamation.
(2) Water conservation inside the zone was better than that outside the zone. In 2013, the water conservation capacity per unit area inside the zone was 517.8×10³ m3/km2, which was higher than the 329.7×10³ m3/km2 outside the zone. The counties with the three largest amounts of water conservation were all located inside the zone: Baoting, Wuzhishan and Qiongzhong. Their water conservation capacity was higher than 530×103 m3/km2. During 1990-2013, water conservation in the island improved, but with obvious inter-annual fluctuations. There was a relatively stable change inside the zone. Comparing the three periods of 1990-2000 (S1), 2000-2010 (S2) and 2010-2013 (S3), water conservation capacity inside the zone had a larger increase than that outside after 2010. This reflected the impact of the key ecological function zone in promoting water conservation.
(3) Soil conservation inside the zone was better than that outside. In 2013, soil conservation capacity inside the zone was 19,540 t/km2, which was higher than the 6339 t/km2 outside. The counties with the three largest amounts of soil conservation were all located inside the zone: Qiongzhong, Baoting and Wuzhishan. Their soil conservation capacity per unit area was higher than 18,100 t/ km2. During 1990-2013, soil conservation in the island improved, but with obvious inter-annual fluctuations. There was a relatively stable change inside the zone. Comparing the three periods of 1990-2000 (S1), 2000-2010 (S2) and 2010-2013 (S3), soil conservation capacity inside the zone had a larger increase than that outside after 2000. Moreover, it was more obvious after 2010. This reflected the impact of the key ecological function zone in promoting soil conservation.
(4) The ecological zone obviously had a smaller human disturbance index and a lower biodiversity threat than outside the zone. This will be beneficial to biodiversity conservation. The average of the human disturbance index inside the zone was 0.3664, which was 0.1152 lower than that outside. During 1990-2013, the human disturbance index change outside the zone was 0.0152, which was about 5.31 times the change inside the zone. During the three periods of 1990-2000, 2000-2010 and 2010-2013, the human disturbance index change inside the zone was smaller than that outside. Thus, the extent of the threat of biodiversity inside the zone was less than that outside. The difference in the threat level change was even greater after 2010. This could reflect the impact of the key ecological function zone in promoting biodiversity maintenance.
After 2010, the ecosystem status of the key ecological function zone gradually improved and was clearly better than that outside the zone. The ecological transfer payment fund and implementation of ecological engineering played positive roles in the improvement of the ecosystem status and services. During 2006-2010, the Hainan Provincial Government invested more than 2 million yuan in the central mountain area by transfer payment compensation. In 2008, Baisha, Qiongzhong and Baoting were brought into the government finance transfer payment. In 2009, Baisha, Qiongzhong, Changjiang, Ledong, Dongfang, Baoting, Sanya, Lingshui and Wuzhishan were brought into the government finance transfer payment. By the end of 2013, central finance had paid 2.68 billion yuan of funds for ecological transfer payments. In addition, since 2009, Hainan has started natural forest protection, afforestation, soil erosion prevention, ecological demonstration and other ecological engineering projects.
In this article, multi-source satellite remote sensing data and ground observation statistics data were used to assess the ecosystem patterns, vegetation growth and ecosystem functions. Geostatistics and ecological assessment model methods were also developed to identify ecosystem change and stability. An evaluation model of “comprehensive status and variation trend” was summarized to assess the spatial and temporal variation of the key ecological function zone. Optimization of the ecological assessment model, improvement of data resolution and clarification of the effects of different ecological engineering projects could be helpful in the implementation of ecological engineering projects according to local conditions.

The authors have declared that no competing interests exist.

[1]
Cai Chongfa, Ding Shuwen, Shi Zhihuaet al., 2000. Study of applying USLE and geographical information system IDRISI to predict soil erosion in small watershed.Journal of Soil and Water Conservation, 14(2): 19-24. (in Chinese)Based on the field survey in the typical small watershed, the method of geographical data base building was studied. Runoff and soil loss amount from experimental plots were used to generate K, C and P factors of USLE. By the support of IDRISI geographical information system and integration of the GIS and USLE, the soil erosion amount of the small watershed was predicted. Results showed that the serious eroded area (sediment is higher than 8 000 t/km 2) is 20%, but contributes 80% sediments of all watershed, while no or slightly eroded area (sediment is lower than 1 000 t/km 2) is 67%, only contributes 3% sediments.

[2]
Chen Jin, Jönsson P, Tamura Met al., 2004. A simple method for reconstructing a high-quality NDVI time-series data set based on the Savitzky-Golay filter.Remote Sensing of Environment, 91(3): 332-344.Although the Normalized Difference Vegetation Index (NDVI) time-series data, derived from NOAA/AVHRR, SPOT/VEGETATION, TERRA or AQUA/MODIS, has been successfully used in research regarding global environmental change, residual noise in the NDVI time-series data, even after applying strict pre-processing, impedes further analysis and risks generating erroneous results. Based on the assumptions that NDVI time-series follow annual cycles of growth and decline of vegetation, and that clouds or poor atmospheric conditions usually depress NDVI values, we have developed in the present study a simple but robust method based on the Savitzky鈥揋olay filter to smooth out noise in NDVI time-series, specifically that caused primarily by cloud contamination and atmospheric variability. Our method was developed to make data approach the upper NDVI envelope and to reflect the changes in NDVI patterns via an iteration process. From the results obtained by applying the newly developed method to a 10-day MVC SPOT VGT-S product, we provide optimized parameters for the new method and compare this technique with the BISE algorithm and Fourier-based fitting method. Our results indicate that the new method is more effective in obtaining high-quality NDVI time-series.

DOI

[3]
Hou Peng, Wang Qiao, Fang Zhiet al., 2013. Satellite based monitoring and appraising vegetation growth in national key regions of ecological protection.Acta Ecologica Sinica, 33(3): 780-788. (in Chinese)Abstract With the development of China, government is coming to realize the important of the nature and ecology conservation. In recent ten years, the government has set up many national key regions of ecological protection, and taken lots of effective measures to protect nature and ecology, then supporting the sustainable development. These regions mainly include National Key Ecological Function Region (KEFR), National Important Ecological Function Region (IEFR), National Biodiversity Protection Priority Region (BPRR) and National Natural Reserve Region (NNPR). It is well known to us that vegetation is one of the most important and active ecological element, and vegetation growth in national important ecological protection region is very important for maintaining stabile structure and function of regional ecosystem. In this paper, these national key regions are taken as the study region, cumulative NDVI is taken as the instruction factor, and vegetation growth is monitored and evaluated. Based on the SPOT VEGATATION NDVI from 1998 to 2007, mean value, standard deviation and linear change trend coefficient this period are calculated, and spatio-temporal statistical feature of vegetation growth is analyzed. The results show that: (1) Total area of the important ecological protection regions is 536. 59 km2, accounting for 55. 89% of the national land area. BPRR and KEFR and IEFR overlapped area is up to 53. 36% and 50. 20% of the total corresponding ecological function area respectively. NNPR and the other three types of area overlapped area are good, especially with KEFR, its area accounts for 75. 10% of NNPR. For KEFR and IEFR, overlapped area is respectively 63. 73% and 39. 15% of the corresponding types regions. (2) About general vegetation growth from 1998 to 2007 in these regions, middle and eastern area is better than that of the western regions. About the vegetation growth, there is about 10. 59% in poor level, about 29. 59% in common level, about 23. 44% in well level, and about 36. 39% in better level. NNPR and BPRR are better than KEFR and IEFR. The difference of spatial distribution is the most remarkable. (3) About change trend of vegetation from 1998 to 2007 in these regions, general trend in these regions is a slightly increasing. 62. 39% of these regions is a relatively stable trend, 22. 69% of these regions is in a better trend, 14. 93% of these regions is in a bad trend. IEFR is the most obvious vegetation trend, the second is BPRR. BPRR in the different of change trend is maximum, NNPR is minimum. For different types of national ecological protection areas, these results are different beneficial to different national important ecological protection region. For NNPR, these can reflects the effectiveness of the protection after their establishment in a certain extent. For others, these can be used as the background of the ecological state, and carried out the analysis of the effectiveness of national ecologically important protected areas in the future.

DOI

[4]
Hou Peng, Wang Qiao, Shen Wenminget al., 2015. Progress of integrated ecosystem assessment: Concept, framework and challenges.Geographical Research, 34(10): 1809-1823. (in Chinese)All biological and abiotic have dual attributes in the natural ecosystems. They are the integral part of ecosystem, and basic resources for the sustainable development of the human society. Objective and accurate assessment of ecosystem, not just a scientific question of ecosystem ecology, is also a management issue of the sustainable development of the human society. To objectively find and understand change features of ecosystem by comprehensive assessment is a popular and difficult topic in ecological research field, and is one of the key propositions of sustainable development of human society. Integrated ecosystem assessment is to better serve the integrated ecosystem management and enhance the ecological system of human society support ability. In this processing and behavior, the ecosystem and its service ability for human society are analyzed, and their statuses and changes are found and understood. There are many core contents in the integrated ecosystem assessment, such as the ecosystem management, ecosystem services, ecological assets. Facing the multiple,comprehensive and open ecosystem, some countries and international organizations have carried out many explorations and practices of integrated ecosystem assessment, and put forward various evaluation frameworks. There are still many problems and challenges. This paper examines the progress of ecosystem assessment, including the concept, framework model and main content, development trends and challenges. Based on the complex"social-economicnatural"ecosystems, interactive process of society and ecosystem, concept and content of ecosystem management, ecosystem services, ecological assets and their relationship are discussed. According to the practices and cases of integrated ecological system assessment,which include lots of assessment in global, regional, and national scales, four integrated assessment framework models are summed up. They are "ecological pressure-policy responses", "ecological services-human well-being", "natural benefits-ecology management", "comprehensive status-change trends". However, as ecosystems are diverse, integrated,complex, and open, lots of scientific questions should be paid more attention in the future,including integrated assessment framework and its relevant theoretical basis, indicators and methods of ecosystem assessment, observation technology integration and data assimilation methods, temporal and spatial scales.

DOI

[5]
Hou Peng, Yang Min, Zhai Junet al., 2017. Discussion about natural reserve and construction of national ecological security pattern.Geographical Research, 36(3): 420-428. (in Chinese)Scientific evaluation of the relationship between nature protection zones and national ecological security is the important foundation to guide the development of nature protection zones and the construction of national ecological security pattern.In the case of the national key ecological function zones,biodiversity conservation priority zones and national reserves,spatio-temporal distribution of natural protection zones and its important role in safeguarding national ecological security were analyzed quantitatively.This article also identified the lack of national ecological security pattern based on ecological system service assessment,put forward the ecological protection management and control suggestions for the demand of national ecological security construction and security.Results show that:(1)The total area of natural protection zones was 4.88 million square kilometers,accounting for51.38%of the national land area.Grassland,forest and desert were the main ecosystems and had an area of 3.71 million square kilometers,accounting for 76.0%of the national protection zones area.Between 2000 and 2010,ecological system was basically stable in the national protection zones.There was only a small amount of transformation between different ecosystems.The characteristics of ecosystem transformation in different natural protection zones were slightly different.This had played an important role in protecting the stability of the ecological space and ecological security pattern.(2)Comprehensive consideration of ecosystem services importance in water conservation,soil conservation and biodiversity maintenance showed that the area of extremely important and important ecosystem services zones of natural protection zones was 3.21 million square kilometers,accounting for 66.02%of the national land area.Forest,grassland and shrub were the subject of the ecosystem services.Overall,during the 2000-2010 period,water conservation and soil conservation had improved.There was no obvious change of biodiversity maintenance.(3)The area of extremely important ecosystem services zones was 3.26 million square kilometers,accounting for 34.4%of the national land area.The 31.7%area of extremely important ecosystem services zones was not in the natural protection zones.Complementing and improving the existing natural protection zones were needed to construct the national ecological security pattern based on scientific demonstration.(4)It is urgent to establish a strict protection system for national ecological security construction and safeguard demand based on national governance model.Also,we should raise the cognitive level of natural law to enhance the comprehensive management of ecological system,upgrade the classification and zoning management to upgrade natural protection zones,improve the ecological compensation mechanism for establishing cooperative protection system,and strengthen the comprehensive supervision of ecological protection to minimize ecological damage.

[6]
Huang Lin, Cao Wei, Wu Danet al., 2015. Assessment on the changing conditions of ecosystems in key ecological function zones in China.Chinese Journal of Applied Ecology, 26(9): 2758-2766.In this paper,the dynamics of ecosystem macrostructure,qualities and core services during 2000 and 2010 were analyzed for the key ecological function zones of China,which were classified into four types of water conservation,soil conservation,wind prevention and sand fixation,and biodiversity maintenance. In the water conservation ecological function zones,the areas of forest and grassland ecosystems were decreased whereas water bodies and wetland were increased in the past11 years,and the water conservation volume of forest,grassland and wetland ecosystems increased by 2.9%. This region needs to reverse the decreasing trends of forest and grassland ecosystems. In the soil conservation ecological function zones,the area of farmland ecosystem was decreased,and the areas of forest,grassland,water bodies and wetland ecosystems were increased. The total amount of the soil erosion was reduced by 28.2%,however,the soil conservation amount of ecosystems increased by 38.1%. In the wind prevention and sand fixation ecological function zones,the areas of grassland,water bodies and wetland ecosystems were decreased,but forest and farmland ecosystems were increased. The unit amount of the soil wind erosion was reduced and the sand fixation amount of ecosystems increased lightly. In this kind of region that is located in arid and semiarid areas,ecological conservation needs to reduce farmland area and give priority to the protection of the original ecological system. In the biodiversity maintenance ecological function zones,the areas of grassland and desert ecosystems were decreased and other types were increased. The human disturbances showed a weakly upward trend and needs to be reduced. The key ecological function zones should be aimed at the core services and the protecting objects,to assess quantitatively on the effectiveness of ecosystem conservation and improvement.

DOI PMID

[7]
Kong Fanbin, 2010. Eco-compensation mechanism for ecological function conservation zones in the headwaters: A case study of Dongjiang riverhead region in Jiangxi province.Economic Geography, 30(2): 299-305. (in Chinese)

[8]
Li Guoping, Li Xiao, Wang Haizhou, 2013. Ecological compensation effect of national key ecological function area’s transfer payment policy.Modern Economic Science, 35(5): 58-64. (in Chinese)The environmental protection and the ecological construction of National Key Ecological Function Area are crucial to the ecological security of China's macro-region and micro-region. The government has developed a series of prohibited and restricted policies for the development and construction of these regions and the National Key Ecological Function Area's transfer payment policy for these regions has been built. Based on the cost-benefit analysis and the standard of minimum safety,we can obtain National Key Ecological Function Area's theoretical standard of eco-compensation. Using this theoretical standard,we study the income distribution standard,computational formula,the use of funds,assessment,incentive and restraint of National Key Ecological Function Area's transfer payment policy. This paper finds that the low performance of eco-compensation of National Key Ecological Function Area is closely related to the National Key Ecological Function Area's transfer payment policy.

[9]
Li Yingying, Liu Kang, Hu Shenget al., 2015. Water conservation function of Ziwuling Ecological Area in Shaanxi Province.Arid Land Geography, 38(3): 636-642. (in Chinese)

[10]
Liu B Y, Nearing M A, Risse L M, 1994. Slope gradient effects on soil loss for steep slopes.Transactions American Society of Agriculture Engineers, 37(6): 1835-1840.Data for assessing the effects of slope gradient on soil erosion for the case of steep slopes are limited. Widely used relationships are based primarily on data that were collected on slopes up to approximately 25%. These relationships show a reasonable degree of uniformity in soil loss estimates on slopes within that range, but are quite different when extrapolated beyond the range of the measured data. In this study, soil loss data from natural runoff plots at three locations on the loess plateau in China were used to assess the effect of slope gradient on soil loss for slopes ranging from 9 to 55% steepness. Plot size at each location was 5 m wide by 20 m long, and the soils were silt loams or silty-clay loam. The results indicated that for these plots, soil loss was linearly related to the sine of the slope angle according to the equation: S = 21.91 sinq 鈥 0.96, where q is the slope angle and S is the slope steepness factor normalized to 9%. This relationship was assessed in terms of the limited existing experimental data for rainfall erosion on steep gradients and found to be reasonable for data collected on longer plots, but somewhat different than the data from shorter plot studies. The results of this study would indicate a lesser soil loss at high slopes than does the relationship used in the Universal Soil Loss Equation, but a greater soil loss than predicted by the Revised Universal Soil Loss Equation for steep slopes.

DOI

[11]
Liu Jiyuan, Kuang Wenhui, Zhang Zengxianget al., 2014. Spatiotemporal characteristics, patterns, and causes of land-use changes in China since the late 1980s.Journal of Geographical Sciences, 24(2): 195-210.Land-use/land-cover 变化(LUCC ) 有连接到人和自然相互作用。瓷器 Land-Use/cover 数据集(CLUD ) 从 1980 年代末在 5 年的间隔定期被更新到 2010,与基于 Landsat TMETM+ 图象的标准过程。陆地使用动态区域化方法被建议分析主要陆地使用变换。在国家规模的陆地使用变化的空间与时间的特征,差别,和原因然后被检验。主要调查结果如下被总结。越过中国的陆地使用变化(LUC ) 在最后 20 年(19902010 ) 里在空间、时间的特征显示了一个重要变化。农田变化的区域在南方减少了并且在北方,而是仍然是的全部的区域增加了几乎未改变。回收农田从东北被转移到西北。布满建筑物陆地很快膨胀了,主要在东方被散布,并且逐渐地展开到中央、西方的中国。树林首先减少了,然后增加但是荒芜的区域是反面。草地继续减少。在中国的 LUC 的不同空间模式被发现在之间迟了第 20 世纪并且早第 21 世纪。原版 13 个 LUC 地区在一些地区被边界的变化由 15 个单位代替。包括的这些变化(1 ) 的主要空间特征加速的扩大布满建筑物在 Huang-Huai-Hai 区域,东南的沿海的区域,长江的中流区域,和四川盆登陆;(2 ) 从东北中国和东方内部蒙古在北方转移了陆地开垦到绿洲在西北中国的农业区域;(3 ) 从在到稻的东北中国的喂雨的农田的连续转变回答;并且(4 ) 为在内部蒙古,黄土高原,和西南的多山的区域的南部的农业牧剧的交错群落的格林工程的谷物的有效性。在最后二十年,尽管在北方的气候变化在农田影响了变化,政策规定和经济驱动力仍然是越过中国的 LUC 的主要原因。在第 21 世纪的第一十年期间,在陆地使用模式驾驶了变化的人为的因素从单程的陆地开发转移了强调到开发和保存。动态区域化方法被用来在单位的 zoning 边界,地区的内部特征,和生长和减少的空间17

DOI

[12]
McCool D K, Brown L G, Foster G Ret al., 1987. Revised slope steepness factor for the Universal Soil Loss Equation.Transactions American Society of Agriculture Engineers, 30(5): 1387-1396.ABSTRACT Areanalysis of historical and recent data from both natural and simulated rainfall soil erosion plots has resulted in new slope steepness relationships for the Universal Soil Loss Equation. For long slopes on which both interrill and rill erosion occur, the relationships consist of two linear segments with a breakpoint at 9% slope. These relationships predict less erosion than current relationships on slopes steeper than 9% and slopes flatter than about 1%. A separate equation is proposed for the slope effect on short slopes where only interrill erosion is present. For conditions where surface flow over thaw-weakened soil dominates the erosion process, two relationships with a breakpoint at 9% slope are presented.

DOI

[13]
Renard K G, Foster G R, Weesies G Aet al., 1997. Predicting soil erosion by water: A guide to conservation planning with the revised universal soil loss equation (RUSLE). Washington: USDA Agriculture Handbook.The book provides guidelines for the selection of the best control methods for farms, ranches and other erosion-prone areas throughout USA. The prediction of soil loss founded on the Universal Soil Loss Equation (USLE) is revised using information available on monthly precipitation and temperature, front-free period, annual rain erosivity, below ground biomass, canopy cover and height at 15 days intervals, and soil cover disturbances associated with farming operations. The information is available on CITY, CROP and OPERATION...

[14]
Savitzky A Golay M J E, 1964. Smoothing and differentiation of data by simplified least squares procedures.Analytical Chemistry, 36(8): 1627-1639.

DOI

[15]
Wischmeier W H, Johnson C B, Cross B V, 1971. A soil erodibility nomograph for farmland and construction sites.Journal of Soil and Water Conservation, 26(26): 189-193.A NEW SOIL PARTICLE-SIZE PARAMETER WAS FOUND AND USED TO DERIVE A CONVENIENT ERODIBILITY EQUATION THAT IS VALID FOR EXPOSED SUBSOILS AS WELL AS FARMLAND. A SIMPLE NOMOGRAPH PROVIDES QUICK SOLUTIONS TO THE EQUATION. ONLY FIVE SOIL PARAMETERS NEED TO BE KNOWN: PERCENT SILT, PERCENT SAND, ORGANIC MATTER CONTENT, STRUCTURE, AND PERMEABILITY. THE NEW WORKING TOOL OPENS THE DOOR TO SEVERAL NEW CONSIDERATIONS IN SEDIMENT- CONTROL PLANNING. /AUTHOR/

DOI

[16]
Wu Qitao, Chen Weilian, Zhang Hong’ouet al., 2014. Choice and development path of leading industry in naming ecological function zone.Ecological Economy, 30(2): 88-92. (in Chinese)Ecological Functions Zone has the responsibility of ecological construction and environmental protection. To coordinate ecological civilization and economic construction, the region have to distinguish the leading industry according to regional characteristics and advantages, and give fully policy support to the industry development. This paper constructs a crystal model as the references of scientific selecting leading industry. The model includes four parts: resources and environment carrying capability, industrial efficiency and relevancy, resource comparative advantage and policy advantage. These references are the core standards to distinguish the suitable industries for the ecological region. Nanling Ecological Functions Zone is analyzed as the case study, the leading industries including featured agriculture, ecotourism, under-forest economy and sustainable green industry. Finally, the paper preliminary analyzes the development path of the leading industries of Nanling Zone.

[17]
Yang Jun, Zhang Mingxiang, Lei Guangchun, 2012. Biases in “Protection efficacy of national wetland reserves in China”.Chinese Science Bulletin, 57(15): 1367-1370. (in Chinese)

DOI

[18]
Zhang Wenbo, Xie Yun, Liu Baoyuan, 2002. Rainfall erosivity estimation using daily rainfall amounts.Scientia Geographica Sinica, 22(6): 705-711. (in Chinese)

[19]
Zhang Yili, Hu Zhongjun, Qi Weiet al., 2015. Assessment of protection effectiveness of nature reserves on the Tibetan Plateau based on net primary production and the large-sample-comparison method.Acta Geographica Sinica, 70(7): 1027-1040. (in Chinese)A total of 21 typical coupled large samples were chosen from areas in the nature reserves and their surroundings on the Tibetan Plateau(TP) with large- sample- comparison method(LSCM). To evaluate the protection effectiveness of the nature reserves, we compared the alpine grassland net primary production(NPP) of these coupled samples and analyzed the differences between them before and after their establishment as protected areas. The results show that:(1) In view of alpine grassland NPP, the ecological and environmental conditions of most nature reserves were more fragile than those of their surrounding areas and also lower than the average values for the TP.(2) Of the 11 typical nature reserves selected, the positive trend of NPP in Manzetang is the most significant, while in Taxkorgan, the trend is not obvious.Moreover, with the exception of Selincuo, the annual NPP growth rate in nature reserves covered by meadow and herbaceous wetland is higher than that in nature reserves consisting of steppe and desert grassland.(3) Some notable findings existed in 21 typical coupled samples:(a) After the establishment of nature reserves, the annual NPP increase rate in 76% of samples inside nature reserves and 82% of samples inside national nature reserves are apparently higher than that of corresponding samples outside nature reserves.(b) The ecological protection effectiveness in Central Kunlun, Changshagongma, Zoige Wetland, and Siling Co nature reserves is significant; in most parts of the Three Rivers' Source and Qiangtang nature reserves,the protection effectiveness is relatively significant, while in south- east Manzetang and north Taxkorgan, the protection effectiveness is not obvious.(c) The ecological protection effectiveness is significant in nature reserves consisting of meadow; however, it is weak in nature reserves covered by steppe.

DOI

[20]
Zhao Guosong, Liu Jiyuan, Kuang Wenhuiet al., 2014. Disturbance impacts of land use change on biodiversity conservation priority areas across China during 1990-2010.Acta Geographica Sinica, 69(11): 1640-1650. (in Chinese)

[21]
Zhao Tongqian, Ouyang Zhiyun, Zheng Hua, 2004. Forest ecosystem services and their valuation in China.Journal of Natural Resources, 19(4): 480-491. (in Chinese)Forest ecosystem plays a special role in maintaining the structure,function and ecologi-cal process of natural ecosystems.At present,a series of ecological problems are becoming more and more serious because of forest damage in some regions.The accurate valuation of forest ecosystem services is very important to the reserve and rational development of forest resources in China.Forest ecosystem services are divided into four groups:provisioning services,regulating services,cultural services,and supporting services in this paper.On the basis of the service mechanism analyses,an index system for the assessment of forest ecosystem services has been established,which consists of 13 service indexes such as timber and other products,weather regulation,C fixation,water storage,erosion control,air quality purifying,nutrients cycle,windbreaks,cultural diversity,recreation and ecotourism,O2 release,and provisioning of habitat.Then,10 services of China forest have been assessed and evaluated by taking the year of 2000 as the base year.Including timber and other products provision,C fixation,water storage,erosion control,air quality purifying,nutrients cycle,recreation and ecotourism,O2 release,and provisioning of habitat.As a result,the economic values of these services are 2 325.14×108,1 626.76×108,2 134.7×108,136.46×108,41.85×108,372.37×108,194.31×108,6732.48×108,and 495.94×10⁸ yuan,respectively.The total value is estimated as 14 060.05×10⁸ yuan with indirect values being 11 540.60×10⁸ yuan,4.6 times that of the direct values.The results show that forest ecosystems provide huge indirect values to human being besides the direct value of goods,and that the indirect values are egually important as the direct values.The focuses of forest ecosystem services and their valuation in the future should be the service mechanism and the coupling and the application of different scales data.

DOI

[22]
Zheng Hua, Li Yifeng, Ouyang Zhiyunet al., 2013. Progress and perspectives of ecosystem services management.Acta Ecologica Sinica, 33(3): 702-710. (in Chinese)Ecosystems provide human multiple types of ecosystem services in the aspects of natural resources and living environment,and all these services are crucial foundation of sustainable social and economic development.However,between the understanding of ecosystem services and practice of management,there exist great challenges which contain: quantifying ecosystem services,relationships among multiple services,multi-scale correlation of services,combination of ecosystem services and policy design.In response to these challenges,researches of ecosystem services management in recent years have focused on fields as follow: quantitative estimate of ecosystem services,relationship between ecosystem services and human well-being,trade-offs among multiple ecosystem services,conservation planning of ecosystem services and mechanisms of payments for ecosystem services.With the goal to promote ecosystem services management practices,we should: further strengthen the theoretical research about provision of ecosystem services,develop more methods to display results of services research,carry out more interdisciplinary studies with sociology,economics,demography,search for practicable and reasonable approach to incorporating ecosystem services into decision-making.

DOI

[23]
Zheng Yaomin, Niu Zhenguo, Gong Penget al., 2012. Protection efficacy of national wetland reserves in China.Chinese Science Bulletin, 57(10): 1116-1134. (in Chinese)

DOI

[24]
Zheng Yaomin, Zhang Haiying, Niu Zhenguoet al., 2012. Protection efficacy of national wetland reserves in China.Chinese Science Bulletin, 57(1): 1-24. (in Chinese)正Similar to last year, in this first issue of January 2012, we would like to summarize the recent progress made by the Chinese Science Bulletin (CSB), and to wish all of our editorial board members, reviewers, authors, readers, and collaborators a happy New Year. First, we are very pleased to announce the progress made in 2011: in March 2011,

DOI

Outlines

/