
Journal of Geographical Sciences >
Spatial and temporal variation of vegetation phenology and its response to climate changes in Qaidam Basin from 2000 to 2015
Author: Fu Yang (1987-), Master, specialized in global change and environmental change. E-mail: fuy0220@qq.com
*Corresponding author: Chen Hui (1972-), Professor, specialized in ecology and integrated physical geography. E-mail: chenhui@igsnrr.ac.cn
Received date: 2017-05-31
Accepted date: 2017-09-28
Online published: 2018-03-30
Supported by
National Natural Science Foundation of China, No.40971118
Physical Geography Key Disciplines Construction Subjects of Hebei Province
Copyright
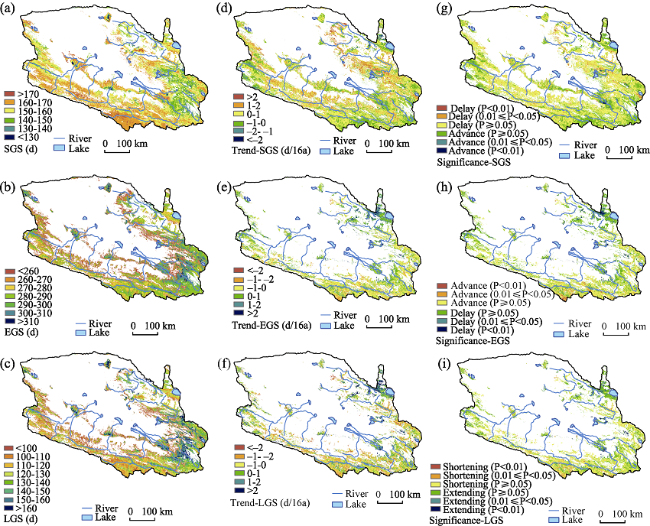
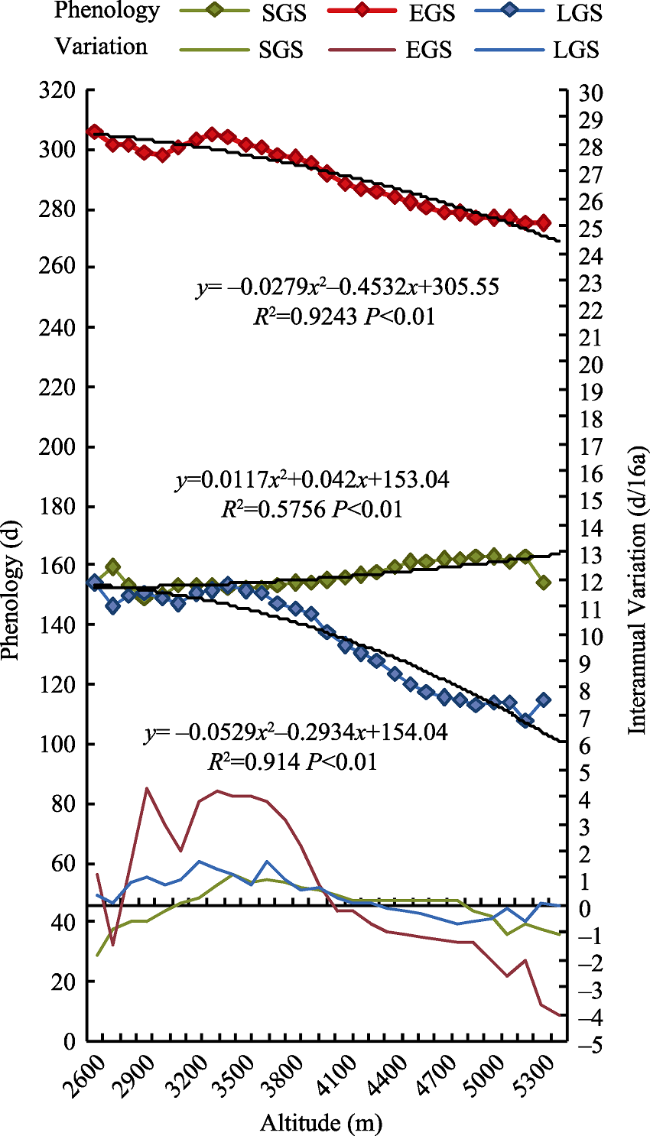
Based on TIMESAT 3.2 platform, MODIS NDVI data (2000-2015) of Qaidam Basin are fitted, and three main phenological parameters are extracted with the method of dynamic threshold, including the start of growth season (SGS), the end of growth season (EGS) and the length of growth season (LGS). The spatial and temporal variation of vegetation phenology and its response to climate changes are analyzed respectively. The conclusions are as follows: (1) SGS is mainly delayed as a whole. Areas delayed are more than the advanced in EGS, and EGS is a little delayed as a whole. LGS is generally shortened. (2) With the altitude rising, SGS is delayed, EGS is advanced, and LGS is shortened and phenophase appears a big variation below 3000 m and above 5000 m. (3) From 2000 to 2015, the temperature appears a slight increase along with a big fluctuation, and the precipitation increases evidently. (4) Response of phenophase to precipitation is not obvious in the low elevation humid regions, where SGS arrives early and EGS delays; while, in the upper part of the mountain regions, SGS delays and EGS advances with temperature rising, SGS arrives early and EGS delays with precipitation increasing.
FU Yang , CHEN Hui , NIU Huihui , ZHANG Siqi , YANG Yi . Spatial and temporal variation of vegetation phenology and its response to climate changes in Qaidam Basin from 2000 to 2015[J]. Journal of Geographical Sciences, 2018 , 28(4) : 400 -414 . DOI: 10.1007/s11442-018-1480-2
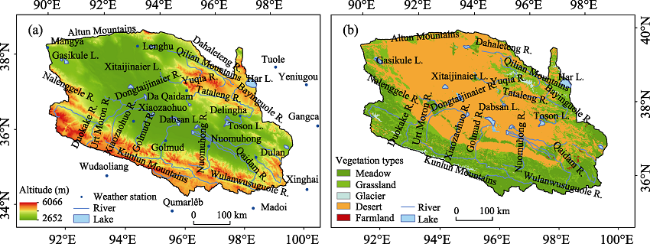
Figure 1 Location of Qaidam Basin and vegetation distribution |
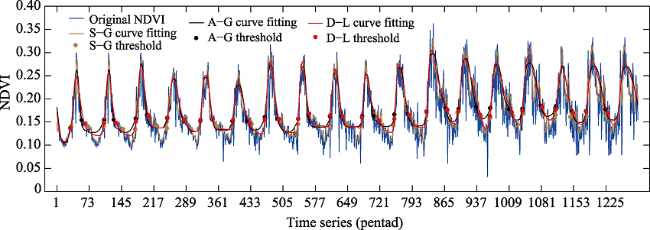
Figure 2 Comparison of three time series method for reconstructing a high-quality NDVI time series data |
Figure 3 The spatial pattern (a-c) and interannual variation (d-i) of phenology in Qaidam Basin during 2000-2015 |
Figure 4 The relations between phenology and altitude of Qaidam Basin during 2000-2015 |
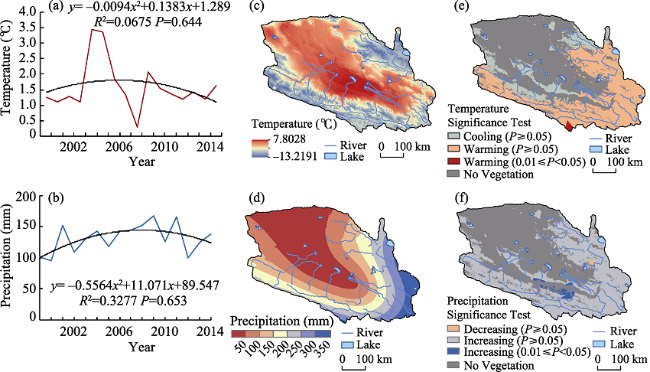
Figure 5 Spatial and temporal distribution of temperature and precipitation (a-d), and their significance (e, f) in Qaidam Basin during 2000-2015 |
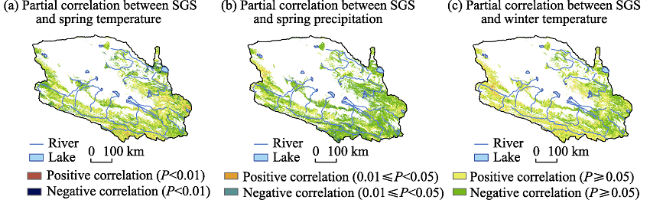
Figure 6 The relationship between SGS and spring temperature (a), as well as spring precipitation (b) and winter temperature (c) in Qaidam Basin |
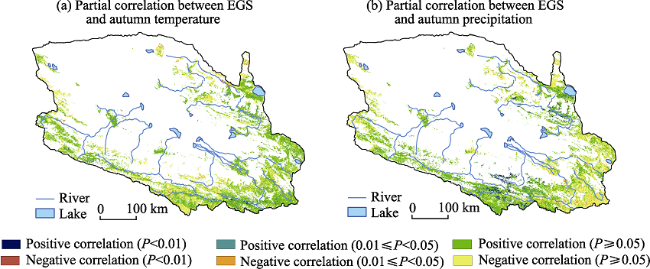
Figure 7 Partial correlations between EGS and autumn temperature (a), as well as autumn precipitation (b) in Qaidam Basin |
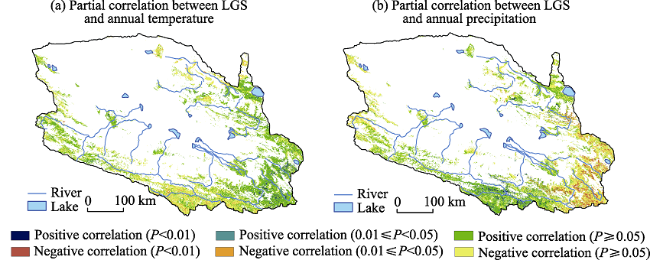
Figure 8 Partial correlations between LGS and annual temperature (a), as well as annual precipitation (b) in Qaidam Basin |
The authors have declared that no competing interests exist.
| [1] |
|
| [2] |
|
| [3] |
|
| [4] |
|
| [5] |
|
| [6] |
|
| [7] |
|
| [8] |
|
| [9] |
|
| [10] |
|
| [11] |
|
| [12] |
|
| [13] |
|
| [14] |
|
| [15] |
|
| [16] |
|
| [17] |
|
| [18] |
|
| [19] |
|
| [20] |
|
| [21] |
|
| [22] |
|
| [23] |
|
| [24] |
|
| [25] |
|
| [26] |
|
| [27] |
|
| [28] |
|
| [29] |
|
| [30] |
|
| [31] |
|
| [32] |
|
| [33] |
|
| [34] |
|
| [35] |
|
| [36] |
|
/
| 〈 |
|
〉 |