
Journal of Geographical Sciences >
An analysis of oasis evolution based on land use and land cover change: A case study in the Sangong River Basin on the northern slope of the Tianshan Mountains
Author: Zhang Qi (1991-), specialized in land use and land cover change, remote sensing and GIS application. E-mail: zhangqi_91@foxmail.com
*Corresponding author: Luo Geping (1968-), PhD and Professor, specialized in the remote sensing of natural resources and the environment, land use and cover change (LUCC) and ecological effects. E-mail: luogp@ms.xjb.ac.cn
Received date: 2016-07-08
Accepted date: 2016-08-06
Online published: 2017-04-10
Supported by
National Natural Science Foundation of China, No.U1303382
The National Basic Research Program of China, No.2014CB460603
The Project of State Key Laboratory of Desert and Oasis Ecology, No.Y471163
Copyright
This study investigated oasis evolution and the changes of peripheral desert in the Sangong River Basin since the 1950s by rebuilding seven land cover maps derived from black-and-white aerial photographs (1958, 1968, and 1978), a color-infrared aerial photograph (1987), Landsat Thematic Mapper (TM) imagery (1998), Satellite Pour l’Observation de la Terre (SPOT) imagery (2004), and Landsat Operational Land Imager (OLI) imagery (2014). The results showed that: (1) Since 1950, the oasis consecutively expanded more than four times from an alluvial fan to an alluvial plain, causing the shrinkage of desert landscapes that were dominated by a Haloxylon ammodendron Bunge community (HBC) and a Tamarix chinensis Lour community (TLC). Furthermore, the primary (1958-1968) and final (2004- 2014) stages were the most important periods, during which agricultural land experienced the most rapid expansion during the period 1958-1968, and the built-up area showed the most rapid expansion after the 2000s. (2) Two basic management modes, a “local mode” formed by the local governments and a “farm management mode” developed by Xinjiang Production and Construction Corps, together promoted oasis evolution under various land-use and land- cover (LULC) stages. (3) The evolution of the modern oasis during the 1950s-2004 showed the general features of an arid oasis, while during the period of 2004-2014 it was characterized by a large-scale inter-basin water diversion or the import of new water sources. (4) The oasis expanded at the expense of desert vegetation, resulting in distinct variation in the structure of the desert plant community, which will make it more difficult to protect the desert ecosystem.
ZHANG Qi , LUO Geping , LI Longhui , ZHANG Miao , LV Nana , WANG Xinxin . An analysis of oasis evolution based on land use and land cover change: A case study in the Sangong River Basin on the northern slope of the Tianshan Mountains[J]. Journal of Geographical Sciences, 2017 , 27(2) : 223 -239 . DOI: 10.1007/s11442-017-1373-9
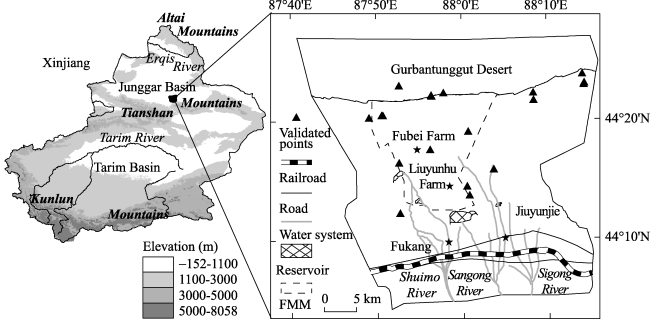
Figure 1 Location of the Sangong River Basin on the northern slope of the Tianshan Mountains |
Table 1 Remote sensing images used in the study |
| Year | Data type | Image acquisition date | Resolution or scale |
|---|---|---|---|
| 1958 | Black-and-white aerial photographs | 1958 | 1:35,000 |
| 1968 | Black-and-white aerial photographs | 1968 | 1:35,000 |
| 1978 | Black-and-white aerial photographs | August 1978 | 1:35,000 |
| 1987 | Color-infrared aerial photograph | June 1987 | 1:70,000 |
| 1998 | Landsat TM imagery | August 1998 | 30 m |
| 2004 | SPOT5 imagery | June 2004 | 10 m |
| 2014 | Landsat OLI imagery | August 2014 | 15 m |
Table 2 Classification of land use and land cover (LULC) |
| Grade I | Grade II | Grade III (abbreviation) |
|---|---|---|
| Oasis | Agricultural land: includes irrigated lands, and other cultivated lands equipped with irrigation facilities Built-up area: includes cities (Fukang City and the South Junggar oil-based towns), land used for townships and settlements, and industrial and mining land (rural villages, industrial enterprises, mining areas, stone pits, and brickyard fields). Water: includes reservoirs and ponds. | |
| Desert | Soil-desert | Haloxylon ammodendron Bunge Community (HBC), Tamarix chinensis Lour Community (TLC), Reaumuria songarica (Pall.) Maxim Community (RMC), Tamarix chinensis Lour - Reaumuria songarica Maxim Community (TL-RMC), Grass (G) |
| Sandy-desert | Haloxylon ammodendron Bunge Community (HBC), Reaumuria songarica Maxim Community (RMC) | |
| Mountain | Mountain (only low mountains and hills existed in the study area) |
Table 3 Accuracy assessments of classifications of land use and land cover (LULC) in the oasis |
| Year | Method | Validation data | Overall accuracy (%) | Kappa coefficient |
|---|---|---|---|---|
| 1978 | Stratified random sampling | LULC in oasis (Luo et al., 2003; Luo et al., 2008) | 87.50 | 0.84 |
| 1987 | Stratified random sampling | LULC in oasis (Luo et al., 2003; Luo et al., 2008) | 90.00 | 0.88 |
| 1998 | Stratified random sampling | LULC in oasis (Luo et al., 2003; Luo et al., 2008) | 92.00 | 0.89 |
| 2004 | Random sampling | Google images with high-resolution and plant community distribution (Lv et al., 2007) | 90.67 | 0.89 |
| 2014 | Random sampling and field investigation | Google images with high-resolution survey data | 87.97 | 0.86 |
Table 4 Statistical models for the quantitative analysis of land use and cover change (LUCC) |
| Parameter | Meaning | Expression | |
|---|---|---|---|
| Individual land types | Net change (ΔU) | The areal change of a land type over a period | △U=(Ub-Ua)/Ua╳100% |
| Relative change (ΔS) | Sum of the loss and gain (i.e., the overall change) of a land type over a period | △S=(△Ua-△Ub)/Ua╳100% | |
| Status and trend (Ps) | Describes the strength of a contraction or expansion in a land type, and describes whether or not a particular LULC type is in a stable state | \(P_S=\frac{\Delta U_{in}-\Delta U_{out}}{\Delta U_{in}+\Delta U_{out}}\)-1≤PS≤1 and △Uin+△Uout≠0 | |
| Whole area | Total status and trend (Pt) | Describes the state of LUCC in the whole study area | \(P_t=\frac{\sum^n_{i-1}|\Delta U_{in}-\Delta U_{out}|}{\sum^n_{i-1}\Delta U_{in}+\Delta U_{out}},\)0≤Pt≤1 |
Notes: Ua represents the area of a LULC type at the beginning of a period; Ub represents the area of a land type at the end of a period; ΔUout (≥0) represents the area of a land type lost or converted to other land types over a period; ΔUin (≥0) denotes the total area gained by or converted from other land types. Ps (> 0) reflects the expansion of a land type, Ps (< 0) reflects the contraction of a land type, and Ps (= 0) indicates that losses and gains for a land type are balanced. Pt is the total status and trend of the whole area. To better determine the influence of LUCC on Pt, it can be divided into four levels: (1) Balanced status (0-0.25), where there is equality between the losses and gains of a particular land type in a given area; (2) Quasi-balanced status (0.25-0.50), where there is a slight inequality between losses and gains; (3) Unbalanced status (0.50-0.75), where there is a significant difference between losses and gains; (4) Extremely unbalanced status (0.75-1), which indicates an extremely significant difference between the losses and the gains. |
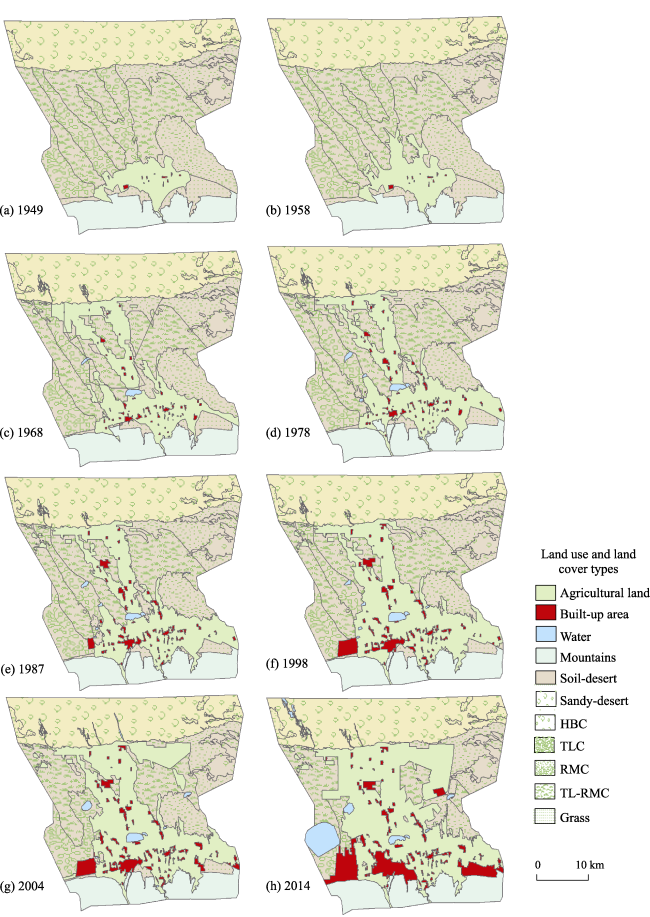
Figure 2 The spatial patterns of land-use and land-cover (LULC) in the Sangong River Basin from 1949 to 2014. (HBC, TLC, RMC, and TL-RMC are abbreviations of Haloxylon ammodendron Bunge Community, Tamarix chinensis Lour Community, Reaumuria songarica Maxim Community, and Tamarix chinensis Lour-Reaumuria songarica Maxim Community, respectively.) |
Figure 3 Maps showing the land-use and land-cover change (LUCC) in the Sangong River Basin in the period 1958-2014 |
Table 5 The areal structure of land-use and land-cover (LULC) in the Sangong River Basin in the period 1958-2014 |
| Year | Parameter | Oasis | Desert | |||||
|---|---|---|---|---|---|---|---|---|
| Water | Agricultural land | Built-up area | Total | Sandy-desert | Soil-desert | Total | ||
| 1958 | Area (km2) | 0.00 | 127.50 | 1.73 | 129.23 | 380.46 | 828.56 | 1209.02 |
| Proportion of Grade I land | 0.00 | 0.99 | 0.01 | 1 | 0.31 | 0.69 | 1 | |
| Proportion of study area | 0.00 | 0.08 | 0.00 | 0.09 | 0.25 | 0.55 | 0.80 | |
| 1968 | Area (km2) | 4.49 | 273.89 | 10.42 | 288.81 | 376.08 | 672.67 | 1048.75 |
| Proportion of Grade I land | 0.02 | 0.95 | 0.04 | 1 | 0.36 | 0.64 | 1 | |
| Proportion of study area | 0.00 | 0.18 | 0.01 | 0.19 | 0.25 | 0.45 | 0.70 | |
| 1978 | Area (km2) | 7.09 | 298.43 | 15.64 | 321.16 | 374.81 | 646.11 | 1020.93 |
| Proportion of Grade I land | 0.02 | 0.93 | 0.05 | 1 | 0.37 | 0.63 | 1 | |
| Proportion of study area | 0.00 | 0.20 | 0.01 | 0.21 | 0.25 | 0.43 | 0.68 | |
| 1987 | Area (km2) | 6.45 | 305.81 | 26.07 | 338.34 | 374.11 | 635.07 | 1009.18 |
| Proportion of Grade I land | 0.02 | 0.90 | 0.08 | 1 | 0.37 | 0.63 | 1 | |
| Proportion of study area | 0.00 | 0.20 | 0.02 | 0.22 | 0.25 | 0.42 | 0.67 | |
| 1998 | Area (km2) | 8.11 | 356.69 | 43.45 | 408.25 | 373.54 | 565.83 | 939.37 |
| Proportion of Grade I land | 0.02 | 0.87 | 0.24 | 1 | 0.40 | 0.60 | 1 | |
| Proportion of study area | 0.01 | 0.24 | 0.03 | 0.27 | 0.25 | 0.38 | 0.62 | |
| 2004 | Area (km2) | 10.70 | 418.68 | 52.56 | 481.94 | 372.39 | 494.05 | 866.44 |
| Proportion of Grade I land | 0.02 | 0.87 | 0.11 | 1 | 0.43 | 0.57 | 1 | |
| Proportion of study area | 0.01 | 0.28 | 0.03 | 0.32 | 0.25 | 0.33 | 0.58 | |
| 2014 | Area (km2) | 42.95 | 500.97 | 100.94 | 644.86 | 370.68 | 333.14 | 703.82 |
| Proportion of Grade I land | 0.07 | 0.78 | 0.16 | 1 | 0.53 | 0.47 | 1 | |
| Proportion of study area | 0.03 | 0.33 | 0.07 | 0.43 | 0.25 | 0.22 | 0.47 | |
Table 6 Land-use and cover (LUCC) change in the oasis-desert system of the Sangong River Basin in the period 1958-2014 |
| Period | Parameter | Oasis | Desert | Whole area | |||||
|---|---|---|---|---|---|---|---|---|---|
| Agricultural land | Built-up area | Water | Total | Soil-desert | Sandy-desert | Total | |||
| 1958-1968 | ΔU (%) | 114.82 | 501.75 | - | 123.48 | -17.96 | -1.15 | -12.43 | |
| ΔS (%) | 134.44 | 501.75 | - | 24.62 | 1.15 | ||||
| Ps | 0.85 | 1 | 1 | -0.83 | -1 | ||||
| Pt | 0.86 | 0.84 | 0.85 | ||||||
| 1968-1978 | ΔU (%) | 8.96 | 50.13 | 57.9 | 11.20 | -3 | 0.19 | -1.81 | |
| ΔS (%) | 31.57 | 53.92 | 60.42 | 11.35 | 1.27 | ||||
| Ps | 0.28 | 0.93 | 0.96 | -0.21 | 0.15 | ||||
| Pt | 0.34 | 0.52 | 0.43 | ||||||
| 1978-1987 | ΔU (%) | 2.47 | 66.65 | -8.99 | 5.35 | -1.52 | 0.08 | -0.91 | |
| ΔS (%) | 9.43 | 76.01 | 13.12 | 12.53 | 1.65 | ||||
| Ps | 0.26 | 0.88 | -0.69 | -0.01 | 0.05 | ||||
| Pt | 0.45 | 0.45 | 0.45 | ||||||
| 1987-1998 | ΔU (%) | 16.64 | 66.67 | 0.45 | 20.66 | -11.19 | 0.11 | -6.86 | |
| ΔS (%) | 23.92 | 68.28 | 36.08 | 27.7 | 0.7 | ||||
| Ps | 0.7 | 0.98 | 0.71 | -0.37 | 0.16 | ||||
| Pt | 0.75 | 0.59 | 0.65 | ||||||
| 1998-2004 | ΔU (%) | 17.38 | 20.97 | 31.87 | 18.05 | -13.13 | -0.3 | -7.85 | |
| ΔS (%) | 25.82 | 22.49 | 54.65 | 36.35 | 0.99 | ||||
| Ps | 0.67 | 0.93 | 0.58 | -0.37 | -0.31 | ||||
| Pt | 0.69 | 0.83 | 0.78 | ||||||
| 2004-2014 | ΔU (%) | 19.65 | 92.03 | 301.54 | 33.80 | -29.53 | -0.85 | -16.76 | |
| ΔS (%) | 26.28 | 92.45 | 350.70 | 37.82 | 1.90 | ||||
| Ps | 0.75 | 1 | 0.86 | -0.8 | -0.45 | ||||
| Pt | 0.83 | 0.79 | 0.81 | ||||||
| 1958-2014 | ΔU (%) | 292.92 | 5728.99 | - | 399.00 | -57.39 | -1.91 | -39.14 | |
| ΔS (%) | 334.45 | 5728.99 | - | 71.44 | 1.99 | ||||
| Ps | 0.88 | 1 | 1 | -0.81 | -0.96 | ||||
| Pt | 0.91 | 0.84 | 0.88 | ||||||
Notes: ΔU: the net change; ΔS: the relative change; Ps: the status and trend of individual land types; Pt: and total status and trend of the whole area |
Table 7 Comparisons of land-use and cover change (LUCC) between the farm management mode (FMM) and the local mode (LM) in the oasis in the Sangong River Basin in the period of 1958-2014 |
| Period | Parameter | FMM | LM | ||||
|---|---|---|---|---|---|---|---|
| Agricultural land | Built-up area | Total | Agricultural land | Built-up area | Total | ||
| 1958-1968 | ΔU (%) | 945.49 | - | 9.48 | 42.32 | 376.33 | 0.46 |
| ΔS (%) | 950.01 | - | 63.27 | 376.34 | |||
| Ps | 1.00 | 1.00 | 0.67 | 1.00 | |||
| Pt | 1.00 | 0.70 | |||||
| 1968-1978 | ΔU (%) | -5.64 | 0.57 | -0.05 | 18.31 | 37.12 | 0.19 |
| ΔS (%) | 28.01 | 99.52 | 33.99 | 41.91 | |||
| Ps | -0.20 | 1.00 | 0.54 | 0.89 | |||
| Pt | 0.26 | 0.56 | |||||
| 1978-1987 | ΔU (%) | 0.35 | 0.33 | 0.00 | 3.56 | 70.69 | 0.03 |
| ΔS (%) | 6.80 | 56.87 | 10.80 | 83.35 | |||
| Ps | 0.05 | 0.99 | 0.33 | 0.85 | |||
| Pt | 0.30 | 0.49 | |||||
| 1987-1998 | ΔU (%) | 24.14 | 0.12 | 0.24 | 12.92 | 78.53 | 0.13 |
| ΔS (%) | 26.18 | 33.34 | 22.81 | 80.53 | |||
| Ps | 0.92 | 0.98 | 0.57 | 0.98 | |||
| Pt | 0.93 | 0.67 | |||||
| 1998-2004 | ΔU (%) | 28.64 | 0.13 | 0.29 | 11.25 | 23.32 | 0.12 |
| ΔS (%) | 33.67 | 11.96 | 21.55 | 25.23 | |||
| Ps | 0.85 | 1.00 | 0.52 | 0.92 | |||
| Pt | 0.85 | 0.58 | |||||
| 2004-2014 | ΔU (%) | 18.18 | 1.00 | 0.18 | 20.58 | 110.73 | 0.32 |
| ΔS (%) | 18.97 | 13.03 | 30.94 | 111.29 | |||
| Ps | 0.96 | 1.00 | 0.67 | 0.99 | |||
| Pt | 0.96 | 0.79 | |||||
| 1958-2014 | ΔU (%) | 1768.29 | - | 17.77 | 164.15 | 5072.49 | 2.00 |
| ΔS (%) | 1779.61 | 111.08 | 208.33 | 74.90 | |||
| Ps | 0.99 | 1.00 | 0.79 | 1.00 | |||
| Pt | 0.99 | 0.84 | |||||
Notes: ΔU: the net change; ΔS: the relative change; Ps: the status and trend of individual land types; Pt: total status and trend of the whole area |
Table 8 The land use and cover change (LUCC) in deserts in the Sangong River Basin in the period of 1958- 2014 |
| Year | Parameter | Soil-desert | Sandy-desert | Total | |||||||
|---|---|---|---|---|---|---|---|---|---|---|---|
| TL-RMC | RMC | TLC | HBC | G | Total | RMC | HBC | Total | |||
| 1958 | S | 324.07 | 221.24 | 193.78 | 36.85 | 52.62 | 828.56 | 22.62 | 357.84 | 380.46 | 1209.02 |
| Pct1 | 0.39 | 0.27 | 0.23 | 0.04 | 0.06 | 0.06 | 0.94 | ||||
| Pct2 | 0.27 | 0.18 | 0.16 | 0.03 | 0.04 | 0.69 | 0.02 | 0.30 | 0.31 | ||
| 1968 | S | 265.57 | 196.03 | 119.79 | 36.81 | 54.46 | 672.67 | 22.62 | 353.46 | 376.08 | 1048.75 |
| Pct1 | 0.39 | 0.29 | 0.18 | 0.05 | 0.08 | 0.06 | 0.94 | ||||
| Pct2 | 0.25 | 0.19 | 0.11 | 0.04 | 0.05 | 0.64 | 0.02 | 0.34 | 0.36 | ||
| 1978 | S | 264.22 | 170.18 | 129.21 | 36.76 | 45.75 | 646.11 | 21.69 | 353.13 | 374.81 | 1020.93 |
| Pct1 | 0.41 | 0.26 | 0.20 | 0.06 | 0.07 | 0.06 | 0.94 | ||||
| Pct2 | 0.26 | 0.17 | 0.13 | 0.04 | 0.04 | 0.63 | 0.02 | 0.35 | 0.37 | ||
| 1987 | S | 259.37 | 174.21 | 115.62 | 36.23 | 49.64 | 635.07 | 21.60 | 352.51 | 374.11 | 1009.18 |
| Pct1 | 0.41 | 0.27 | 0.18 | 0.06 | 0.08 | 0.06 | 0.94 | ||||
| Pct2 | 0.26 | 0.17 | 0.11 | 0.04 | 0.05 | 0.63 | 0.02 | 0.35 | 0.37 | ||
| 1998 | S | 247.26 | 157.62 | 103.07 | 36.02 | 21.86 | 565.83 | 21.34 | 352.20 | 373.54 | 939.37 |
| Pct1 | 0.44 | 0.28 | 0.18 | 0.06 | 0.04 | 0.06 | 0.94 | ||||
| Pct2 | 0.26 | 0.17 | 0.11 | 0.04 | 0.02 | 0.60 | 0.02 | 0.37 | 0.40 | ||
| 2004 | S | 203.86 | 135.09 | 97.07 | 35.05 | 22.97 | 494.05 | 20.60 | 351.79 | 372.39 | 866.44 |
| Pct1 | 0.41 | 0.27 | 0.20 | 0.07 | 0.05 | 0.06 | 0.94 | ||||
| Pct2 | 0.24 | 0.16 | 0.11 | 0.04 | 0.03 | 0.57 | 0.02 | 0.41 | 0.43 | ||
| 2014 | S | 132.01 | 120.57 | 39.31 | 35.05 | 6.20 | 333.14 | 20.12 | 350.56 | 370.68 | 703.82 |
| Pct1 | 0.40 | 0.36 | 0.12 | 0.11 | 0.02 | 0.05 | 0.05 | ||||
| Pct2 | 0.19 | 0.17 | 0.06 | 0.05 | 0.01 | 0.47 | 0.03 | 0.50 | 0.53 | ||
Notes: S: area (km2); Pct1: proportion of Grade II land; Pct2: proportion of desert land. (HBC, TCL, RMC, TL-RMC, and G are abbreviations of Haloxylon ammodendron Bunge Community, Tamarix chinensis Lour Community, Reaumuria songarica Maxim Community, Tamarix chinensis Lour - Reaumuria songarica Maxim Community, and Grass, respectively.) |
The authors have declared that no competing interests exist.
| [1] |
|
| [2] |
|
| [3] |
|
| [4] |
|
| [5] |
|
| [6] |
|
| [7] |
|
| [8] |
|
| [9] |
|
| [10] |
|
| [11] |
|
| [12] |
|
| [13] |
|
| [14] |
|
| [15] |
|
| [16] |
|
| [17] |
|
| [18] |
|
| [19] |
|
| [20] |
|
| [21] |
|
| [22] |
|
| [23] |
|
| [24] |
|
| [25] |
|
| [26] |
Ministry of Land and Resources of the People’s Republic of China (MLR, PRC). GB/T21010-2007 Classification of Land Use Status.(in Chinese)
|
| [27] |
|
| [28] |
|
| [29] |
|
| [30] |
|
| [31] |
|
| [32] |
|
| [33] |
|
| [34] |
|
| [35] |
|
| [36] |
|
| [37] |
|
| [38] |
|
| [39] |
|
| [40] |
|
| [41] |
|
| [42] |
|
/
| 〈 |
|
〉 |
