
Journal of Geographical Sciences >
Effects of an ecological conservation and restoration project in the Three-River Source Region, China
Author: Shao Quanqin (1962-), Professor, E-mail: shaoqq@igsnrr.ac.cn
*Corresponding author: Huang Lin (1981-), PhD and Associate Professor, E-mail: huanglin@igsnrr.ac.cn
Received date: 2016-03-03
Accepted date: 2016-06-03
Online published: 2017-04-10
Supported by
National Nature Sciences Foundation of China, No.41571504
National Key Technology Research and Development Program, No.2013BAC03B00
Copyright
The first-stage of an ecological conservation and restoration project in the Three-River Source Region (TRSR), China, has been in progress for eight years. However, because the ecological effects of this project remain unknown, decision making for future project implementation is hindered. Thus, in this study, we developed an index system to evaluate the effects of the ecological restoration project, by integrating field observations, remote sensing, and process-based models. Effects were assessed using trend analyses of ecosystem structures and services. Results showed positive trends in the TRSR since the beginning of the project, but not yet a return to the optima of the 1970s. Specifically, while continued degradation in grassland has been initially contained, results are still far from the desired objective, ‘grassland coverage increasing by an average of 20%-40%’. In contrast, wetlands and water bodies have generally been restored, while the water conservation and water supply capacity of watersheds have increased. Indeed, the volume of water conservation achieved in the project meets the objective of a 1.32 billion m3 increase. The effects of ecological restoration inside project regions was more significant than outside, and, in addition to climate change projects, we concluded that the implementation of ecological conservation and restoration projects has substantially contributed to vegetation restoration. Nevertheless, the degradation of grasslands has not been fundamentally reversed, and to date the project has not prevented increasing soil erosion. In sum, the effects and challenges of this first-stage project highlight the necessity of continuous and long-term ecosystem conservation efforts in this region.
SHAO Quanqin , CAO Wei , FAN Jiangwen , Lin Huang , XU Xinliang . Effects of an ecological conservation and restoration project in the Three-River Source Region, China[J]. Journal of Geographical Sciences, 2017 , 27(2) : 183 -204 . DOI: 10.1007/s11442-017-1371-y
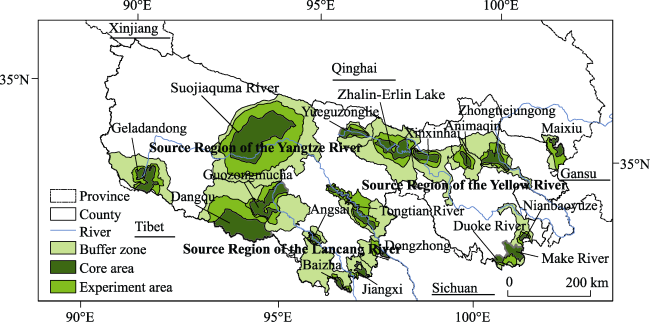
Figure 1 Distribution map of nature reserves in the TRSR, Qinghai Province, China |
Table 1 Index series used for assessment of the ecological effect of the TRSR ecological projection and restoration project |
| Category of index | Evaluation index | |
|---|---|---|
| First class indexes | Second class indexes | |
| Ecosystem macrostructure | Ecosystem macrostructure | Ecosystem classification area, rate of change, dynamic degree |
| Ecosystem macroscopic structural change index | ||
| Ecosystem quality | Grassland degradation and recovery | Grassland degradation and recovery classification area, proportion of degraded grassland and recovered grassland, grassland degradation change index |
| Vegetation status | Vegetation biomass, vegetation coverage, net primary productivity (NPP), vegetation change condition index | |
| Macro-ecological situation | Land cover status index, land cover conversion index | |
| Plant species diversity | Species richness, species importance value, diversity index, evenness index | |
| Environmental quality | Surface water quality index, soil environmental quality index, air quality index | |
| Upper limit of permafrost depth | ||
| Ecosystem quality change index | ||
| Ecosystem services | Water regulation | River runoff in dry season, water regulation volumes, water regulation service retention, river runoff in summer flood season, runoff adjustment coefficient |
| Soil conservation | Sediment concentration, soil erosion, soil retention, soil conservation service | |
| Forage supply | Grassland yield, grassland theoretical stock-carrying capacity | |
| Water supply | River runoff, lake area, lake volume, glacier area, ground water resources | |
| Ecosystem services change index | ||
| Ecosystem change factors | Climate change | Temperature, precipitation, wet coefficient |
| Human activities | Ecological project, grazing pressure index | |
| Contributions influenced by ecological project and climate change | Ecosystem project changes influence index | |
| Contributions to NPP change, water regulation service, soil conservation service, sand fixing service influenced by ecological project | ||
| Contributions to NPP change, water regulation service, soil conservation service, sand fixing service influenced by climate change | ||
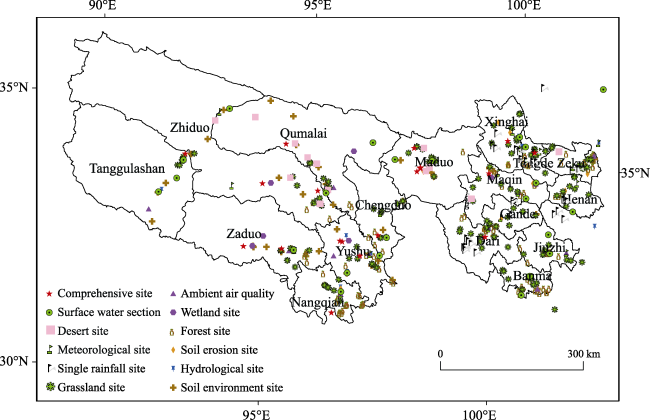
Figure 2 Distribution map of ecosystem field monitoring networks in the TRSR |
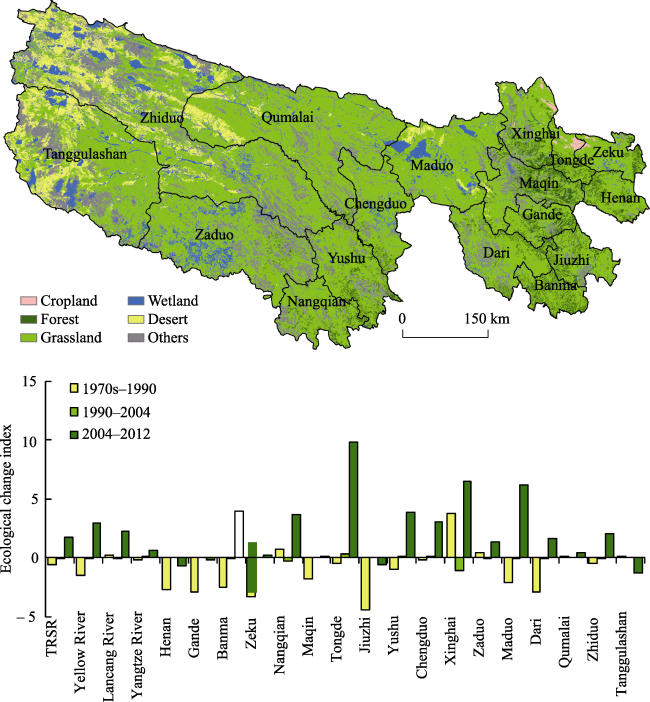
Figure 3 Distribution of ecosystem types in the TRSR in 2012, and the ecological change index from the 1970s to 2012 |
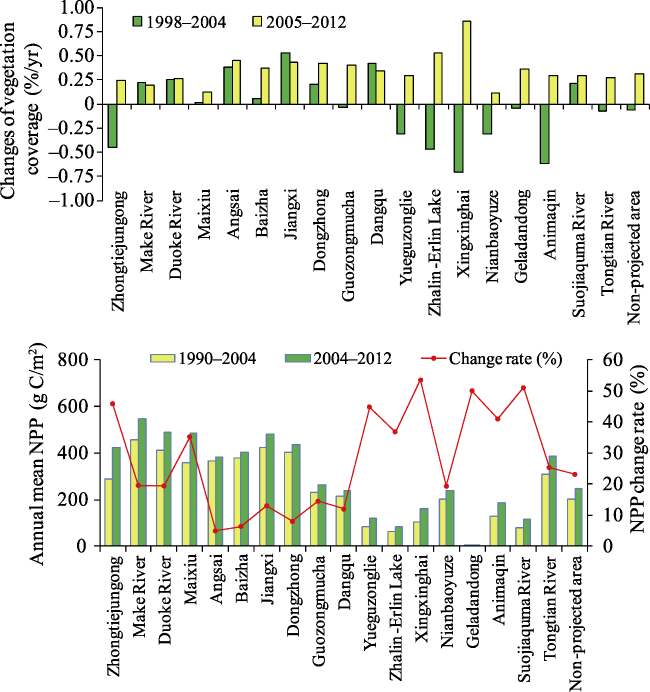
Figure 4 Changes in average vegetation cover before, and after, implementation of the TRSR project |
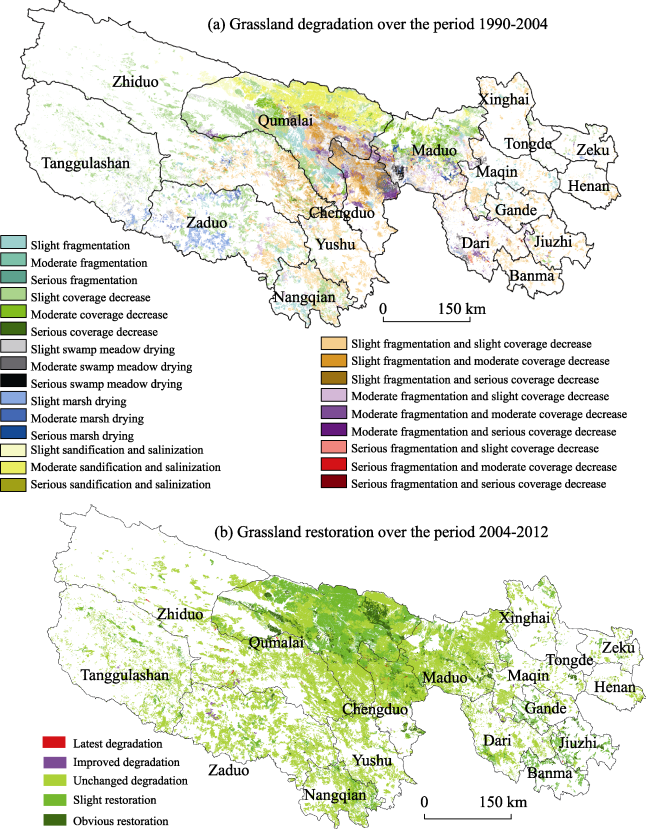
Figure 5 Distribution of degraded grassland in the TRSR over the period 1990-2004 (a), and grassland restoration over the period 2004-2012 (b) |
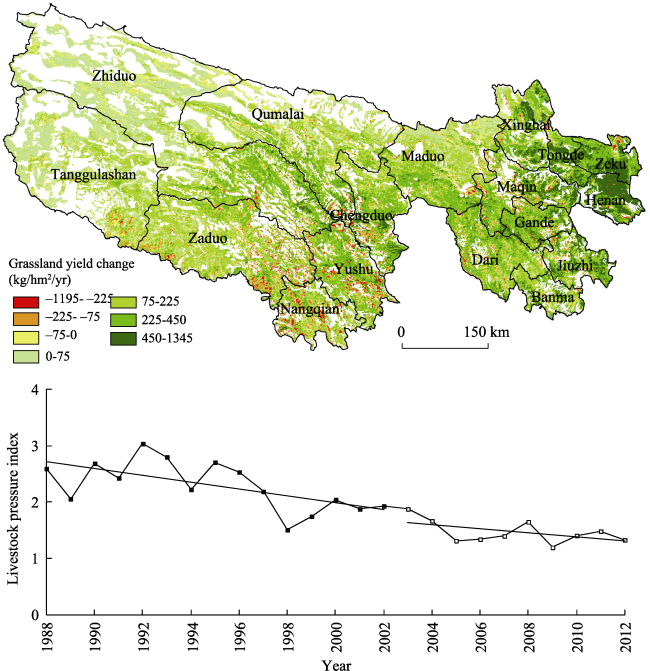
Figure 6 Comparative changes in grassland yield before, and after, implementation of this project, as well as annual variation in the livestock pressure index in the TRSR |
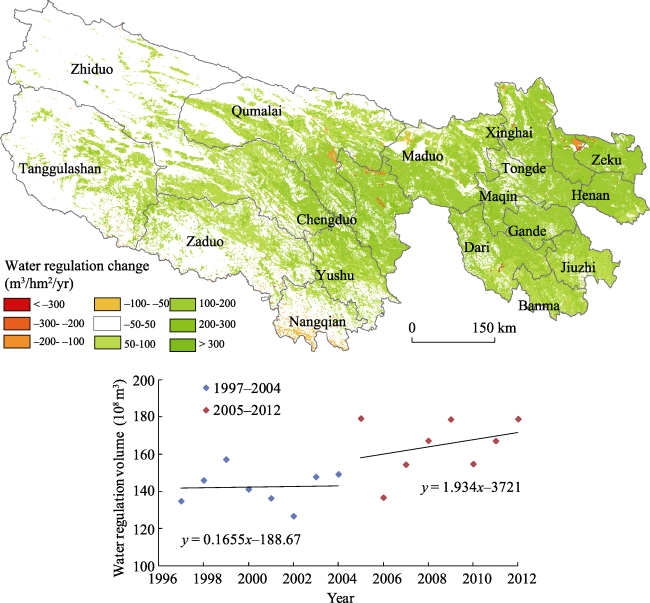
Figure 7 Changes and annual variation in water regulation volume of forested and grassland ecosystems in the period 1997-2012 |
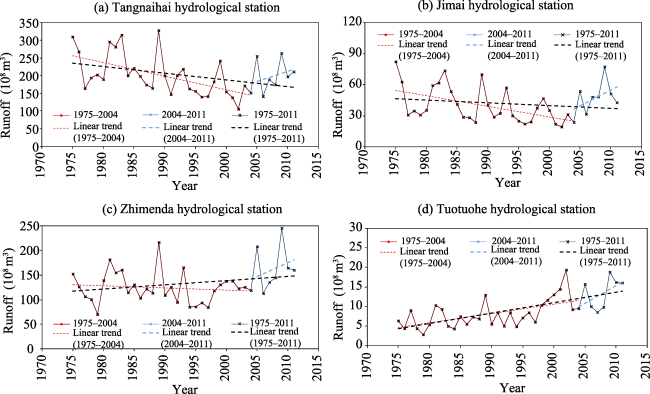
Figure 8 Annual total runoff at major hydrological stations in the source regions of the Yangtze and Yellow rivers |
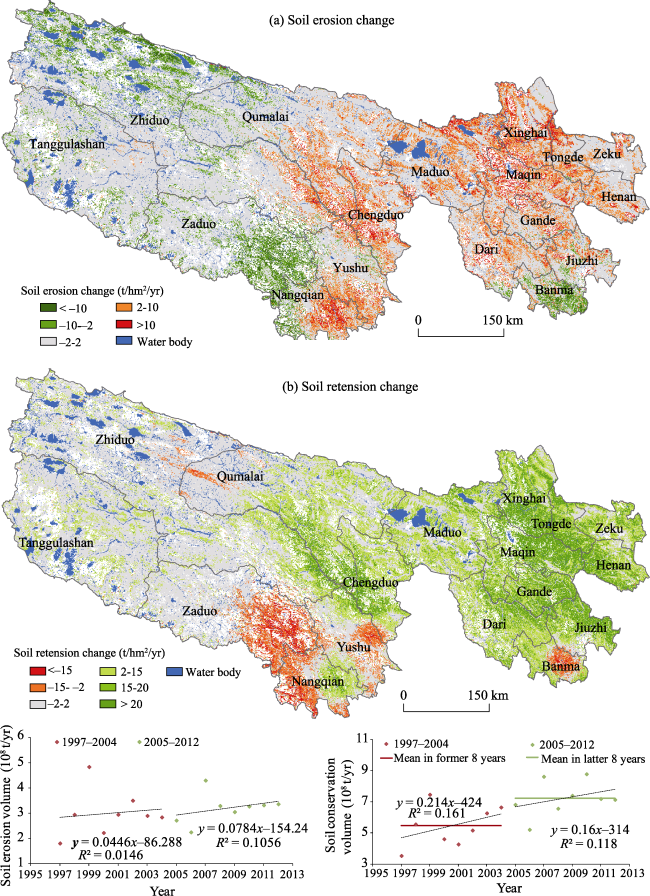
Figure 9 Changes, and annual variation, in soil erosion (a) and soil retention volume (b) in the period 1997-2012 |
Table 2 Changes in ecosystem area (km2) inside, and outside the nature reserves before and after project implementation |
| Period | Regions | Cropland | Forest | Grassland | Wetland | Desert | Others |
|---|---|---|---|---|---|---|---|
| 1990-2004 (before the project) | Nature reserves | -3.22 | -12.8 | -362.4 | -10.8 | +387.6 | +1.6 |
| Outside nature reserves | +1.32 | -0.7 | -83.4 | -14.7 | +43.8 | +53.6 | |
| 2004-2012 (after the project) | Nature reserves | Unchanged | +12.1 | +135.2 | +104.9 | -192.1 | -60.1 |
| Outside nature reserves | +7.84 | +3.3 | -11.4 | +181.1 | -300.5 | +119.7 | |
| Comparison after and before the project | Nature reserves | Reduced at first then unchanged | Reduced at first then increased | Reduced at first then increased | Reduced at first then increased | Increased at first then reduced | Increased at first then reduced |
| Outside nature reserves | Continuously increased | Reduced first then increased | Continuously reduced | Reduced at first then increased | Increased at first then reduced | Continuously increased | |
| Comparison of inside and outside | Inside is better than outside | Inside is better than outside | Inside is better than outside | Inside is better than outside | Inside is better than outside | Inside is better than outside |
Note: ‘-’ indicates decrease, ‘+’ indicates increase; ‘inside’ indicates the reserve, ‘outside’ indicates outside the reserve. |
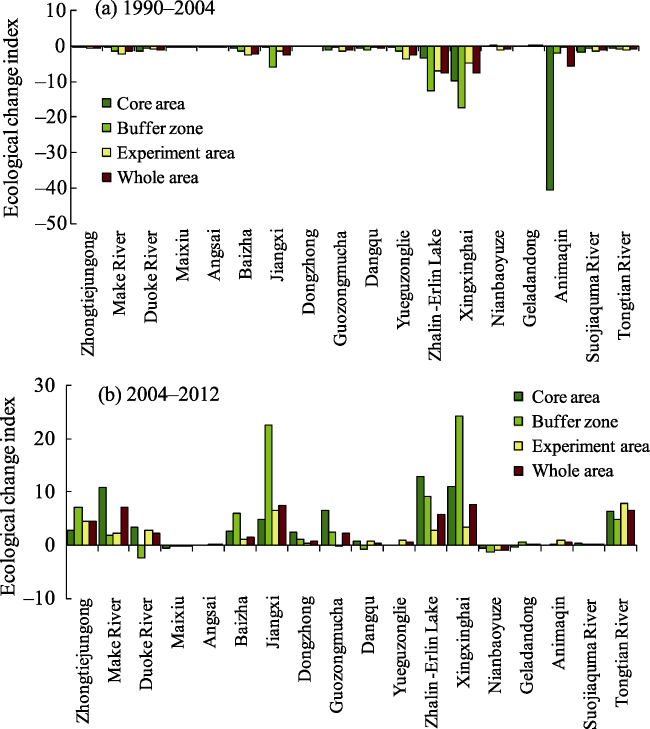
Figure 10 Ecological change indexes for nature reserves from 1990 to 2004 (a) and from 2004 to 2012 (b) |
Table 3 Restoration areas of grassland, 2004-2012 |
| Region | Degraded grassland, 1990-2004 | Obviously improved grassland, 2005-2012 | ||
|---|---|---|---|---|
| Area (km2) | Proportion of degraded grassland in entire area (%) | Area (km2) | Proportion of degraded grassland in each area (%) | |
| Nature reserves | 43490.67 | 49.4 | 3173.00 | 7.30 |
| Outside nature reserves | 44591.40 | 50.6 | 2252.81 | 5.05 |
| The TRSR | 88082.07 | 100 | 5425.81 | 6.16 |
Table 4 Comparisons of vegetation coverage and NPP inside, and outside, nature reserves before, and after, project implementation |
| Period | Region | Vegetation coverage (%) | NPP (g C/m2) |
|---|---|---|---|
| 1997-2004 | Nature reserves | 47.15 | 246.86 |
| Outside nature reserves | 41.58 | 200.84 | |
| Difference between inside and outside | 5.57 | 46.02 | |
| 2005-2012 | Nature reserves | 50.34 | 306.23 |
| Outside nature reserves | 44.15 | 247.37 | |
| Difference between inside and outside | 6.19 | 58.86 | |
| Difference between former and latter periods | Nature reserves | 3.19 | 59.37 |
| Outside nature reserves | 2.57 | 46.53 | |
| Difference between inside and outside | 0.62 | 12.84 |
Figure 11 Changes in vegetation coverage and NPP in nature reserves before, and after, project implementation |
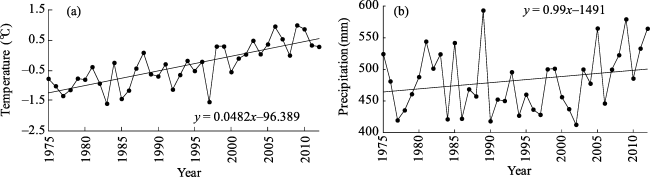
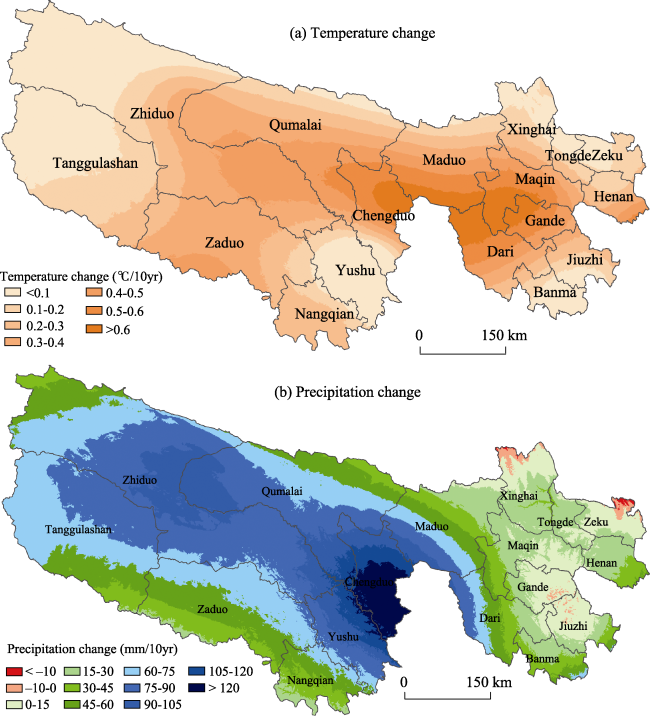
Figure 12 Variations in annual average temperature and annual precipitation in the TRSR, 1975-2012 |
Figure 13 Variations in annual average temperature and annual precipitation in the TRSR, 2004-2012 |
Table 5 Evaluation indexes for 1997-2004 and 2005-2012 under real, and average, climate conditions |
| Evaluation index | Difference between 1997-2004 and 2005-2012 | Contribution rate of ecological project | Contribution rate of climate change | |
|---|---|---|---|---|
| Real climate conditions | Average climate conditions | |||
| NPP (g C/m2/yr) | 21.79 | 13.49 | 61.9% | 38.1% |
| Water conservation (108 m3/yr) | 22.22 | 5.34 | 24% | 76% |
| Soil water erosion (t/yr) | 2000 | -1600 | -80% | 180% |
Table 6 Variations in annual runoff at the major control hydrological stations in the Yangtze and Yellow river basins (108 m3) |
| Period | Yellow River Basin | Yangtze River Basin | ||
|---|---|---|---|---|
| Tangnahai station | Jimai station | Zhimenda station | Tuotuohe station (data from May to October) | |
| 1975-1980 | 221.21 | 46.26 | 115.85 | 4.85 |
| 1975-1990 | 236.10 | 47.90 | 131.37 | 6.14 |
| 1975-2004 | 200.65 | 39.87 | 124.29 | 7.52 |
| 1975-2011 | 201.40 | 41.90 | 132.40 | 9.10 |
| 1991-2004 | 165.20 | 31.26 | 116.20 | 9.11 |
| 1997-2004 | 161.00 | 30.20 | 122.10 | 11.70 |
| 2004-2011 | 197.90 | 47.30 | 161.30 | 13.10 |
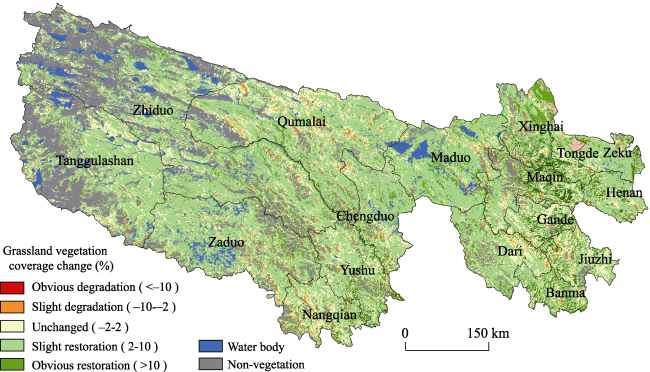
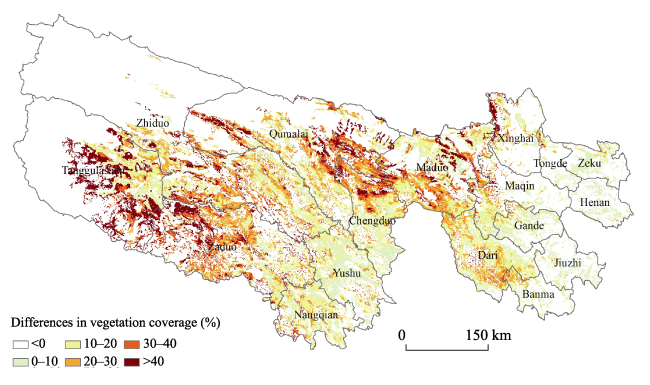
Figure 14 Differences in grassland vegetation coverage in the TRSR from 2005 to 2012 compared with the 1980s |
The authors have declared that no competing interests exist.
| [1] |
|
| [2] |
|
| [3] |
|
| [4] |
|
| [5] |
|
| [6] |
China National Environmental Monitoring Centre (CNEMC), 2004. Study on Ecological Environmental Quality Assessment China. Beijing: China Environmental Science Press. (in Chinese)
|
| [7] |
|
| [8] |
|
| [9] |
|
| [10] |
|
| [11] |
|
| [12] |
|
| [13] |
|
| [14] |
|
| [15] |
|
| [16] |
|
| [17] |
|
| [18] |
|
| [19] |
Local Standard of Qinghai Province (LSQP), 2014. Technical Specification of Ecological Effects Assessment of Ecosystem Protection and Recovery Projects in Sanjiangyuan Region (DB63/T1342-2015).
|
| [20] |
|
| [21] |
National Standards of the People’s Republic of China, 2009. Evaluation in Project for the Construction of Conversion of Cropland to Forest (GB/T23233-2009). Beijing: Standards Press of China. (in Chinese)
|
| [22] |
|
| [23] |
|
| [24] |
|
| [25] |
|
| [26] |
|
| [27] |
|
| [28] |
The Environmental Protection Industry Standard of People’s Republic of China (
|
| [29] |
The People’s Government of Qinghai Province (PGQP), 2005. The General Planning on Ecological Protection and Construction in the TRSR Nature Reserve, Qinghai Province. (in Chinese)
|
| [30] |
The H. John Heinz III Center for Science, Economics and
|
| [31] |
|
| [32] |
|
| [33] |
|
| [34] |
|
| [35] |
|
| [36] |
|
| [37] |
|
| [38] |
|
| [39] |
|
/
| 〈 |
|
〉 |