Research Articles

A systematic review of research studies on the estimation of net primary productivity in the Three-River Headwater Region, China

  • SUN Qingling , 1, 2 ,
  • LI Baolin , 1, 2, 3 ,
  • ZHOU Chenghu 1, 2, 3 ,
  • LI Fei 4 ,
  • ZHANG Zhijun 4 ,
  • DING Lingling 4 ,
  • ZHANG Tao 1, 2 ,
  • XU Lili 1, 2
Expand
  • 1. State Key Laboratory of Resources and Environmental Information System, Institute of Geographic Sciences and Natural Resources Research, CAS, Beijing 100101, China
  • 2. University of Chinese Academy of Sciences, Beijing 100049, China
  • 3. Jiangsu Center for Collaborative Innovation in Geographical Information Resource Development and Application, Nanjing 210023, China
  • 4. Remote Sensing Monitoring Center of Qinghai Ecology and Environment, Xining 810007, China

Author: Sun Qingling (1991-), PhD Candidate, specialized in ecological modelling. E-mail:

*Corresponding author: Li Baolin (1970-), PhD and Professor, specialized in environmental remote sensing and regional ecological modelling. E-mail:

Received date: 2016-06-24

  Accepted date: 2016-07-26

  Online published: 2017-04-10

Supported by

National Key Research and Development Program of China, No.2016YFC0500205

National Basic Research Program of China (973 Program), No.2015CB954103, No.2015CB954101

Copyright

Journal of Geographical Sciences, All Rights Reserved

Abstract

The Three-River Headwater Region (TRHR), known as the “Water Tower of China”, is an important ecological shelter for national security interests and regional sustainable development activities for many downstream regions in China and a number of Southeast Asian countries. The TRHR is a high-elevation, cold environment with a unique, but typical alpine vegetation system. Net primary productivity (NPP) is a key vegetation parameter and ecological indicator that can reflect both natural environmental changes and carbon budget levels. Given the unique geographical environment and strategic location of the TRHR, many scholars have estimated NPP of the TRHR by using different methods; however, these estimates vary greatly for a number of reasons. To date, there is no paper that has reviewed and assessed NPP estimation studies conducted in the TRHR. Therefore, in this paper, we (1) summarized the related methods and results of NPP estimation in the TRHR in a systematic review of previous research; (2) discussed the suitability of existing methods for estimating NPP in the TRHR and highlighted the most significant challenges; and (3) assessed the estimated NPP results. Finally, developmental directions of NPP estimation in the TRHR were prospected.

Cite this article

SUN Qingling , LI Baolin , ZHOU Chenghu , LI Fei , ZHANG Zhijun , DING Lingling , ZHANG Tao , XU Lili . A systematic review of research studies on the estimation of net primary productivity in the Three-River Headwater Region, China[J]. Journal of Geographical Sciences, 2017 , 27(2) : 161 -182 . DOI: 10.1007/s11442-017-1370-z

1 Introduction

Vegetation productivity is the basis of energy flow and material circulation in ecosystems (Running, 2012). Researchers from different disciplines have proposed a variety of concepts to describe vegetation productivity. In traditional biomass surveys, accumulation of vegetation production or change in biomass over a specific period is usually used to represent productivity (Lieth, 1973). With the increase in large-scale productivity studies and progress in understanding plant ecophysiological processes, gross primary productivity (GPP) and net primary productivity (NPP) were proposed to represent vegetation productivity (Lieth and Whittaker, 1975; Liu et al., 1997; Zhou and Wang, 2003). Defined as the carbon (or dry matter) fixed by green plants per unit time and space, NPP is closely related to the carbon sink of ecosystems. NPP is also a quantitative measure of the earth’s ability to support life and the ecosystems’ ability to maintain sustainable development. Therefore, NPP has received extensive attention and has become one of the foci of various international research programs (Zhang, 1992; Zhou and Zhang, 1995; Fang et al., 2000).
The Three-River Headwater Region (TRHR), known as the “Water Tower of China”, is the source of the Yangtze, Yellow, and Lancang rivers. Geographically, the TRHR is located in the south of Qinghai Province, ranging from 31°39′-36°16′ N and 89°24′-102°23′ E. The administrative scope of TRHR includes 16 counties in four Tibetan autonomous prefectures (Yushu, Guoluo, Hainan, and Huangnan), as well as the Tanggula town in Golmud City, with an area of approximately 36.3×10⁴ km2 (Figure 1). The TRHR is an important ecological shelter for national security interests and regional sustainable development activities for many downstream regions in China and a number of Southeast Asian countries. However, it is also one of the most vulnerable and sensitive terrestrial ecosystems in China (Qin, 2014). As the hinterland and main body of the world’s “Third Pole”, the TRHR has an average altitude above 4000 m. It has a unique, yet typical alpine vegetation system, and plays an important role in the studies of global change and vegetation’s responses to the change (Liu et al., 2013).
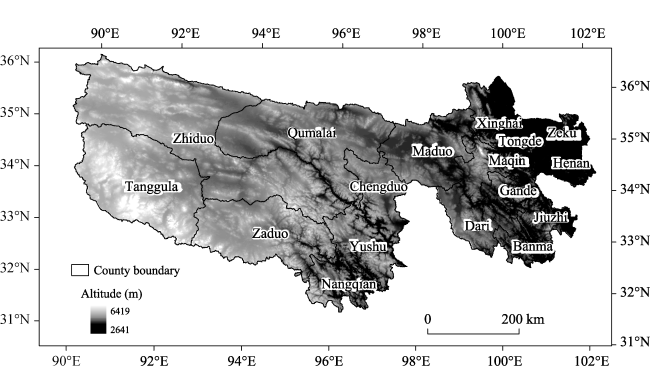
Figure 1 Geographical location and scope of the TRHR
In the past few decades, ecosystems in the TRHR have experienced significant degeneration characterized by grassland degradation, desertification, and an overall reduction in agriculture and animal husbandry production (Li et al., 2004; Tang et al., 2006; Shao et al., 2010). In 2000, Qinghai Province established a provincial nature reserve in the TRHR that has been a national nature reserve since 2003. In 2005, the State Council of China invested 7.5 billion yuan to launch several ecological protection and construction projects in the TRHR, including degraded grassland restoration, local wetland protection, livestock reduction, and management of “black soil beach” (Shao and Fan, 2012). In this context, a comprehensive understanding of the patterns, variation trends, and impact factors of vegetation productivity is pivotal to the policy-making for ecological protection and assessment of ecological engineering in the TRHR.
Although many scholars have applied different methods to estimate NPP in the TRHR, which has effectively promoted research into vegetation productivity and regional carbon accounting, NPP estimation still has many uncertainties and the results vary widely for a variety of reasons. Therefore, based on previous studies, we aimed to systematically summarize the estimation methods and results of NPP in the TRHR. By analyzing these methods, we discuss their suitability and highlight their main challenges when applied to the TRHR. This review also provides an assessment of the existing NPP estimation results. Finally, future developmental directions of NPP estimation in the TRHR are proposed.

2 Estimation methods

Since the late 20th century, many scholars have estimated NPP in the TRHR. The methods they used can be broadly divided into two categories: field measurements and model simulations.

2.1 Field measurements

Field surveys of NPP usually start by measuring plant biomass (Fan, 2003), which includes both aboveground and underground parts of plants. Aboveground NPP is approximately equal to the maximum standing aboveground biomass during one year for deciduous grasses and crops (Luo et al., 2004; Xu, 2010). For evergreen grasses and shrubs, the aboveground biomass needs to be combined with plant longevity to obtain the aboveground NPP. For trees, the aboveground biomass is usually first measured through average sample tree determination or allometry relationships with the observed data, and then the aboveground NPP is further estimated based on the age or growth rate of trees (Zhou and Wang, 2003).
Underground biomass measurements involve full digging, sampling, and ingrowth coring methods. There are three primary methods for estimating underground NPP based on the measurement of underground biomass. The first method directly measures the changes in live root biomass and the losses from decay and animal grazing. While in theory this method provides the closest estimate to the true NPP, taking actual measurements has proven quite difficult (Zhou, 2001). The second method for estimating underground NPP is calculating the difference between the maximum and minimum root biomass during the study period. This method is relatively simple, but it requires multiple measurements of the root biomass (Zhou, 2001). The third strategy, using both underground root biomass and root turnover fraction to estimate underground NPP, is the most commonly used method (Gill et al., 2002; Zhao, 2009). Besides, with the development of computer technology and image-processing techniques, the minirhizotron is also applied to measure underground NPP. However, this application is currently limited by the relatively high costs and technical requirements for researchers to conduct the measurements.

2.2 Model simulations

NPP models are generally divided into three categories: (1) statistical models (also known as climate-related models), (2) parametric models (also known as light use efficiency (LUE) models), and (3) process models (also known as mechanistic models) (Ruimy et al., 1994; Cramer and Field, 1999; Cramer et al., 1999).
However, with the development of NPP modeling, we believe that this classification may no longer fully and unambiguously summarize the existing NPP models. For example, some statistical models were not based on climate data, but rather utilized remote sensing (RS) vegetation index. Some parametric models were not based on LUE, but referred to climate data instead. RS-process coupled models, which have been widely used, should also be considered and included in the classification. Therefore, NPP models are divided into four categories in this study, according to the primary data used and whether they consider ecophysiological mechanisms: (1) climate models, (2) remote sensing models, (3) process models, and (4) RS-process coupled models.
2.2.1 Climate models
Climate models are driven only by climatic data. As such, simulated NPP using this type of model only reflects potential vegetation productivity (or climatic productivity). According to the existing studies of the TRHR, climate models can be further subdivided into climate-related models, production potential models, and the classification indices model (CIM).
Climate-related models estimate NPP through empirical regression between NPP and climate data, including temperature and precipitation. Guo et al. (2013) and Li and Zhang (2014) used the Thornthwaite Memorial model to estimate climatic productivity of the TRHR. Guo et al. (2008) used both the Miami and Thornthwaite Memorial models to estimate grassland NPP of Xinghai County in the TRHR.
Production potential models usually reflect combined influences of light, temperature, and water conditions on vegetation productivity. In general, photosynthetic potential productivity is first calculated using solar radiation data. Then, temperature data is applied to revise the photosynthetic potential productivity to obtain the light-temperature potential productivity, which is further revised using precipitation and other climatic data to acquire the climate productivity. For example, Li (2010) used solar radiation, temperature, precipitation, and annual climate change, as well as disaster related data, to obtain the climate productivity of natural grasslands in the TRHR.
The CIM estimates NPP based on the integrated orderly classification system of grassland (IOCSG). The moisture index (K) and ≥0°C annual average cumulative temperature (∑θ) are two primary model parameters used in the CIM. NPP is acquired from the specific position of the grassland in the IOCSG, which is determined by the two parameters (Lin, 2009). Wang (2013) applied the CIM model to estimate alpine grassland NPP in the TRHR, and concluded that the CIM was more accurate than the climate-related models.
2.2.2 Remote sensing models
Remote sensing models can be divided into statistical models and parametric models according to the calculation methods they use. RS statistical models estimate vegetation productivity based on a variety of vegetation indices. The most commonly used vegetation indices are the normalized difference vegetation index (NDVI) and the enhanced vegetation index (EVI) (Ma, 2008; Chen et al., 2011; Han, 2015). Studies have shown that NDVI was more suitable for alpine meadow, whereas EVI might be more suitable for alpine steppe (Du et al., 2011).
RS parametric models combine LUE, photosynthetically active radiation (PAR), and fraction of absorbed photosynthetically active radiation (fAPAR) to estimate NPP (Monteith, 1972; Kumar and Monteith, 1981). This type of model is based on the resource balance theory, which indicates that any resource limiting plant growth can be utilized to estimate NPP through conversion factors. RS parametric models utilize PAR, an important limiting resource in photosynthesis, and the concept of LUE to convert absorbed PAR to NPP. RS parametric models, which include CASA (Wu et al., 2011a; Cai et al., 2013; Zhang et al., 2014; Chen, 2015) and GLO-PEM (Xiao et al., 2009; Fan et al., 2010a; Shao and Fan, 2012), are broadly applied in the TRHR.
2.2.3 Process models
Process models differ substantially from the two types of models described above. As the name implies, a process model simulates plant physiological and ecological processes simultaneously with influencing factors and feedback mechanisms. Process models usually consider the soil-plant-atmosphere continuum as an entire system, and often include photosynthesis, respiration, evaporation, transpiration, and stomatal conductance modules. At present, specific applications of process models to estimate NPP in the TRHR have not yet been reported. However, applications have been reported for the Qinghai-Tibet Plateau. Zhou et al. (2004), Zhuang et al. (2010), and Yan et al. (2015) used different versions of TEM to simulate NPP on the Qinghai-Tibet Plateau. Zhang et al. (2007) applied CENTURY to estimate vegetation productivity and soil organic carbon on the Plateau. Ye (2010) and Qi et al. (2012) utilized Biome-BGC to simulate the temporal variation in NPP on the Qinghai-Tibet Plateau and the impacts of warming on carbon fluxes in an alpine meadow ecosystem, respectively. Concurrently, Piao et al. (2012) estimated NPP dynamics of the Qinghai-Tibetan grasslands over the past five decades based on ORCHIDEE. These studies are able to provide a reference for NPP estimation in the TRHR; however, specific quantities and detailed changes in NPP within the TRHR cannot be derived.
2.2.4 RS-process coupled models
RS-process coupled models incorporate the advantages of both process models and RS parametric models and have been gradually developed into an important means of estimating NPP (Feng et al., 2004, 2014). In general, there are two kinds of coupling methods. In the first method, simplified ecological processes are added to the RS parametric models to enhance the model mechanisms. In the second method, RS techniques are added to the existing process models to address the challenges of model parameterization, error evaluation, and scale transformation faced by most process models.
Wang et al. (2009) developed GLOPEM-CEVSA from a RS parametric model, GLO- PEM, and a process model, CEVSA, using the first coupling method, and then utilized GLOPEM-CEVSA to estimate the spatio-temporal distribution of NPP in the TRHR. Global MODIS NPP product is also calculated based on a RS-process coupled model (also known as MOD17A3 algorithm). Guo et al. (2006) and Zhang et al. (2015a) both used MODIS NPP to analyze the spatio-temporal patterns of vegetation productivity in the TRHR. A typical example of the second coupling method is the BEPS model (Liu et al., 1997). BEPS was originally built using the biological principles of the FOREST-BGC with some modifications. The model integrated RS land cover and leaf area index (LAI) to recognize physiological differences among vegetation types and to facilitate scale transformation from leaf level to the whole canopy. Additionally, the model included an advanced canopy radiation sub-model to quantify effects of canopy architecture on the distribution of radiation and photosynthesis in the canopy. Although BEPS model is yet to be applied to the TRHR, its reliability has already been verified in Northern Tibet (Zheng, 2006).

3 Estimated results

At the regional scale, previous studies usually estimated NPP pixel by pixel based on vegetation type, and provided mean NPP of the study area explicitly. Therefore, mean NPP estimates for the entire TRHR were systematically summarized and compared in this study. From Tables 1 and 2, it is evident that mean NPP differs substantially among various studies conducted in the TRHR. For all the vegetation, estimated mean NPP of the TRHR was approximately 258.99 ± 172.95 g C·m-2·yr-1, with the highest NPP of 570.35 g C·m-2·yr-1 estimated by Thornthwaite Memorial (Guo et al., 2013) and the lowest NPP of 143.17 g C·m-2·yr-1 estimated using GLOPEM-CEVSA (Wang et al., 2009). The highest NPP estimate was approximately four times the lowest NPP estimate. For the grassland, which is the most widely distributed vegetation type in the TRHR accounting for 68% of the total area, simulated mean NPP was approximately 202.65 ± 129.96 g C·m-2·yr-1. The highest grassland NPP estimate was 481.44 g C·m-2·yr-1 simulated by Li and Zhang (2014) using Thornthwaite Memorial, and the lowest grassland NPP estimate was 61.42 g C·m-2·yr-1 calculated by Wang (2013) using CASA. The former estimate was approximately 7.8 times higher than the latter.
Among different estimation models (Figure 2), climate models produced the highest mean NPP compared with other types of models. Estimated mean NPP of all the vegetation in the TRHR based on climate models was approximately 453.23 ± 252.30 g C·m-2·yr-1, and mean grassland NPP was approximately 283.28 ± 170.44 g C·m-2·yr-1. The second highest estimate was produced using RS models, which estimated mean NPP of all the vegetation in the TRHR to be 165.61 ± 69.42 g C·m-2·yr-1 and mean NPP of grassland to be 147.68 ± 98.08 g C·m-2·yr-1. RS-process coupled models produced the lowest NPP. Estimated mean NPP of all the vegetation was 143.17 ± 100.53 g C·m-2·yr-1, and mean NPP of grassland was 113.89 ± 65.57 g C·m-2·yr-1.
Table 1 Estimated mean NPP of the TRHR in different studies
Study
area
Vegetation
type
Method & Model Study
period
Mean NPP
(g C·m-2 ·yr-1)
Reference
TRHR Grassland Climate model
(Thornthwaite Memorial)
2002-2010 481.44 Li and Zhang, 2014
TRHR Grassland Climate model (Production potential model) 1971-2003 225.00 Li, 2010
TRHR Grassland Climate model (Miami) 2005-2006 211.92 Wang, 2013
TRHR Grassland Climate model (CIM) 2005-2006 214.75 Wang, 2013
TRHR Grassland Remote sensing model (CASA) 2005-2006 61.42 Wang, 2013
TRHR Grassland RS-process coupled model
(MOD17A3)
2005-2006 93.98 Wang, 2013
TRHR Grassland RS-process coupled model
(MOD17A3)
2000-2010 86.80 Zhang et al., 2015a
TRHR All the vegetation Climate model
(Thornthwaite Memorial)
1960-2011 570.35 Guo et al., 2013
TRHR All the vegetation Climate model (Miami) 2004-2008 486.90 Cai et al., 2013
TRHR All the vegetation Climate model
(Zhou Guangsheng)
2004-2008 302.45 Cai et al., 2013
TRHR All the vegetation Climate model (CASA) 2001-2010 169.02 Zhang et al., 2014
TRHR All the vegetation Climate model (CASA) 2004-2008 168.68 Cai et al., 2013
TRHR All the vegetation Remote sensing model (CASA) 2010 146.66 Wo et al., 2014
TRHR All the vegetation Remote sensing model (CASA) 2003, 2008,
2013
148.82 Chen, 2015
TRHR All the vegetation Remote sensing model (GLOPEM) 1988-2004 194.85 Shao and Fan, 2012
TRHR All the vegetation RS-process coupled model
(GLOPEM-CEVSA)
1988-2004 143.17 Wang et al., 2009
Table 2 Estimated mean NPP of different vegetation types in the TRHR
Vegetation
type
Mean NPP (g C·m-2 ·yr-1)
Shao and Fan, 2012 Cai et al., 2013 Wo et al., 2014 Wang et al., 2009 Guo et al., 2006
Grassland 218.74 / 162.87 160.90 /
Alpine steppe / 129.41 / / 79.34
Alpine meadow / 188.95 / / 89.38
Forest 405.20 / 279.81 267.90 /
Shrub 156.04 / / / /
Farmland 289.22 / 256.28 222.94 /
Desert 21.48 / 62.81 36.13 /
Marsh 127.09 / / 161.36 /
In general, NPP calculated from climate models was considered as the potential NPP, whereas NPP calculated from other models was considered as the actual NPP. Therefore, it was concluded from NPP estimates that the potential NPP of all the vegetation types in the TRHR was approximately 453.23 ± 252.30 g C·m-2·yr-1, and the actual NPP was 161.87 ± 63.40 g C·m-2·yr-1. The potential NPP of grassland was approximately 283.28 ± 170.44 g C·m-2·yr-1, and the actual NPP of grassland was 130.79 ± 73.27 g C·m-2·yr-1.
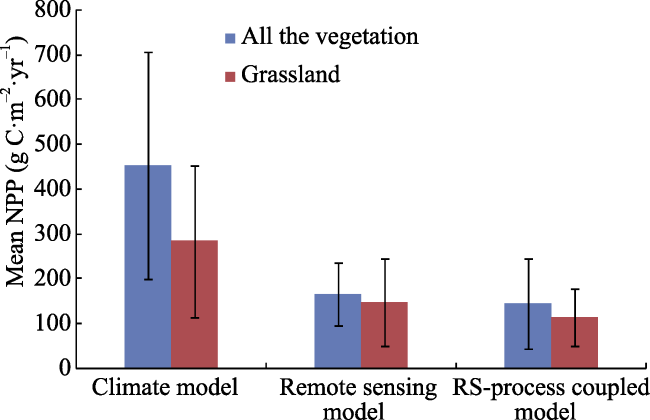
Figure 2 Comparison of estimated NPP based on different models in the TRHR
In terms of different vegetation types, estimated mean NPP displayed the following trend: forest > farmland > grassland > desert (Table 2). Specifically, mean NPP estimates of forest, farmland, grassland, and desert in the TRHR were 317.64 ± 170.06 g C·m-2·yr-1, 256.15 ± 130.41 g C·m-2·yr-1, 130.79 ± 73.27 g C·m-2·yr-1, and 40.14±25.99 g C·m-2·
yr-1, respectively. For the grassland, estimated NPP of alpine meadow was generally greater than that of alpine steppe (Guo et al., 2006; Cai et al., 2013), which was also observed in NPP field measurements. Measured NPP of alpine meadow was usually 1-3 times higher than that of alpine steppe (Table 3).
Table 3 Measured grassland NPP at different sites in the TRHR
Site Latitude Longitude Altitude Vegetation type Year Measured NPP(g C·
m-2·yr-1)
Data
source
Zhenqin N33°24′30′′ E97°18′00′′ 4250 m Alpine meadow 2010-
2011
118.41 Fan, 2003
Wudaoliang N35°12′56′′ E93°04′05′′ 4626 m Alpine steppe 2000 53.55 Luo et al., 2004
Tuotuohe N34°18′51′′ E92°32′52′′ 4582 m Alpine steppe 2000 69.30 Luo et al., 2004
Dawu N34°23′24′′ E100°16′33′′ 3980 m Alpine meadow 2014 139.07 Field measurement
Maduo N34°54′40′′ E98°11′13′′ 4207 m Alpine steppe 2015 113.23 Field measurement

The original units of NPP in Fan (2003) and Luo et al. (2004) were g DM·m-2·yr-1 and t DM·ha-1·yr-1, respectively. We used 0.45 as the C content to convert dry matter (DM) to C to make these results comparable.

4 Evaluation of methods and results

4.1 Estimation methods

Each NPP estimation method has its own advantages and disadvantages. When applied to the TRHR, different estimation methods are confronted by different challenges and suitable for different conditions. As a result, NPP estimates acquired from these methods present different characteristics.
4.1.1 Field measurements
NPP obtained from field measurements is generally believed to be true NPP, and scholars often refer to the measured NPP as validation for other estimation methods. However, in practice, there are many uncertain factors inherent in field investigations, including (but not limited to) sample selection (whether human activities are present), sample content (whether litter is included), and calculation method (especially the belowground NPP). Differences in these factors can produce varied NPP results. Furthermore, NPP field measurements are mainly based on biomass surveys, so the measured NPP only contains newly produced biomass. Therefore, theoretically, NPP acquired from most field measurements is different from true NPP. The clarification and unification of NPP measuring methods and sampling criteria should become a top research priority (Gao et al., 2012).
4.1.2 Climate model simulations
In general, climate models are only driven by climate data without considering the effects of topography, soil property, availability of nutrients, human activities, and other influencing factors on vegetation productivity. In addition, climate models lack a sound theoretical basis and comprehensive ecophysiological mechanism. Consequently, climate models have low estimation accuracies and produce much larger NPP estimates. According to the estimated results in the TRHR (Table 1), NPP simulated from climate models was usually 2-4 times higher than NPP simulated from other models.
There are two main reasons for such a large difference. Firstly, Miami, Thornthwaite Memorial, and other climate-related models were based on empirical regressions between climatic conditions and measured NPP. Therefore, parameters used in these models may need to be adjusted for a specific region. However, previous studies all applied unadjusted parameters directly to estimate NPP in the TRHR and did not verify the estimated results as the potential NPP could not be verified using the measured NPP. Thus, NPP estimates based on climate models were substantially higher (Guo et al., 2013; Li and Zhang, 2014). The second reason for the significant difference is the fact that the TRHR is a traditional pastoral area. Human management and livestock activities are prominent in the TRHR, and the effects of grazing cannot be ignored; thus, NPP acquired from climate models is significantly different from the actual NPP. Although climate models are relatively simple and convenient to use, they tend to be rather limited in actual application due to low estimation accuracy.
4.1.3 Remote sensing model simulations
RS statistical models are able to accurately estimate NPP in a relatively small area; however, this type of model has poor universality. These models usually directly convert the scale from samples (ground observations) to pixels (remote sensing images) without considering the scale effect, and use a single regression model for all of the vegetation types. Besides, statistical models rely heavily on the measured NPP. These all greatly limit the application of RS statistical models to large-scale NPP studies (Gao et al., 2012).
RS parametric models are commonly used in the TRHR and can provide relatively high estimation accuracies (Shao and Fan, 2012). However, there are still many uncertainties in RS parametric models that need to be highlighted during NPP estimation (Zhang et al., 2011):
(1) As an important input of most RS parametric models, NDVI greatly affects the accuracy of NPP estimation. According to the previous studies (Yang and Piao, 2006; Zhang et al., 2013), NDVI cannot accurately reflect the actual state of vegetation growth when the coverage of vegetation is very low. In fact, snow, glaciers, bare soils, and rocks, as well as sparse vegetation, are widely distributed in the TRHR, especially in the western part, so the accuracy of remote-sensed NDVI data cannot be guaranteed. In addition, to overcome the interferences of clouds and cloud-shadows, the maximum-value composite (MVC) procedure is often used to produce composite NDVI images. Since the composite NDVI reflects the most optimal vegetation growth state during composite period, instead of the average growth state, this could lead to overestimation of NPP.
(2) Under low temperature conditions, model responses need to be evaluated in relation to the actual situations of the TRHR. For example, in the CASA model monthly NPP is equal to zero when the monthly mean temperature is below -10°C, and the soil water content remains unchanged and the same as in the previous month if the monthly mean temperature falls below 0°C (Zhou and Wang, 2003). However, grasslands in the TRHR are dominated by perennial, deciduous grasses. The aboveground part of grasses is shed annually to avoid the harsh winter, but the perennial underground part is still living. For the trees and shrubs in the TRHR, the aboveground part is partially alive in the winter. Thus, under low temperature conditions, GPP of the TRHR should be equal to zero and NPP should be negative. The treatment of setting NPP to zero in non-growing seasons causes NPP to be overestimated. In addition, it is soil temperature, not atmospheric temperature, that directly influences the soil moisture state. Even if the soil temperature drops below 0°C and the soil begins to freeze, the soil water content will decline significantly before it becomes stabilized (i.e., soil water is completely frozen), and therefore not remain the same as in the previous month.
(3) Models are not able to simulate the detailed changes in processes of NPP. As RS images only record instantaneous values, RS models are only able to estimate limited frequencies of NPP determined by the temporal resolution of RS input data. As a result, RS models can neither provide the detailed changes in processes of NPP, nor identify the key drivers of NPP changes or quantify the human impacts on NPP. In cases where the environment changes rapidly (such as heavy snowfall, outbreaks of pests and diseases, etc.), the reliability of RS models reduces substantially.
Despite the above-mentioned limitations, RS models are able to obtain relatively high estimation accuracies and calculation efficiencies at low costs. RS models are suitable for studies aimed at estimating vegetation standing biomass and its rate of change.
4.1.4 Process model simulations
As process models are yet to be specifically applied to the TRHR, this study only explores their suitability by analyzing the existing process models. The main challenges faced by process models are as follows:
(1) The phenology modules in the process models require comprehensive verification in the TRHR. Phenology, the timing of plant growth and development, is critical for biomass accumulation. An accurate simulation of phenology is a prerequisite for obtaining unbiased NPP estimates in the TRHR (Hidy et al., 2012). However, phenology models were generally established from data collected in specified areas, and did not work well when applied to larger spaces or other places. Currently, most process models, such as Biome-BGC, ORCHIDEE, and LPJ, simulate phenology based on empirical or semi-empirical relationships between phenological stages and climate factors. They assume that phenology is generally controlled by temperature and moisture conditions in the environment, and the moisture is often described using precipitation (Jolly et al., 2005; Tian and Zeng, 2015). However, in the TRHR, although precipitation is not so much at the beginning of the growing season, soil water is sufficient for vegetation growth due to thawing of the widely distributed frozen soil. Simulation results based on the Biome-BGC also indicated that the start day of the growing season was significantly delayed (approximately in June) due to the high threshold of precipitation to start a new growing season in the model (related results are yet to be published).
(2) Most existing process models cannot accurately simulate the growth and litterfall processes of perennial, deciduous grasses. Most process models are able to simulate the basic biogeochemical processes for grasses, but their descriptions for herbaceous plants are too simple. In Biome-BGC, for example, grasses are comprised of only leaves and fine roots that all become litter at the end of the growing season. The regeneration and litterfall processes of perennial plants are usually controlled by user-defined or default turnover fractions in process models, and the senescence and litterfall processes are generally not considered separately, but dealt with as a single process. If process models are applied directly to estimate NPP in the TRHR without any modification, there is a strong possibility that carbon, nitrogen, and water cycles between different components of plants are simulated inadequately due to the coarse description of grasses. Since vegetation in the TRHR is dominated by perennial plants, the roots do not all die at the same rate and the underground perennial portion remains alive during the winter. Therefore, living and dead roots need to be distinguished, and turnover fractions of the underground fast-cycling portion and the perennial portion should be defined separately in process models, otherwise simulations of root development, soil respiration, litterfall, decomposition, and plant regeneration processes will all be affected, which will definitely impact NPP estimation.
(3) In general, hydrological simulations based on NPP process models are less than ideal. In the TRHR, frozen soils, including permafrost and seasonally frozen soil, are widespread and the thickness of the active layer varies greatly over time. Except for precipitation, underground ice melting and lateral flow are also important sources of soil water. However, most NPP process models have not yet adequately considered the impacts of frozen soils on hydrological processes. Precipitation is considered as the sole source of soil water, and the infiltration depth of precipitation is often set to a constant. These would lead to large simulation errors of soil water content, and further influence the calculation processes of soil evaporation, stomatal conductance, photosynthesis, and transpiration.
(4) Influences of human activities are usually modeled in a very simple manner and not spatially related. Most NPP process models, such as DLEM (Tian et al., 2010), CENTURY (Zhang et al., 2015b), and Biome-BGC (White et al., 2000) use simplified modules or just several parameters to reflect the impacts of human activities on biogeochemical processes. Currently, these models generally have no capacity to account for detailed spatial differences in their simulated results as human activities are not easily spatialized, so the practical applications of NPP process models to ecosystem management and planning are very limited.
(5) No process models have considered the impacts of wildlife on NPP. As a national nature reserve, there are various types and large numbers of wild animals living in the TRHR, including Pantholops hodgsonii, Procapra picticaudata, Equus kiang, and Procapra przewalskii. In order to accurately simulate NPP in the TRHR, impacts of wild animals cannot be ignored.
Simulation accuracies of process models are not necessarily better than those of RS models (Gao et al., 2012). However, as process models can simulate plant physiological and ecological processes as well as the interactions and feedbacks within ecosystems, they are of more significance in the ecosystem management and early-warning analyses.
4.1.5 RS-process coupled model simulations
RS-process coupled models have strengthened the mechanisms behind some processes in RS models, and simultaneously have made the model parameterization and scale transformation in process models easier and more convenient. Although the GLOPEM-CEVSA model proposed by Wang et al. (2009) does not use a mechanistic model of photosynthesis, it simulates biomass allocation, respiration, litterfall, and decomposition processes within sound theoretical frameworks. GLOPEM-CEVSA has been well verified in the TRHR. Another RS-process coupled model, the MOD17A3 algorithm, calculates GPP based on a RS parametric model, and estimates autotrophic respiration from mechanisms. The estimated GPP and autotrophic respiration are then combined to obtain NPP (Running and Zhao, 2015). Although there have been a number of studies using the MODIS NPP product in the TRHR (Guo et al., 2006; Zhang et al., 2015a), there are few reports of the accuracy of the MODIS NPP product or MOD17A3 algorithm based on field verifications in the TRHR.
For the difficulties of large-scale phenology simulation, RS-process coupled models have provided effective solutions. For example, the RS-process coupled model, SiB2, utilizes continuous NDVI data to acquire phenological information (Sellers et al., 1996). BEPS model uses LAI data obtained every eight days to reflect phenological changes in vegetation (Sun et al., 2015). Similar to RS models, RS-process coupled models have deficiencies in providing forecasts and early warnings.

4.2 Parameter values

Many parameters used in NPP estimation methods have clear ecological significance. However, in real estimation processes, if the value of a certain parameter deviates wildly, a seemingly accurate result can still be produced by adjusting other parameters. In this case, NPP estimation becomes a purely mathematical game rather than a beneficial insight into mechanisms and changes in the ecosystem. Therefore, utilization of realistic and accurate parameters in the NPP estimation processes does have a significant impact on the development of NPP models and understanding of ecological environments. For brevity, this paper only covers some key parameters used in the processes of NPP estimation. Parameters discussed include the maximum LUE, ratio of underground biomass to aboveground biomass, ratio of live root biomass to total underground biomass, C content, and root turnover fraction.
4.2.1 Maximum light use efficiency
RS parametric models are the most commonly used models for NPP estimation in the TRHR. As an extremely important parameter in RS parametric models, values of the maximum LUE greatly affect NPP estimates. Potter et al. (1993) calculated the maximum LUE for global vegetation as 0.389 g C·MJ-1; however, many studies have shown that this value was not suitable for the vegetation in China (Zhu et al., 2006). Running et al. (2000) used Biome-BGC to simulate values of the maximum LUE for different vegetation types worldwide. Wang (2013) and Wu et al. (2011) applied the result for grasslands (0.608 g C·MJ-1) from Running et al. (2000) to estimate NPP of the TRHR. Zhu et al. (2006) simulated values of the maximum LUE for typical vegetation types in China at a national scale, and the values for grasslands/farmlands, forests, and shrubs were found to be 0.542 g C·MJ-1, 0.389-0.985 g C·MJ-1 (considering the differences between coniferous, broadleaf, and mixed forest types), and 0.429 g C·MJ-1, respectively. Cai et al. (2013) directly used these results to simulate NPP of the TRHR. For the Qinghai Province, however, Wei and Wang (2010) calculated the maximum LUE to be only 0.649-0.908 g C·MJ-1, 0.114-0.538 g C·MJ-1, and 0.115-0.326 g C·MJ-1 for forests, shrubs, and grasslands, respectively.
Although the TRHR is subjected to intense solar radiation due to its high altitude, the energy fixed by photosynthesis is limited. Species of plant on the plateau have lower photosynthetic rates and quantum efficiency, as well as lower LUE, than those for the same species on the plain (Zhou, 2001). The direct application of the maximum LUE suitable for global or other areas to the TRHR might lead to an overestimation of NPP. This review suggests that, when estimating NPP in the TRHR, suitable values of the maximum LUE for grasslands, forests, and shrubs should be 0.115-0.326 g C·MJ-1, 0.389-0.908 g C·MJ-1, and 0.114-0.538 g C·MJ-1, respectively.
4.2.2 Ratio of underground biomass to aboveground biomass
To obtain NPP from field measurements, biomass needs to be measured first in most cases. Because aboveground biomass is relatively easy to measure, and direct access to underground biomass is difficult, many scholars have utilized the ratio of underground biomass to aboveground biomass (i.e., root to shoot, R/S) to estimate plant underground biomass. The R/S ratio is commonly adopted in NPP estimation processes, particularly for grasslands. In this article, some results of R/S ratios for primary grassland types in the TRHR are summarized in Table 4, which shows that R/S ratios vary substantially among different studies. Although the R/S ratio carries a certain degree of uncertainty, most studies showed that for alpine meadow and alpine steppe, there was a good correlation between aboveground biomass and underground biomass, and R/S ratios fell within a certain range of variation. Therefore, utilization of R/S ratios to estimate grassland biomass and productivity in the TRHR remains a reliable approach (Ma et al., 2014). According to the field data obtained by Yang et al. (2009), variation ranges of R/S ratios for alpine meadow and alpine steppe were 0.8-13 and 1.4-12.7, respectively. For the entire alpine grasslands on the Qinghai-Tibet Plateau, the median R/S ratio was approximately 5.8, which was greater than that of the global grasslands.
Table 4 Root to shoot (R/S) ratios of primary grassland types in the TRHR
Alpine
meadow
Alpine
steppe
Temperate
steppe
Marsh Reference Acquisition
mode
4.15 / / / Fan, 2003 Field measurement
6.8 5.2 / / Yang et al., 2009 Field measurement
7.92 4.42 4.32 / Luo et al., 2002 Field measurement
7.92 4.25 4.25 15.68 Piao et al., 2004 Literature review
9.19 9.49 9.19 / Wang et al., 2008 Literature review
6.5 6.2 6.4 / Ma et al., 2014 Literature review
4.2.3 Ratio of live root biomass to total underground biomass
Only live roots are relevant to vegetation productivity. Thus, when estimating underground NPP in the field measurements, there is a need to distinguish between live and dead roots. The distinction is made subjectively, using color, density, and shape of the roots as distinguishing characteristics. Live roots are usually white or brown in color, whereas dead roots are often black. When roots are placed in water, denser roots sink to the bottom, usually indicating dead roots. In contrast, live roots tend to float. Furthermore, intact roots with a smooth appearance tend to be alive, whereas roots with shredded or folded skin tend to be dead.
Zhou (2001) conducted continuous observations of underground biomass in an alpine meadow ecosystem at Haibei station from May to September between 1980 and 1982, and found that the live root biomass was approximately 70%-80% of the total underground biomass. Fan et al. (2010b) assumed the ratio of live root biomass to total underground biomass to be 0.79 during their estimation of grassland NPP in the TRHR. However, according to our measured (unpublished) data obtained in the years of 2005, 2008, and 2015, this ratio was approximately 0.2-0.4 for most sampling sites within the TRHR, and only at some sites in alpine swamp meadow did the ratio exceed 0.6. A good explanation for such a significant difference between these findings has yet to be determined. Possible explanations include different methods used to distinguish between live and dead roots and global climate change, which has significantly increased soil temperatures and decreased soil water content and consequently restricted root longevity compared to that measured in the 1980s.
4.2.4 C content
Calculations of NPP based on biomass require the C content when NPP needs to be expressed as C per unit time and space. Studies by Zhou (2001) and Zhao (2009) showed that C content of plants in the alpine Kobresia humilis Serg meadow ranged between 34% and 38%. Research by Chang (2008) carried out in the Stipa purpurea alpine steppe revealed that the C content was between 21% and 39% (with an average of 29%). Based on both previously published data and field measurements, Zheng et al. (2007) reported that the average C contents of trees, shrubs, and herbs were 46.22%, 45.93%, and 37.13%, respectively, and in herbaceous plants, average C contents of leaves, stems, and roots were 36.83%, 32.57%, and 34.16%, respectively. The C contents of herbaceous plants obtained from aforementioned studies were much lower than the commonly used range of 45%-50%. However, most studies of grassland NPP estimation in the TRHR have assumed 0.45 as the C content (Fan, 2003; Zhang et al., 2015a), which has caused an overestimation of NPP. Therefore, for herbaceous plants in the TRHR, the C content should not exceed 40% in NPP estimation processes, whereas for forests and shrubs, the range of 45%-50% can be used.
4.2.5 Root turnover fraction
Root turnover fraction is defined as the proportion of root production or mortality during a certain period to the total root biomass (usually one year). A direct measurement of root turnover fraction has proven rather difficult. Gill et al. (2002) recommended three ways to estimate the root turnover fraction of grasslands. These include: (1) using the ratio of underground NPP to underground average, minimum, or maximum biomass to acquire root turnover fraction; (2) establishing the empirical relationship between root turnover fraction and aboveground NPP or climate data; and (3) assuming root turnover fraction as a constant value. Fan et al. (2010b) utilized the empirical relationship between root turnover fraction and aboveground NPP developed by Gill et al. (2002) to estimate root turnover fraction and NPP in the TRHR. In wetlands and marsh areas, they estimated root turnover fraction could exceed 0.7 using this method. In process models, however, constant root turnover fractions are usually used for different vegetation types. Gill et al. (2002) proposed that the root turnover fraction of global grasslands was approximately 0.65. Wu et al. (2014) applied sequential coring, ingrowth cores, and a minirhizotron to investigate the root production and turnover fraction of grasses in an alpine meadow. The results indicated that different methods could produce very different root turnover fractions, and reliable values ranged between 0.29 and 0.63. Therefore, in estimation processes of grassland NPP in the TRHR, we recommend root turnover fraction should be between 0.29 and 0.65 (Wu et al., 2011b). For wetlands and alpine swamp meadows, the root turnover fraction can be above 0.7 (Zhou, 2001; Fan et al., 2010a).

4.3 Estimated results

4.3.1 Model accuracy
There are several studies evaluating the estimation accuracy of different NPP models. Cai et al. (2013) performed correlation analysis between CASA-modeled NPP and measured NPP in the TRHR, and showed that the estimation accuracy of CASA was relatively ideal with the correlation coefficient reaching 0.8. In addition, Cai et al. (2013) compared NPP estimates of the CASA model with those of the Miami and Zhou Guangsheng models, and indicated that the latter produced higher estimates with lower accuracies. Fan et al. (2010b) calculated NPP and grassland yield based on GLO-PEM model, and verified the simulated yield with the measured yield at the same sites in the TRHR. The results indicated a good correlation between them (R2 = 0.54, P < 0.01). In addition, Wang (2013) used the correlation coefficient (r), determination coefficient (R2), and root mean square error (RMSE) as indicators to evaluate the estimation accuracies of different NPP models based on NPP measurements. Results showed that the performance of MOD17A3 algorithm was most accurate, followed by CASA model, while the Miami and CIM models were least accurate. Therefore, according to the existing evaluation results in the TRHR, RS-process coupled models generally have the best estimation accuracy, followed by RS models, and climate models display the lowest accuracy.
4.3.2 Verification methods
There are four main types of verification methods used in NPP estimation studies of the TRHR: (1) Biomass or grassland yield is obtained and converted to NPP, which is then compared with the simulated results (Cai et al., 2013; Wang, 2013); (2) simulated grassland NPP is first converted to grassland yield and then compared to the investigated yield data (Wang et al., 2009; Fan et al., 2010b); (3) simulated NPP is compared with the results from previous studies in the same (or a similar) region (Zhang et al., 2014; Chen, 2015); and (4) direct comparisons are conducted using MODIS NPP products (Wo et al., 2014). In terms of NPP verification, two issues require additional attention. First, field data of underground NPP, which is the primary component of total NPP in the TRHR, is extremely underrepresented compared to aboveground NPP. Currently, underground NPP is primarily obtained from conversions of the aboveground biomass or aboveground NPP. However, different studies use various parameter values in conversion processes including R/S ratio, root turnover fraction, and C content, all of which can affect the estimates of NPP. The second is that only the final simulated NPP is actually verified. Intermediate variables are not verified nor do they receive adequate attention. Since only the NPP is verified, estimation processes become “black boxes” in which model applications are little more than “games of parameter adjustment”. If only NPP is correct and intermediate outputs are largely erroneous, this will introduce great uncertainty into ecosystem simulations and early-warning analyses.
4.3.3 Evaluation of results
According to Chapin III et al. (2002), NPP includes the new biomass produced by plants, the soluble organic compounds that are diffused or secreted by roots, the carbon transferred into microbes that are symbiotically associated with roots (nitrogen-fixing bacteria and mycorrhizae), losses to herbivory and mortality, and the volatile emissions that are lost from leaves to the atmosphere. Most field measurements of NPP document only the newly produced plant biomass and therefore probably underestimate the true NPP. According to Chapin III et al. (2002), only the NPP involved in root secretions accounts for more than 20% of the true NPP.
The TRHR has always been a traditional pastureland. Based on years of foraging surveys and sampling, the annual intake of livestock accounts for approximately 41.48% of grassland aboveground NPP (Zhou, 2001). NPP consumed by wild animals is also significant. In 2013, according to preliminary statistics, there were more than 200,000 wild animals inhabiting Maduo County alone, including Pantholops hodgsonii, Procapra picticaudata, Equus kiang, and Procapra przewalskii, which greatly exceed the current livestock numbers (about 130,000). The consumption of a Pantholops hodgsonii is equivalent to that of six domestic sheep (Song, 2013). In addition, rodents have become a serious problem in some areas of the TRHR (Shao and Fan, 2012). According to conservative estimates, a medium level of rodent density would result in 20%-30% consumption of available livestock pastures (Zhou, 2001). Therefore, a considerable proportion of biomass has already been consumed by herbivores before it can be measured, so even the new biomass measured in field studies is an underestimate of biomass production.
Assuming that the ratio of aboveground NPP to underground NPP for alpine grasslands in the TRHR is approximately 1:2 (Zhou, 2001; Luo et al., 2004), aboveground NPP accounts for approximately 30% of the total NPP. Livestock grazing consumes approximately 12% of the total NPP. Consumption by wild animals is no less than that of the livestock, so it is also estimated at 12% of the total NPP. Intake by rodents is calculated as 20% of livestock consumption, and thus, accounts for approximately 2% of the total NPP. Root secretions are assumed to comprise approximately 20% of the total NPP. Therefore, in summary, most of the NPP obtained from field measurements in the TRHR might have underestimated the true NPP by at least 40%. If models do not include or cannot reflect these factors causing NPP underestimation, but rather directly take the underestimated NPP as the true NPP in the simulation processes (mainly via parameter calibration and result verification), the estimated NPP based on these models will also be underestimated. Therefore, during NPP estimation processes, the content of simulated NPP and measured NPP must be consistent.

5 Conclusions

The main conclusions of this study can be summarized as follows:
(1) NPP estimation methods can be broadly divided into two categories: field measurements and model simulations. NPP models include climate models, RS models, process models, and RS-process coupled models. The NPP obtained from field measurements is generally considered as the true NPP, and it is often applied to validate the results of other NPP estimation methods. Among different NPP models, RS-process coupled models are generally most accurate, followed by RS models, while climate models are least accurate.
(2) The potential NPP of all the vegetation in the TRHR was approximately 453.23 ± 252.30 g C·m-2·yr-1, and the actual NPP was 161.87 ± 63.40 g C·m-2·yr-1. The potential NPP of grassland was approximately 283.28 ± 170.44 g C·m-2·yr-1, and the actual NPP was 130.79 ± 73.27 g C·m-2·yr-1. Across different vegetation types, estimated mean NPP displayed the following trend: forest > farmland > grassland > desert.
(3) NPP simulated from climate models was usually 2-4 times higher than NPP simulated from other estimation models. Although RS parametric models are commonly used in the TRHR and provide relatively high estimation accuracies, there are still many uncertainties that should be highlighted during NPP estimation. Because of the particular alpine environments, most of the current process models cannot be directly applied to estimate NPP in the TRHR. Additionally, although RS-process coupled models can compensate for some weaknesses of RS and process models, they still have deficiencies in providing forecasts and early warnings.
(4) Most NPP studies have overestimated the maximum LUE for grasslands in the TRHR. The applied ratio of underground biomass to aboveground biomass (R/S ratio) varied substantially among different studies. The assumed ratio of live root biomass to total underground biomass was relatively high, and the measured ratio ranged from 20% to 40%. The C content of herbaceous plants in the TRHR was much lower than the commonly used range of 45%-50%. Recommended root turnover fraction in the TRHR was between 0.29 and 0.65, whereas for wetlands and alpine swamp meadows, root turnover fraction can be above 0.7.
(5) At present, validation for NPP estimates is not comprehensive, and it needs more effort and in-depth research involving the verification method and content. According to preliminary estimates, currently most of the NPP obtained from field measurements in the TRHR might have underestimated the true NPP by at least 40%. If models directly consider the underestimated NPP as the true NPP in the modeling and calculation processes, the estimated NPP will also be underestimated. Therefore, simulated NPP and measured NPP must be consistent in meaning during NPP estimation processes.

6 Outlook

(1) An overall strengthening of data infrastructure in the TRHR is required. Because of the harsh natural environments, fixed and semi-fixed sampling plots, ecological research stations, and micrometeorological tower sites are far from adequate and are distributed unevenly in the TRHR. Furthermore, long-term and systematic observations are severely lacking, and important ecological data including climate, vegetation, soil, and hydrology generally have coarse resolution and bad currency. These all contribute to the challenges of dynamic and unbiased NPP estimation. In recent years, a great deal of money and technology has been invested in the TRHR to construct a network of ecological monitoring stations based on the requirements of ecological protection and construction. These stations on the ground, combined with satellites, have formed a preliminary air-ground environmental monitoring system. It is hoped that, based on this preliminary system, ecological and environmental monitoring in the TRHR can be performed under stable procedures in the future to complete the tasks of data collection and sharing.
(2) An emphasis on the development of process models applicable to the TRHR is required. Process models can be used not only to estimate NPP but also to describe and forecast changes in NPP. However, most existing process models are not capable of accurately simulating the unique ecological processes in alpine environments of the TRHR. Therefore, there is an urgent need to develop NPP process models that can accurately simulate the phenological changes, regeneration, and litterfall processes of perennial, deciduous grasses, presence of the permafrost, and impacts of frozen soil on the water cycle in the TRHR. Furthermore, as the TRHR covers such a wide area, substantial ecological variation has been observed. The spatial differences within the TRHR should be taken into consideration during model development and simulation processes.
(3) The development of NPP models that can depict human activities and wildlife impacts is required. Of all the various NPP models, climate models describe no effects of disturbance factors other than climate change. While RS models can reflect human activities and wildlife impacts in the results, they cannot simulate the impact processes nor can they quantify the degree of influences. Although process models and RS-process coupled models are able to simulate the influences of both human and wildlife activities on NPP estimation, the relevant modules within them are relatively simple, and there has been almost no consideration of wild animals. As a national nature reserve, wildlife numbers in the TRHR have rapidly increased over the years, and it is likely that human activities will also increase with the establishment of national parks in the area. Therefore, it is crucial for the TRHR to develop NPP models that include both human activities and wildlife impacts.
(4) The development of an easy operating platform to run regional-scale models is required. There are a number of models for NPP estimation; however, the actual application of these models to the TRHR at the regional scale might be challenging for scientific researchers or technical staff due to the complexities of the models and laborious tasks of data preparation. These difficulties have greatly limited both the breadth and depth of NPP applications. Therefore, developing an easy operating platform to run regional-scale NPP models deserves high priority.
(5) A convergence of NPP estimates with environmental management practices is also required. NPP not only reflects the growth state of vegetation but also serves as an important indicator of ecosystem health. Changes in NPP directly affect ecosystem processes and functions that have a profound impact on ecosystem services, which ultimately influences the wellbeing of human populations. Therefore, linking NPP estimation to ecosystem carbon trading, ecological assets valuation, conservation strategy simulation, and other environmental management practices is important for the promotion of NPP studies in the TRHR.

The authors have declared that no competing interests exist.

[1]
Cai Y L, Zheng Y F, Wang Y L,et al.., 2013. Analysis of terrestrial net primary productivity by improved CASA model in Three-River Headwaters Region.Journal of Nanjing University of Information Science and Technology (Natural Science Edition), 5(1): 34-42. (in Chinese)An improved CASA(Carnegie ames stanford approach) model is used to estimate the terrestrial net primary productivity(NPP) in Three-river headwaters region.Results indicate that the NPP decreased from the southeast to the northwest,while the NPP in southestern area of Yellow River is higher than that of the Yangtze River.NPP shows a slightly downward trend during 2004—2008,with the maximum of 62.93Tg·a1 in 2006,and minimum of 60.9Tg·a1 in 2008.Seasonal variation of NPP is also prominent,which started to increase from May to July,then decreased gradually.The annual NPP of alpine meadow is 188.95g·m2·a1 ,higher than that of aloine steppe of 129.41g·m2·a1 in the region,while interannual variation of aloine steppe is increasing during 2004— 2006.The analysis shows that temperature is the key factor controlling the terrestrial NPP in the region,followed by precipitation and total solar radiation.The NPP fluctuation in the higher elevations of this region is significantly related with temperature,with correlation coefficient being 0.8,while the correlation coefficient between NPP and precipitation is 0.7.

[2]
Chang T J, 2008. The distribution pattern of carbon reserve in Northern Tibet alpine grassland ecosystem [D]. Linzhi: Agriculture and Animal Husbandry College of Tibet University. (in Chinese)

[3]
Chapin III F S, Matson P A, Mooney H A, 2002. Principles of Terrestrial Ecosystem Ecology. New York: Springer, 127-128.Humans have directly modified half of the ice-free terrestrial surface and use 40% of terrestrial production. We are causing the sixth major extinction event in the history of life on Earth. With the Earth鈥檚 climate, flora, and fauna changing rapidly, there is a pressing need to understand terrestrial ecosystem processes and their sensitivity to environmental and biotic changes. This book offers a framework to do just that. Ecosystem ecology regards living organisms, including people, and the elements of their environment as components of a single integrated system. The comprehensive coverage in this textbook examines the central processes at work in terrestrial ecosystems, including their freshwater components. It traces the flow of energy, water, carbon, and nutrients from their abiotic origins to their cycles through plants, animals, and decomposer organisms. As well as detailing the processes themselves, the book goes further to integrate them at various scales of magnitude鈥攖hose of the ecosystem, the wider landscape and the globe. It synthesizes recent advances in ecology with established and emerging ecosystem theory to offer a wide-ranging survey of ecosystem patterns and processes in our terrestrial environment. Featuring review questions at the end of each chapter, suggestions for further reading, and a glossary of ecological terms, Principles of Terrestrial Ecosystem Ecology is a vitally relevant text suitable for study in all courses in ecosystem ecology. Resource managers and researchers in many fields will welcome its thorough presentation of ecosystem essentials.

DOI

[4]
Chen J F, Liu C, Xu J B, 2011. Research on the remote sensing monitoring of grass productivity based on TM-NDVI.Journal of Anhui Agricultural Sciences, 39(12): 7365-7366. (in Chinese)By means of ground survey and "3S" technology,taking Maduo County in three river sources areas as example,the remote sensing model between biomass and normalized difference vegetation index(NDVI) in sampling points was established after calculating the NDVI distribution of TM image in Maduo County,and the grade distribution map of grassland productivity in Maduo County was obtained according to the grade division of grassland productivity in Qinghai Province,so as to monitor grassland productivity step by step.The results showed that grassland coverage area in Maduo County in 2009 was about 2.22 million hm2,and NDVI was mainly from 0 to 0.5,accounting for 88.64% of total grassland area in Maduo County;there was a significant correlation between biomass and NDVI in sampling point,with the correlation coefficient of above 0.7,and their model could be quantitatively expressed as follows,namely Biomass = 552.632 脳 NDVI1.137;grassland productivity in Maduo County was 750-3 000 kg/hm2 which occupied 72.1% of total grassland area;the highest grassland productivity in Maduo County was 4 500-6 500 kg/hm2,but it accounted for below 1% of total grassland area.

[5]
Chen L J, 2015. The study on the temporal and spatial variation of NPP and its driving factors in Sanjiangyuan Nature Reserve [D]. Taigu: Shanxi Agricultural University. (in Chinese)

[6]
Cramer W, Field C B, 1999. Comparing global models of terrestrial net primary productivity (NPP): Introduction. Global Change Biology, 5(S1): iii-iv.

[7]
Cramer W, Kicklighter D W, Bondeau A,et al.., 1999. Comparing global models of terrestrial net primary productivity (NPP): Overview and key results.Global Change Biology, 5(S1): 1-15.Summary Given that neither absolute measures nor direct model validations of global terrestrial net primary productivity (NPP) are feasible, intercomparison of global NPP models provides an effective tool to check model consistency. For this study, we tested the assumption that water availability is the primary limiting factor of NPP in global terrestrial biospheric models. We compared a water balance coefficient (WBC), calculated as the difference of mean annual precipitation and potential evapotranspiration to NPP for each grid cell (0.5掳脳0.5掳 longitude/latitude) in each of 14 models. We also evaluated different approaches used for introducing water budget limitations on NPP: (1) direct physiological control on evapotranspiration through canopy conductance; (2) climatological computation of constraints from supply/demand for ecosystem productivity; and (3) water limitation inferred from satellite data alone. Plots of NPP vs. WBC showed comparable patterns for the models using the same method for water balance limitation on NPP. While correlation plots revealed similar patterns for most global models, other environmental controls on NPP introduced substantial variability.

DOI

[8]
Du Y E, Liu B K, Guo Z G, 2011. Changes of forage biomass of grasslands during the growing season in the Qinghai-Tibetan Plateau based on MODIS data.Pratacultural Science, 28(6): 1117-1123. (in Chinese)Grassland biomass is an important indicator to evaluate the ecological vulnerability and sensitivity,and is also an important indicator to assess the grassland degradation.In this study,the NDVI index and EVI index from MODIS data and the field data from 326 plots in the grassland were used to establish and optimize the prediction models of grassland biomass for different grassland types,and then established model was applied to estimate the annual and monthly grassland biomass during the period from 2002 to 2009.This study showed that the alpine meadow biomass retrieval model was y=6.202 5x2-574.89x+14 586,here,x was NDVI;alpine steppe biomass retrieval model was y=0.1 665 5x17 732,here,x was EVI.The biomass of alpine steppe and meadow showed a fluctuant trend during the period 2002-2009,and the fluctuation range of alpine meadow was bigger than that of alpine steppe.The biomass of alpine steppe and meadow increased from June to August,and decreased from August to September,the fluctuation range of alpine steppe was bigger in July and smaller in August than that of alpine meadow,however,the fluctuation range in June and September was not obvious between alpine meadow and alpine steppe.

[9]
Fan J W, Shao Q Q, Liu J Y,et al.., 2010a. Dynamic changes of grassland yield in Three River Headwater Region from 1988 to 2005.Acta Agrestia Sinica, 18(1): 5-10. (in Chinese)The Three River Headwater Region is the source of the Yangtze,Yellow,and Lantsang rivers.The objectives of this study were to analyze the dynamic changes of grassland productivity and explore the natural and human driven mechanisms causing the grassland ecosystem changes.Findings in this study would be applied to the development of scientific strategies and programs for grassland restoration,management,and utilization and assess the effectiveness of the ecological engineering project.Dynamic changes of grassland yield of the region from 1988 to 2005 were analyzed using the GLOPEM model.The results indicate that grassland productivity in the region fluctuated periodically with a 3 to 5 year cycle.The variation coefficient of annual productivity increased from the east to the west of the region and from marsh,alpine meadow,alpine steppe,to temperate steppe grasslands.In general,grassland yield in the region showed an increasing trend during the studied 18-year period,especially a remarkable increase in alpine steppe and grasslands in the west of the region.The analysis indicates that the increased grassland productivity during the 18 years was influenced by climatic change.These findings indicate that we should keep clear-headed understanding to the contingent increase of ecosystem supply function which probably covers up the long-term negative impact of climatic change on the holistic functions of ecosystem.

DOI

[10]
Fan J W, Shao Q Q, Liu J Y,et al.., 2010b. Assessment of effects of climate change and grazing activity on grassland yield in the Three Rivers Headwaters Region of Qinghai-Tibet Plateau, China.Environmental Monitoring and Assessment, 170(1): 571-584.Inter-annual dynamics of grassland yield of the Three Rivers Headwaters Region of Qinghai鈥揟ibet Plateau of China in 1988鈥2005 was analyzed using the GLO-PEM model, and the herbage supply function was evaluated. The results indicate that while grassland yield in the region showed marked inter-annual fluctuation there was a trend of increased yield over the 18 years of the study. This increase was especially marked for Alpine Desert and Alpine Steppe and in the west of the region. The inter-annual coefficient of variation of productivity increased from the east to the west of the region and from Marsh, Alpine Meadow, Alpine Steppe, Temperate Steppe to Alpine Desert grasslands. Climate change, particularly increased temperatures in the region during the study period, is suggested to be the main cause of increased grassland yield. However, reduced grazing pressure and changes to the seasonal pattern of grazing could also have influenced the grassland yield trend. These findings indicate the importance of understanding the function of the grassland ecosystems in the region and the effect of climate change on them especially in regard to their use to supply forage for animal production. Reduction of grazing pressure, especially during winter, is indicated to be critical for the restoration and sustainable use of grassland ecosystems in the region.

DOI PMID

[11]
Fan Y J, 2003. Effects of fencing and grazing on plant morphology, community characteristics and carbon balance of Kobresia pygmaea meadow in the Three Headwater Regions [D]. Lanzhou: Gansu Agricultural University. (in Chinese)

[12]
Fang J Y, Tang Y H, Lin J D et al., 2000. Global Ecology: Climate Change and Ecological Responses. Beijing: Higher Education Press; Heidelberg: Springer Press, 191. (in Chinese)

[13]
Feng X F, Liu G H, Chen S P,et al.., 2004. Study on process model of net primary productivity of terrestrial ecosystems.Journal of Natural Resources, 19(3): 369-378. (in Chinese)The simulation of net primary productivity (NPP) in terrestrial ecosystem comes into a stage of process-based simulation from statistics-based simulation.We review the history of study on NPP in China;it has made a rapid progress.However,we should pay more attention to study on NPP modeling.Process models for estimating NPP simulate a series of plant physiological processes.Process models have the advantages of: (1) being theoretically grounded, (2) the ability to handle interactions and feedbacks of different processes, (3) the flexibility to describe details of biological processes under a variety of conditions, and (4) the verifiability of explicit hypotheses regarding plant physiological processes.Furthermore,process models based remote sensing will simulate and monitor dynamically NPP of terrestrial ecosystem timely,macroscopically,exactly from multi-scale,though the NPP temporal-spatial change pattern will be shown well.We expound every kind of process -based model from leaf scale,canopy scale and region scale.Because of complexity and heterogeneousness of ecosystem,it is an important question to scale in NPP modeling.We could complete scaling by mathematic method.And remote sensing and GIS provide a new way to scaling.

[14]
Feng X F, Sun Q L, Lin B, 2014. NPP process models applied in regional and global scales and responses of NPP to the global change.Ecology and Environmental Sciences, 23(3): 496-503. (in Chinese)Net primary productivity(NPP) is defined as the difference between accumulative photosynthesis and accumulative autotrophic respiration by green plants per unit time and space. NPP is not only a key parameter representing vegetation activity and ecological processes, but also a main factor determining the carbon sink and reflecting the responses to global change for an ecosystem. At present, model simulation has become the primary means of NPP research at large spatial scales, and among many estimating tools, process-based models have increasingly tended to be dominant. According to the spatial extent that models are suited for, NPP process models are classified into two categories, i.e. models in patch scale, and models in regional and global scale. In spite of a multitude of papers related to the NPP estimation, there is still no any review focused on the process models applied in regional and global scales, and the responses of estimated NPP to the global change; therefore, this paper is concentrated on the application of these process models. The main contents of this work include:(1) further classification of these models into two groups, i.e. static vegetation models and dynamic vegetation models;(2) illumination of the differences and connections between these models;(3) summary and schematization of three major challenges in the application of NPP process models to regional and global scales, i.e. spatial and temporal scale transformations, acquirement and fusion of multi-source data, and the validation of models' estimations; and(4) investigation of NPP's responses to the global change, which were described in detail in three aspects involving climate change, atmospheric composition change, and the land use and land cover change(LUCC), for the purpose of seeking the change pattern concerned with NPP. Finally, the development trends of these process models were prospected. They were thought to have better comprehensiveness and more scientific mechanism in the future, at the same time, models would be integrated into global change research more tightly, and the hybrid models based on several existing simulating tools were believed to be one of the important developing directions. Besides, this paper considered that scale effects of the estimations would also be one of the foci in the future NPP studies.

[15]
Gao T, Xu B, Yang X C,et al.., 2012. Review of researches on biomass carbon stock in grassland ecosystem of Qinghai-Tibetan Plateau.Progress in Geography, 31(12): 1724-1731. (in Chinese)It is critical to know Qinghai-Tibetan Plateau’s grassland biomass carbon(C) stock and its dynamics in order to study the regional C cycle and sustainable use of grassland resources.After reviewing the publications,the authors present a summary of methods and results in the studies of biomass C stock in grassland ecosystem of Qinghai-Tibetan Plateau.(1) Four methods are mainly used in this field: searching in literature and documents,field measurement,remote sensing of vegetation/vegetation indices,and process modeling.In the practice,methods of estimation,quality standards for sample collection,and underground biomass estimation are the most important factors impacting the results.(2) According to the published literature,biomass C density of Qinghai-Tibetan Plateau’s grasslands is approximately 223g/m2,and can be translated to a total grassland biomass C stock of 277 Tg C(1Tg=1012g).(3) The estimation results based on remote sensing indicate that the biomass C stock of Qinghai-Tibetan Plateau’s grasslands increased over the past 20 years,suggesting that alpine grasslands might have functioned as a biomass C sink.(4) The above ground biomass C stock of Qinghai-Tibetan Plateau’s grasslands is strongly affected by precipitations,while the role of temperature is unclear.In addition,human activities are considered to be a crucial factor affecting grassland biomass C stock as well.Problems remain in the studies of biomass C stock in grassland ecosystem of Qinghai-Tibetan Plateau;more thorough investigations are needed in the fields such as data acquirement in the basic field measurements,optimization of algorithms for remotely-sensed vegetation indices,and process modeling of carbon-nitrogen-water coupling cycle in the alpine ecosystem.

DOI

[16]
Gill R A, Kelly R H, Parton W J,et al.., 2002. Using simple environmental variables to estimate belowground productivity in grasslands. Global Ecology & Biogeography, 11(1): 79-86.In many temperate and annual grasslands, above-ground net primary productivity (NPP) can be estimated by measuring peak above-ground biomass. Estimates of below-ground net primary productivity and, consequently, total net primary productivity, are more difficult. We addressed one of the three main objectives of the Global Primary Productivity Data Initiative for grassland systems to develop simple models or algorithms to estimate missing components of total system NPP. Any estimate of below-ground NPP (BNPP) requires an accounting of total root biomass, the percentage of living biomass and annual turnover of live roots. We derived a relationship using above-ground peak biomass and mean annual temperature as predictors of below-ground biomass (r~2 = 0.54; P = 0.01). The percentage of live material was 0.6, based on published values. We used three different functions to describe root turnover: constant, a direct function of above-ground biomass, or as a positive exponential relationship with mean annual temperature. We tested the various models against a large database of global grassland NPP and the constant turnover and direct function models were approximately equally descriptive (r~2 = 0.31 and 0.37), while the exponential function had a stronger correlation with the measured values (r~2 = 0.40) and had a better fit than the other two models at the productive end of the BNPP gradient. When applied to extensive data we assembled from two grassland sites with reliable estimates of total NPP, the direct function was most effective, especially at lower productivity sites. We provide some caveats for its use in systems that lie at the extremes of the grassland gradient and stress that there are large uncertainties associated with measured and modelled estimates of BNPP.

DOI

[17]
Guo L Y, Wu R, Wang Q C,et al.., 2008. Influence of climate change on grassland productivity in Xinghai County in the source regions of Yangtze River.Chinese Journal of Grassland, 30(2): 5-10. (in Chinese)Using 46 years data in grassland of Xinghai region in the source regions of Yangtze River,Yellow River and Lancang River,the variations characteristics of temperature and precipitation and its influence on the climatic potential grassland productivity were analyzed.The result indicated that the climatic tendency of Xinghai County is dry-warming,The mean temperature has been increased by 1.6℃ in the recent 46 years,the annual average temperature was ascending by 0.35℃ per 10 years,the tendency of the annual precipitation variation has not been increased obviously in the recent 46 years,the precipitation is increased by 2.1mm per 10 years,the tendency of the climatic potential grassland productivity shows a increasing trend.The precipitation is the key factor for climatic potential grassland productivity,it is benefit for dry matter circulation when the climate become warm and humid in the future,and the increase range is from 2% to 4%,but when the climate become cold and dry,the dry matter weight is decreased,the range is from 3% to 7%.If temperature has been rising by 1℃ to 2℃ and the precipitation increases by 10% to 20%,the climatic potential grassland productivity will increase by 2% to 4% in grassland of Xinghai region.

[18]
Guo P P, Yang D, Wang H,et al.., 2013. Climate change and its effects on climatic productivity in the Three-River Headwaters Region in 1960-2011.Chinese Journal of Ecology, 32(10): 2806-2814. (in Chinese)Based on the air temperature and precipitation data from 13 meteorological stations in the Three-River Headwaters(Yangtze River,Yellow River,and Lancang River) Region in 1960-2011,the climatic productivity in this Region was estimated by Thornthwaite Memorial model,and,through linear trend analysis,Kriging interpolation,Mann-Kendall test,and Empirical Orthogonal Function(EOF) resolution,the spatiotemporal variations of the air temperature,precipitation,and climatic productivity were analyzed,with the responses of the climatic productivity to climate change studied.In this Region,the mean annual temperature and the mean temperature in winter and in summer in recent 52 years were featured by repeated cold and warm fluctuations,but overall,presented an obvious rising trend.The annual precipitation had no obvious variation trend,but the precipitation in winter and in growth season had an increasing trend.Spatially,the precipitation had opposite variation trend in the east and west as well as in the south and north.The climatic productivity had less increase before the 21st century,but increased obviously since then.The correlation coefficient of climatic productivity and air temperature was larger than that of climatic productivity and precipitation,illustrating that air temperature was the main factor limiting the climatic productivity.The warm and wet climate increased the climatic productivity by 8.67%,but the cold and dry climate decreased the climatic productivity by 8.91%.In the future,the region's climate would generally be warm and wet,and thus,the climatic productivity would be increased,which would be conducive to the improvement of natural herbage yield.

[19]
Guo X Y, He Y, Shen Y P,et al.., 2006. Analysis of the terrestrial NPP based on the MODIS in the source regions of Yangtze and Yellow rivers from 2000 to 2004.Journal of Glaciology and Geocryology, 28(4): 512-518. (in Chinese)Based on the MOD17A3 data of NASA EOS/MODIS(Terra),the terrestrial NPP in the source regions of Yangtze and Yellow Rivers during 2000 to 2004 is analyzed.The annual NPP of the regions is 82.04 gC·m~-2 during the five years,with the maximum of 85.44 gC·m~-2 in 2002,and minimum of 78.04 gC·m~-2 in 2001.The NPP in the region of Yellow River is higher than that of Yangtze River,and the maximum,exceeding 250 gC·m~-2,occurs in the southeastern area of the source region of Yellow Rivers,and the minimum,less than 50 gC·m~-2,appears in the northwest of the source region of Yangtze River.The annual NPP is changing from year to year.The annual NPP of alpine meadow is the highest among all vegetations in the regions,and of course,an annual fluctuation appears.Regression analysis shows that temperature is the key factor controlling the terrestrial NPP in the source regions Yangtze and Yellow Rivers.

DOI

[20]
Han B, 2015. Modeling aboveground biomass of alpine grassland in the Three-River Headwaters Region based on remote sensing data [D]. Huainan: Anhui University of Science & Technology. (in Chinese)

[21]
Hidy D, Barcza Z, Haszpra L,et al.., 2012. Development of the Biome-BGC model for simulation of managed herbaceous ecosystems.Ecological Modelling, 226: 99-119.Apart from measurements, numerical models are the most convenient instruments to analyze the carbon and water balance of terrestrial ecosystems and their interactions with changing environmental conditions. The process-based Biome-BGC model is widely used to simulate the storage and flux of water, carbon, and nitrogen within the vegetation, litter, and soil of unmanaged terrestrial ecosystems. Considering herbaceous vegetation related simulations with Biome-BGC, soil moisture and growing season control on ecosystem functioning is inaccurate due to the simple soil hydrology and plant phenology representation within the model. Consequently, Biome-BGC has limited applicability in herbaceous ecosystems because (1) they are usually managed; (2) they are sensitive to soil processes, most of all hydrology; and (3) their carbon balance is closely connected with the growing season length. Our aim was to improve the applicability of Biome-BGC for managed herbaceous ecosystems by implementing several new modules, including management. A new index (heatsum growing season index) was defined to accurately estimate the first and the final days of the growing season. Instead of a simple bucket soil sub-model, a multilayer soil sub-model was implemented, which can handle the processes of runoff, diffusion and percolation. A new module was implemented to simulate the ecophysiological effect of drought stress on plant mortality. Mowing and grazing modules were integrated in order to quantify the functioning of managed ecosystems. After modifications, the Biome-BGC model was calibrated and validated using eddy covariance-based measurement data collected in Hungarian managed grassland ecosystems. Model calibration was performed based on the Bayes theorem. As a result of these developments and calibration, the performance of the model was substantially improved. Comparison with measurement-based estimate showed that the start and the end of the growing season are now predicted with an average accuracy of 5 and 4 days instead of 46 and 85 days as in the original model. Regarding the different sites and modeled fluxes (gross primary production, total ecosystem respiration, evapotranspiration), relative errors were between 18鈥60% using the original model and 10鈥18% using the developed model; squares of the correlation coefficients were between 0.02鈥0.49 using the original model and 0.50鈥0.81 using the developed model.

DOI

[22]
Jolly W M, Nemani R R, Running S W,et al.., 2005. A generalized, bioclimatic index to predict foliar phenology in response to climate.Global Change Biology, 11: 619-632.Abstract The phenological state of vegetation significantly affects exchanges of heat, mass, and momentum between the Earth's surface and the atmosphere. Although current patterns can be estimated from satellites, we lack the ability to predict future trends in response to climate change. We searched the literature for a common set of variables that might be combined into an index to quantify the greenness of vegetation throughout the year. We selected as variables: daylength (photoperiod), evaporative demand (vapor pressure deficit), and suboptimal (minimum) temperatures. For each variable we set threshold limits, within which the relative phenological performance of the vegetation was assumed to vary from inactive (0) to unconstrained (1). A combined Growing Season Index (GSI) was derived as the product of the three indices. Ten-day mean GSI values for nine widely dispersed ecosystems showed good agreement ( r >0.8) with the satellite-derived Normalized Difference Vegetation Index (NDVI). We also tested the model at a temperate deciduous forest by comparing model estimates with average field observations of leaf flush and leaf coloration. The mean absolute error of predictions at this site was 3 days for average leaf flush dates and 2 days for leaf coloration dates. Finally, we used this model to produce a global map that distinguishes major differences in regional phenological controls. The model appears sufficiently robust to reconstruct historical variation as well as to forecast future phenological responses to changing climatic conditions.

DOI

[23]
Kumar M, Monteith J L, 1981. Remote sensing of crop growth. In: Plants and the Daylight Spectrum. London: Academic Press, 133-144.

[24]
Li H M, 2010. Assessment of climate productivity of natural grassland in the Three Rivers Source Regions in Qinghai.Journal of Anhui Agricultural Sciences, 38(12): 6414-6416, 6460. (in Chinese)According to the annual temperature and precipitation data from 7 meteorological stations in the three rivers sources regions during the period of 1971-2004,the climate conditions in the three rivers sources regions were analyzed.Using the comprehensive mathematic model,the assessment model of climatic productivity of herbage on the natural grasslands in three rivers sources regions was established.The results showed that the climatic productivity in three rivers indicated a significant decrease trend and grassland potential productivity was greater.In a small range,the climatic productivity and the altitude showed a reverse relationship.When altitude increased 100 meters,the climatic productivity will drop 1 200-1 425 kg/ha.Precipitation was also a limiting factor for the climatic productivity of natural herbage in the three rivers sources regions.

[25]
Li H M, Zhang A L, 2014. Response of grassland climate productivity to climate change in Sanjiangyuan Regions.Journal of Huazhong Agricultural University (Social Sciences Edition), 1: 124-130. (in Chinese)Changes of the temperature and precipitation in Henan county,Gande county,Tongde county,Yushu county,Qumailai county,Zhiduo county and Maduo county of Sanjiangyuan regions in the recent 9 years and the response of grssland climate productivity to these changes were analyzed based on the meteorological data observed during the pieriod from 2002 to 2010,using the Tharnthwaite Memorial model and mathematical statistics method,the direction of productivity change and ecological economic development strategy of Sanjiangyuan regions were explored. The results revealed that,the temperature and precipitation both showed a certain upward trend,the climate trended to be a warming-weting pqttern in Sanjiangyuan regions,and grssland climate productivity was inclined to linear increase. There was a siginificant correlation between the grssland climate productivity and the temperature and precipitation,grass productivity is mainly affected by the impact of temperature,and precipitation aloso was the Key factor. The government should implemente ecological protection and ecological compensation,and enrichment the income source of herdsman to promote the regional ecological-economic sustainable development and the maintenance the ecological safety of Sanjiangyuan regions.

[26]
Li L, Zhu X D, Zhou L S,et al.., 2004. Climatic changes over headwater of the Three-River-Area and its effect on ecological environment.Meteorological Monthly, 30(8): 18-21. (in Chinese)Based on the data of air temperature,precipitation and evaporation at 16 meteorological stations in the headwater of the three-river-area from 1962 to 2001, the abnormal character of climate changes in recent 40 years and its effect on ecological environment are analyzed. The results show that air temperature appears to be an increasing tendency,precipitation is reducing and evaporation is increasing in the region. At the same time,arid climate and artificial activity leads to the hungriness of ecological environment,such as degenerating of the pastures,shrinking of the lakes,decrement of flow curve,deserting and losing of water and soil etc.

DOI

[27]
Lieth H, 1973. Primary production: Terrestrial ecosystem.Human Ecology, 1(4): 303-332.

[28]
Lieth H, Whittaker R H, 1975. Primary Production of the Biosphere. New York: Springer-Verlag Press, 1-10.

[29]
Lin H L, 2009. A new model of grassland net primary productivity (NPP) based on the integrated orderly classification system of grassland. In: Proceedings of the Sixth International Conference on Fuzzy Systems and Knowledge Discovery: 52-56.The natural grasslands play a significant but poorly recognized role in the global carbon cycle. Research on NPP of grassland ecosystems is and will continue to be important. In this respect, climate鈥搗egetation models have been drawing much attention and widely applied internationally owing to its simplicity. Grassland types and their distribution pattern could be corresponded with certain climatic types in a series of mathematical forms. Thus, the climate could be used to predict grassland types and their distribution. But there is not a NPP model based on a grassland classification system until now. This paper is to introduce a new model based on the Integrated Orderly Classification System of Grassland (IOCSG), named the classification indices model. The analysis demonstrates that use of the IOCSG and the model to study grassland succession and NPP associated with global climate change is a new research approach.

DOI

[30]
Liu J, Chen J M, Cihlar J,et al.., 1997. A process-based boreal ecosystem productivity simulator using remote sensing inputs.Remote Sensing of Environment, 62(2): 158-175.This paper describes a boreal ecosystems productivity simulator (BEPS) recently developed at the Canada Centre for Remote Sensing to assist in natural resources management and to estimate the carbon budget over Canadian landmass (10-10km). BEPS uses principles of FOREST biogeochemical cycles (FOREST-BGC) (Running and Coughlan, 1988) for quantifying the biophysical processes governing ecosystems productivity, but the original model is modified to better represent canopy radiation processes. A numerical scheme is developed to integrate different data types: remote sensing data at 1-km resolution in lambert conformal conic projection, daily meteorological data in Gaussian or longitude-latitude gridded systems, and soil data grouped in polygons. The processed remote sensing data required in the model are leaf area index (LAI) and land-cover type. The daily meteorological data include air temperature, incoming shortwave radiation, precipitation, and humidity. The soil-data input is the available water-holding capacity. The major outputs of BEPS include spatial fields of net primary productivity (NPP) and evapotranspiration. The NPP calculated by BEPS has been tested against biomass data obtained in Quebec, Canada. A time series of LAI over the growing season of 1993 in Quebec was derived by using 10-day composite normalized difference vegetation index images acquired by the advanced very high resolution radiometer at 1-km resolution (resampled). Soil polygon data were mosaicked, georeferenced, and rasterized in a geographic information system (ARC/INFO). With the use of the process-based model incorporating all major environmental variables affecting plant growth and development, detailed spatial distributions of NPP (annual and four seasons) in Quebec are shown in this paper. The accuracy of NPP calculation is estimated to be 60% for single pixels and 75% for 3x3 pixel areas (9 km). The modeled NPP ranges from 0.6 kg C/m/year at the southern border to 0.01 kg C/m/year at the northern limit of the province. The total annual NPP in Quebec is estimated to be 0.24 Gt C in 1993, which is about 0.3-0.4% of the global NPP.

DOI

[31]
Liu X F, Ren Z Y, Lin Z H,et al.., 2013. The spatial-temporal changes of vegetation coverage in the Three-River Headwater Region in recent 12 years.Acta Geographica Sinica, 68(7): 897-908. (in Chinese)The Three-River Headwater Region is the source areas of the Yangtze River,the Yellow River,and the Lancang River.The region is not only of key importance to the ecological security of China.Due to climate change and human activities,ecological degradation occurred in this region.Therefore,"The nature reserve of Three-River Source Regions" was established,and "The project of ecological protection and construction for the Three-River Headwater Nature Reserve" was implemented by Chinese government.This study,based on MODIS-NDVI and climate data,aims to analyze the spatial-temporal changes of vegetation coverage and its driving factors in the Three-River Headwater Region between 2000 and 2011 from three dimensions.Linear regression,Hurst index and partial correlation analysis were employed.The results showed that:(1) In the past 12 years(2000-2011),the NDVI of the study area increased,with a linear tendency being 1.2%/10a,of which the Yangtze and the Yellow river source regions presented an increasing trend,while the Lancang River source region showed a decreasing trend.(2) Vegetation coverage presented an obvious spatial difference in the Three-River Headwater Region,and NDVI frequency was featured by a bimodal structure.(3) The vegetation coverage improved area was larger than the degraded area,being 64.06% and 35.94% respectively in the 12 years,and presented an increase pattern in the north and a decrease one in the south.(4) The reverse characteristic of vegetation coverage change is significant.In future,the degradation trends will be mainly found in the Yangtze River Basin and north of the Yellow River,while the improving trend areas are mainly distributed in the Lancang River Basin.(5) The response of vegetation coverage to precipitation and potential evapotranspiration has time lag,while the temperature does not have.(6) The increased vegetation coverage is mainly attributed to the warm-wet climate change and the implementation of the ecological protection project.

[32]
Luo T X, Li W H, Zhu H Z, 2002. Estimated biomass and productivity of natural vegetation on the Tibetan Plateau.Ecological Applications, 12(4): 980-997.We developed a methodology for linking together data from forest and grassland inventories and ecological research sites, and provided a comprehensive report about live biomass and net primary productivity (NPP) on the Tibetan Plateau, the "Third Pole" of the earth where little information about plant biomass and production had been available outside China. Results were as follows. (1) The total live biomass of the natural vegetation in the Xizang (Tibet) Autonomous Region and Qinghai Province was estimated as 2.17 Gg dry mass, of which 72.9% was stored in forests where spruce-fir accounted for 65.1%. (2) The total annual NPP of the natural vegetation in these two administrative regions was estimated as 0.57 Gg dry mass, of which grasslands and forests accounted for 69.5% and 18.1%, respectively. (3) The alpine spruce-fir forests of the Tibetan Plateau had the highest maximum live biomass of the spruce-fir forests globally, with values up to 500-1600 Mg DM/ha (including both aboveground and belowground biomass). (4) The QZNPP model generally predicted NPP well for most of the biomes on the plateau, and simulated the various Chinese vegetation divisions. Model results showed a positive reinforcing effect of monsoon climate in China where the warmest season coincides with the wettest season. (5) The live biomass map for 117 counties of Xizang (Tibet) and Qinghai and the potential NPP map for the whole plateau both showed the same decreasing trend from southeast to northwest.

DOI

[33]
Luo T X, Pan Y, Ouyang H,et al.., 2004. Leaf area index and net primary productivity along subtropical to alpine gradients in the Tibetan Plateau.Global Ecology and Biogeography, 13(4): 345-358.Aim Our aims were to quantify climatic and soil controls on net primary productivity (NPP) and leaf area index (LAI) along subtropical to alpine gradients where the vegetation remains relatively undisturbed, and investigate whether NPP and LAI converge towards threshold-like logistic patterns associated with climatic and soil variables that would help us to verify and parameterize process models for predicting future ecosystem behaviour under global environmental change. Location Field data were collected from 22 sites along the Tibetan Alpine Vegetation Transects (TAVT) during 1999鈥2000. The TAVT included the altitudinal transect on the eastern slope of the Gongga Mountains in the Eastern Tibetan Plateau, with altitudes from 1900 m to 3700 m, and the longitudinal-latitudinal transect in the Central Tibetan Plateau, of approximately 1000 km length and 40 km width. Methods LAI was measured as the product of foliage biomass multiplied by the ratio of specific leaf area. NPP in forests and shrub communities was estimated as the sum of increases in standing crops of live vegetation using recent stem growth rate and leaf lifespan. NPP in grasslands was estimated from the above-ground maximum live biomass. We measured the soil organic carbon (C) and total and available nitrogen (N) contents and their pool sizes by conventional methods. Mean temperatures for the year, January and July and annual precipitation were estimated from available meteorological stations by interpolation or simulation. The threshold-like logistic function was used to model the relationships of LAI and NPP with climatic and soil variables. Results Geographically, NPP and LAI both significantly decreased with increasing latitude ( P < 0.02), but increased with increasing longitude ( P < 0.01). Altitudinal trends in NPP and LAI showed different patterns. NPP generally decreased with increasing altitude in a linear relationship ( r 2 = 0.73, P < 0.001), whereas LAI showed a negative quadratic relationship with altitude ( r 2 = 0.58, P < 0.001). Temperature and precipitation, singly or in combination, explained 60鈥68% of the NPP variation with logistic relationships, while the soil organic C and total N variables explained only 21鈥46% of the variation with simple linear regressions of log-transformed data. LAI showed significant logistic relationships with both climatic and soil variables, but the data from alpine spruce-fir sites diverged greatly from the modelled patterns associated with temperature and precipitation. Soil organic C storage had the strongest correlation with LAI ( r 2 = 0.68, P < 0.001). Main conclusions In response to climatic gradients along the TAVT, LAI and NPP across diverse vegetation types converged towards threshold-like logistic patterns consistent with the general distribution patterns of live biomass both above-ground and below-ground found in our earlier studies. Our analysis further revealed that climatic factors strongly limited the NPP variations along the TAVT because the precipitation gradient characterized not only the vegetation distribution but also the soil N conditions of the natural ecosystems. LAI generally increased with increasing precipitation and was well correlated with soil organic C and total N variables. The interaction between LAI growth and soil N availability would appear to have important implications for ecosystem structure and function of alpine spruce-fir forests. Convergence towards logistic patterns in dry matter production of plants in the TAVT suggests that alpine plant growth would increase in a nonlinear response to global warming.

DOI

[34]
Ma A N, Yu G R, He N P,et al.., 2014. Above- and below-ground biomass relationships in China’s grassland vegetation.Quaternary Sciences, 34(4): 769-776. (in Chinese)Large grassland biomass stores in belowground,which plays a significant role in ecosystem carbon store and carbon sequestration.Due to the lack of below-ground biomass data,Root:shoot ratio(R/S) or the relationship between above-ground biomass(AGB) and below-ground biomass(BGB) have been used to estimate belowground biomass.By available published grassland biomass data in 2004~2010,the paper explored the R/S and the relationship between above- and below-ground biomass in six grassland types,such as alpine meadow,alpine steppe,temperate desert steppe,temperate meadow steppe,montane meadow,temperate steppe.The results showed that R/S was significantly different in all grassland types(F = 3.542,p0.01),and R/S of montane meadow was significantly different from other grassland types(p0.01).Temperate meadow steppe and temperate desert steppe had relatively higher R/S,the means of which were 7.0 and 6.8,respectively.There were evidence of positive effects of mean annual precipitation on AGB and BGB,and negative effects on R/S.The effects of mean annual temperature on AGB,BGB and R/S were different with that of mean annual precipitation.Although mean annual temperature had the positive effects on AGB,the effects on BGB and R/S were not significant.In order the better to analyze how to estimate BGB based on AGB,the paper explored the relationship between above-and below-ground biomass.The results showed that BGB was significantly positive correlated with AGB in alpine steppe(R~2= 0.67) temperate desert steppe(R~2=0.36) alpine meadow(R~2=0.13).The power function fitted well with the relationship between BGB and AGB for these three types of grassland.The relationship between above-and below-ground biomass was not found in other three types of grassland.It was evident that both R/S and the relationship between AGB and BGB must be considered together when BGB was estimated.

[35]
Ma X L, 2008. The monitoring of rangeland resources productivity of Qinghai Province based on 3S technologies [D]. Lanzhou: Lanzhou University. (in Chinese)

[36]
Monteith J L, 1972. Solar radiation and productivity in tropical ecosystems.Journal of Applied Ecology, 9: 747-766.CiteSeerX - Scientific documents that cite the following paper: Solar-radiation and productivity in tropical ecosystems

DOI

[37]
Piao S L, Fang J Y, He J S,et al.., 2004. Spatial distribution of grassland biomass in China.Acta Phytoecologica Sinica, 28(4): 491-498. (in Chinese)Estimating carbon storage in terrestrial ecosystems has been a central focus of research over the past two decades because of its importance to terrestrial carbon cycles and ecosystem processes. As one of the most widespread ecosystem types, China's grasslands play an important role in global change research. The grasslands in China, which are distributed primarily throughout the temperate regions and on the Tibetan Plateau, were classified into 17 community types. In the present study, a statistical model was established to estimate grassland biomass and its geographical distribution in China based on a grassland inventory data set and remote sensing data (Normalized Difference Vegetation Index) using GIS and RS techniques. We found that there was a significant correlation between aboveground biomass density and the maximum annual NDVI when expressed as a power function (R 2=0.71, p0.001). The aboveground biomass was estimated to be 146.16 TgC (1Tg=10 12 g) and belowground biomass was estimated as 898.60 TgC (6.15 times of the above biomass) for a total biomass of 1 044.76 TgC. This value accounts for about 2.1%-3.7% of the world's grassland biomass. The grassland biomass is distributed primarily in the arid and semiarid regions of Northern China and the Qinghai-Xizang Plateau. The average biomass density of China's grasslands was 315.24 gC路m -2, smaller than the world average. The aboveground biomass density decreases from southeastern China toward the northwest corresponding with changes in precipitation and temperature. Furthermore, aboveground biomass density reached the lowest levels at 1 350 m elevation and peak levels at 3 750 m above sea level which most likely is related to China's three-step topographical background. The ratio of total biomass of grassland to forest biomass in China is 1/4, much higher than that of the world, suggesting a greater contribution of grasslands to China's carbon pool.

DOI

[38]
Piao S, Tan K, Nan H,et al.., 2012. Impacts of climate and CO2 changes on the vegetation growth and carbon balance of Qinghai-Tibetan grasslands over the past five decades.Global and Planetary Change, 98/99: 73-80.78 We investigated changes in NPP and NEP of Qinghai–Tibetan grasslands from 1961 to 2009. 78 A systematically calibrated process-based ecosystem model called ORCHIDEE was applied. 78 Qinghai–Tibetan grassland NPP significantly increased with a rate of 1.9Tg Cyr612 since 1961. 78 NEP increased from a net carbon source of 610.5Tg Cyr611 in the 1960s to a net carbon sink of 21.8Tg Cyr611 in the 2000s.

DOI

[39]
Potter C S, Randerson J T, Field C B,et al.., 1993. Terrestrial ecosystem production: A process model based on global satellite and surface data.Global Biogeochemical Cycles, 7: 811-841.This paper presents a modeling approach aimed at seasonal resolution of global climatic and edaphic controls on patterns of terrestrial ecosystem production and soil microbial respiration. We use satellite imagery (Advanced Very High Resolution Radiometer and International Satellite Cloud Climatology Project solar radiation), along with historical climate (monthly temperature and precipitation) and soil attributes (texture, C and N contents) from global (100°) data sets as model inputs. The Carnegie-Ames-Stanford approach (CASA) Biosphere model runs on a monthly time interval to simulate seasonal patterns in net plant carbon fixation, biomass and nutrient allocation, litterfall, soil nitrogen mineralization, and microbial CO2 production. The model estimate of global terrestrial net primary production is 48 Pg C yr0908081 with a maximum light use efficiency of 0.39 g C MJ0908081PAR. Over 70% of terrestrial net production takes place between 3000°N and 3000°S latitude. Steady state pools of standing litter represent global storage of around 174 Pg C (94 and 80 Pg C in nonwoody and woody pools, respectively), whereas the pool of soil C in the top 0.3 m that is turning over on decadal time scales comprises 300 Pg C. Seasonal variations in atmospheric CO2 concentrations from three stations in the Geophysical Monitoring for Climate Change Flask Sampling Network correlate significantly with estimated net ecosystem production values averaged over 5000°0900098000° N, 1000°0900093000° N, and 000°0900091000° N.

DOI

[40]
Qi W W, Niu H S, Wang S P,et al.., 2012. Simulation of effects of warming on carbon budget in alpine meadow ecosystem on the Tibetan Plateau.Acta Ecologica Sinica, 32(6): 1713-1722. (in Chinese)Low temperature is widely regarded as the most important limiting factor in the alpine meadow ecosystem.The alpine meadow ecosystem represents a huge carbon pool that is witnessing rapid increases in air temperature.While warming may alleviate the low-temperature limitation to primary production,warming may decrease soil moisture by increasing the evaporation level and may stimulate ecosystem respiration.In addition,N may become a limiting factor if primary production enhances.This study focuses on how warming affects the H2O and N cycles,and how changes in these cycles affects carbon balance.First,the Biome-BGC model(V.4.2) is parameterized and validated using real time data from the Haibei Alpine Meadow Ecosystem Research Station,Chinese Academy of Sciences and then this model is used to assess the effects of warming.In the model increasing air temperature was set at 1.2鈥1.7鈩 based on the previous results of the free-air temperature enhancement(FATE) experiment at the station.The simulated results showed warming increases evapotranspiration and decreased soil moisture in the growing seasons,while slightly increasing soil moisture in non-growing season.Warming slightly but significantly increases the litter's decomposition rate,and increases the annual concentration of inorganic N in soil by 7.9%.Warming promoteed both gross primary production(GPP) and heterotrophic respiration(RH).The increases of SLAI(specific leaf area index) and assimilation rates leaded to increased GPP.The GPP increased by up to 34.3% every year.Because of the enhancement of microbial activity and increased litter input,the warming increased average annual RH by 17.2%.RH increased by 24.9% during the non-growing seasons,whereas it only increases by 12.3% due to decreasing water content in soils during the growing seasons.The GPP increase surpassed RH during the growing seasons.Warming increased annual mean NEE(net absorption) by 29.6%.The results suggest that in the future warming scenario,the alpine meadow ecosystem may remain a weak carbon sink.Warming plays the most important role in the change of carbon flux.Carbon flux is also influenced by water loss caused by warming,and the role of water loss in some processes was prominent.The balance between the effects of warming on litter decomposition and on plant absorbing resulted in increase of soil inorganic N.N availability and H2O are not limiting factors on plant growth in the short term,but this may change in the long-term;this should be studied further in the future.Comparisons with newly published simulation results related to the Tibetan Plateau are also discussed.

DOI

[41]
Qin D H, 2014. Ecological protection and sustainable development in the Three-River Headwater Region. Beijing: Science Press, 1-5. (in Chinese)

[42]
Ruimy A, Saugier B, Dedieu G, 1994. Methodology for the estimation of terrestrial net primary production from remotely sensed data.Journal of Geophysical Research: Atmospheres (1984-2012), 99(D3): 5263-5283.

[43]
Running S W, 2012. A measurable planetary boundary for the biosphere.Science, 337(6101): 1458-1459.Terrestrial net primary (plant) production provides a measurable boundary for human consumption of Earth's biological resources.

DOI PMID

[44]
Running S W, Thornton P E, Nemani R et al., 2000. Global terrestrial gross and net primary productivity from the earth observing system. In: Sala O, Jackson R, Mooney H. Methods in Ecosystem Science. New York: Springer Verlag, 44-57.

[45]
Running S W, Zhao M S, 2015. Daily GPP and annual NPP (MOD17A2/A3) Products User’s Guide (version 3.0). Missoula, USA: The University of Montana.

[46]
Sellers P J, Tucker C J, Collatz G J, 1996. A revised land surface parameterization (SiB2) for atmospheric GCMs Part II: The generation of global fields of terrestrial biophysical parameters from satellite data.Journal of Climate, 9(4): 706-737.The global parameter fields used in the revised Simple Biosphere Model (SiB2) of Sellers et al. are reviewed. The most important innovation over the earlier SiB 1 parameter set of Dorman and Sellers is the use of satellite data to specify the time-varying phenological properties of FPAR, leaf area index, and canopy greenness fraction. This was done by processing a monthly 1掳 by 1掳 normalized difference vegetation index (NDVI) dataset obtained from Advanced Very High Resolution Radiometer red and near-infrared data. Corrections were applied to the source NDVI dataset to account for (i) obvious anomalies in the data time series, (ii) the effect of variations in solar zenith angle, (iii) data dropouts in cold regions where a temperature threshold procedure designed to screen for clouds also eliminated cold land surface points, and (iv) persistent cloud cover in the Tropics. An outline of the procedures for calculating the land surface parameters from the corrected NDVI dataset is given, and a brief description is provided of source material, mainly derived from in situ observations, that was used in addition to the NDVI data. The datasets summarized in this paper should be superior to prescriptions currently used in most land surface parameterizations in that the spatial and temporal dynamics of key land surface parameters, in particular those related to vegetation, are obtained directly from a consistent set of global-scale observations instead of being inferred from a variety of survey-based land-cover classifications.

DOI

[47]
Shao Q Q, Fan J W, 2012. Integrated Monitoring and Evaluation of Ecosystems in the Three-River Headwater Region. Beijing: Science Press, 15-29, 167-172, 479. (in Chinese)

[48]
Shao Q Q, Zhao Z P, Liu J Y,et al.., 2010. The characteristics of land cover and macroscopical ecology changes in the source region of three rivers on Qinghai-Tibet Plateau during last 30 years.Geographical Research, 29(8): 1439-1451. (in Chinese)We obtained four phases of land cover spatial data sets by interpreting MSS images of middle and late 1970s and three phases of TM images of late 1980s, 2004 and 2008 based on field investigation in Three Rivers' Source Region. We analyzed the temporal and spatial characteristics of land cover and macro ecological changes in Three Rivers' Source Region in Qinghai-Tibet plateau since middle and late 1970s. Indicated by land cover condition index change rate and land cover change index, land cover and macroscopical ecological condition degenerated (7090 period Zc 610.63, LCCI 610.58)-obviously degenerated (9004 period, Zc 610.94, LCCI 611.76)-slightly meliorated (0408 period, Zc 0.06, LCCI 0.33). This course was jointly driven by climate change, grassland stocking pressure and implement of ecological construction project.

DOI

[49]
Song F L, 2013. Challenges for the Three-River Headwater Region. The Economic Observer, 2013-1-14. (in Chinese)

[50]
Sun Q L, Feng X F, Liu M X,et al.., 2015. Estimation and analysis of net primary productivity in Wuling mountainous area based on remote sensing.Journal of Natural Resources, 30(10): 1628-1640. (in Chinese)Using the Ecosystem Productivity Simulator(BEPS) model which combines remote sensing and ecosystem process simulations to quantify the terrestrial carbon and water cycle,we estimated the NPP of Wuling mountainous area in 2010. Based on the survey data of forest,statistical data of grain yield, MODIS NPP data, and the published estimated NPP and surveyed NPP data of each vegetation type, we validated the results of NPP simulation. After exploring the spatial pattern and monthly variation trends of NPP in 2010, the relations between annual NPP and primary terrain factors including altitude, slope and aspect were analyzed specifically.Results showed that: 1) The mean value of annual NPP over the whole study area in 2010 was555.17 g C/(m2路 a), and the total annual NPP was 92.96 Tg C. Compared with that of MODIS NPP, the spatial pattern of simulated NPP was more reasonable, and it reflected more accurate topographical information. 2) Monthly NPP changed with seasons. The monthly NPPs of different vegetation types within our study area in 2010 all displayed bimodal distributions.Among them, the NPPs of shrub and evergreen broadleaf forest had the largest amplitude of variation in the year, while the NPP of crop had the smallest amplitude of variation. 3) With the altitude increasing, NPP increased first and then decreased quickly. As to the slope, NPP increased with the slope when it is gentle, and then decreased slowly when the slope getting steeper, but when the slope is greater than a certain value, NPP began to increase again.Additionally, among all the aspects of the slope, the mean NPP on the south slope was the highest, while that on the north slope was the lowest.

DOI

[51]
Tang H Y, Xiao F J, Zhang Q,et al.., 2006. Vegetation change and its response to climate change in Three-River Source Region.Advances in Climate Change Research, 2(4): 177-180. (in Chinese)Key Words】:

[52]
Tian D X, Zeng X D, 2015. Research progress in dynamic vegetation model phenology schemes.Climatic and Environmental Research, 20(6): 726-734.

[53]
Tian H Q, Liu M L, Zhang C,et al.., 2010. The dynamic land ecosystem model (DLEM) for simulating terrestrial processes and interactions in the context of multifactor global change.Acta Geographica Sinica, 65(9): 1027-1047. (in Chinese)The Dynamic Land Ecosystem Model (DLEM) was developed to meet critical needs for understanding and predicting the large-scale patterns and processes of terrestrial ecosystems and continental margins, and complex interactions among climate, ecosystem and human in the context of multifactor global change. The DLEM couples major biophysical, biogeochemical, vegetation dynamical and land use processes, and works at multiple scales in time step ranging from daily to yearly and spatial resolution from meters to kilometers, from region to globe. The DLEM is characterized by the following features: 1) multiple factors driven; 2) fully-coupled cycles of carbon, nitrogen and water; 3) concurrently simulation of major greenhouse gases (CO2, CH4, N2O, H2O); 4) dynamically tracking changes in land cover/use and vegetation distribution. The model has been validated against site-specific measurements across the globe and applied at various scales. In this paper, we have briefly addressed model structure, parameters, key processes and major input/output variables. As a case study, we presented the simulated global fluxes of net primary productivity, evapotranspiration and methane during 1948-2005 and their spatial patterns in the year 2000. We also identified major gaps in terrestrial ecosystem modeling and field observations, and further discussed some critical future research needs.

DOI

[54]
Wang C, 2013. Study on simulation methods of alpine grassland net primary productivity in Three Rivers Source Region of Tibetan Plateau, China [D]. Lanzhou: Lanzhou University. (in Chinese)

[55]
Wang J B, Liu J Y, Shao Q Q,et al.., 2009. Spatial-temporal patterns of net primary productivity for 1988-2004 based on GLOPEM-CEVSA model in the “Three-River Headwaters” region of Qinghai Province, China.Chinese Journal of Plant Ecology, 33(2): 254-269. (in Chinese)Aims The "Three-River Headwaters" Region, as the headwaters of important rivers and an area sensitive to global climate change, has become a recent research focus. Our objective is to model and assess the spatial-temporal pattern of net primary production (NPP) and its control mechanisms. Methods We applied the GLOPEM-CEVSA model, which has been validated with carbon flux observation in forest, grassland and cropland. The main inputs are spatially interpolated meteorological data and fraction of photosynthetically active radiation absorbed by vegetation canopy, using 1 km resolution of the Advanced Very High Resolution Radiometer of the National Oceanic and Atmospheric Administration in 1988–2004. Important findings Modeled NPP ranged from 36.13 gC·m–2·a–1 for desert to 267.90 gC·m–2·a–1 for forest, and the mean was 143.17 gC·m–2·a–1. Spatially, NPP decreased from southeast to northwest, as influenced by geography and climate. Variability of NPP was the largest in desert (41.75%), was similar for cropland (25.93%), grassland (22.31%) and wetland (24.72%) and was the smallest in forest (20.79%). During 1988–2004, NPP increased at the rate of 7.8–28.8 gC·m–2 per 10 years in the western area, but decreased 13.1–42.8 gC·m–2 per 10 years in the central and eastern areas. At 99 and 95% significance levels, the area with NPP increasing (regression slope b0) was 13.43% and 20.34%, respectively, of the whole area, and mainly distributed in the western region, while the area with NPP decreasing (b0) was 0.75% and 3.77%, respectively, of the whole area and distributed in the central and western areas and was more concentrated near the main rivers at higher significance levels. Increases of NPP in the western area may have been affected by increasing temperature and precipitation, while central and eastern areas may have been impacted by human activities, especially along the Yangtze, Yellow and other rivers with intensive human habitation and where the warmer and drier climate has led to more serious grassland degradation. The effects of human activities on NPP were not analyzed because data on human activity were unavailable and spatial interpolation of the impact is difficult.

[56]
Wang W, Peng S S, Fang J Y, 2008. Biomass distribution of natural grasslands and its response to climate change in North China.Arid Zone Research, 25(1): 91-97. (in Chinese)

[57]
Wei Y X, Wang L W, 2010. The study on simulating light use efficiency of vegetation in Qinghai Province.Acta Ecologica Sinica, 30(19): 5209-5216. (in Chinese)In this paper,advantages of MODIS-PSN,CASA,GLO-PEM,VPM model based on light use efficiency(LUE)are used for reference,and typical characteristics of vegetation LUE and environment in the study area are taking into account.Based on relative literature and measured NPP,the maximum LUE values of main vegetation in the study area are simulated.The maximum LUE values of grassland and shrubland are calculated through three steps in order to reduce calculating errors.Based on Beer's law,environmental stress factors of LUE is calculated by evaporative fraction algorithm and TEM model.The LUE values of main vegetation in Qinghai province are simulated,and their spatial distributions and dynamic changes are analyzed.The result indicates that the mean LUE value ranges from 0.026gC/MJ to 0.403gC/MJ in 2006 in Qinghai province,and the average is 0.096gC/MJ.The LUE of Vegetation with obvious zone distributions gradually increases from north-west to south-east.The LUE value in Qinghai province largely varies with the season.The monthly mean LUE of vegetation changes from 0.057gC/MJ to 0.157gC/MJ in 2006,and the highest appears in July.The main accumulative period of LUE is from May to September.

DOI

[58]
White M A, Thornton P E, Running S W,et al.., 2000. Parameterization and sensitivity analysis of the Biome-BGC terrestrial ecosystem model: Net primary production controls.Earth Interactions, 4(3): 1-85.

[59]
Wo X, Wu L C, Zhang J P,et al.., 2014. Estimation of net primary production in the Three-River Headwater Region using CASA model.Journal of Arid Land Resources and Environment, 28(9): 45-50. (in Chinese)

[60]
Wu H, An R, Li X X,et al.., 2011a. Remote sensing monitoring of grassland degradation based on NPP change in the Maduo County of the sources region of Yellow River.Pratacultural Science, 28(4): 536-542. (in Chinese)Maduo County is a typical grassland degradation area in the sources region of Yellow River or even in the sources region of the Sanjiangyuan(the Yangtze River,the Yellow River,and the Lancang River).In this study,the net primary productivity(NPP) of the grassland was derived from the Landsat TM data and the relative auxiliary data in 2008 based on CASA model.Furthermore,taking the reduced percentage of the NPP as measurement index,grassland degradation information was obtained.Compared the grassland degradation information in 2008 to those in 1997,this study showed that the area of severely degraded grassland decreased by 5 944 km2;and distributing in the north region of Maduo County.The monitoring results also showed that grassland degradation level was related to grassland type.Alione steppe was severe degradation,and alpine meadow was middle degradation,wetland was light degradation.

[61]
Wu Y, Wu J, Deng Y,et al.., 2011b. Comprehensive assessments of root biomass and production in a Kobresia humilis meadow on the Qinghai-Tibetan Plateau.Plant Soil, 338: 497-510.Alpine meadow covers ca. 700,000km 2 with an extreme altitude range from 3200m to 5200m. It is the most widely distributed vegetation on the vast Qinghai-Tibetan Plateau. Previous studies suggest that meadow ecosystems play the most important role in both uptake and storage of carbon in the plateau. The ecosystem has been considered currently as an active “CO 2 sink”, in which roots may contribute a very important part, because of the large root biomass, for storage and translocation of carbon to soil. To bridge the gap between the potential importance and few experimental data, root systems, root biomass, turnover rate, and net primary production were investigated in a Kobresia humilis meadow on the plateau during the growing season from May to September in 2008 and 2009. We hypothesized that BNPP/NPP of the alpine meadow would be more than 50%, and that small diameter roots sampled in ingrowth cores have a shorter lifespan than the lager diameter roots, moreover we expected that roots in surface soils would turn over more quickly than those in deeper soil layers. The mean root mass in the 0–20cm soil layer, investigated by the sequential coring method, was 199565±65479g65m 612 and 159565±65254g65m 612 in growing season of 2008 and 2009, respectively. And the mean fine root biomass in ingrowth cores of the same soil layer was 11965±6537g65m 612 and 19665±6545g65m 612 in the 2years. Annual total NPP was 12387kg65ha 611 65year 611 , in which 53% was allocated to roots. In addition, fine roots accounted for 33% of belowground NPP and 18% of the total NPP, respectively. Root turnover rate was 0.52year 611 for bulk roots and 0.74year 611 for fine roots. Furthermore, roots turnover was faster in surface than in deeper soil layers. The results confirmed the important role of roots in carbon storage and turnover in the alpine meadow ecosystem. It also suggested the necessity of separating fine roots from the whole root system for a better understanding of root turnover rate and its response to environmental factors.

DOI

[62]
Wu Y B, Che R X, Ma S,et al.., 2014. Estimation of root production and turnover in an alpine meadow: Comparison of three measurement methods.Acta Ecologica Sinica, 34(13): 3529-3537. (in Chinese)Plant roots are the most important carbon( C) sink and nutrient pool in the terrestrial ecosystem. Root turnover is the key process in belowground C and nitrogen cycles,and it profoundly affects how belowground ecosystems respond to global climate change. Therefore,an accurate estimation of the plant root turnover rate is crucial for reliable predictions of the structure and function of ecosystems in the future. Research on fine roots and the methods to analyze them have been hot spots in the field of root ecology. However,the suitability of the different methods,and the comparability of the results obtained from them,have rarely been assessed based on data from one study site. Grassland root systems,especially fine root turnover,have also been poorly studied鈥攖hese topics have remained largely unexplored for herbaceous plants in China.The Qinghai-Tibetan Plateau in western China was one of the first areas to be affected by climate change,because its ecosystems are fragile and sensitive to changes in climatic conditions. The study was conducted in a Kobresia humilis meadow,one of the dominant vegetation types on the Qinghai-Tibetan Plateau. Previous studies suggested that meadow ecosystems play the most important role in both uptake and storage of C in the plateau. The ecosystem is considered to be an active CO2 sink. Roots may be one of the most important components of this sink,because root systems have a large biomassfor storage and translocation of C into soil. To assess the suitability of the different measurement methods,we used sequential coring,ingrowth cores,and a minirhizotron to investigate the root production and turnover rates. To test the effects of the different calculation methods on the value of the root production and turnover rate,we used the max-min,integral,decision matrix, and Kaplan-Meier methods to calculate the root production and turnover rate from the measurements obtained using the three methods. The results of the comparative analysis showed that the integral calculation method was suitable to estimate the root production using data from the sequential coring method,while the decision matrix method was more suitable for calculations using data obtained by the ingrowth core method. In 2009,the root turnover rate was determined to be 0. 36 a-1using the sequential coring method,but 1. 44 times higher,0. 52 a-1,using the ingrowth core method. The calculation methods more strongly affected the results obtained using a minirhizotron. The turnover rate determined using the integral method was 0. 84 a-1,2. 33 times that determined using the sequential coring method and 1.62 times that determined using the ingrowth core method. The root turnover rate was estimated at 3. 41 a-1by Kaplan-Meier analysis,much higher than the values obtained using the sequential coring and ingrowth core methods. In conclusion,at this study site,the lowest root turnover rate was determined by the sequential coring method,the mid-range rate was determined using the ingrowth core method,and the highest rate was determined using a minirhizotron. The methods of data analysis will also affect the variations among results obtained using these three methods. Our results provide a basis to understand the roles of root production and turnover in the Kobresia humilis meadow and in the C and nutrient cycles in this ecosystem.

DOI

[63]
Xiao T, Liu J Y, Shao Q Q, 2009. A simulation on changes in vegetation productivity in “Three River Sources” nature reserve, Qinghai province over past 20 years.Journal of Geo-information Science, 11(5): 557-565. (in Chinese)As the largest nature reserve of China,"Three River Sources" Nature Reserve plays an important role in protecting ecological security.The change of NPP,which is a vital indicator for ecosystems,is still concerned by us.We utilize NPP,which is simulated by GLOPEM model,to calculate the difference of NPP between both inside and outside of the protected areas.We define the buffer region of a protected area as the outside.The outsides we defined are used to calculate mean value of NPP to subtract from the mean NPP of insides.Also we calculate the difference in three periods,i.e.1988-2008,1988-2004 and 2004-2008.If the differences of insides and outsides in 1988-2004 are lower than the value in 2004-2008,we define it as turning better,especially when the value in 1988-2004 is negative but is positive in 2004-2008,we call it notable better.After that,we find that there are 13 protected areas better and 2 notable better than before,and only 5 protected areas become worse than before.In the 5 regions there is a snow-mountain protected area,although the result in this region is worse than before,it does not mean the ecosystem is worse,in contrary it means the environment is turning better because of the spread of main ecosystem decrease the NPP.We conclude that in this region,since the implementation of ecosystem engineering,NPP rise obviously with the rate of 0.47 gC m-2 yr-1,and most protected areas are turning better.

DOI

[64]
Xu H H, 2010. Effects of different grazing systems on carbon balance in Stipa breviflora desert steppe [D]. Beijing: Chinese Academy of Agricultural Sciences. (in Chinese)

[65]
Yan L, Zhou G S, Wang Y H,et al.., 2015. The spatial and temporal dynamics of carbon budget in the alpine grasslands on the Qinghai-Tibetan Plateau using the Terrestrial Ecosystem Model.Journal of Cleaner Production, 107(16): 195-201.Grasslands in Tibetan Plateau play an important role in carbon emission reduction. Accurately evaluating the carbon budget of alpine grassland ecosystems is of great importance. Based on the parameterization and validation of a process-based ecosystem model (Terrestrial Ecosystem Model, TEM5.0), we analyze temporal and spatial dynamics and patterns of grassland ecosystem carbon emission and sequestration of Tibetan Plateau in China from 1961 to 2010. Alpine grasslands act as a carbon sink with mean annual value of 10.12TgCyr 611 during the past 50 years. The alpine meadow contributes most to the sink at 9.04TgCyr 611 , while the alpine steppe only contributes 2.03TgCyr 611 . 83.7% of the total area trends to be carbon sink and only 0.2% of the region showed no significant trend. Furthermore, the annual net ecosystem productivity shows significantly positive relationship with increasing temperature and atmosphere CO 2 concentration, but it shows no significant relationship with precipitation. Alpine grasslands in Qinghai-Tibetan Plateau is a carbon sink and sequestrate totally 520TgC from 1961 to 2010. The carbon budget of alpine experienced dramatically spatial and temporal dynamics during past 50 years. Inter-annual variability of the net ecosystem productivity mainly depends on different sensitivities of net primary productivity and heterotrophic respiration to temperature and precipitation variability. Temperature and atmosphere CO 2 concentration are main driving forces of carbon budget dynamics of grassland ecosystems in Qinghai-Tibetan Plateau during 1961–2010.

DOI

[66]
Yang Y H, Fang J Y, Ji C J,et al.., 2009. Above- and belowground biomass allocation in Tibetan grasslands.Journal of Vegetation Science, 20(1): 177-184.Abstract Question: Optimal partitioning and isometric allocation are two important hypotheses in plant biomass allocation. We tested these two hypotheses at the community level, using field observations from Tibetan grasslands. Location: Qinghai-Tibetan Plateau, China. Methods: We investigated allocation between above- and belowground biomass in alpine grasslands and its relationship with environmental factors using data collected from 141 sites across the plateau during 2001-2005. We used reduced major axis (RMA) regression and general linear models (GLM) to perform data analysis. Results: The median values of aboveground biomass ( M A ), belowground biomass ( M B ), and root:shoot (R:S) ratio in alpine grasslands were 59.7, 330.5gm 鈭2 , and 5.8, respectively. About 90% of total root biomass occurred in the top 30cm of soil, with a larger proportion in the alpine meadow than in the alpine steppe (96 versus 86%). As soil nitrogen and soil moisture increased, both M A and M B increased, but R:S ratio did not show a significant change. M A scaled as 0.92 the power of M B , with 95% confidence intervals of 0.82-1.02. The slope of the isometric relationship between log M A and log M B did not differ significantly between alpine steppe and alpine meadow. The isometric relationship was also independent of soil nitrogen and soil moisture. Conclusions: Our results support the isometric allocation hypothesis for the M A versus M B relationship in Tibetan grasslands.

DOI

[67]
Yang Y H, Piao S L, 2006. Variations in grassland vegetation cover in relation to climatic factors on the Tibetan Plateau.Journal of Plant Ecology, 30(1): 1-8. (in Chinese)To advance our understanding of the effects of climate change on grassland ecosystems, we used a time series (1982-1999) data set of the Normalized Difference Vegetation Index (NDVI) together with historical climate data to analyze interannual variations in grassland vegetation cover and explore the relationships between NDVI and climatic factors on the grasslands of the Tibetan Plateau. The NDVI increased significantly by a ratio of 0.41% a -1 and a magnitude of 0.001 0 a -1 during the growing season (p=0.015). An increase in NDVI during the growing season resulted from both the advanced growing season and accelerated vegetation activity. The largest NDVI increase was in the spring with a ratio of 0.92% a -1 and a magnitude of 0.001 4 a -1 . The NDVI increase in the summer was a secondary contributor to the NDVI increase during the growing season with a ratio of 0.37% a -1 and a magnitude of 0.001 0 a -1 . In the spring, the NDVI increased significantly in the alpine grasslands (alpine meadow and alpine steppe) and temperate steppe (p 0.01 ; p= 0.001 ; p=0.002). During the summer, a significant NDVI increase was found in alpine meadows (p= 0.027 ). However, the NDVI increase in alpine and temperate steppe was not significant (p=0.106; p=0.087 ). In the autumn, no significant increase was found in the three grasslands (p=0.585; p= 0.461 ; p=0.143). In the spring, the NDVI increase in three grasslands was corresponded to an increase in temperature. In the summer, the NDVI was related to temperature and sensitive to precipitation in the spring in the alpine grasslands (alpine meadow and alpine steppe). However, no significant statistical relationship was found between NDVI and climatic factors in temperate steppe. Significant lagged correlations between precipitation and NDVI were found for alpine grasslands (alpine meadow, alpine steppe).

DOI

[68]
Ye J S, 2010. Response of vegetation net primary productivity to climate change on the Tibetan Plateau. Lanzhou: Lanzhou University. (in Chinese)

[69]
Zhang G L, Zhang Y J, Dong J W,et al.., 2013. Green-up dates in the Tibetan Plateau have continuously advanced from 1982 to 2011.PNAS, 110(11): 4309-4314.As the Earth's third pole, the Tibetan Plateau has experienced a pronounced warming in the past decades. Recent studies reported that the start of the vegetation growing season (SOS) in the Plateau showed an advancing trend from 1982 to the late 1990s and a delay from the late 1990s to 2006. However, the findings regarding the SOS delay in the later period have been questioned, and the reasons causing the delay remain unknown. Here we explored the alpine vegetation SOS in the Plateau from 1982 to 2011 by integrating three long-term time-series datasets of Normalized Difference Vegetation Index (NDVI): Global Inventory Modeling and Mapping Studies (GIMMS, 1982-2006), SPOT VEGETATION (SPOT-VGT, 1998-2011), and Moderate Resolution Imaging Spectroradiometer (MODIS, 2000-2011). We found GIMMS NDVI in 2001-2006 differed substantially from SPOT-VGT and MODIS NDVIs and may have severe data quality issues in most parts of the western Plateau. By merging GIMMS-based SOSs from 1982 to 2000 with SPOT-VGT-based SOSs from 2001 to 2011 we found the alpine vegetation SOS in the Plateau experienced a continuous advancing trend at a rate of similar to 1.04 d.y(-1) from 1982 to 2011, which was consistent with observed warming in springs and winters. The satellite-derived SOSs were proven to be reliable with observed phenology data at 18 sites from 2003 to 2011; however, comparison of their trends was inconclusive due to the limited temporal coverage of the observed data. Longer-term observed data are still needed to validate the phenology trend in the future.

DOI PMID

[70]
Zhang J P, Liu C L, Hao H G,et al.., 2015a. Spatial-temporal change of carbon storage and carbon sink of grassland ecosystem in the Three-River Headwaters Region based on MODIS GPP/NPP data.Ecology and Environmental Sciences, 24(1): 8-13. (in Chinese)Carbon cycling of terrestrial ecosystem has become the research front and focus of global change and geo-science. Precision evaluation of the carbon storage and carbon sink plays an important role in the assessment of future atmospheric CO2 concentration, climate change prediction and its impact on terrestrial ecosystem. Existing studies have mainly focused on the amount estimation of carbon storage and carbon sink of regional ecosystem, but analysis of the change process on time scale and the spatial difference of changing trend is limited. This paper uses MODIS GPP data, together with land use data and soil organic carbon density data to analyze the spatial-temporal change of carbon storage of grassland ecosystem in the Three-River Headwaters Region from 2000 to 2010. Meanwhile, the spatial-temporal change of carbon sink is analyzed using MODIS GPP, China FLUX and America Flux data applied in the modeling of grassland ecosystem respiration to specify the carbon-carrying capacity and its change process of the study area and provide scientific basis for protection and management of regional grassland ecosystem. The results show that:(1) the total carbon storage of grassland ecosystem is 53.38×10⁸ t with the average carbon density of 14.94 kg·m-2(measured in C). The carbon storage of soil and vegetation is 53.07×10⁸ t and 0.31×10⁸ t, respectively, with the average carbon density of 14.85 kg·m-2 and 86.77 g·m-2, respectively;(2) during recent 10 years, the total carbon sink of grassland ecosystem is 0.4×10⁸ t with the average carbon sink per area of 86.80 g·m-2·a-1(measured in C), which shows that the grassland ecosystem in the study area is a carbon sink;(3) both of the total amount of carbon storage and carbon sink of grassland ecosystem show an increasing trend since 2000;(4) the distribution of carbon storage and carbon sink of grassland ecosystem and their changing trend shows great spatial difference;(5) It is proved that the MODIS GPP/NPP data can be applied to analyze the carbon storage and carbon sink pattern, as well as its changing trend of grassland ecosystem in large scale, which is more efficient and convenient than traditional approach.

[71]
Zhang M L, Jiang W L, Chen Q G,et al.., 2011. Research progress in the estimation models of grassland net primary productivity.Acta Agrestia Sinica, 19(2): 356-366. (in Chinese)Grassland net primary production(NPP) can directly reflect the production capacity of grassland communities in a natural environment.Grassland NPP is an important part of the grassland carbon cycle.Simulating NPP using mathematical models has become an important and widely accepted research approach.Climate-productivity statistical models,light utilization efficiency models,eco-physiological processing models and remote sensing applications coupled with the eco-physiological process models are the primary models for grassland NPP estimation.The achievements and problems of these models are reviewed comprehensively and systematically.A future development trend of NPP estimation is further proposed in this paper.The statistical models calculate NPP base on the relationships between NPP and climatic variables(i.e.,temperature,precipitation),which require simple parameters and give poor accuracy.The theoretical basis of light utilization efficiency models is an analytical technique of photosynthesis based on the concept of photosynthesis and its associated efficiency of light utilization.Its format is simple and can use remote sensing data.Therefore,light utilization efficiency models attract much attention;even so,it has questionable results.Process modelling simulates a series of plant ecophysiological and biophysical processes to reveal their active mechanisms,but it is more complex compared with other models and may have limited practicality.Remote sensing applications coupled with the eco-physiological process model can use collected sensing data to overcome disadvantages of the light utilization efficiency and ecophysiological processing models.This may well become a major developing direction for grassland NPP estimation.Studies in grassland NPP estimation are sparse and special studies in the modeling of the grassland NPP are not commonly reported.This procedure is meaningful to develop the grassland NPP for China as another tool with freedom knowledge property right and performance.

[72]
Zhang Q Y, Li P, Zong Y Z,et al.., 2015b. Research and application of CENTURY model in different ecological systems.Journal of Shanxi Agricultural Sciences, 43(11): 1563-1566. (in Chinese)

[73]
Zhang X, 1992. Estimation and distribution of net primary productivity of natural vegetation in China.Natural Resources, 1: 15-21. (in Chinese)

[74]
Zhang Y, Chen H Y, Li J L, 2014. Quantitative estimation for net primary productivity of Three-Rivers Source Ecosystem in Recently 10 years.Tianjin Agricultural Sciences, 20(10): 25-28. (in Chinese)To reveal Spatio-temporal dynamic of net primary productivity in Three-River source during recently 10 years, based on MODIS-NDVI data, and meteorological data, spatiotemporal changes of the NPP of Three-River source was simulated using CASA model. The results showed that average annual NPP from 2001 to 2010 was 169.02 g·m-2·a-1in the study area, exhibiting decrease trend from southeast to northwest. During 2001 to 2010, temporal NPP showed a no significant increase of 0.69 g·m-2·a-1, ranging from 159.53 to 176.25 g·m-2·a-1. This study could provide a theoretical basis for the management and rational utilization of ecological resources in Three-Rivers source region.

[75]
Zhang Y Q, Tang Y H, Jiang J,et al.., 2007. Characterizing the dynamics of soil organic carbon in grasslands on the Qinghai-Tibetan Plateau.Science in China Series D (Earth Sciences), 50(1): 113-120.Carbon dynamics of grasslands on the Qinghai-Tibetan Plateau may play an important role in regional and global carbon cycles. The CENTURY model (Version 4.5) is used to examine temporal and spatial variations of soil organic carbon (SOC) in grasslands on the Plateau for the period from 1960 to 2002. The model successfully simulates the dynamics of aboveground carbon and soil surface SOC at the soil depth of 0-20 cm and the simulated results agree well to the measurements. Examination of SOC for eight typical grasslands shows different patterns of temporal variation in different ecosystems in 1960-2002. The extent of temporal variation increases with the increase of SOC of ecosystem. SOC increases first and decreases quickly then during the period from 1990 to 2000. Spatially, SOC density obtained for the equilibrium condition declines gradually from the southeast to the northwest on the plateau and showed a high heterogeneity in the eastern plateau. The results suggest that (i) SOC den-sity in the alpine grasslands shows remarkable response to climate change during the 42 years, and (ii) the net carbon exchange rate between the alpine grassland ecosystems and the atmosphere increases from 1990 to 2000 as compared with that before 1990.

DOI

[76]
Zhao X Q, 2009. Alpine Meadow Ecosystem and Global Change. Beijing: Science Press, 169, 219-221. (in Chinese)

[77]
Zheng L Y, 2006. Study on dynamic change of NPP and grassland change in Northern Tibet based on remote sensing and biological processes model BEPS [D]. Beijing: Chinese Academy of Meteorological Sciences. (in Chinese)

[78]
Zheng W J, Bao W K, Gu B,et al.., 2007. Carbon concentration and its characteristics in terrestrial higher plants.Chinese Journal of Ecology, 26(3): 307-313.A precise estimation of vegetation carbon storage is the key of illustrating the effects of vegetative restoration on the carbon balance in terrestrial ecosystem.In common,this carbon storage is estimated by carbon concentration coefficient and biomass.This paper collected the actual data of various plants carbon concentration,and analyzed the characteristics of the carbon concentration in different plant life types,plant tissues,and different areas.The results showed that plant carbon concentration was in the range of 24.95%-55.44%,with an average of(43.63卤0.14)%.The average carbon concentration of different life types was arbor(46.22%)shrub(45.93%)bryophyte(41.64%)herbage(37.13%),and that of different tissues was flower(48.52%)fruit(47.19%)branch(45.42%)stem(44.48%)leaf(43.36%)root(42.88%).As for different geographical areas,the average carbon concentration was high latitude area(50.30%)low latitude area(45.30%)middle latitude area(39.68%),and there were significant differences among different climatic types.As a result,error always existed when fixed coefficients were used to estimate the carbon storage.

[79]
Zhou C P, Ouyang H, Wang Q X,et al.., 2004. Estimation of net primary productivity in Tibetan Plateau.Acta Geographica Sinica, 59(1): 74-79. (in Chinese)The Tibetan Plateau is the least human-disturbed region in the world. Its outstanding topographic features and ecological characteristics give it a fame of "Natural Lab" for global change research. An improved TEM model based on MODIS satellite data and field observations data during 2000-2002 were used to estimate annual net primary productivity (NPP) in the Tibetan Plateau. A validation by using the observed NPP at different sites shows that the estimated NPP is well agreed with the measured NPP. The simulated results show that the estimated annual primary productivity of the entire Tibetan Plateau is 302.44脳10 12 gC yr -1 , among which forest NPP takes up 39.7% of the total, though forests comprise only 9.74% of the Tibetan Plateau region; NPP accumulation for summer is 246.7脳10 12 gC yr -1 , which is 80% of the year total.

DOI

[80]
Zhou G S, Wang Y H, 2003. Global Ecology. Beijing: China Meteorological Press, 82-102. (in Chinese)

[81]
Zhou G S, Zhang X S, 1995. A natural vegetation NPP model.Acta Phytoecologica Sinica, 19(3): 193-200. (in Chinese)In this paper. a newnet primary productivity model of natural vegeta- tion is presented. with a view to the ecophysiological feature and regional vapotranspiration model relating the two well-known balance equations on the earth′s surface:water balance equation and heat balance equation:This model will help us to study the potential productivity of zonal lan-dscape。the regional and global distribution of NPP. to predict the possibleimpact of global change on terrestrial ecosystems. and to make good use ofclimatic resources.

[82]
Zhou X M, 2001. Chinese Kobresia Meadow. Beijing: Science Press, 132-133, 146-195. (in Chinese)

[83]
Zhu W Q, Pan Y Z, He H,et al.., 2006. Simulation of maximum light use efficiency of typical vegetation in China.Chinese Science Bulletin, 51(6): 700-706. (in Chinese)Maximum light use efficiency (εmax) is a key parameter for the estimation of net primary productivity (NPP) derived from remote sensing data. There are still many divergences about its value for each vegetation type. The εmax for some typical vegetation types in China is simulated using a modified least squares function based on NOAA/AVHRR remote sensing data and field-observed NPP data. The vegetation classification accuracy is introduced to the process. The sensitivity analysis of εmax to vegetation classification accuracy is also conducted. The results show that the simulated values of εmax are greater than the value used in CASA model, and less than the values simulated with BIOME-BGC model. This is consistent with some other studies. The relative error of εmax resulting from classification accuracy is -5.5%―8.0%. This indicates that the simulated values of εmax are reliable and stable.

DOI

[84]
Zhuang Q, He J, Lu Y,et al.., 2010. Carbon dynamics of terrestrial ecosystems on the Tibetan Plateau during the 20th century: An analysis with a process-based biogeochemical model.Global Ecology and Biogeography, 19(5): 649-662.

Outlines

/