Research Articles

NPP vulnerability of the potential vegetation of China to climate change in the past and future

  • YUAN Quanzhi , 1, 2 ,
  • WU Shaohong , 3, 4 ,
  • DAI Erfu 3, 4 ,
  • ZHAO Dongsheng 3, 4 ,
  • REN Ping 1, 2 ,
  • ZHANG Xueru 5
Expand
  • 1. Key Lab of Land Resources Evaluation and Monitoring in Southwest, Ministry of Education, Sichuan Normal University, Chengdu 610068, China
  • 2. Institute of Geography and Resources Science, Sichuan Normal University, Chengdu 610101, China
  • 3. Institute of Geographic Sciences and Natural Resources Research, CAS, Beijing 100101, China
  • 4. Key Laboratory of Land Surface Pattern and Simulation, CAS, Beijing 100101, China
  • 5. Chongqing Jiaotong University, Chongqing 400074, China

Author: Yuan Quanzhi, PhD, specialized in physical geography. E-mail: .

*Corresponding author: Wu Shaohong, Professor, specialized in physical geography. E-mail:

Received date: 2016-08-22

  Accepted date: 2016-09-20

  Online published: 2017-04-10

Supported by

Key Project of National Natural Science Foundation of China, No.41530749

Science and Technology Project of Sichuan Provincial Department of Education, No.15ZB0023

Youth Projects of National Natural Science Foundation of China, No.41301196, No.41501202

Chongqing Foundation and Advanced Research Project, No.cstc2014jcyjA0808

Copyright

Journal of Geographical Sciences, All Rights Reserved

Abstract

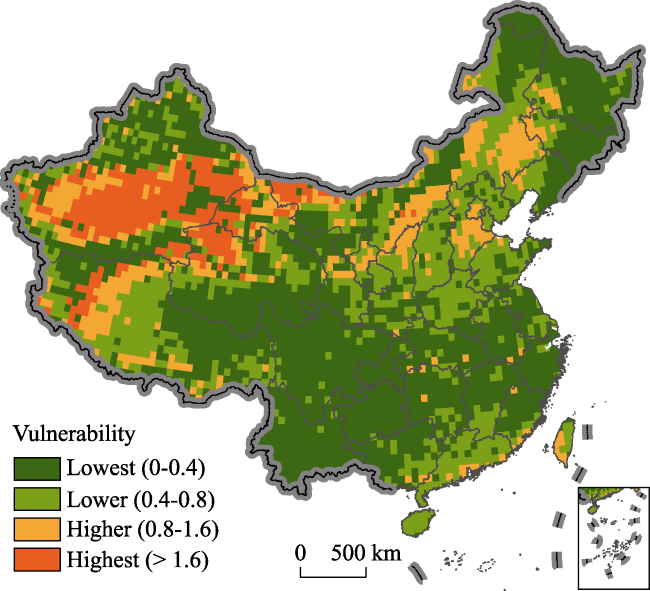
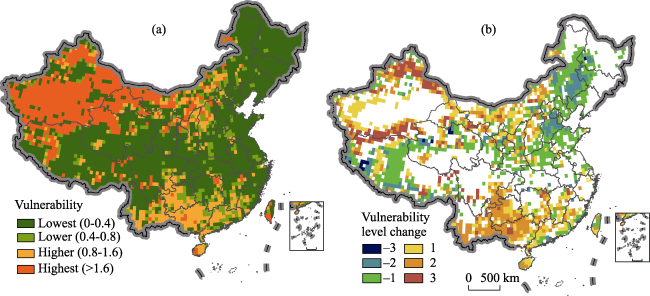
Using the Integrated Biosphere Simulator, a dynamic vegetation model, this study initially simulated the net primary productivity (NPP) dynamics of China’s potential vegetation in the past 55 years (1961-2015) and in the future 35 years (2016-2050). Then, taking the NPP of the potential vegetation in average climate conditions during 1986-2005 as the basis for evaluation, this study examined whether the potential vegetation adapts to climate change or not. Meanwhile, the degree of inadaptability was evaluated. Finally, the NPP vulnerability of the potential vegetation was evaluated by synthesizing the frequency and degrees of inadaptability to climate change. In the past 55 years, the NPP of desert ecosystems in the south of the Tianshan Mountains and grassland ecosystems in the north of China and in western Tibetan Plateau was prone to the effect of climate change. The NPP of most forest ecosystems was not prone to the influence of climate change. The low NPP vulnerability to climate change of the evergreen broad-leaved and coniferous forests was observed. Furthermore, the NPP of the desert ecosystems in the north of the Tianshan Mountains and grassland ecosystems in the central and eastern Tibetan Plateau also had low vulnerability to climate change. In the next 35 years, the NPP vulnerability to climate change would reduce the forest-steppe in the Songliao Plain, the deciduous broad-leaved forests in the warm temperate zone, and the alpine steppe in the central and western Tibetan Plateau. The NPP vulnerability would significantly increase of the temperate desert in the Junggar Basin and the alpine desert in the Kunlun Mountains. The NPP vulnerability of the subtropical evergreen broad-leaved forests would also increase. The area of the regions with increased vulnerability would account for 27.5% of China.

Cite this article

YUAN Quanzhi , WU Shaohong , DAI Erfu , ZHAO Dongsheng , REN Ping , ZHANG Xueru . NPP vulnerability of the potential vegetation of China to climate change in the past and future[J]. Journal of Geographical Sciences, 2017 , 27(2) : 131 -142 . DOI: 10.1007/s11442-017-1368-6

1 Introduction

Vulnerability is the tendency or habit of things to suffer from adverse effects, including the sensitivity or susceptibility to hazards and the lack of ability to cope and adapt (IPCC, 2014). Vulnerability assessment can be a basis for decision-making to continue the sustainable development of the system, reduce the adverse effects of external stress on the system, and comprehensively improve the degradation system (Cai et al., 1996; Fang et al., 2016). The strong climate change has greatly affected the distribution, productivity, and service function of China’s natural ecosystems (Wu et al., 2014). Revealing and predicting the vulnerability of China’s natural ecosystems under climate change have become important topics for domestic scholars (Liu and Li, 2007; Tian and Chang, 2012).
Potential vegetation, which can reflect the general trend of vegetation development, is the most stable and mature vegetation type without human interference in the current climate conditions (Tüexen, 1956). The increasing significance of the direct effect of human activities on natural ecosystems adds to the difficulty of separating its relationship with the effect of climate change on natural ecosystems. Accordingly, based on the potential vegetation using model simulation to evaluate the vulnerability of natural ecosystems in China has become a common view of many scholars (Wu et al., 2007; Yu et al., 2008; Zhao and Wu, 2014).
Net primary productivity (NPP) is the amount of organic matter accumulated by green plants in an area per unit time (Lieth et al., 1975). NPP not only reflects the production capacity of ecosystems directly, but also serves as the main criterion for carbon source/sink. This study uses a climate-vegetation model to evaluate the NPP vulnerability of the potential vegetation in the past and future climate changes by simulating the NPP changes of the potential vegetation in the past 55 (1961-2015) and the next 35 years (2016-2050). The results can provide a scientific basis for the rational evaluation and prediction of the adverse effects of climate change on natural ecosystems necessary in taking targeted measures to mitigate and adapt to climate change for the conservation and restoration of natural ecosystems.

2 Model and data

2.1 Model

Climate-vegetation model is the main tool employed to investigate the interaction between vegetation and climate on regional and global scales. The model can be used to analyze the vegetation characteristic parameters, structure, and function of natural ecosystems, as well as the influence of the interaction between vegetation and climate change (Li et al., 2009). The models can be divided into biogeographical, biogeochemical, and coupled atmosphere-biosphere models. Biogeographical models determine the competition and distribution of plant functional types by setting the growing degree days, extreme minimum temperature, and other ecological physiological conditions, such as BIOME1 (Prentice et al., 1992) and MAPPS (Neilson et al., 1995). However, these models cannot simulate the dynamic processes of vegetation change over time and cannot reflect the hysteresis of vegetation response to environmental changes. Biogeochemical models, such as CENTURY (Parton et al., 1993) and DOLY (Woodward et al., 1995), can be used to calculate the carbon and nutrient cycle in plant-soil-atmosphere by simulating photosynthesis, respiration, and soil microbial decomposition processes. Although biogeochemical models compensate for the failure of the equilibrium model to describe the dynamic processes between vegetation and environment, these models cannot simulate the changes in vegetation composition and structure caused by long-term climate change. Coupled atmosphere-biosphere models consider the dynamic processes of vegetation and environment as well as the hysteretic response of vegetation to environmental change, which can simulate the instantaneous change of vegetation and the dynamic effects of climate, such as the Integrated Biosphere Simulator (IBIS) (Foley et al., 1996) and Lund-Potsdam-Jena Dynamic Global Vegetation Model (LPJ-DGVM) (Sitch et al., 2003). Coupled models have become an important development direction in the study of climate-vegetation relationship.
As a DGVM, IBIS is capable of simulating the dynamic process between atmosphere and vegetation by integrating a series of biophysical and biogeochemical processes in the terrestrial biosphere, such as surface physical processes, canopy physiological characteristics, plant phenology, vegetation dynamics, carbon cycle, and nitrogen cycle (Kucharik et al., 2000). Yuan et al. (2011, 2014) adjusted the parameters of IBIS, enabling the model to create a more accurate simulation of the potential vegetation pattern and NPP. Based on the modified IBIS model, this study evaluates the NPP vulnerability of China’s potential vegetation under climate change.

2.2 Data

In this paper, the input and output data resolutions of the model were both 0.5°×0.5°. The input data included terrain data, soil data, and meteorological data.
(1) Terrain data: These data were a resampling from China’s DEM, the resolution of which was 30".
(2) Soil data: Soil texture data were obtained from IGBP-DIS (1999), including six soil layers (0.15, 0.25, 0.10, 0.50, 1, and 2.00 m from top to bottom).
(3) Climate data: The meteorological data required for the model, including monthly mean temperature, monthly mean maximum temperature, monthly mean minimum temperature, monthly extreme minimum temperature, monthly precipitation, monthly rainy days, monthly mean relative humidity, monthly mean wind speed, and monthly mean sunshine percentage. The historical meteorological data were from 756 meteorological stations in China. The spatial interpolation of the meteorological data was based on ANUSPLIN software, which has been widely used in related research (Hutchinson, 1991). Interpolation results showed that the percentage of sunshine, temperature, relative humidity, precipitation, and rainy days were in high fitting degrees (observed and simulated values of R2 > 0.9, p < 0.05). The fitting degree of wind speed was slightly poor (observed and simulated values of R2 > 0.8, p < 0.05), but satisfied the requirement of this research.
The IPCC fifth assessment report (AR5) used the Representative Concentration Pathways (RCPs) scenario data combined with policy factors. The meteorological data for 2016-2050 were simulated data under the RCP4.5 scenario. The RCPs scenario is represented by an approximate total radiative stress of 2100 with respect to 1750. RCP2.6 is a very low radiative stress level of mitigation scenarios. RCP6.0 and RCP4.5 are both medium stabilization scenarios, but the priority of RCP4.5 is greater than RCP6.0. RCP8.5 is a very high greenhouse gas emission scenario (Moss et al., 2010). The time variation of greenhouse gas emission under the RCP4.5 scenario is more consistent with China’s future economic development trend. In this paper, the RCP4.5 scenario data were the integration of five models with unequal weights in CMIP5, including GFDL-ESM2M, HadGEM2-ES, IPSL-CM5A-LR, MIROC-ESM-CHEM, and NorESM1-M.

2.3 Sensitivity analysis of climatic factors

The sensitivity analysis of climatic factors is a means to study the response degree of the model that can result from the change of input climatic factors, which were important bases for the analysis and discussion of the simulation results. Relative sensitivity algorithm was employed in this study to analyze the sensitivity of the simulated NPP with respect to the climatic element inputs as follows:
\[S=\frac{\sum^n_{i=1}\frac{(Q_{i+1}-Q_i)/Q_b}{(P_{i+1}-P_i)/100}}{n+1},\ \ (1)\]
where S is the relative sensitivity, Pi and Pi+1 are the adjustment rates of input data at the i and i+1 times, Qb is the output of the model in the original input data, Qi and Qi+1 are the outputs of the model at the i and i+1 time calculations.
Calculation results showed that the NPP of tropical and boreal trees was sensitive to temperature changes because of the small distribution areas of tropical and boreal trees in China. The changes in the distribution areas of the two types of plant functional types (PFTs) caused by temperature variation would lead to a large relative change in the amount of NPP. The NPP sensitivities of most PFTs to temperature difference, wind speed, and rainy day changes were low, while the sensitivities to precipitation, relative humidity, and cloudiness changes were moderate (Table 1).
Table 1 Sensitivity analysis of climatic data input
PFTs NPP sensitivity to climatic factors change
Tempera-
ture
(℃)
Temperature difference
(℃)
Precipita-
tion
(mm)
Relative humidity
(%)
Cloudi-
ness
(%)
Wind speed
(m/s)
Rainy
day
(d)
Tropical evergreen broad-leaved forest 5.229 -0.032 0.375 0.682 -0.278 0.011 -0.219
Tropical rain and evergreen broad-leaved forest 6.818 -0.037 0.361 0.692 -0.277 0.013 -0.216
Subtropical evergreen broad-leaved forest -0.684 -0.040 0.174 0.442 -0.141 -0.002 -0.045
Temperate coniferous evergreen forest -0.026 -0.081 0.553 1.082 0.184 -0.053 -0.092
Temperate deciduous broad-leaved forest 0.001 -0.086 0.656 0.733 0.186 -0.033 -0.064
Boreal coniferous evergreen forest -1.876 -0.062 0.292 0.886 -0.082 -0.040 -0.051
Boreal broad-leaved cold-deciduous forest -4.010 -0.093 0.654 0.759 0.136 -0.039 -0.069
Boreal coniferous cold-deciduous forest -4.311 -0.073 0.356 0.572 0.012 -0.030 -0.040
Evergreen shrubs -0.480 -0.097 0.371 0.324 -0.764 -0.163 0.120
Cold-deciduous shrubs -0.485 -0.069 0.212 0.261 -0.686 -0.031 0.176
Warm (C4) grasses 3.601 -0.020 0.559 0.611 -1.916 -0.049 0.390
Cool (C3) grasses -1.590 -0.116 0.348 0.510 -0.022 -0.042 -0.035

3 Vulnerability

3.1 Method

Vulnerability assessment of a system generally requires a comparison of the system’s normal, which is the assessment benchmark (Metzger et al., 2008). Referring to the standard climatic period defined in the IPCC fifth assessment report, this paper sets the average climate conditions during 1986-2005 as the standard annual climate. Using the potential vegetation’s NPP in this climate condition as the assessment benchmark, the vulnerability of the potential vegetation to historical and future climate changes was quantitatively assessed.
The NPPs of natural ecosystems have normal fluctuation ranges. Through the years of NPP simulation of European natural ecosystems under climate change, Minnen et al. (2002) found that about 80% of the NPP fluctuations were within the ±10% of the average NPP. Therefore, the NPP fluctuation over 10% of the average was taken as the threshold to ascertain the fragility of the system. Shi (2009) simulated the normal NPP fluctuation range of China’s natural ecosystems using the GloPEM and AVIM2 models. The calculated results were +9.9% and +8.5%, respectively, which were similar to the research results of Minnen et al. (2002). Thus, the vegetation in this study was considered inadaptable to climate change if the NPP fluctuation was lower than the assessment benchmark of 10%. In accordance with the degree of NPP fluctuation, the level of inadaptability was divided into mild (-40%≤ΔNPP<-10%), moderate (-60%≤ΔNPP<-40%), severe (-80%≤ΔNPP<-60%), and extreme (ΔNPP<-80%) (Wu et al., 2005). This paper assessed the vulnerability by synthesizing the frequency and degree of inadaptability to climate change of the potential vegetation. The calculation formula is as follows:
\[V=\frac{\sum^n_{i=1}A_j}{n}\ \ (2)\]
where V represents the vulnerability score, i is the i(th) year, j is the inadaptability level to climate change of the potential vegetation, Aj represents the grade of the inadaptability to climate change of the potential vegetation in year i (1 for mild, 2 for moderate, 3 for sever, and 4 for extreme). According to the vulnerability assessment score, this study divided the vulnerability levels as follows: lowest vulnerability (0-0.4), lower vulnerability (0.4-0.8), higher vulnerability (0.8-1.6), and highest vulnerability (>1.6).

3.2 Results and analysis

3.2.1 NPP vulnerability of potential vegetation under historical climate change
Under the climate change during 1961-2015, the highest vulnerability areas of the potential vegetation in China were mainly located in the temperate desert regions south of the Tianshan Mountains, which accounted for 8.7% of the total area of China. The higher vulnerability areas were mainly located in temperate steppe regions, alpine grassland regions in Qiangtang Plateau, and deciduous broad-leaved forest regions in central southern Hebei, which accounted for 17.8% of the total area of China. The lower vulnerability areas were mainly concentrated in the warm temperate deciduous broad-leaved forest regions, alpine grassland regions in central Tibetan Plateau, subtropical evergreen broad-leaved forest regions in the south of Nanling Mountains, and tropical and monsoon rain forest areas, which accounted for 29.0% of the total area of China. The lowest vulnerability areas mainly included the cold temperate coniferous forest regions, temperate desert regions of northern Tianshan Mountains, temperate coniferous and deciduous broad-leaved mixed forest regions, alpine desert regions in the northern Tibetan Plateau, alpine meadow regions in the eastern Tibetan Plateau, coniferous forest regions in Hengduan Mountains, subtropical evergreen broad-leaved regions in the north of Nanling Mountains, and evergreen broad-leaved forests in the Yunnan-Guizhou (Yungui) Plateau and Sichuan Basin, which accounted for 44.5% of the total area of China (Figure 1).
Figure 1 Natural ecosystems’ vulnerability to climate change over the past 55 years in China
The vegetation was sparse and the structure of ecosystems was too simple in the Alashan regions of Inner Mongolia, Hexi Corridor of Gansu Province, Tarim Basin in Xinjiang, and Qaidam Basin in Qinghai Province. Therefore, the NPP vulnerability to climate change of the potential vegetation in these desert regions was the highest. Grassland vegetation was developed in the Songliao Plain of Northeast China, Inner Mongolia Plateau, and the Loess Plateau. The northwest cold air is weakened and the desert is stopped from moving eastward because of the barrier effect of the Helan Mountains. Thus, the grassland vegetation developed well, and the ecosystem structure was more complex than the western desert in these areas. Thus, the anti-interference ability was strong, and the NPP vulnerability level to climate change was high. The NPP vulnerability level of warm temperate deciduous broad-leaved forests in the central-southern Hebei Province was also high, probably because the area is in the transition regions between the warm temperate semi-humid climate and the temperate semi-arid climate, where the interannual fluctuation of temperature and precipitation is large. The potential vegetation in the middle and lower reaches of the Yellow River was mainly the warm temperate deciduous broad-leaved forests, with a more complex ecosystem structure than the grassland ecosystems and a relatively stable ecosystem function. However, the NPP vulnerability level to climate change was low because of the droughts and floods that frequently occur in these regions. The precipitation variability in the low mountain and hilly areas is large in the southern subtropical evergreen broad-leaved forest regions, which leads to frequent droughts and floods. The Hainan Island and Leizhou Peninsula in the tropics are rich in calories but occasionally cold, where short frost may appear and damage the ecosystem function when the extreme coldness goes south (Zheng, 2008). The NPP vulnerability level to climate change of the potential vegetation in these tropical and southern subtropical areas was higher than that in the middle and lower reaches of the Yangtze River of the central subtropical areas. Precipitation and temperature gradually decreased from the southeast to the northwest. The increasingly harsh natural conditions resulted in the distribution changes of natural vegetation in the Tibetan Plateau. The potential vegetation in the southeastern Tibetan Plateau is alpine meadow, which is alpine grassland in the middle and alpine desert in the northwest. The anti-interference ability of the ecosystems gradually decreased, and the NPP vulnerability to climate change of the potential vegetation gradually increased.
3.2.2 Possible dominant factor of vulnerability
The NPP vulnerability to climate change of the potential vegetation is the integration of various climatic factor changes. This paper used the correlation analysis method to determine the most significant climatic factors by comparing the correlation between the single climatic factors and the potential vegetation NPP in each latitude-longitude grid of the past 55 years (Figure 2).
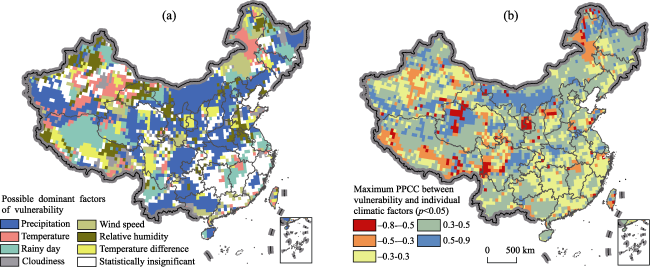
Figure 2 Possible leading factors of vulnerability (a) and the correlation coefficient between these factors and vulnerability (b)
The absolute maximum value of the correlation coefficient between the vulnerability and a single climatic factor was between 0 and 0.3 within 23.6% of the grids. The weak correlation indicated that the NPP vulnerability of the potential vegetation in these regions was the result of the combined effects of multiple climatic factors, such as the most warm temperate desert areas with the highest vulnerability level. The absolute maximum value of the correlation coefficient between the vulnerability and a single climatic factor was between 0.3 and 0.5 within 57.7% of the grids. The result showed a certain correlation between the potential vegetation’s NPP vulnerability and the changes of one climatic factor, but the correlation was not high. Furthermore, the influence of other climatic factors on the potential vegetation’s NPP could not be ignored. The high NPP vulnerability of the temperate grassland areas and central-southern Hebei Province may have resulted from precipitation changes. A decrease in precipitation would lead to the NPP decrease in the grassland and deciduous broad-leaved forests. The absolute maximum value of the correlation coefficient between the vulnerability and a single climatic factor was between 0.5 and 0.8 within the remaining 18.7% of the grids. A strong correlation existed between the potential vegetation’s NPP vulnerability and the changes in one climatic factor, and this factor may be the dominant climate factor of the regional natural ecosystems. The dominant climatic factor of the potential vegetation’s NPP vulnerability of the western Qaidam Basin may be the wind speed, and the dominant climatic factor in the east may be the precipitation. The increased wind speed or decreased rainfall would lead to a reduced desert vegetation NPP. Overall, most of the possible dominant factors for the potential vegetation’s NPP vulnerability in China were associated with precipitation, such as the amount of precipitation, rainy days, and relative humidity. The effects of precipitation and relative humidity on the potential vegetation’s NPP in China were mostly positive. Rainy days had positive effects on shrub NPP but had weak negative effects on tree NPP. This finding may be related to the increase in rainy days, which improves the amount of precipitation, while reducing the amount of solar radiation (Table 1).
3.2.3 NPP vulnerability of potential vegetation under future climate change
Under the scenario of climate change during 2016-2050, the reduced area of the NPP vulnerability level of potential vegetation would account for 22.9% of the total area of China. The increased area of the NPP vulnerability level of potential vegetation would account for 27.5%, and the remaining 49.6% would be unchanged (Figure 3b). The area of the regions where the NPP vulnerability level would be the highest increased more, which would account for 21.9% of the total area of China, including the desert regions of the Tarim Basin in the south of the Tianshan Mountains, and the the Junggar Basin in the northern part of the Tianshan Mountains and the Kunlun Mountains. The areas with higher NPP vulnerability level would be mainly located in the grassland areas of the Loess Plateau and Central Inner Mongolia Plateau, as well as the subtropical evergreen broad-leaved forests areas, with a total area accounting for 12.2% of China. The areas with lower NPP vulnerability level would be mainly around or inlaid in the areas where the NPP vulnerability level would be higher or highest, with a total area accounting for 23.9%. The areas with the lowest NPP vulnerability level would be mainly located in the cold temperate coniferous forest regions, temperate coniferous and deciduous broad-leaved mixed forest regions, warm temperate deciduous broad-leaved forest regions, Tianshan Mountains, alpine steppe and meadow regions in the Tibetan Plateau, central subtropical evergreen broad-leaved forest regions, and the northern subtropical evergreen and deciduous broad-leaved mixed forest regions, with a total area accounting for 42.0% (Figure 3a).
Figure 3 NPP vulnerability under future climate change (a) and rise or fall of the grade compared with the past (b)
In the next 35 years, the NPP vulnerability would significantly increase in the desert areas of Junggar Basin and Kunlun Mountains. This forecast may be explained by the vulnerability of the desert ecosystems with sparse vegetation and simple structure to the adverse effects of climate change and the NPP’s tendency for significant fluctuations. The NPP vulnerability of evergreen broad-leaved forests to climate change would increase in southern Yunnan, Guizhou, and western Guangxi, which may be related to the regional precipitation reduction under the future climate change. The NPP vulnerability of the forest-steppe zone to climate change would decrease in the Songnen Plain and Liaohe Plain, where the potential vegetation’s NPP vulnerability of some areas would significantly decrease. This forecast may be related to the change in precipitation, rainy days, and temperature. The increase in precipitation and temperature or the decrease of rainy days would result in the regional potential vegetation productivity in these places. The NPP vulnerability of warm temperate deciduous broad-leaved forests to climate change would also decrease, which may be related to the rise in precipitation under the future climate change. The NPP vulnerability of the alpine steppe to climate change in the western Tibetan Plateau would decrease, which may be related to the decrease of precipitation in the future (Table 1).

4 Conclusions

Global climate change, as represented by global warming, has been remarkably affecting the ecosystem processes. The results have threatened the human living environment and the sustainable development of social economy. NPP can reflect the quality of the natural ecosystems directly. Using the IBIS model, this study quantitatively evaluated the NPP vulnerability of China’s potential vegetation to climate change in the past 55 years (1961-2015) and in the next 35 years (2016-2050). The main conclusions are as follows:
(1) According to the vulnerability assessment, the warm temperate desert ecosystems in the south of the Tianshan Mountains, temperate grassland ecosystems, and alpine grassland ecosystems in the west of the Tibetan Plateau were more vulnerable to the adverse effects of climate change in the past 55 years, with a higher potential vegetation NPP vulnerability. Despite the low susceptibility of the forest ecosystems to climate change, the potential vegetation’s NPP vulnerability was low. In particular, the NPP vulnerability of the evergreen broad-leaved and coniferous forests was the lowest. Furthermore, the low NPP vulnerability of the potential vegetation in the temperate desert ecosystems in the north of the Tianshan Mountains and alpine grassland ecosystems in the central and eastern Tibetan Plateau to climate change was also observed.
(2) The regional NPP vulnerability of the potential vegetation in 23.6% of the areas to climate change was the result of the combined effects of several climatic factors in China. That in 57.7% of the areas had a certain correlation with the changes of one climatic factor. However, the correlation was not high, and the influence of other climatic factors on the vulnerability could not be ignored. That of the remaining 18.7% of the areas had a strong correlation with the changes in one climatic factor. Most of the possible dominant factors of potential vegetation NPP vulnerability were correlated with precipitation, such as rainy days, precipitation, and relative humidity.
(3) Under the climate change scenarios in 2016-2050, the area of the regions where potential vegetation NPP vulnerability level would decrease would account for 22.9% of China, mainly including the forest-steppe areas of Songliao Plain, warm temperate deciduous broad-leaved forests areas, and the alpine grassland areas in the central and western Tibetan Plateau. The area of the regions where NPP vulnerability level would increase would account for 27.5%. Among them, the NPP vulnerability would increase significantly in the Junggar Basin temperate desert regions and the alpine desert regions in Kunlun Mountains. The NPP vulnerability level of the evergreen broad-leaved forests in the southern Yunnan, Guizhou, and western Guangxi would also increase.

5 Discussion

5.1 Comparisons with related research results

The results of this paper were consistent with the results of Ye (1992) and Zhao (1999). The NPP vulnerability level of potential vegetation of the sensitive zone in the Distribution of China’s Ecological Sensitive Zone to climate change was generally high. The areas with the highest and high levels of NPP vulnerability were located in the “northern semi-arid and semi-humid fragile zones,” “northwestern semi-arid fragile zone,” “fragile zone of North China Plain,” “southwestern limestone mountainous fragile zone,” and “southwestern mountainous fragile zone” of the Distribution of China’s Fragile Ecological Environment.
Wu et al. (2007) used the AVIM2 model to simulate the effect of future climate change on the natural ecosystems under the B2 scenario, and the vulnerability of China's natural ecosystems to climate change in the 21st century was predicted. Yu et al. (2008) evaluated the vulnerability of the natural ecosystems in China under the A2 climate scenario using the improved CEVSA model. Zhao and Wu (2014) evaluated the vulnerability of natural ecosystems to future climate change in China. The above studies all discussed the vulnerability of China’s natural ecosystems in the future by using the LPJ model to simulate the changes in China's natural ecosystems under future climate scenarios of A2, B2, and A1B. From the results of these studies, the northwestern desert regions and the central-western regions of the Tibetan Plateau were predicted more vulnerable to future climate change. This finding is similar to the evaluation results of this study. The vulnerability assessment results were not entirely in agreement in the temperate grassland, warm temperate deciduous broad-leaved forest, subtropical evergreen broad-leaved forest, and tropical rain forest and monsoon forest zones because of the differences in the evaluation index and models. However, the general trend was still the same: the vulnerability in the northwest arid regions and the Tibetan Plateau was significantly higher than that in the eastern monsoon regions.

5.2 Uncertainty analysis

The uncertainty in this study came from two aspects, one was related to the data and the other was related to the model. In terms of data, the historical climate data used in this study came from the measured data of meteorological stations, but the existing meteorological data stations in the western regions and in Taiwan were less distributed. Thus, the accuracy of climatic data interpolation in these regions was low. The NPP vulnerability level of potential vegetation to climate change was high in southern Tibetan alpine valley and southern Taiwan. This was probably because of the sparse and late distribution of meteorological stations in these regions. Climatic data scenarios were gathered from the climate model prediction, with its prediction error probably introducing uncertainty to the NPP vulnerability assessment as well. In terms of the model, the simulation accuracy used in this research was 0.5°×0.5° DEG grid, and the average area of each grid was about 2500 km2. In the simulation, the climate data, terrain data, soil data, and simulated ecosystem types in each grid were assumed consistent. Therefore, this paper had a reference value for a study in a national or larger regional scale that could not be used as a reference for a small-scale study.

The authors have declared that no competing interests exist.

[1]
Cai Yunlong, 1996. Sensitivity and adaptation of Chinese agriculture under global climate change.Acta Geographica Sinica, 51(3): 202-212. (in Chinese)

[2]
Fang Chuanglin, Wang Yan, 2016. A comprehensive assessment of urban vulnerability and its spatial differentiation in China.Journal of Geographical Sciences, 26(2): 153-170.The urban vulnerability poses a serious challenge to achieving sustainable development. With the concentration of the population and the economy, cities must manage the higher frequencies and risks of various hazards and are becoming more vulnerable. Research on the assessment and regulatory control of urban vulnerability is of great significance for both urbanization quality improvement and sustainable development in China or other countries in the world. Because of the complexity of cities and vulnerability concepts, existing studies have focused on different aspects of urban vulnerability. And the research content of urban vulnerability is scattered and relatively independent, leading to a lack of comparability among the research data and resulting in tremendous difficulties in summarizing the conclusions through comparison of independent research data. Therefore the goal of this study was to construct urban vulnerability index ( UVI ) from the perspective of sustainable development that could assess urban vulnerability comprehensively. In this study, we selected 10 subindexes involving 36 specific parameters from four aspects (resources, eco-environmental systems, economics, and social development) to construct a comprehensive index system. We also established the standard values of measurements. Then we take 288 prefecture-level cities in China as a study area and evaluate its overall urban vulnerability and its spatial differentiation. Results indicate that urban vulnerability of China has a remarkable spatial differentiation of both “gradient distribution” and “clustered distribution”; the extent of urban vulnerability corresponds to city size, the bigger the city, the lower its vulnerability; resource- based cities are more vulnerable than comprehensive cities; a city’s economic growth rate does not reflect the extent of its urban vulnerability. Further, we offer a few suggestions to cope with urban vulnerability in China.

DOI

[3]
Foley J A, Prentice I C, Ramankutty N,et al.., 1996. An integrated biosphere model of land surface processes, terrestrial carbon balance, and vegetation dynamics.Global Biogeochemical Cycles, 10(4): 603-628.Here we present a new terrestrial biosphere model (the Integrated Biosphere Simulator - IBIS) which demonstrates how land surface biophysics, terrestrial carbon fluxes, and global vegetation dynamics can be represented in a single, physically consistent modeling framework. In order to integrate a wide range of biophysical, physiological, and ecological processes, the model is designed around a hierarchical, modular structure and uses a common state description throughout. First, a coupled simulation of the surface water, energy, and carbon fluxes is performed on hourly timesteps and is integrated over the year to estimate the annual water and carbon balance. Next, the annual carbon balance is used to predict changes in the leaf area index and biomass for each of nine plant functional types, which compete for light and water using different ecological strategies. The resulting patterns of annual evapotranspiration, runoff, and net primary productivity are in good agreement with observations. In addition, the model simulates patterns of vegetation dynamics that qualitatively agree with features of the natural process of secondary succession. Comparison of the model's inferred near-equilibrium vegetation categories with a potential natural vegetation map shows a fair degree of agreement. This integrated modeling framework provides a means of simulating both rapid biophysical processes and long-term ecosystem dynamics that can be directly incorporated within atmospheric models.

DOI

[4]
Hutchinson M F, 1991. The application of thin plate splines to continent wide data assimilation. Data Assimilation Systems, BMRC Research Report No.27. Melbourne: Bureau of Meteorology.

[5]
International Geosphere-Biosphere Program - Data and Information System (IGBP-DIS), 1999. Global Soil Data Task: Spatial Data Base of Soil Properties, Toulouse, France.

[6]
IPCC, 2014.Climate Change 2014: Impacts, Adaptation and Vulnerability. Contribution of Working Group II to the Fifth Assessment Report of the Intergovernmental Panel on Climate Change. Cambridge, United Kingdom and New York, NY, USA: Cambridge University Press.

[7]
Kucharik C J, Foley J A, Delire C,et al.., 2000. Testing the performance of a Dynamic Global Ecosystem Model: Water balance, carbon balance, and vegetation structure.Global Biogeochemical Cycles, 14(3): 795-825.While a new class of Dynamic Global Ecosystem Models (DGEMs) has emerged in the past few years as an important tool for describing global biogeochemical cycles and atmosphere-biosphere interactions, these models are still largely untested. Here we analyze the behavior of a new DGEM and compare the results to global-scale observations of water balance, carbon balance, and vegetation structure. In this study, we use version 2 of the Integrated Biosphere Simulator (IBIS), which includes several major improvements and additions to the prototype model developed by Foley et al. [1996]. IBIS is designed to be a comprehensive model of the terrestrial biosphere; the model represents a wide range of processes, including land surface physics, canopy physiology, plant phenology, vegetation dynamics and competition, and carbon and nutrient cycling. The model generates global simulations of the surface water balance (e.g., runoff), the terrestrial carbon balance (e.g., net primary production, net ecosystem exchange, soil carbon, aboveground and belowground litter, and soil CO2 fluxes), and vegetation structure (e.g., biomass, leaf area index, and vegetation composition). In order to test the performance of the model, we have assembled a wide range of continental and global-scale data, including measurements of river discharge, net primary production, vegetation structure, root biomass, soil carbon, litter carbon, and soil CO2 flux. Using these field data and model results for the contemporary biosphere (1965芒聙聯1994), our evaluation shows that simulated patterns of runoff, NPP, biomass, leaf area index, soil carbon, and total soil CO2 flux agree reasonably well with measurements that have been compiled from numerous ecosystems. These results also compare favorably to other global model results.

DOI

[8]
Li Kerang, Huang Mei, Tao Bo et al., 2009. Process Modeling of China’s Terrestrial Ecosystem and Its Response to Global Change. Beijing: China Meteorological Press. (in Chinese)

[9]
Lieth H, Whittaker R H, 1975. Primary Productivity of the Biosphere. New York: Springer-Verlag.

[10]
Liu Yanhua, Li Xiubin, 2007. Fragile Ecological Environment and Sustainable Development. Beijing: The Commercial Press. (in Chinese)

[11]
Metzger M J, Schroter D, Leemans R,et al.., 2008. A spatially explicit and quantitative vulnerability assessment of ecosystem service change in Europe.Regional Environmental Change, 8(3): 91-107.

[12]
Minnen J G, van Onigkeit J, Alcamo J, 2002. Critical climate change as an approach to assess climate change impacts in Europe: Development and application.Environmental Science & Policy, 5(4): 335-347.This paper presents a new methodology called the “critical climate change” approach for evaluating policies for reducing climate change impacts on natural ecosystems. This method is particularly suited for integrated assessments because of its long-term and large-scale perspective. This is an analogous approach to the “critical loads” concept used for assessing regional air pollution impacts in Europe. Critical climate change is defined as the “quantitative magnitude of climate change (expressed as changes in temperature and precipitation) above which unacceptable long-term effects on ecosystems may occur, according to current knowledge”. The approach consists of four main steps: (1) Selection of appropriate indicators of climate change impact. Here we select changes in net primary productivity of ecosystems. (2) Assigning to the selected indicator a level of “unacceptable impact” of climate change. Here we assume this level to be at least a 10% loss in the net primary productivity of natural ecosystems, after considering other thresholds and the historical variation in ecosystem productivity. (3) Determining the response of the indicator to one or more climate-related driving force. This includes identifying the combinations of driving forces that produce the assigned unacceptable impact . (4) Computing the area where critical climate changes exceeded under climate change scenarios. An analysis of climate scenarios show that critical climate changes may be exceeded on 9–13% of Europe’s area by 2100, depending on the scenario. The areas where critical climate changes are exceeded are located mostly in southern Europe, even under relatively low emission scenarios.

DOI

[13]
Moss R H, Edmonds J A, Hibbard K A,et al.., 2010. The next generation of scenarios for climate change research and assessment.Nature, 463(7282): 747-756.

[14]
Neilson R P, 1995. A model for predicting continental-scale vegetation distribution and water balance.Ecological Applications, 5(2): 362-385.

[15]
Parton W J, Scurlock J M O, Ojima D S,et al.., 1993. Observation and modeling of biomass and soil organic matter dynamics for the grassland biome worldwide.Global Biogeochemical Cycles, 7(4): 785-809.Century is a model of terrestrial biogeochemistry based on relationships between climate, human management (fire, grazing), soil properties, plant productivity, and decomposition. The grassland version of the Century model was tested using observed data from 11 temperate and tropical grasslands around the world. The results show that soil C and N levels can be simulated to within 卤25% of the observed values (100 and 75% of the time, respectively) for a diverse set of soils. Peak live biomass and plant production can be simulated within 卤 25% of the observed values (57 and 60% of the time, respectively) for burned, fertilized, and irrigated grassland sites where precipitation ranged from 22 to over 150 cm. Live biomass can be generally predicted to within 卤50% of the observed values (57% of the time). The model underestimated the live biomass in extremely high plant production years at two of the Russian sites. A comparison of Century model results with statistical models showed that the Century model had slightly higher rvalues than the statistical models. Data and calibrated model results from this study are useful for analysis and description of grassland carbon dynamics, and as a reference point for testing more physiologically based models prediction's of net primary production and biomass. Results indicate that prediction of plant and soil organic matter (C and N) dynamics requires knowledge of climate, soil texture, and N inputs.

DOI

[16]
Prentice I C, Cramer W, Harrison S P,et al.., 1992. A global biome model based on plant physiology and dominance, soil properties and climate.Journal of Biogeography, 19(19): 117-134.A model to predict global patterns in vegetation physiognomy was developed from physiological considerations influencing the distributions of different functional types of plant. Primary driving variables are mean coldestmonth temperature, annual accumulated temeprature over$5^\circC$, and a drought index incorporating the seasonality of precipitation and the available water capacity of the soil. The model predicts which plant types can occur in a given environment, and selects the potentially dominant types from among them. Biomes arise as combinations of dominant types. Global environmental data were supplied as monthly means of temperature, precipitation and sunshine (interpolated to a global 0.5鈿琯rid, with a lapse-rate correction) and soil texture class. The resulting predictions of global vegetation patterns were in good agreement with the mapped distribution of actual ecosystem complexes (Olson, J.S., Watts, J.A. & Allison, L.J. (1983) ORNL-5862, Oak Ridge Nat. Lab., 164 pp.), except where intensive agriculture has obliterated the natural patterns. The model will help in assessing impacts of future climate changes on potential natural vegetation patterns, land-surface characteristics and terrestrial carbon storage, and in analysis of the effects of past climate change on these variables.

DOI

[17]
Shi Xiaoli.Risk assessment of Chinese ecosystem under climate change scenarios [D]. Beijing: Institute of Geographic Sciences and Natural Resource Research, Chinese Academy of Sciences, 2009. (in Chinese)

[18]
Sitch S, Smith B, Prentice I C,et al.., 2003. Evaluation of ecosystem dynamics, plant geography, and terrestrial carbon cycling in the LPJ dynamic global vegetation model.Global Change Biology, 9(2): 161-185.Abstract The Lund–Potsdam–Jena Dynamic Global Vegetation Model (LPJ) combines process-based, large-scale representations of terrestrial vegetation dynamics and land-atmosphere carbon and water exchanges in a modular framework. Features include feedback through canopy conductance between photosynthesis and transpiration and interactive coupling between these ‘fast’ processes and other ecosystem processes including resource competition, tissue turnover, population dynamics, soil organic matter and litter dynamics and fire disturbance. Ten plants functional types (PFTs) are differentiated by physiological, morphological, phenological, bioclimatic and fire-response attributes. Resource competition and differential responses to fire between PFTs influence their relative fractional cover from year to year. Photosynthesis, evapotranspiration and soil water dynamics are modelled on a daily time step, while vegetation structure and PFT population densities are updated annually. Simulations have been made over the industrial period both for specific sites where field measurements were available for model evaluation, and globally on a 0.5°° × 0.5°° grid. Modelled vegetation patterns are consistent with observations, including remotely sensed vegetation structure and phenology. Seasonal cycles of net ecosystem exchange and soil moisture compare well with local measurements. Global carbon exchange fields used as input to an atmospheric tracer transport model (TM2) provided a good fit to observed seasonal cycles of CO 2 concentration at all latitudes. Simulated inter-annual variability of the global terrestrial carbon balance is in phase with and comparable in amplitude to observed variability in the growth rate of atmospheric CO 2 . Global terrestrial carbon and water cycle parameters (pool sizes and fluxes) lie within their accepted ranges. The model is being used to study past, present and future terrestrial ecosystem dynamics, biochemical and biophysical interactions between ecosystems and the atmosphere, and as a component of coupled Earth system models.

DOI

[19]
Tian Yaping, Chang Hao, 2012. Bibliometric analysis of research progress on ecological vulnerability in China.Acta Geographica Sinica, 67(11): 1515-1525. (in Chinese)Taking CNKI as the main data source, this paper uses bibliometric methods to examine the present situation and the development of research on ecological vulnerability in China. Results show that ecological vulnerability has become a hotspot in China since 1989, and the research can be divided into three development stages. The initial stage (1989-2000) was mainly focused on qualitative research on preliminary theory discussion and regional countermeasures; the rapid development stage (2001-2007) was concentrated on method application and empirical evaluation, characterized by a large increase in literature numbers; the period since 2008 saw a boom of theoretical reviews and initial signs of comprehensive research. In the development process, the empirical research on vulnerability evaluation developed rapidly, whose research scope tended to be more comprehensive and balanced gradually instead of focus on the karst region in Southwest China and agro-pastoral zigzag zone in northern China. But on the whole the development of the theory research lags behind that of the method application, thus, at present, the empirical research method of ecological vulnerability evaluation in China are lack of theory standard, and the empirical research on ecological vulnerability still focus more on the single ecological system, and in existing comprehensive indexes of vulnerability evaluation, natural and economic indexes weight and its regional differences are relatively big, and social indicators weight and its regional differences are smaller.

DOI

[20]
Tüexen R, 1956. Die heutige potentielle natürliche Vegetation als Gegenstand der Vegetationskartierung: mit 10 Tabellen.Angewandte Pflanzensoziologie, 13: 5-42.react-text: 455 Modified versions of the VECEA map (now called the 'vegetationmap4africa') are available as web versions, Google Earth versions and Android versions from URL http://www.vegetationmap4africa.org, as well as interactive species selection and species distribution tools /react-text react-text: 456 /react-text

[21]
Woodward F I, Smith T M, Emanuel W R, 1995. A global land primary productivity and phytogeography model.Global Biogeochemical Cycles, 9(4): 471-490.A global primary productivity and phytogeography model is described. The model represents the biochemical processes of photosynthesis and the dependence of gas exchange on stomatal conductance, which in turn depends on temperature and soil moisture. Canopy conductance controls soil water loss by evapotranspiration. The assignment of nitrogen uptake to leaf layers is proportional to irradiance, and respiration and maximum assimilation rates depend on nitrogen uptake and temperature. Total nitrogen uptake is derived from soil carbon and nitrogen and depends on temperature. The long-term average annual carbon and hydrological budgets dictate canopy leaf area. Although observations constrain soil carbon and nitrogen, the distribution of vegetation types is not specified by an underlying map. Variables simulated by the model are compared to experimental results. These comparisons extend from biochemical processes to the whole canopy, and the comparisons are favorable for both current and elevated CO2 atmospheres. The model is used to simulate the global distributions of leaf area index and annual net primary productivity. These distributions are sufficiently realistic to demonstrate that the model is useful for analyzing vegetation responses to global environmental change.

DOI

[22]
Wu Shaohong, Yin Yunhe, Zhao Huixia,et al.., 2005. Recognition of ecosystem response to climate change impact.Advances in Climate Change Research, 1(3): 115-118. (in Chinese)Observed global warming has impacted on ecosystems directly and indirectly. Governments, enterprises and common people in the world pay attention to the climate change of mainly global warming. General recognition for coping with the negative impact of climate change is to adopt adaptation and mitigation strategies, which are two aspects of sustainable development supporting each other. According to the definition of "dangerous anthropogenic interference with the climate system" addressed by the Article 2 of UNFCCC, "dangerous climate" to which man can not adapt is taken as the "threshold" of the impact of climate change on different systems. Such a threshold is the integrated result of climate impact level and the adaptive capacity of a system. Lagged studies and uncertainties of climate change make the threshold still unquantified. Therefore, when, where and how would mitigation be implemented has not been clear. This paper focuses on the impact of climate change on ecosystem, and analyzes key issues for determining the threshold, such as the definition, processes, criteria and assessment of ecosystem adaptive capacity. Simulation and assessment of China's ecosystems are performed with the CEVSA model and an artificial neural network (ANN) model. Preliminary results show that ecosystems of China are mainly in ecological baseline, slightly and moderately unadapted states, and the completely unadapted state does not occur. The B2 climate scenario (about 3.2鈩 rising) has a certain positive impact on ecosystem in Northeast China, while the A2 climate scenario (about 3.89鈩 rising) has a negative impact on ecosystem in East China.

[23]
Wu Shaohong, Dai Erfu, Huang Mei,et al.., 2007. Study on the vulnerability of ecological system in China under the future climate change scenario (B2) in 21st century.Chinese Science Bulletin, 52(7): 811-817. (in Chinese)

[24]
Wu Shaohong, Huang Jikun, Liu Yanhua,et al.., 2014. Pros and cons of climate change in China.China Population, Resources & Environment, 24(1): 7-13. (in Chinese)

[25]
Ye Duzheng, 1992. Prestudy of China’s Global Change. Beijing: China Meteorological Press. (in Chinese)

[26]
Yu Li, Cao Mingkui, Tao Bo,et al.., 2008. Quantitative assessment of the vulnerability of terrestrial ecosystems of China to climate change based on potential vegetation.Journal of Plant Ecology, 32(3): 521-530. (in Chinese)Aims Assessment of the sensitivity and vulnerability of terrestrial ecosystem to climate change is one of the most important aspects of global change research. Our objective was to develop a new approach to assessing the vulnerability of terrestrial ecosystem using a process-based ecosystem model.Methods We developed a new quantitative approach to assess vulnerability of terrestrial ecosystems based on an ecosystem process model with two aspects: vegetation changes and ecosystem function changes. In accordance with the definition of vulnerability used by the Intergovernmental Panel on Climate Change (IPCC), we used change times and changing direction of vegetation as key indicators of sensitivity and adaptation of vegetation responses to climate change. We also used the function's annual variability and its trend as indicators of sensitivity and adaptation of ecosystem functions response to climate change, respectively. Based on these indicators, the integrated vulnerability was determined, including assessment under the contemporary climate condition and future climate change scenarios.Important findings The more vulnerable ecosystems were found in the north and west areas of China, with less vulnerable ecosystems mostly in the south and east. The vulnerability of ecosystems would increase with climate change, but the pattern of vulnerability would be little changed by the end of this century, depending on the scenarios. The percentage of non-vulnerable ecosystems would be reduced by about 22%, and the highly and exceedingly vulnerable ecosystems would be reduced by about 1.3% and 0.4%, respectively. Most highly vulnerable ecosystems are distributed in northwestern China, Inner Mongolia, south of the Tibet Plateau and some areas of northern and northeastern China, both under contemporary climate condition and the future climate change scenarios, and they were mainly scattered in transition eco-zones and grassland-desert ecosystems in northwestern China. When investigated regionally, the vulnerability would increase in southern, central, northwestern and southwestern China, but vulnerability would decrease in northern and northeastern China and Inner Mongolia of China.

[27]
Yuan Quanzhi, Wu Shaohong, Zhao Dongsheng,et al.., 2014. Modeling net primary productivity of the terrestrial ecosystem in China from 1961 to 2005.Journal of Geographical Sciences, 24(1): 3-17.网络主要生产率(NPP ) 是代表生态系统的结构和函数的最重要的索引。NPP 能被动态全球植被模型(DGVM ) 模仿,它被设计相对环境变化代表植被动力学。这研究在气候,土壤,和地形学上与数据基于 DGVM 综合生物圈模拟器(朱鹭) 模仿了瓷器生态系统的 NPP。在瓷器陆上的生态系统的 NPP 模拟的朱鹭的适用性首先被验证。有另外的相关研究的比较显示范围和模拟的吝啬的价值通常在观察的限制以内;全面模式和全部的年度 NPP 接近与另外的模型一起进行的模拟。模拟基于遥感离 NPP 评价也靠近。确认证明那朱鹭能在瓷器自然生态系统在 NPP 的大规模模拟被利用。我们然后从 1961 ~ 2005 与气候变化数据模仿了 NPP,当温暖是特别地惹人注目的时。下列是模拟的结果。(1 ) 全部的 NPP 在过去的 45 年里从 3.61 GtC/yr 变化了到 4.24 GtC/yr 并且展出了最小的重要线性增加或减少。(2 ) 在增加的地区性的差别或在 NPP 的减少大,但是展出了一个不足道的全面线性趋势。NPP 在大多数部分衰退了东方并且华中,特别在黄土高原。(3 ) 类似于年度 NPP 的变化法律,季节的 NPP 也显示了不足道的增加或减少;趋势线在一般水平以内。(4 ) 在季节的 NPP 变化的地区性的差别大。NPP 在黄土高原在春天,夏天,和秋天衰退了,但是在西藏的高原的大多数部分增加了。

DOI

[28]
Yuan Quanzhi, Zhao Dongsheng, Wu Shaohong,et al.., 2011. Validation of the integrated biosphere simulator in simulating the potential natural vegetation map of China.Ecological Research, 26(5): 917-929.The Integrated Biosphere Simulator (IBIS)—a Dynamic Global Vegetation Model—was validated by simulating the potential natural vegetation map of China using data on monthly mean climate from 1961 to 1990, soil texture, and topography. Although the vegetation map simulated by IBIS was able to describe the sketch of vegetation patterns in China, the distributions of several plant functional types (PFTs) and vegetation types were still simulated incorrectly, especially in eastern temperate areas, southern subtropics, the southern Sichuan basin, and the Hengduan mountains area. By adjusting some of the climatic constraints and physiological parameters of PFTs defined in IBIS, the simulated distributions of PFTs became reasonable, and the simulated vegetation map fitted the natural vegetation map better. The kappa statistic between the simulated and the natural vegetation maps was 0.76, an increase of 16.9% from the previous parameter adjustment of 0.65. Correspondingly, the degree of agreement between these two maps rose from “good” to “very good”. After the parameter adjustments, IBIS became more suitable for the large-scale simulation of Chinese natural vegetation distributions and could provide a powerful support to reveal the dynamic responses of terrestrial ecosystems to climate change in China.

DOI

[29]
Zhao Dongsheng, Wu Shaohong, 2014. Vulnerability of natural ecosystem in China under regional climate scenarios: An analysis based on eco-geographical regions. Journal of Geographical Sciences, 24(2): 237-248.对为到气候变化的自然生态系统的危险的评价是在气候变化和生态学的一个热话题,并且将支持适应并且减轻的气候变化。在这研究,根据瓷器自然生态系统的特征修改的 LPJ 模型被雇用在 A2, B2 和 A1B 情形下面模仿生态系统动力学。到气候变化的自然生态系统的危险根据危险评价模型的意见被估计。基于 eco 地理的区域,到气候变化的自然生态系统的危险被分析。结果为自然生态系统将在东方加强并且在生态系统危险的西方,而是模式变弱的瓷器建议那危险别被气候变化改变,它逐渐地向东北从东南升起到。在脆弱的度将主要在适度的 humid/sub-humid 区域和温暖的适度的 humid/sub-humid 区域集中的生态系统增加。在生态系统的减少脆弱的度可以出现在西北的干旱区域和 Qinghai 西藏高原区域。在近期的规模,在中国的自然生态系统将被气候变化稍微影响。在中间、长期的规模,不管多么将有严重地不利的效果,特别地在有更好的水和热状况的东方。

DOI

[30]
Zhao Yuelong, 1999. Types Distribution and Comprehensive Improvement of Fragile Ecological Environment in China. Beijing: China Environmental Science Press. (in Chinese)

[31]
Zheng Du, 2008. Chinese Eco-geographical Regionalization Research. Beijing: The Commercial Press. (in Chinese)

Outlines

/