Orginal Article

An automated method for mapping physical soil and water conservation structures on cultivated land using GIS and remote sensing techniques

  • Asnake MEKURIAW , 1, 2 ,
  • Andreas HEINIMANN 3 ,
  • Gete ZELEKE 4 ,
  • Hans HURNI , 3 ,
  • Kaspar HURNI 3
Expand
  • 1. Natural Resources Management Department, Bahir Dar University, Bahir Dar, Ethiopia
  • 2. Geospatial Data and Technology Center, Bahir Dar University, Bahir Dar, Ethiopia
  • 3. Center for Development and Environment, University of Bern, Switzerland
  • 4. Water and Land Resource Center, Addis Ababa, Ethiopia

Author: Asnake Mekuriaw, PhD, E-mail:

*Corresponding author: Hans Hurni, Professor, E-mail:

Received date: 2015-07-11

  Accepted date: 2015-09-08

  Online published: 2017-02-10

Copyright

Journal of Geographical Sciences, All Rights Reserved

Abstract

An efficient and reliable automated model that can map physical Soil and Water Conservation (SWC) structures on cultivated land was developed using very high spatial resolution imagery obtained from Google Earth and ArcGIS®, ERDAS IMAGINE®, and SDC Morphology Toolbox for MATLAB and statistical techniques. The model was developed using the following procedures: (1) a high-pass spatial filter algorithm was applied to detect linear features, (2) morphological processing was used to remove unwanted linear features, (3) the raster format was vectorized, (4) the vectorized linear features were split per hectare (ha) and each line was then classified according to its compass direction, and (5) the sum of all vector lengths per class of direction per ha was calculated. Finally, the direction class with the greatest length was selected from each ha to predict the physical SWC structures. The model was calibrated and validated on the Ethiopian Highlands. The model correctly mapped 80% of the existing structures. The developed model was then tested at different sites with different topography. The results show that the developed model is feasible for automated mapping of physical SWC structures. Therefore, the model is useful for predicting and mapping physical SWC structures areas across diverse areas.

Cite this article

Asnake MEKURIAW , Andreas HEINIMANN , Gete ZELEKE , Hans HURNI , Kaspar HURNI . An automated method for mapping physical soil and water conservation structures on cultivated land using GIS and remote sensing techniques[J]. Journal of Geographical Sciences, 2017 , 27(1) : 79 -94 . DOI: 10.1007/s11442-017-1365-9

1 Introduction

1.1 The need for mapping physical soil and water conservation structures

Identifying and mapping the existing physical SWC technologies is crucial to determine the adoption rate of specific conservation measures and their effectiveness against land degradation and soil erosion. Recognizing the importance of mapping SWC measures, World Overview of Conservation Approaches and Technologies (WOCAT) researchers launched an initiative to develop a world map displaying areas where land resources are being used sustainably (Schwilch et al., 2004). Bringing together various experts and land users, WOCAT teams have identified, documented, and mapped SWC technologies and approaches in numerous countries (Liniger et al., 2007). They assessed the spatial extent, effectiveness and impacts of conservation measures using qualitative data (Van Lynden et al., 2012).
In the Ethiopian Highlands, physical SWC structures have been constructed on cultivated land for many years, in an effort to reverse land degradation and improve crop yields. Although physical SWC structures have been used throughout the country since the 1970s, there is no record of where they have been maintained. Having scientific data on the spatial extent of physical SWC structures can be helpful to identify areas where these measures are being effectively used as well as areas where urgent intervention is needed to manage the land resource sustainably. To date, however, the challenges of detecting physical SWC structures over a larger area in an efficient and automated manner have not been addressed in the literature. Nevertheless, recent advances in remote sensing techniques and image analyst software, as well as the need for mapping physical SWC structures over large areas, encouraged us to develop an automated method capable of mapping physical SWC structures on cultivated lands.

1.2 Remote sensing imagery for linear feature mapping

Linear features are geographic elements that can be represented by a line or set of lines, i.e. polylines. Rivers, roads, electric and telecommunication networks, pipelines, field boundaries, trails, physical SWC structures, and ditches are all linear features. Linear features refer to man-made objects, such as field boundaries, stone/soil bunds, ditches, and terraces (Bailly et al., 2008). On satellite imagery, a linear feature is defined as a sequence of points that has a maximum or minimum Digital Number (DN) value not surrounded by pixels of higher gray values in a linear window, or it is manifested as an abrupt change in DN along a certain direction in an image (Gao, 2009).
Although the extraction of large features from coarse imagery is not a difficult task, extraction of small objects or linear features is challenging (Quackenbush, 2004). In moderately high spatial resolution imagery, the pixel size is wider than the dimensions of the linear features, which complicates automated extraction of these features. However, high spatial resolution imagery has very rich and clear information about the target object (Li et al., 2010) and typically has pixels that are smaller than the dimensions of the targeted linear features. Thus, high spatial resolution imagery has become very useful for linear feature extraction and is now used by several researchers for road mapping and other purposes. Very high spatial resolution satellite imagery is necessary for automated linear feature detection (Quackenbush, 2004; Bailly et al., 2008), and has become a determinant for the effectiveness of available linear feature extraction algorithms and techniques (Gao, 2009). Yang and Zhu (2010) have clearly indicated that successful linear feature extraction depends on the spatial resolution of the image.
Several researchers have used different imagery for the extraction of linear features such as roads, ditches, and pipelines. For example, radar data was used for road extraction (Hellwich et al., 2002). Bhakar et al., (2010) used ASTER Digital Elevation Model (DEM), for the extraction of irrigation networks. Bailly et al. (2008) used airborne Light Detection and Ranging (LiDAR) data for ditch network extraction. Yun and Uchimura (2007) extracted road networks efficiently from IKONOS images. Frigato and Silva (2008) used QuickBird satellite imagery for the extraction of roads. Kim and Hong (2012) were able to detect boundaries in areas of diverse land cover using IKONOS data.
Therefore, the very high spatial resolution remote sensing imagery (on the order of meters and centimeters) provided by sensors such as QuickBird (DigitalGlobe, Inc., Longmont, CO), SPOT (Spot Image, Toulouse, France), GeoEye (DigitalGlobe, Inc., Longmont, CO), OrbViewSM (GeoEyeSM Imagery Collection Systems, Inc., Herndon, VA) and IKONOS (DigitalGlobe, Inc., Longmont, CO) is useful for recognizing and detecting small objects and linear features. At present, Google Earth provides such a very high spatial resolution images from airborne and space-borne remote sensing, sufficient for extraction of objects (Guo et al., 2010). Hence, Google Earth has been used by numerous people as a source of high spatial resolution imagery for different applications (Allen, 2009).

1.3 Linear feature mapping techniques

GIS has become extremely useful when detecting small and linear objects on Earth’s surface (Gao, 2009; Huang et al., 2010). Similarly, at present various software programmes used to detect and analyse objects from remote sensing images. These include ERDAS IMAGINE® (Intergraph Corporation, Huntsville, AL), ArcGIS®, and SDC Morphology Toolbox for MATLAB, version 1.6. (developed by SDC Information Systems, Naperville, IL).
A wide range of techniques for detecting and extracting linear features from very high spatial resolution imagery have been developed and used by researchers. Most of them were developed to detect and map roads (Quackenbush, 2004). Some of the techniques are automated (e.g. Baumgartner et al., 1999), whereas others are semi-automated (e.g. Yun and Uchimura, 2007). The most popular automated techniques used for linear and non-linear feature detection from high-resolution images are edge detection (e.g. Tamilarasi and Duraiswamy, 2010), mathematical morphology (e.g. Frigato and Silva, 2008; Bhirud and Mangala, 2011), segmentation/classification (e.g. Yang and Wang, 2007; Jin and Feng, 2010), and the Hough transform (e.g. Fitton and Cox, 1998).
Though there are many linear-feature extraction methods and algorithms (e.g. for roads and geological lineaments), no single method is able to detect and map physical SWC structures effectively on its own (Figure 1). Indeed, the approaches used to detect and map linear features such as roads and ditches - can be used in combination with other techniques to map physical SWC structures.
In very high spatial resolution imagery, linear features such as physical SWC structures, roads, rivers, railways, and field and vegetation boundaries are visible and can be extracted manually or automatically. Some researchers argue that a semi-automated approach to this task is ideal because people can identify objects almost perfectly even in a noisy image (Quackenbush, 2004). Yang and Zhu (2010) confirmed that centrelines can be extracted rapidly and accurately from 0.6-m-resolution QuickBird and 1-m-resolution IKONOS satellite images using a semi-automatic method. It should be noted, however, that manual techniques are time-consuming and costly when used exclusively and are not advisable in an era when high-resolution imagery and several powerful image-processing systems are available. On the other hand, the automatic extraction of linear features is doubtless important to the fast and effective processing of raster imagery and for covering large areas within a short time, depending on the processing capacity of the computer. Thus, automated extraction of linear features from raster imagery has become a very important part of image processing systems, such as ArcGIS and ERDAS IMAGINE®, and has grabbed the attention of several researchers.
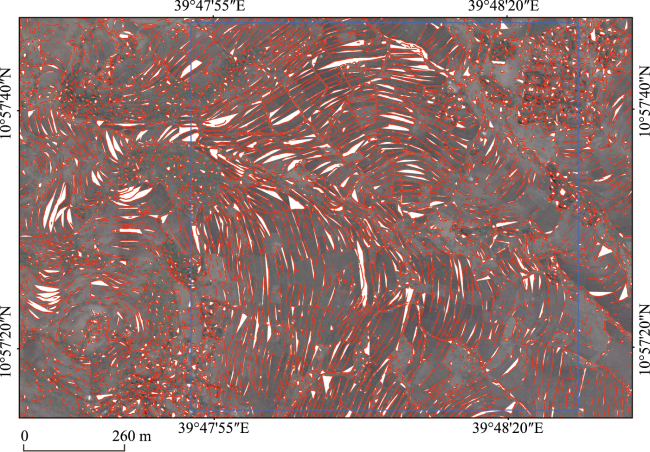
Figure 1 Linear and non-linear features detected after edge detection technique and vectorization
Mapping the spatial distribution of physical SWC structures is important in order to identify the extent of conserved and non-conserved areas on national, regional, and local levels. However, to date no method capable of automatically detecting and mapping such structures on cultivated land has been developed. Realizing these gaps the study aimed at developing automated model that can map existing physical SWC structures on cultivated lands in the Ethiopian Highlands.

1.4 Objective

The objective of this paper was to develop a model capable of mapping physical SWC structures on cultivated lands.

2 Material and Methods

2.1 Materials

The main data used for developing the mapping model was satellite imagery and verified physical SWC structures. The satellite data comprised very high spatial resolution images (pixel size less than or equal to 1 m) available from Google Earth. The Google Earth was chosen as the source of satellite imagery because it provides very high spatial resolution images covering large areas free of charge, and its detailed and comprehensive coverage of Earth’s surface. Thus, after identifying the areas for which very high spatial resolution satellite images were available from Google Earth, we downloaded, georeferenced, and mosaicked the images using ERDAS IMAGINE® and ArcGIS®. To process the data image analyst software such as ERDAS IMAGINE®, ArcGIS® and SDC Morphology Toolbox for MATLAB, version 1.6 were used. This is because individual software programmes may be effective in one step but less effective in other steps. For example, ERDAS IMAGINE® is effective for image classification but not for vectorization or morphological operations. By contrast, ArcGIS® and SDC Morphology Toolbox for MATLAB 1.6 are very effective when it comes to vectorization and morphological operations, respectively, but are less effective for image classification. Therefore, software programmes mentioned previously were used to develop a mapping method for physical SWC structures in the present study.

2.2 Methods

2.2.1 Case study area selection
To map the physical SWC structures, the availability of very high spatial resolution satellite imagery (1 meter or better) was critical. Because the edge detection and image classification algorithms used by image analyst software programmes may not properly detect SWC structures in images whose individual pixels are larger than the width of individual structures (Chang et al., 2004).
Google Earth provides very high spatial resolution satellite imagery for large areas of Ethiopia and other countries. When the present study was launched, suitable Google Earth imagery was available on two strips (Figure 2). Because of this, the two strips were selected to develop the physical SWC structure mapping model. Then each strip was divided into small grids (1 km by 1 km). After this, the cultivated lands with dense physical SWC structures were assessed grid by grid using Google Earth. Based on the availability of physical SWC structures, a total of 28 grids were selected randomly for the case study areas (18 from one strip and 10 from the other strip).
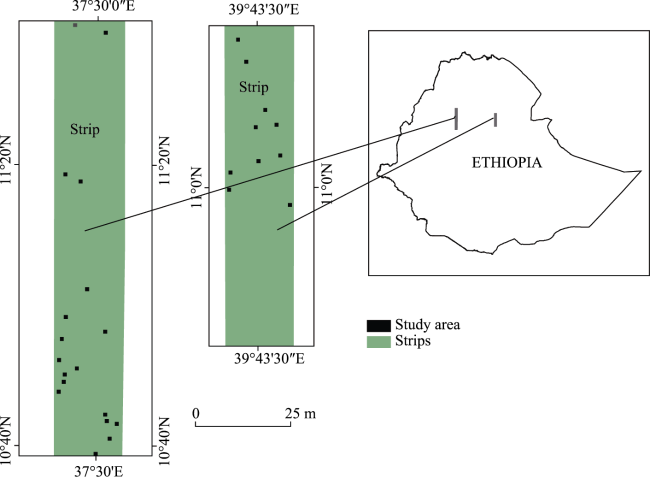
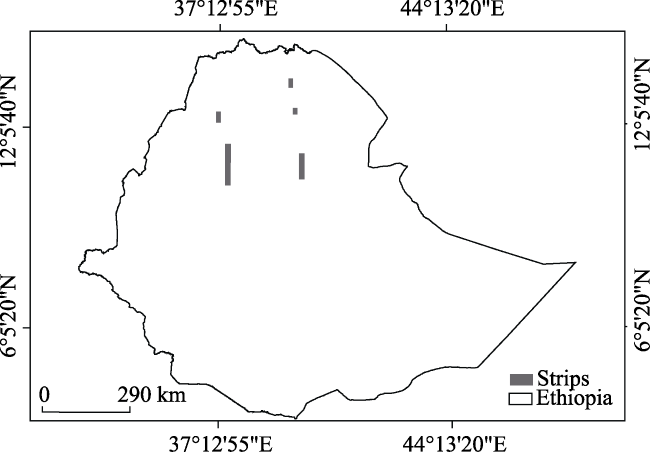
Figure 2 Location map of the study area
2.2.2 Ground truthing
Ground truthing is necessary for checking the accuracy and quality of an object being mapped remotely. This is usually done based on ground references, obtained by observing the object and collecting its geographical coordinates (Gao, 2009). Therefore, after the physical SWC structures and other linear features were mapped in analogue format, the following steps were used to verify the accuracy and quality of the map. First, the case study areas were identified on the ground using the prepared map and a handheld Global Positioning System (GPS) - specifically GPSMAP® 60CSx (Garmin Ltd., Southampton, United Kingdom) - with an accuracy of ±3 m. Second, linear features mapped as physical SWC structures were verified by travelling to each plot. To accommodate cases where physical SWC structures had been demolished or had been shifted on cultivated land but still existed on the map, the landowners and the local development agents were asked to pinpoint where structures had been constructed. Linear features mapped as trails and rivers were verified following the same procedure.
2.2.3 Image processing
On the very high spatial resolution input images, objects (with differences in shape, tone, and texture) on the targeted surface are clearly visible (Figure 3). However, extracting specific objects is difficult because the imagery contains numerous features including physical SWC structures, trails, rivers, field boundaries, grazing land, houses, and trees.
Figure 3 clearly shows that within the cultivated lands of the Ethiopian Highlands where physical SWC structures have been built, different land uses including grazing, vegetation, and housing were found. Therefore, to detect and map physical SWC structures from such image the following image processing procedures were used.
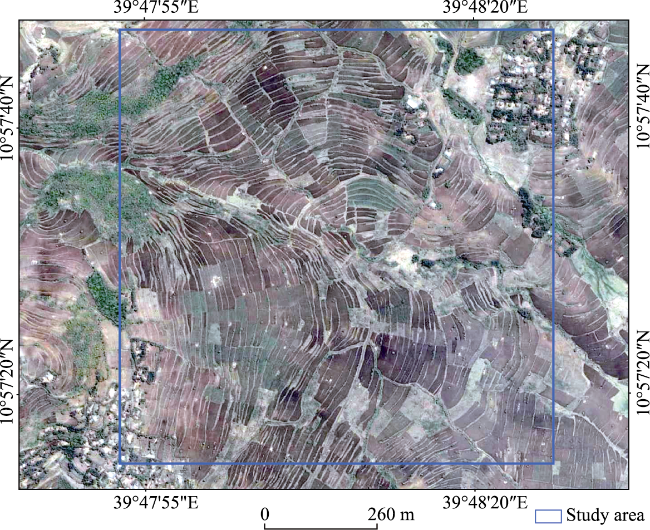
Figure 3 Map showing an input image obtained from Google Earth
(1) Edge detection
Edge detection is a technique or algorithm that is used to detect and extract edges from an input image based on discontinuities in DN values (Tamilarasi and Duraiswamy, 2010). Similarly, Rowe and Grewe (2001) found that edge detection is effective in detecting linear features in high spatial resolution images. Thus it is an important step in finding changes in the intensity value of pixels as well as in the structure of objects found in an input image (Roushdy, 2006). A spatial filter is required to determine whether a certain pixel belongs to an edge set or not (Singh and Singh, 2012). Structural features were extracted using the Laplacian filter (Aksoy et al., 2012). Pirasteh et al., (2011) found that the high-pass filter is more reliable for the detection of geo-structural lineaments than the low-pass, Laplacian, and directional filtering techniques.
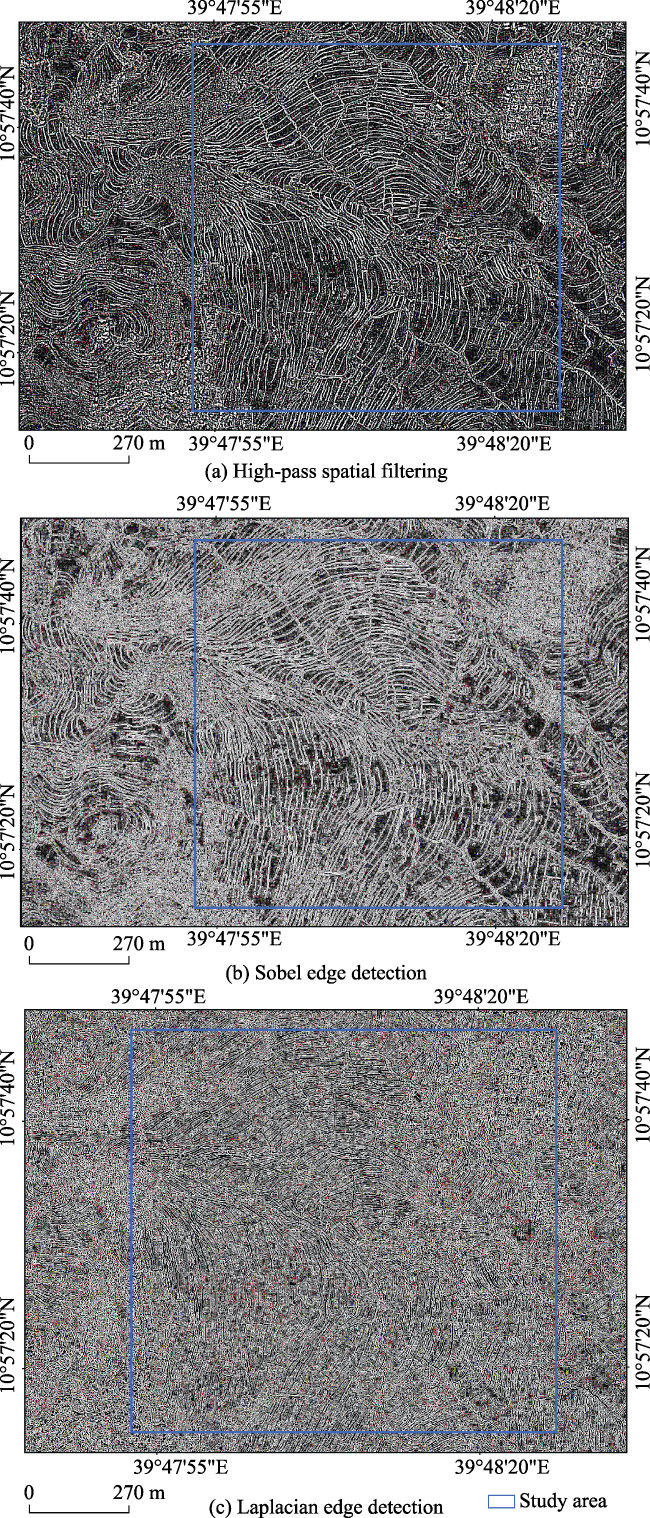
Figure 4 Map showing different linear features after applying High-pass spatial filtering (a), Sobel edge detection (b), and Laplacian edge detection (c)
In this study, different spatial enhancement functions, such as high-pass spatial filtering, Laplacian edge detection, and non-directional edge filters (e.g. the Sobel and Prewitt operators), were tested to enhance the linear features. As can be seen in Figure 4a, the high spatial filter algorithm can effectively detect physical SWC structures and other linear features than other techniques. Therefore, different linear features on the cultivated lands were enhanced and identified using a high-pass spatial filter available in ERDAS IMAGINE® software.
Although physical SWC structures were enhanced, other features with similar DN values also appeared over the cultivated land. In addition, certain linear structures that appeared continuous in the input image ended up looking segmented in the enhanced image. However, the edge enhancement process successfully distinguished most of the necessary features and unwanted edges. To minimize the distribution of unwanted edges, an image classification method was used.
(2) Image segmentation using the ISODATA algorithm
In different sites we observed that physical SWC structures generally have good contrast from adjacent cultivated lands, except when the cultivated land is covered by mature crops or the straw of barley, maize, teff, wheat, and sorghum. However, field boundaries, grazing lands, trails, ditches, and threshing plots have spectral characteristics similar to those of the physical SWC structures. This indicates that the DN values of physical SWC structures are within a certain range. Therefore, after high-pass spatial filtering was performed, image segmentation using the ISODATA algorithm was applied to divide the images into two classes (i.e. smooth and sharp). Similarly, Yang and Wang (2007) and Jin and Feng (2010) used automatic segmentation to detect various roads. Pixels with a more or less similar DN value were divided into the same classes. This made it possible to preserve physical SWC structures while filtering out the majority of unwanted small objects. However, unwanted features such as small isolated objects, branches, and linear and nonlinear elements exist on the target image because their pixel spectral characteristics are similar to those of nearby physical SWC structures.
(3) Morphological processing
Linear features can be properly detected from binarized images based on its geometric structures (Tamililakkiya et al., 2011). Therefore, to facilitate detection and extraction of physical SWC structures on the basis of their shape and structure and the removal of unwanted linear features, the imagery was binarized for further processing. After this SDC Morhology Toolbox for MATLAB 1.6 (an image processing and analysis system based on the geometric structure within an image) and the programme Mathematical
Morphology Toolbox contained in MATLAB® 2010a (MathWorks®, Inc., Natick, MA) software was used to detect and extract physical SWC structures. Then, dilation and erosion morphological operations such as opening, closing, thinning and skeletonization were applied (Figure 5). The dilation operator has expanding and filling effects, i.e. it adds pixels to the target object. By contrast, the erosion operator has eliminating and shrinking effects, i.e. it removes pixels from the target object based on the defined structure element (Quackenbush, 2004).
2.2.4 Vectorization
The skeletonized raster data obtained using mathematical morphology was exported to ArcGIS. Then the raster data was converted to vector features using the centreline vectorization algorithm, which generated vector features along the centre of the raster linear elements. The majority of physical SWC structures and other unwanted linear features were extracted (Figure 6).
2.2.5 Application of statistical techniques for removal of unwanted linear features
In GIS, features are described according to their spatial information and attributes (Shahin, 1997). For physical SWC structures, the spatial information includes an object’s shape (structure) and geographical coordinates, whereas the important attributes are compass direction and length.
Figure 6 shows that most extracted polylines represent physical SWC structures, and they have similar directions in a given land unit. However, in the case study area (1 km2) where the aspect is quite heterogeneous, it is difficult to ascertain the major direction of the extracted polylines. To get a land unit in which most of the polylines have a similar direction the case study area was divided into land units: 30 m by 30 m, 50 m by 50 m and 100 m by 100 m. In rugged topography, the 50 m by 50 m unit gives better result. However, in flat lands the 100 m by 100 m units give better result. In both landscapes, the 100 m by 100 m gives better result (Figure 7). Therefore, to get a land unit in which most of the polylines have a similar direction, each case study area was divided into 100-ha units, 100 m by 100 m each. Here, the assumption was that use of length and compass direction classes made it possible to preserve physical SWC structures and also remove unwanted linear features because the physical structures represent the primary direction on any cultivated land where the structures are maintained.
(a) Result obtained after classifying the site into 30 m by 30 m grid
(b) Result obtained after classifying the site into 50 m by 50 m grid
(c) Result obtained after classifying the site into 100 m by 100 m grid
(d) Verified SWC structures
Therefore, physical SWC structures were preserved and mapped (Figure 8) using the following procedures. The extracted polylines were split per ha and the length of each line was calculated. Once this was done, the compass direction of each line was determined and displayed in terms of azimuth angles. After the compass direction of each line (0°-360°) was calculated, it was reduced to 0° to 180° because no direction is given per vector. The 0° to 180o compass directions were divided into four direction classes. Each line was then put into a direction class based on its compass direction and, the sum of all vector lengths per compass direction class per ha was calculated. Finally, the top-length class from each hectare was selected and the remaining direction classes were removed using MySQL Workbench5.2 CE.
Figure 5 Map showing physical SWC structures and other linear features after skeletonization
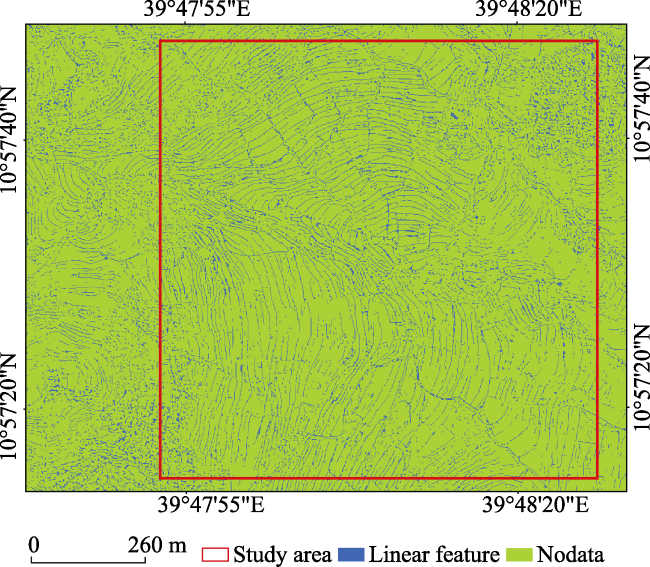
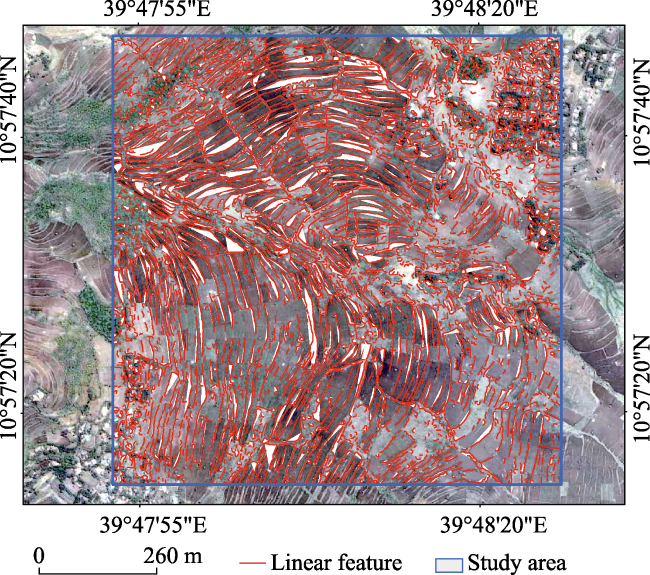
Figure 6 Map showing the extracted linear features
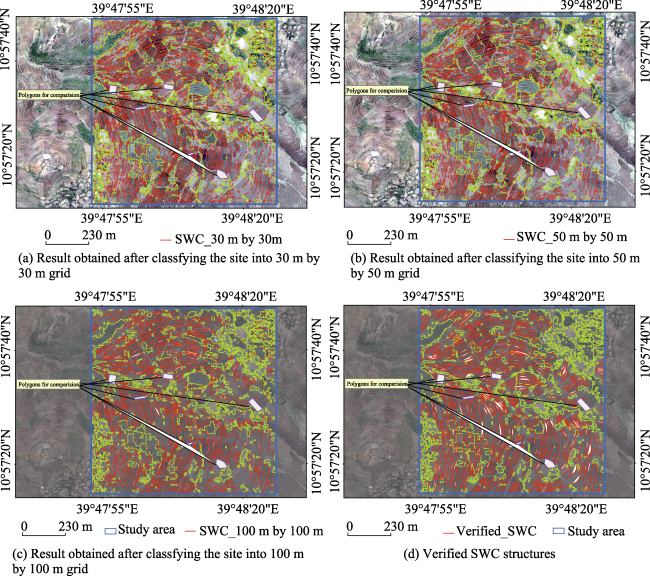
Figure 7 Maps showing SWC structure obtained in different land units: 30 m by 30 m (a), 50 m by 50 m (b), 100 m by 100 m (c) and verified SWC structure (d)
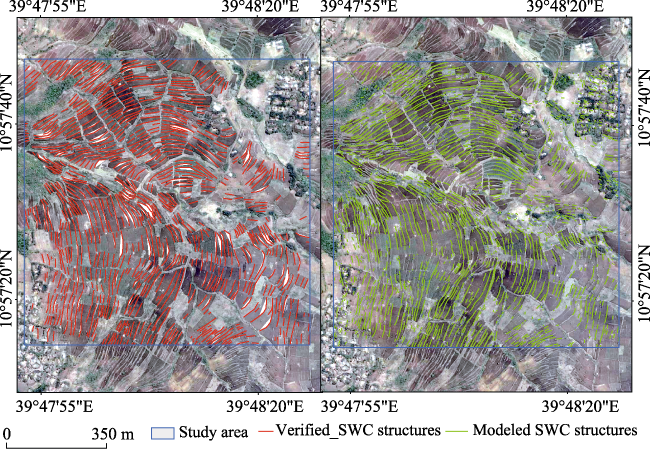
Figure 8 Map showing the verified (left) and automatically mapped (right) physical SWC structures in one site

3 Calibration and validation of the model

The developed model was calibrated in the Ethiopian Highlands to check its accuracy. For this purpose 26 sites (1 km2 each) were randomly selected from areas where very high spatial resolution satellite images were available on Google Earth and the physical SWC structures in each area were mapped in the field using the procedure described in section 2.2.2. In addition, the physical SWC structures were mapped automatically using the developed model. After this, each site was split into 100-ha units. Then the total length of the mapped and predicted physical SWC structures was calculated. Finally, the length of the mapped physical SWC structures was correlated with the length of the modelled structures. The result shows that there was a strong positive correlation between the lengths of the verified and predicted physical SWC structures. In addition, there is a significant relationship between the two variables (Figure 9a), r2 = .90, n = 26, p < 0.001. The result also shows that the model could correctly map nearly 80% of the physical SWC structures, missing about 20% of the necessary structures. Therefore, it can be concluded that the proposed model performed well when mapping physical SWC structures from high spatial resolution satellite imagery.
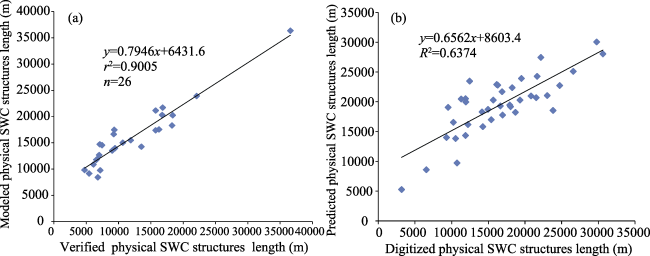
Figure 9 Graph showing the relationship between verified and predicted physical SWC structures (calibration samples sites: n = 26) (a), and the relationship between digitized and predicted physical SWC structures (validation samples sites: n = 39) (b)
The developed model was validated in the Ethiopian Highlands to check its applicability. For this, 39 sample sites (1 km2 each) were randomly selected from five strips (Figure 10). In each site, the physical SWC structures were digitized from the imagery, and each site was split into 100-ha units. The total length of the digitized physical SWC structures was then calculated. In the same site, the physical SWC structures were predicted using the developed model. Following this, the total length of the modelled physical SWC structures was calculated. Finally, the length of the digitized physical SWC structures was correlated with the length of the modelled structures (Figure 9b).
There was a positive correlation between the digitized and predicted physical SWC structures, r2=.64, n = 39, p < 0.001. As shown in the graph (Figure 9b), a moderate relationship between the digitized and predicted terrace lengths was found in some sites. This moderate relationship occurred in sample sites where most of the land is non-cultivated and covered mainly by vegetation and also in areas where the images were taken during the harvest season. However, this discrepancy did not significantly affect the validation of the model. Overall, there was a positive correlation between the digitized and predicted terraces. This result indicates that the developed model effectively predicted the physical SWC structures from high spatial resolution satellite imagery of the sample sites and thus can be applied to other areas. The model has also been applied in different areas of the Ethiopian Highlands with varied ground cover and with high spatial resolution images taken in dry season. The model was able to properly map the physical SWC structures from different images and areas (Figure 11), demonstrating its versatility.
Figure 10 Map showing the strips where the model was validated
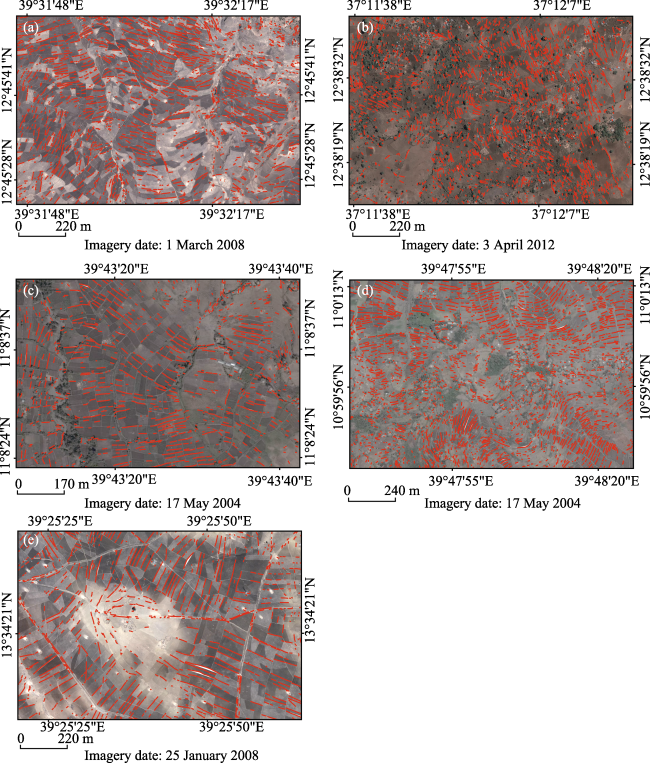
Figure 11 Maps showing the physical SWC structure detected and mapped in the Ethiopian Highlands using the developed model

4 Discussion

The developed model is very efficient for mapping the physical SWC structures on cultivated land in circumstances where very high spatial resolution imagery is available. It was observed that in areas where the cultivated land was covered by the straw of crops or in areas where the images were taken during crop growing season, it is very difficult to separate the physical SWC structures from other features.
Figure 12 presented an example of the verified and modelled physical SWC structures. The red and green lines indicate the verified and modelled physical SWC structures, respectively. The results show that the model has efficiently mapped the physical SWC structures on the cultivated lands. However, linear features that have similar intensity and geometric shapes as the terraces (e.g. field boundaries, ditches, streams, and trails) were also mapped, and both types are clearly visible on the superimposed maps.
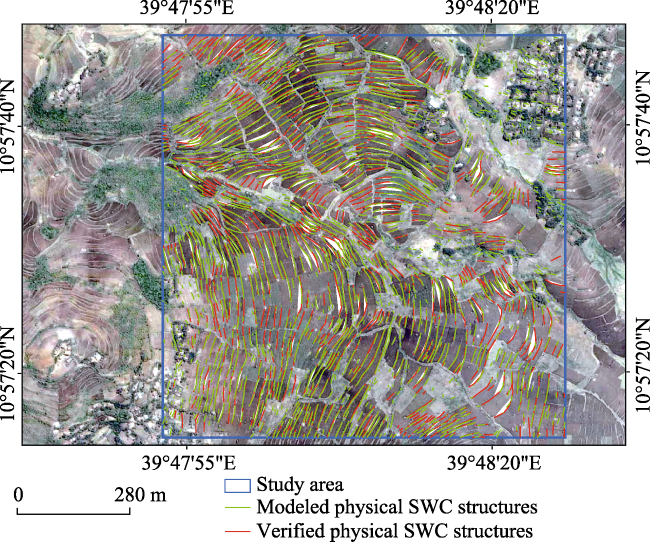
Figure 12 Maps showing verified (red lines) and automatically mapped (green lines) physical SWC structures
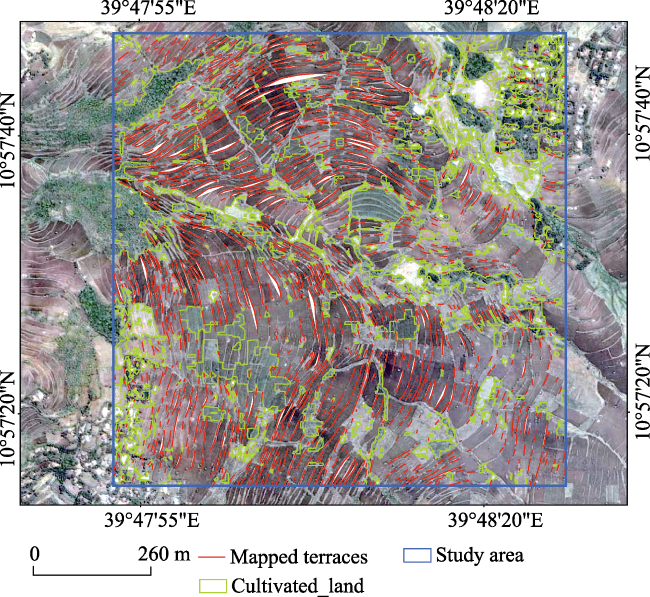
Figure 13 Map showing mapped the physical SWC structures after masking non-cultivated land. The green colour indicates areas classified as non-cultivated land

4.1 Strengths of the model

(1) Automated. Remote sensing provides very high spatial resolution imagery for many applications. From such image, nearly all natural and man-made objects with dimensions at least equal to the pixel size can be derived. This process can be done automatically and/or manually. Digital mapping of physical SWC structures is required to assess and update their spatial distribution and sustainability. Although the physical SWC structures can be manually identified and mapped on high-spatial resolution imagery with ease, manual extraction is time-consuming and costly. Available satellite imagery and image analysis software
provide opportunities to overcome these temporal and cost barriers. However, automated extraction of the physical SWC structures from satellite images is still a difficult task. Therefore, the researcher developed an automated model capable of mapping these structures with improved speed and accuracy, irrespective of the size of the area.
(2) Applicability. The physical SWC structure mapping model has been used with high spatial resolution images obtained from different sensors including IKONOS, WorldView, QuickBird, GeoEye, and SPOT, and taken in dry season. The model has also been applied in different areas of the Ethiopian Highlands with varied ground cover. With calibration, the model was able to properly map physical SWC structures from different images and areas.
(3) Data availability. The model works on images available on Google Earth. Google Earth imagery is relatively detailed and comprehensive, and acquisition is fast and flexible. Above all, it provides very high spatial-resolution images for different applications freely.

4.2 Conditions of the model

The developed physical SWC structure mapping model was very effective on cultivated land where very high spatial resolution satellite imagery was available. However, the effect- tiveness of the model depends on the following conditions:
(1) Date of imagery. The model was not effective in areas where the imagery was taken during crop growing season. It is found that on images taken prior to the harvest season, where the cultivated land was covered by mature crops (e.g. maize and sorghum), visualization of physical SWC structures in a raster image was almost impossible. Likewise, in areas where the cultivated land was covered by the straw of crops, separation of physical SWC structures from other linear features was difficult. Consequently, the model mapped many linear features with brightness values and geometric structures similar to those of the physical SWC structures. The season when the imagery was taken thus had a substantial impact on the quality of the interpretation. This problem can be solved by applying the model on imagery taken before crop growing season and after harvest season.
(2) Land cover. The model has the ability to map any linear features from all land use types. Therefore, processing the whole land use types affects the quality of the mapped physical SWC structures. Given this situation, although detailed land use/land cover classification over such a large area represented another difficult task, it was noted that application of the model after masking of the non-cultivated lands and non-grass lands will give accurate results (Figure 13).
(3) Presence of non-physical SWC structures on cultivated lands. Unwanted linear features such as field boundaries and drainage ditches exist in parallel with physical SWC structures. Therefore, in cases where the total length of field boundaries and ditches that are perpendicular to the contour line is longer than the total length of the physical SWC structures in a given hectare, the model would map the unwanted linear features rather than the terraces, which, at some level, affects accuracy. However, these unwanted linear features are completely or nearly perpendicular to the contour lines, whereas the physical SWC structures found along the contour lines. Therefore, this problem can be solved - and thus the accuracy of the model improved - if a very high spatial resolution DEM (better than 3 m) is available. With use of a DEM, contour lines can be generated and linear features that are completely or nearly perpendicular to them can be removed by determining their angle of deviation from the lines. In Ethiopia, where the model was developed, no high-resolution DEM was available at the time.

5 Conclusions

The developed model is automated, efficient, reliable, and fast, depending on the processor capacity of the computer, and assumes no prior knowledge of the physical SWC structures. In almost all of the images subjected to physical SWC structure mapping, the model performed well. The model proved to be essential for processing a large volume of raster images and thus for mapping of physical SCW structures on cultivated lands. Because the model performs well for mapping and predicting physical SWC structures, with calibration it could be applied to other areas with available high-spatial resolution images.

The authors have declared that no competing interests exist.

[1]
Allen D Y, 2009. A mirror of our world: Google Earth and the history of cartography. Available at: ; accessed: 23 January 2013

[2]
Aksoy S, Yalniz I Z, Tasdemir K, 2012. Automatic detection and segmentation of orchards using very high-resolution imagery.Geoscience and Remote Sensing, IEEE Transactions, 50(8): 3117-3131. doi: 10.1109/TGRS.2011.2180912.Spectral information alone is often not sufficient to distinguish certain terrain classes such as permanent crops like orchards, vineyards, and olive groves from other types of vegetation. However, instances of these classes possess distinctive spatial structures that can be observable in detail in very high spatial resolution images. This paper proposes a novel unsupervised algorithm for the detection and segmentation of orchards. The detection step uses a texture model that is based on the idea that textures are made up of primitives (trees) appearing in a near-regular repetitive arrangement (planting patterns). The algorithm starts with the enhancement of potential tree locations by using multi-granularity isotropic filters. Then, the regularity of the planting patterns is quantified using projection profiles of the filter responses at multiple orientations. The result is a regularity score at each pixel for each granularity and orientation. Finally, the segmentation step iteratively merges neighboring pixels and regions belonging to similar planting patterns according to the similarities of their regularity scores and obtains the boundaries of individual orchards along with estimates of their granularities and orientations. Extensive experiments using Ikonos and QuickBird imagery as well as images taken from Google Earth show that the proposed algorithm provides good localization of the target objects even when no sharp boundaries exist in the image data.

DOI

[3]
Bailly J S, Lagacherie P, Millier C,et al., 2008. Agrarian landscapes linear features detection from LiDAR: Application to artificial drainage networks.International Journal of Remote Sensing, 29(12): 3489-3508. doi: 10.1080/01431160701469057.Linear features of agrarian landscapes are the anthropogenic elements such as hedgerows, ditches, and bench terraces that strongly impact agrarian areas' environmental behaviour, especially the ecological and hydrological areas. The need to map these linear elements for environmental impact assessments of agrarian areas is thus increasing since these maps limit the developments of spatial indicators and spatially distributed modelling. Until now, no generic remote sensing methodology has been proposed for such mapping purposes. This research was designed to assess the use of airborne LiDAR data for agrarian landscape linear features mapping. We proposed a methodology that uses LiDAR data in three steps. We first estimated elevation profiles from LiDAR points on a set of pre鈥恖ocated sites. We secondly performed profile shape description with wavelet transform or a watershed algorithm. Finally, we classified the profiles using classification trees with predictors coming from shape analysis. Methodology accuracies were calculated for a ditch network detection problem in a Mediterranean vineyard landscape. LiDAR Toposys data and field survey data for ditch location were collected in June 2002. As ditches are always located on field boundary lattices, elevation profiles were only computed on field boundary sites. Methodologies, using wavelets or the watershed algorithm, gave similar accuracies. Overall accuracy is about 70% with a high ditch omission rate (50%) but low commission rate (15%). The omissions conform to those obtained when performing visual classification of profiles. This high omission rate in ditch detection is therefore due to LiDAR data, not methods. Dense vegetation over ditches during the summertime and the specific LiDAR points spatial sampling design explain these omissions. However, the proposed methodology, especially using wavelets transform, looks transposable for the automatic detection or characterization of other agrarian linear features.

DOI

[4]
Baumgartner A, Steger C, Mayer H,et al., 1999. Automatic road extraction based on multi-scale, grouping, and context.Photogrammetric Engineering & Remote Sensing, 65(7): 777-785.An approach for the automatic extraction of roads from digital aerial imagery is proposed. It makes use of several versions of the same aerial image with different resolutions. Roads are modeled as a network of intersections and links between these intersections, and are found by a grouping process. The context of roads is hierarchically structured into a global and a local level. The automatic segmentation of the aerial image into different global contexts, i.e., rural, forest, and urban area, is used to focus the extraction to the most promising regions. For the actual extraction of the roads, edges are extracted in the original high resolution image (0.2 to 0.5 m) and lines are extracted in an image of reduced resolution. Using both resolution levels and explicit knowledge about roads, hypotheses for road segments are generated. They are grouped iteratively into larger segments. In addition to the grouping algorithms, knowledge about the local context, e.g., shadows cast by a tree onto a road segment, is used to bridge gaps. To construct the road network, finally intersections are extracted. Examples and results of an evaluation based on manually plotted reference data are given, indicating the potential of the approach.

[5]
Bhakar R, Srivastav S K, Punia M, 2010. Assessment of the relative accuracy of ASTER and SRTM Digital Elevation Models along irrigation channel banks of Indira Gandhi Canal project area, Rajasthan.Journal of Water & Land-use Management, 10(1/2): 1-11.I. Comparing satellite based ASTER and SRTM DEM derived elevation data (Z coordinates) with L-section based elevation data.II. Comparing satellite based ASTER and SRTM DEM derived elevation data (Z coordinates) with DGPS data.

[6]
Bhirud S G, Mangala T R, 2011. A new automatic road extraction technique using gradient operation and skeletal ray formation.International Journal of Computer Applications (0975-8887), 29(1): 17-25.ABSTRACT The usage of satellite images and extracting road from the imagery becomes very significant in the services related to road transportation such as maintenance, creation and so on. The literature has numerous works for road extraction but very less contribution is found in dealing with rural areas. In the previous work, ANN-based road extraction technique has been proposed. However to improve the performance of the technique, herewith a new road extraction technique is proposed. The proposed technique extracts the road mainly with the contribution of gradient operation and skeletal ray formation over the subjected satellite imagery. As minor operations, filtering and threshold-based processing is performed. At the end, a coloring is performed followed by a morphological operation to extract the final road from the subjected rural areas. The proposed technique is tested with different satellite images and the results are compared against the previous technique. The comparative analysis show that the proposed technique outperforms rather than the previous technique in terms of standard performance measures such as completeness, correctness and quality.

DOI

[7]
Chang C, Ren H, Chang C C,et al., 2004. Estimation of subpixel target size for remotely sensed imagery.IEEE Transactions on Geoscience and Remote Sensing, 42(6): 1309-1320. doi: 10.1109/TGRS.2004.826556.One of the challenges in remote sensing image processing is subpixel detection where the target size is smaller than the ground sampling distance, therefore, embedded in a single pixel. Under such a circumstance, these targets can be only detected spectrally at the subpixel level, not spatially as ordinarily conducted by classical image processing techniques. This paper investigates a more challenging issue than subpixel detection, which is the estimation of target size at the subpixel level. More specifically, when a subpixel target is detected, we would like to know "what is the size of this particular target within the pixel?". The proposed approach is to estimate the abundance fraction of a subpixel target present in a pixel, then find what portion it contributes to the pixel that can be used to determine the size of the subpixel target by multiplying the ground sampling distance. In order to make our idea work, the subpixel target abundance fraction must be accurately estimated to truly reflect the portion of a subpixel target occupied within a pixel. So, a fully constrained linear unmixing method is required to reliably estimate the abundance fractions of a subpixel target for its size estimation. In this paper, a recently developed fully constrained least squares linear unmixing is used for this purpose. Experiments are conducted to demonstrate the utility of the proposed method in comparison with an unconstrained linear unmixing method, unconstrained least squares method, two partially constrained least square linear unmixing methods, sum-to-one constrained least squares, and nonnegativity constrained least squares.

DOI

[8]
Fitton N C, Cox S J, 1998. Optimising the application of the Hough transform for automatic feature extraction from geoscientific images. Computers & Geosciences, 24(10): 933-951. PII: S0098-3004(98)00070-3.We have adapted the Hough transform to extract linear features successfully from geoscientific datasets. The Hough transform is used in an automatic technique, which makes use of a parameter space to describe features of interest in images. This method has been widely applied in machine vision for recognition of features in highly structured images. Geoscientific data is more demanding. Features of interest within scenes of natural environments exist on all scales, are often partially obscured and the images are usually noisy. Pre-processing of images before the HT is essential. Adaptations of the HT to cope with particular properties of geoscientific data include: optimising the dimensions of the discrete transform domain; using feature-modelling to cancel lines found; transforming multi-scale tiles of the original image and correcting amplitudes in the transformed domain to account for the position of features. These specific adaptations produce a method for automatic feature detection which requires the user to select only two parameters. Output of the procedure is rich in feature content and accurate, leaving a clean result for statistical analysis. This optimised HT is robust for natural scenes, coping in particular with short line-segments.

DOI

[9]
Frigato R, Silva E, 2008. Mathematical Morphology Application to Features Extraction in Digital Images. Pecora 17 - The Future of Land Imaging Going Operational November 18-20, 2008, Denver, Colorado.

[10]
Gao J, 2009. Digital Analysis of Remotely Sensed Imagery. USA: McGraw-Hill companies.Digital analysis of remotely sensed imagery Jay Gao McGraw Hill, c2009

DOI

[11]
Guo J, Liang L, Gong P, 2010. Removing shadows from Google Earth images.International Journal of Remote Sensing, 31(6): 1379-1389. doi: 10.1080/01431160903475316.Google Earth uses aerial and satellite images from various sources as its background. It is designed to enable every person who owns a computer to easily ‘fly’ to aerial views of any location on the planet. However, just as with ordinary aerial or satellite images, there inevitably exist shadows in Google Earth images, making some ground objects obscured, even unidentifiable. In this paper, we describe a model we have developed for image shadow removal that uses radiative transfer theory in combination with prior knowledge to compensate for the lost information over shadow areas. We arbitrarily selected six images with severe shadows from Beijing, Shanghai, Hong Kong, Tokyo, New York and San Francisco, respectively, for algorithm testing. Our experimental results show that shadows in images can be considerably suppressed.

DOI

[12]
Hellwich O, Laptev I, Mayer H, 2002. Extraction of linear objects from interferometric SAR data.International Journal of Remote Sensing, 23(3): 461-475. doi: 10.1080/01431160110046750.A new method for the automated extraction of pipelines and other linear objects from Synthetic Aperture Radar (SAR) scenes is presented. It combines intensity data with coherence data from an interferometric evaluation of a SAR scene pair. The fusion is based on Bayesian statistics and is part of a Markov random field (MRF) model for line extraction. Both intensity and coherence data are evaluated using rotating templates. The different statistical properties of intensity and coherence are taken into account by a multiplicative noise model and an additive noise model respectively. The MRF model introduces prior knowledge about the continuity and the narrowness of lines. Posterior odds resulting from the MRF method are input to a method based on ziplock snakes for linear object extraction. This processing step is controlled interactively which is necessary as fully automatic processing of the given noisy data does not provide sufficiently predictable results. The method is applied to data of the ERS tandem mission.

DOI

[13]
Huang Z, Jia X, Ge L, 2010. Sampling approaches for one-pass land-use/land-cover change mapping.International Journal of Remote Sensing, 31(6): 1543-1554. doi: 10.1080/01431160903475399.

[14]
Jin H, Feng Y, 2010. Towards an automatic road lane marks extraction based on ISODATA segmentation and shadow detection from large-scale aerial images. Available: ; accessed 21 October 2013.

[15]
Kim S H, Hong C H, 2012. Antarctic land-cover classification using IKONOS and Hyperion data at Terra Nova Bay. International Journal of Remote Sensing, 33(22): 7151-7164. .

[16]
Li H, Gu H, Han Y,et al., 2010. Object-oriented classification of high resolution remote sensing imagery based on an improved colour structure code and a support vector machine.International Journal of Remote Sensing, 31(6): 1453-1470. doi: 10.1080/01431160903475266.This paper presents a new object-oriented land cover classification method that integrates raster analysis and vector analysis. The method adopts an improved colour structure code (CSC) for segmentation and support vector machine (SVM) for classification using high resolution (HR) QuickBird data. It combines the advantages of digital image processing (efficient improved CSC segmentation), geographical information systems (GIS) (vector-based feature selection), and data mining (intelligent SVM classification) to interpret images from pixels to objects and thematic information. The improved CSC segmentation not only achieves robust and accurate results but also combines boundary information that the traditional CSC algorithm does not consider. The SVM used for classification has the advantages of solving sparse sampling, nonlinear, high-dimensional and global optimum problems, compared with other classifiers. The results demonstrate that the new object-oriented classification method significantly outperforms some other objected-oriented classification methods such as the objected-oriented method based on traditional CSC and SVM, and perfect classification results are obtained from the classification processing, including not only the classification method, but also preprocessing, sample selection and post-processing.

DOI

[17]
Liniger H, Schwilch G, Gurtner M et al., 2007. WOCAT: A Framework for Documentation and Evaluation of Sustainable Land Management. Centre for Development and Environment, Bern, Switzerland. URL: .

[18]
Pirasteh S, Pradhan B, Safari H O,et al., 2011. Coupling of DEM and remote-sensing-based approaches for semi-automated detection of regional geostructural features in Zagros mountain, Iran.Arab J Geosci. doi: 10.1007/s12517-011-0361-0.In recent years, remote-sensing data have increasingly been used for the interpretation of objects and mapping in various applications of engineering geology. Digital elevation model (DEM) is very useful for detection, delineation, and interpretation of geological and structural features. The use of image elements for interpretation is a common method to extract structural features. In this paper, linear features were extracted from the Landsat ETM satellite image and then DEM was used to enhance those objects using digital-image-processing filtering techniques. The extraction procedures of the linear objects are performed in a semi-automated way. Photographic elements and geotechnical elements are used as main keys to extract the information from the satellite image data. This paper emphasizes on the application of DEM and usage of various filtering techniques with different convolution kernel size applied on the DEM. Additionally, this paper discusses about the usefulness of DEM and satellite digital data for extraction of structural features in SW of Zagros mountain, Iran.

DOI

[19]
Quackenbush L J, 2004. A review of techniques for extracting linear features from imagery.Photogrammetric Engineering & Remote Sensing, 70(12): 1383-1392.The automated extraction of linear features from remotely sensed imagery has been the subject of extensive research over several decades. Recent studies show promise for extraction of feature information for applications such as updating geographic information systems (GIS). Research has been stimulated by the increase in available imagery in recent years following the launch of several airborne and satellite sensors. However, while the expansion in the range and availability of image data provides new possibilities for deriving image related products, it also places new demands on image processing. Efficiently dealing with the vast amount of available data necessitates an increase in automation, while still taking advantage of the skills of a human operator. This paper provides an overview of the types of imagery being used for linear feature extraction. The paper also describes methods used for feature extraction and considers quantitative and qualitative accuracy assessment of these procedures.

DOI

[20]
Roushdy M, 2006. Comparative study of edge detection algorithms applying on grayscale noisy image using morphological filter.GVIP Journal, 6(4): 17-23ABSTRACT In this paper, classified and comparative study of edge detection algorithms are presented. Experimental results prove that Boie-Cox, Shen-Castan and Canny operators are better than Laplacian of Gaussian (LOG), while LOG is better than Prewitt and Sobel in case of noisy image. Subjective and objective methods are used to evaluate the different edge operators. The morphological filter is more important as an initial process in the edge detection for noisy image and used opening-closing operation as preprocessing to filter noise. Also, smooth the image by first closing and then dilation to enhance the image before the edge operators affect.

[21]
Rowe N C, Grewe L L, 2001. Change detection for linear features in aerial photographs using edge-finding.IEEE Transactions on Geoscience and Remote Sensing, 39(7): 1608-1612.We describe a system for automatic change detection of linear features such as roads and buildings in aerial photographs. Rather thancompare pixels, we match major line segments and note those without counterparts. Experiments show our methods to be promisingfor images of around 2-meter resolution.

DOI

[22]
Schwilch G, Liniger H P, Van Lynden G W J, 2004. Towards a Global Map of Soil and Water Conservation Achievements: A WOCAT Initiative. ISCO 2004-13th International Soil Conservation Organisation Conference. Brisbane, Australia.

[23]
Shahin F, 1997. Modeling positional uncertainty of linear features in Geographic Information Systems.An-Najah Univ. J. Res, 11: 23-38.ABSTRACT This paper describes a probabilistic approach to model positional uncertainty of linear features in a vector-based geographic information system (GIS). Positional uncertainty is one of the components of uncertainty inherent in any object description in GIS. With a number of assumptions, the positional error of an arbitrary point on a line segment is derived based on the distribution of errors at the end points of the segment. This defines the probability density and the confidence region of a line segment and a set of indicators for the error of a line segment. The union of the confidence regions of the line segments establishes the confidence region of a linear feature. The derived uncertainty model is computationally feasible and has a great promise for efficient implementation in several GIS applications.

[24]
Singh P, Singh H, 2012. A comparison analysis of high pass spatial filters using measurement and automation.International Journal of Engineering Research & Technology (IJERT), 1(3): 1-5.Whole-genome and exome sequencing have already proven to be essential and powerful methods to identify genes responsible for simple Mendelian inherited disorders. These methods can be applied to complex disorders as well, and have been adopted as one of the current mainstream approaches in population genetics. These achievements have been made possible by next generation sequencing (NGS) technologies, which require substantial bioinformatics resources to analyze the dense and complex sequence data. The huge analytical burden of data from genome sequencing might be seen as a bottleneck slowing the publication of NGS papers at this time, especially in psychiatric genetics. We review the existing methods for processing NGS data, to place into context the rationale for the design of a computational resource. We describe our method, the Graphical Pipeline for Computational Genomics (GPCG), to perform the computational steps required to analyze NGS data. The GPCG implements flexible workflows for basic sequence alignment, sequence data quality control, single nucleotide polymorphism analysis, copy number variant identification, annotation, and visualization of results. These workflows cover all the analytical steps required for NGS data, from processing the raw reads to variant calling and annotation. The current version of the pipeline is freely available at http://pipeline.loni.ucla.edu. These applications of NGS analysis may gain clinical utility in the near future (e.g., identifying miRNA signatures in diseases) when the bioinformatics approach is made feasible. Taken together, the annotation tools and strategies that have been developed to retrieve information and test hypotheses about the functional role of variants present in the human genome will help to pinpoint the genetic risk factors for psychiatric disorders.

DOI

[25]
Tamilarasi M A, Duraiswamy K B, 2010. Novel mining algorithm for multiple level classification of brain tumors. In: Vadim V, Sumbayev Pica A, Luh S P et al. (eds.). Proceeding of the World Medical Conference. Malta, 21-26.

[26]
Tamililakkiya V, Vani K, Lavanya A,et al., 2011. Linear and non-linear feature extraction algorithms for lunar images.Signal & Image Processing: An International Journal (SIPIJ), 2(4): 161-172. doi: 10.5121/sipij. 2011.2414 161.Craters, ridges and rocks are the features to be extracted in the lunar images. Proposed methodology dealswith detection of linear feature such as (i) ridges, (ii) lineaments and (iii) nonlinear features like craters.All edges are identified as either crater or lineament. Therefore, all circular edges are recognized ascraters edges, and those remained edges, which are not crater edges and low possibility of the noise, arerecognized as lineaments in the remained edges. The Steps for lineament recognition includes the stepssuch as Crater Rim Elimination, Small Area Elimination and Lineament Classification. Ridges detectionincludes edge extraction using haar wavelet transform followed by morphological operations such asdilation and erosion.For detection of non linear features such as craters, the most predominant feature on the lunar terrain,circular hough transform is used. But it fails to detect craters without proper connected edges because ofpresence of shadows in an image. This paper includes algorithms for shadow removal in the images whichaccounts for changes in illumination, visual appearance, and size. Results indicate that the detection rateis improved with shadow removal techniques.

DOI

[27]
Van Lynden G, Verzandvoort S, Schwilch G,et al., 2012. Mapping the impacts of SLM: The WOCAT-DESIRE experience. Wageningen, the Netherlands.ABSTRACT Since 1992, the World Overview of Conservation Approaches and Technologies (WOCAT) initiative has developed a standardized method for documentation of Sustainable Land Management (SLM) practices. The resulting on-line database currently counts over 450 technologies and over 350 approaches (implementation strategies) from around 50 countries. WOCAT also developed a tool to map land degradation and conservation. This method complements the information provided by the individual case studies on technologies and approaches. It evaluates what land degradation is occurring where and what is done about. The challenge is now to implement SLM practices that address environmental, economic and social concerns, i.e. decreasing degradation and improving ecosystems, while enhancing agricultural productivity and the livelihoods of land users. Research to show and quantify these impacts of SLM practices and on implementation strategies is undertaken in projects like DESIRE, in which the WOCAT methods and tools were used and further developed, from which results are presented herewith. These showed that land degradation mainly occurred as water erosion on cultivated and mixed land use. Degradation was increasing in most sites, primarily caused by inappropriate soil management. Indirectly, population pressure, insecure land tenure, and poverty appeared to be major causes of degradation. Land degradation negatively affected ecosystem services for almost all degraded areas. High negative impacts were observed regarding regulation of ecosystem services indicating that these require particular attention when developing and implementing remediation strategies. SLM measures appeared most effective on cultivated land, but positive impacts were also recorded for relatively large areas of forest and grazing land. Combinations of SLM measures appeared to perform better than single measures. Overall, there appears to be scope for improving SLM contributions to ecosystem services in cultivated land.

[28]
Yang J, Wang R S, 2007. Classified road detection from satellite images based on perceptual organization.International Journal of Remote Sensing, 28(20): 4653-4669. doi: 10.1080/01431160701250382.Extracting roads from satellite images is an important task in both research and practice. This work presents an improved model for road detection based on the principles of perceptual organization and classification fusion in human vision system (HVS). The model consists of four levels: pixels, primitives, structures and objects, and two additional sub‐processes: automatic classification of road scenes and global integration of multiform roads. Based on the model, a novel algorithm for detecting roads from satellite images is also proposed, in which two types of road primitives, namely blob‐like primitive and line‐like primitive are defined, measured, extracted and linked using different methods for dissimilar road scenes. A hierarchical search strategy driven by saliency measurement is adopted in both linking processes. The blob primitives are linked using heuristic grouping and the line primitives are connected through genetic algorithm (GA) evolution. Finally, all of the linked road segments are normalized with centre‐main lines and integrated into global smooth road curves through tensor voting. Experimental results show that the algorithm is capable of detecting multiform roads from real satellite images with high adaptability and reliability.

DOI

[29]
Yang Y, Zhu C, 2010. Extracting road centrelines from high-resolution satellite images using active window line segment matching and improved SSDA.International Journal of Remote Sensing, 31(9): 2457-2469. doi: 10.1080/01431160903019288.This paper presents a new semi-automatic approach to extracting main road centrelines from high-resolution satellite images. The approach is based on active window line segment matching and an improved sequential similarity detection algorithm (SSDA). First, a user-specified point on the road centreline is selected as a reference central point to define a template window, and a thresholding operation is performed within the window. Then a best matched target window along the road is searched to determine the next central point in the road. To avoid the influence of noise, only the line segment of 090004interest090005 in the window is matched. An improved SSDA searching strategy is proposed to increase the matching speed. When the best matched target window is found, its centre is used as the next central point in the road, and a new template window is generated. By repeating the matching process, a series of central points can be obtained automatically and the corresponding final road centreline from them is extracted. Our approach also allows some kinds of user interventions in case automatic tracking fails. Experimental results confirm that the proposed approach is capable of rapidly and accurately extracting main road centrelines and has good robustness against noise.

DOI

[30]
Yun L, Uchimura K, 2007. Using self-organizing map for road network extraction from IKONOS Imagery.International Journal of Innovative Computing, Information and Control, 3(3): 641-656.ABSTRACT Automated road information extraction enables the ready creation, mainte- nance, and update of the transportation network databases used for traffic management and automated vehicle navigation. This paper presents a semi-automatic method for road network extraction from high-resolution satellite images. First, we focus on detecting the seed points in candidate road regions using a Kohonen-type self-organizing map (SOM). Then, an approach to road tracking is presented, searching for connected points in the direction and candidate domain of a road. A study of Geographical Information Systems (GIS) with high-resolution satellite images is presented in this paper. Experimental re- sults verified the effectiveness and efficiency of this approach.

DOI

Outlines

/