Orginal Article

Spatial pattern of grassland aboveground biomass and its environmental controls in the Eurasian steppe

  • JIAO Cuicui , 1, 2 ,
  • YU Guirui , 1 ,
  • HE Nianpeng 1 ,
  • MA Anna 1 ,
  • GE Jianping 3 ,
  • HU Zhongmin 1
Expand

Author: Jiao Cuicui (1987-), PhD, specialized in carbon cycle in grassland ecosystems. E-mail:

*Corresponding author: Yu Guirui, Professor, specialized in carbon, water and nitrogen cycle in terrestrial ecosystems and global change. E-mail:

Received date: 2016-04-06

  Accepted date: 2016-05-05

  Online published: 2017-02-10

Supported by

The Chinese Academy of Sciences Strategic Priority Research Program, No.XDA05050602

The Key Program of National Natural Science Foundation of China, No.31290221

Copyright

Journal of Geographical Sciences, All Rights Reserved

Abstract

Vegetation biomass is an important component of terrestrial ecosystem carbon stocks. Grasslands are one of the most widespread biomes worldwide, playing an important role in global carbon cycling. Therefore, studying spatial patterns of biomass and their correlations to environment in grasslands is fundamental to quantifying terrestrial carbon budgets. The Eurasian steppe, an important part of global grasslands, is the largest and relatively well preserved grassland in the world. In this study, we analyzed the spatial pattern of aboveground biomass (AGB), and correlations of AGB to its environment in the Eurasian steppe by meta-analysis. AGB data used in this study were derived from the harvesting method and were obtained from three data sources (literature, global NPP database at the Oak Ridge National Laboratory Distributed Active Archive Center (ORNL), some data provided by other researchers). Our results demonstrated that: (1) as for the Eurasian steppe overall, the spatial variation in AGB exhibited significant horizontal and vertical zonality. In detail, AGB showed an inverted parabola curve with the latitude and with the elevation, while a parabola curve with the longitude. In addition, the spatial pattern of AGB had marked horizontal zonality in the Black Sea-Kazakhstan steppe subregion and the Mongolian Plateau steppe subregion, while horizontal and vertical zonality in the Tibetan Plateau alpine steppe subregion. (2) Of the examined environmental variables, the spatial variation of AGB was related to mean annual precipitation (MAP), mean annual temperature (MAT), mean annual solar radiation (MAR), soil Gravel content, soil pH and soil organic content (SOC) at the depth of 0-30 cm. Nevertheless, MAP dominated spatial patterns of AGB in the Eurasian steppe and its three subregions. (3) A Gaussian function was found between AGB and MAP in the Eurasian steppe overall, which was primarily determined by unique patterns of grasslands and environment in the Tibetan Plateau. AGB was significantly positively related to MAP in the Black Sea-Kazakhstan steppe subregion (elevation < 3000 m), the Mongolian Plateau steppe subregion (elevation < 3000 m) and the surface (elevation ≥ 4800 m) of the Tibetan Plateau. Nevertheless, the spatial variation in AGB exhibited a Gaussian function curve with the increasing MAP in the east and southeast margins (elevation < 4800 m) of the Tibetan Plateau. This study provided more knowledge of spatial patterns of AGB and their environmental controls in grasslands than previous studies only conducted in local regions like the Inner Mongolian temperate grassland, the Tibetan Plateau alpine grassland, etc.

Cite this article

JIAO Cuicui , YU Guirui , HE Nianpeng , MA Anna , GE Jianping , HU Zhongmin . Spatial pattern of grassland aboveground biomass and its environmental controls in the Eurasian steppe[J]. Journal of Geographical Sciences, 2017 , 27(1) : 3 -22 . DOI: 10.1007/s11442-017-1361-0

1 Introduction

Since the Industrial Revolution, CO2 concentration in atmosphere continues to rise due to intensive human activities. The globe becomes warmer and warmer (Solomon et al., 2007). Therefore, research on global carbon cycle and carbon budget has become one of the key issues in environmental and ecological science (Chapin et al., 2006, 2009; Yu et al., 2011). Vegetation biomass is an important component of terrestrial ecosystem carbon stocks (Schlesinger, 1977). It is one of the significant contents of global carbon cycle study (Myneni et al., 1997; Schimel et al., 1997; Cao et al., 1998; Turner et al., 2005). Grasslands are one of the most widespread biomes worldwide, accounting for ca.20% of the world’s land surface and 10% of global terrestrial carbon stocks (Eswaran et al., 1993). Previous studies have proposed that grassland biomes constitute an annual sink of about 0.5 petagram carbon (Pg C), playing an important role in global carbon cycle and climate regulation (Hall and Scurlock, 1991; Scurlock and Hall, 1998; Scurlock et al., 2002). Thus, exploring spatial patterns of grassland biomass and their environmental controls is essential to understanding global carbon cycle and managing grassland resources.
Globally, temperate grassland biomes are on every continent, known variously as the prairie in North America, the pampas in South America, the veld in South Africa and the steppe in Eurasia. The steppe in Eurasia (the Eurasian steppe hereafter), located in northern mid latitudes, forms the largest continuous grassland biome and is preserved relatively well. It is one pretty important component of global grassland ecosystems (Woodward, 2008). The Eurasian steppe with vast area extends linearly about 8000 km from the grassy plains at the mouth of the Danube River in the west, across Romania, Russia, Mongolia to the Songliao Plain in China in the east, and to the Himalayas in China in the southwest (Archibold, 2012). The Eurasian steppe possesses complex geomorphic types, like Black Sea Littoral Plain, Caspian Depression, Kazakhskiy Melkosopochnik, Xinjiang Mountains, Mongolian Plateau and the world’s highest place, Tibetan Plateau. Phytogeographically, it can be divided into three subregions: the Black Sea-Kazakhstan steppe subregion, the Mongolian Plateau steppe subregion and the Tibetan Plateau steppe subregion (Лавренко, 1959; Wu, 1979; Li, 1979; Zhou, 1980; Hou, 2014; Han et al., 2015). It is hot in summer and cold in winter. Mean annual precipitation (MAP) varies from 250 mm to 750 mm and mean annual temperature (MAT) from -10℃ to 10℃. There is one dry season very year. The eastern, western and central parts of the Eurasian steppe are under different climatic conditions. The west is strongly influenced by the Mediterranean climate with drought in summer while the eastern part by the East Asian monsoon climate with a dry spring. The central part lies in the typical semi-arid and arid climatic zones due to far from the ocean and being affected by subtropical high pressure all year around (Figure 1). The Eurasian steppe has unique geographical environment, such as vast area, complex topography, and diverse climate regimes and so on. Therefore, we would acquire more comprehensive knowledge of correlations of grassland biomass to its environment by selecting the Eurasian steppe as the study area.
Spatial distributions of aboveground biomass (AGB) in grasslands generally obey two rules. One is the horizontal zonality along a latitudinal or longitudinal gradient. The other is the vertical zonality along an altitudinal gradient. Previous research reported spatial variations of AGB in some geomorphological cells located within the Eurasian steppe region like the Inner Mongolian Plateau (Ma et al., 2008), and the Tibetan Plateau (Yang et al., 2009; Wang et al., 2013; Zhang et al., 2014). Nevertheless, conclusions from those studies demonstrated that spatial patterns of AGB showed greater difference because of regional differences. For example, the spatial variation of AGB exhibited a significant horizontal zonality with an increasing trend from southwestern to northeastern Inner Mongolian temperate grassland (Ma et al., 2008), also an obvious horizontal zonality with an increase from the northwest to the southeast of the alpine grasslands on the surface of the Tibetan Plateau (Yang et al., 2009; Zhang et al., 2014), while a remarkable vertical zonality with an unimodal pattern along increasing elevation on a south-facing slope of the Nyaiqentanglha Mountains (Wang et al., 2013).
Spatial variations of AGB in grasslands are primarily sensitive to a number of environmental factors like MAP, MAT and soil characteristics etc. Generally, AGB was positively related to MAP in grasslands (Bai et al., 2008; Fang et al., 2010; Yang et al., 2010; Gao et al., 2013). However, the shape of the relationship varied among different studies. Usually, simple linear relationships were found between AGB and MAP, like in the temperate grassland in the Inner Mongolia (Bai et al., 2008), the alpine grasslands in the Tibetan Plateau (Yang et al., 2009, 2010; Jiang et al., 2015), and the grasslands in Xinjiang, China (Anwar et al., 2006). However, exponentially relationships had also been reported for the Inner Mongolian temperate grassland in some other studies (Hu et al., 2007, 2010; Ma et al., 2008; Guo et al., 2012).
Relationships between spatial variations of AGB in grasslands and MAT were more complicated. They usually varied with the spatial scale of the study area, data source and data analysis approach used. For instance, Yang et al. (2009, 2010) suggested that AGB was not significantly related to MAT in the Tibetan Plateau grasslands. Nevertheless, Jiang et al. (2015) demonstrated that AGB positively correlated with MAT significantly in alpine steppes while insignificantly in alpine meadows and alpine desert steppes of the Tibetan Plateau. Ma et al. (2008) and Gao et al. (2013) found that MAT had negative effects on AGB in the Inner Mongolian temperate grassland. Soil factors like texture, nutrition etc. usually had little impact on AGB. Generally, they influenced AGB variation through their interaction with precipitation (Noy-Meir, 1973; Sala et al., 1988; Epstein et al., 1997; Lan e et al., 1998; Yang et al., 2009).
In summary, the Eurasian steppe is an ideal region for discussing spatial patterns of AGB and their environmental controls, due to its vast area, complicated landform and various climate types. Currently, there are extensive research on spatial variations of AGB and their environmental controls in the Inner Mongolian temperate grassland and the Tibetan Plateau alpine grassland. However, little evidence is available for the Eurasian steppe region overall. So far we still cannot completely understand spatial distribution rules of AGB and their correlations to environment in the whole Eurasian steppe region.
In this study, we collected AGB data by the harvesting method in the Eurasian steppe. We then discussed spatial patterns of AGB, and correlations of AGB to their environmental controls by Meta-analysis. The main purpose of this research is (1) to explore spatial distribution rules of AGB; (2) to identify determining environmental factors of the spatial variation in AGB; (3) to quantify relationships between AGB and environmental controls.

2 Materials and methods

2.1 Data collection and screening

(1) AGB data
We initially collected AGB data of 1831 grasslands sites by the harvesting method in the Eurasian steppe over past three decades (1980-2014). These data were primarily obtained from three sources: (1) AGB data of 1015 grassland sites from 209 publications (see supplemental online material); (2) AGB data of 7 grassland sites from the global NPP database at the Oak Ridge National Laboratory Distributed Active Archive Center (Scurlock et al., 2015; http://www. daac.ornl.gov/ NPP/npp_home.html); (3) AGB data of 809 grassland sites provided by other researchers.
Before analysis, we carried out four steps to eliminate unsuitable data. (1) Excluding sites missing site-description metadata like latitude or longitude. We retrieved elevation information for sites without such data from the Shuttle Radar Topography Mission (SRTM) elevation database (GIAR-CSI, 2006; http://srtm.csi.cgiar.org/) based on the latitude and longitude of sites. (2) Excluding sites in ecotones of grasslands and other ecosystems, according to Landcover product (MCD12C1) from the Moderate Resolution Imaging Spectroradiometer (MODIS) platform (https://lpdaac.usgs.gov/dataset_discovery/modis/modisproducts_table/ mcd12c1) and the vegetation map from Editorial Committee of Vegetation Map of China, Chines Academy of Sciences (2007). (3) Excluding sites with AGB outliers (outside the range of mean±3standard deviation). (4) Because the aim of this study was to analyze the spatial variation in AGB, we calculated the mean of AGB data for sites with longer than 2 years of measurement.
Eventually, AGB data of 1421 sites were used for analysis. These grassland sites spanned from 28ºN to 53ºN in latitude, from 36ºE to 125ºE in longitude and from 20 m to 5600 m in elevation (Figure 1).
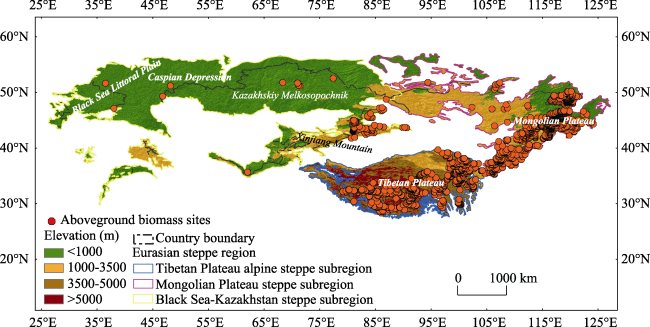
Figure 1 The spatial distribution of the Eurasian steppe and aboveground biomass field sites
(2) Climatic data
Climatic variables including MAR, MAP and MAT were also collected besides AGB data. Generally, long term means of climatic factors were reported in published literature. For sites missing precipitation and temperature information, we thus extracted their MAP and MAT data from the WorldClim database (Hijmans et al., 2005; http://www.worldclim.org/) based on the site location. The WorldClim database was a set of global climate layers generated through interpolation of climate data from weather station on a 30 arcsec grid (c.1Km2 resolution) during 1950-2000. Mean annual radiation (MAR) was less available for grassland sites, so we extracted MAR data from the Climate Research Unit (CRU05) Monthly Climate Database (New et al., 1999, 2000, 2011; http://daac.ornl.gov/ISLSCPII/guides /cru_monthly_mean_xdeg.html) provided by the International Satellite Land Surface Climatology Project (ISLSCP).
(3) Soil data
Soil variables included physical characteristics like volume percentage Gravel (Gravel), percentage sand (Sand), percentage silt (Silt) and percentage clay (Clay) and chemical properties like soil pH (pH) and soil organic content (SOC) at the depth of 0-30 cm. These soil data were obtained from the Harmonized World Soil Database (version 1.2) (Nachtergaele et al., 2012; http://webarchive.iiasa.ac.at/Research/LUC/ External-World-soil-database/HTML/ HWSD_Data.html?sb=4) produced by Food and Agriculture Organization of the United Nations (FAO) and the International Institute for Applied Systems Analysis (IIASA).

2.2 Data analysis

Linear and nonlinear regressions were used to analyze correlations of AGB to latitude, longitude, and elevation. Of preselected climatic (MAP, MAT and MAR) and soil (Gravel, Sand, Silt, Clay, pH and SOC) factors, environmental variables were eliminated by Pearson Correlation Analysis which were not related to spatial variations of AGB all in the Eurasian steppe and its three subregions. Furthermore, we used regression analyses to respectively discuss relationships between AGB and other environmental factors that were not eliminated. With one-way analysis of variance (ANOVA), the significance test on difference of AGB among the Eurasian steppe and its three subregions was conducted and the significance level was at alpha=0.05. Statistics for AGB in the Eurasian steppe and its three subregions were obtained by calculating the mean and standard deviation of AGB for every 5° of latitude, 15° of longitude, and 1000 m of elevation. The stepwise regression was used to identify determining environmental factors of the spatial variation in AGB. We further used regression equations to examine relationships between AGB and its determining environmental controls.
All data analysis was performed by SPSS 20.0 software and the software package R (version 3.1.3 R Development Core Team 2012). Correlation figures of AGB to climatic variables and soil factors were respectively drawn by Sigma Plot 12.5 software. The spatial distribution figure of grassland sites was plotted by ArcGIS 10.0 software.
It should be noted that the spatial distribution of grassland AGB sites was spatially biased. To reduce uncertainties in research results likely caused by the spatial bias, we therefore undertook additional analyses using averaged AGB values, latitudes, longitudes, elevations, climatic variables and soil factors for those sites located at certain geographical or environmental bands. Detailed data processing steps are as follows:
1) To analyze the spatial pattern of AGB, we respectively calculated the mean and standard deviation of AGB for every 1° of latitude, 1° of longitude and 100 m of elevation. We further analyzed relationships between AGB and latitude, longitude and elevation separately based on averaged values.
2) To analyze relationships between AGB and environmental variables, we firstly calculated the mean and standard deviation of AGB for every 100 MJ m-2a-1 of MAR, for every 1℃ of MAT, for every 25 mm of MAP, for every 1% vol. of Gravel and for every 0.1 of pH, for every 0.01 of SOC. We further discussed correlations of AGB to environmental factors based on mean values.
3) To analyze Pearson correlations of AGB and environmental variables, identify determining environmental factors of the spatial variation in AGB, and examine quantitative relationships between AGB and its determining environmental controls, we firstly created a grid with the grain size of 1.0°N×1.0°E by ArcGIS 10.0 software. Furthermore, we calculated the averaged AGB and environmental variables values for those sites located within a 1.0°N×1.0°E grid cell. Thus, a new dataset consisting of 199 data points were generated. Finally, we performed additional analyses using the new dataset.

3 Results

3.1 Zonal statistic characteristics and geographical patterns of AGB

In the Eurasian steppe overall, AGB exhibited large variations across all the sites, ranging from 4.99 to 209.00 g C m-2, with overall average of 56.93± 40.27 g C m-2. Statistic characteristics of AGB in three subregions showed that AGB was respectively 68.95± 45.98 g C m-2 in the Black Sea-Kazakhstan steppe subregion, 56.93 ± 40.27 g C m-2 in the Mongolian Plateau steppe subregion, and 54.33 ± 42.32 g C m-2 in the Tibetan Plateau alpine steppe subregion. AGB in the Black Sea-Kazakhstan steppe subregion was markedly larger than that in two other subregions (Figure 2).
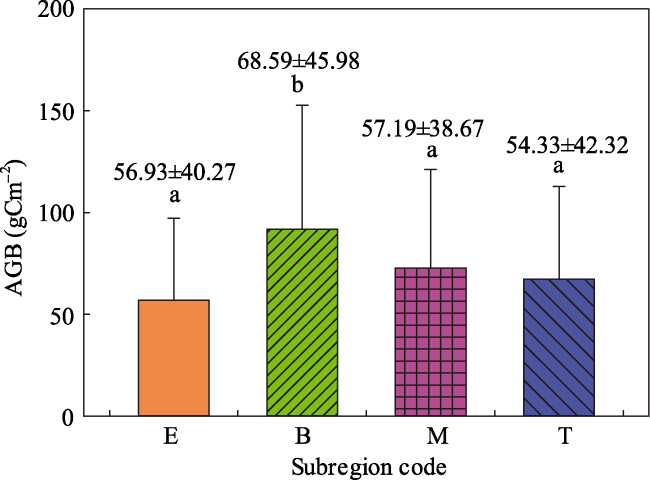
Figure 2 Statistical characteristics of AGB in the Eurasian steppe and its three subregions
E-the Eurasian steppe; B-the Black Sea-Kazakhstan steppe subregion; M-the Mongolian Plateau steppe subregion; T-the Tibetan Plateau alpine steppe subregion. The error bars show the SD (standard deviation) of AGB; Different letters (a, b) denote significant difference of AGB at p<0.05 (LSD test).
In the whole Eurasian steppe region, the spatial variation of AGB exhibited the complicated horizontal zonality and vertical zonality. With increasing latitude, AGB variation followed an inverted parabola curve. The maximal averaged AGB for every 5° of latitude was 71.01 ± 56.78 g C m-2 in the 35ºN-40ºN latitudinal band (Figure 3a). AGB changed in a parabola curve from the west to the east. The minimal averaged AGB for every 15° of longitude, 44.71 ± 35.33 g C m-2, was in the 80ºE-95ºE longitudinal band (Figure 3b). In addition, an inverted U-shaped quadratic function was found between AGB and elevation. The maxima of averaged AGB for every 1000 m which was 82.95 ± 52.33 g C m-2 appeared in the 3000-4000 m altitudinal band (Figure 3c).
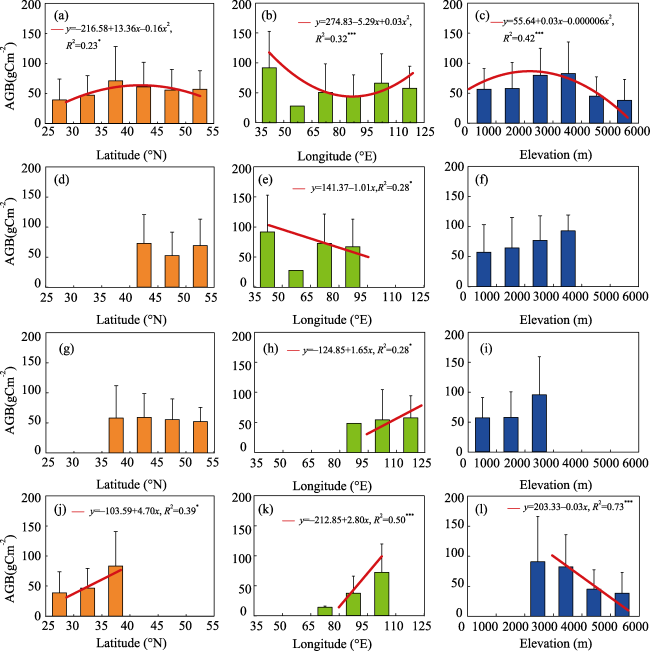
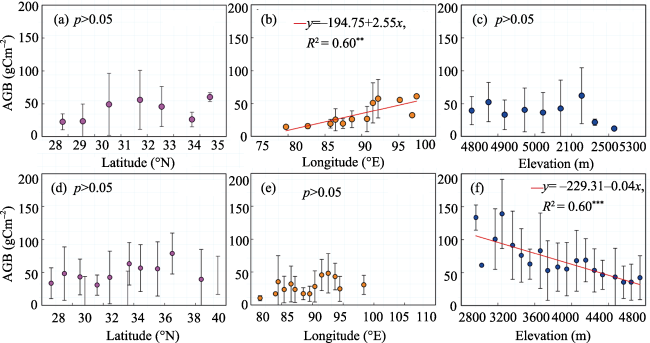
Figure 3 The correlations of AGB in the Eurasian steppe to latitude, longitude and elevation
(a-c): the Eurasian steppe; (d-f): the Black Sea-Kazakhstan steppe subregion; (g-i): the Mongolian Plateau steppe subregion; (j-l): the Tibetan Plateau steppe subregion^The error bars show the SD (standard deviation) of AGB, *indicates the regression equation was significant at the 0.05 level, and *** at the 0.001 level^(Note: only one biomass site located in the 50ºE-65ºE longitudinal band, so it was not included when we compared the size of AGB among different longitudinal bands (Figures 3b and 3e)
The spatial pattern of AGB in the whole Eurasian steppe was the superposition of AGB variations in three subregions. In the Black Sea-Kazakhstan steppe subregion, AGB gradually declined with the increase of the longitude. The maximal averaged AGB for every 15° of longitude was 91.86±60.80 g C m-2 in the 35ºE-50ºE longitudinal band (Figure 3e). Nevertheless, AGB in this subregion had no marked variation trend with the latitude (Figure 3d) and with the elevation (Figure 3f). In the Mongolian Plateau steppe subregion, AGB gradually increased with increase of the longitude. The maximum of mean AGB for every 15° of longitude, 57.19±38.67 g C m-2, was in the 110ºE-125ºE longitudinal band (Figure 3h). However, AGB in this area did not exhibit significantly latitudinal (Figure 3g) and altitudinal (Figure 3i) patterns.
In the Tibetan Plateau alpine steppe subregion, AGB increased with the increase of the latitude (Figure 3j) and the longitude (Figure 3k), showing a decreasing trend with the increasing elevation (Figure 3l). The mean AGB for every 1000 m of elevation was 90.67±75.41 g C m-2 in the 2000-3000 m altitudinal band, larger than that in the other altitudinal bands (Figure 3l). The spatial distribution rule of AGB in the Tibetan Plateau overall was the superposition of AGB variations on the surface (elevation ≥ 4800 m, Figures 4a and 4c) and the east and southeast margins (elevation < 4800 m, Figures 4a and 4b) of the Tibetan Plateau. On the surface of the Plateau (Figures 4a and 4c), the spatial variation of AGB was remarkably in positive correlation with longitude (Figure 5b). However, correlations of AGB to the latitude and to the elevation were not significant in this area (Figures 5a and 5c). In the east and southeast margins of the Plateau (Figures 4a and 4b), AGB significantly decreased with the increase of elevation (Figure 5f). Nevertheless, AGB had no marked latitudinal (Figure 5d) and longitudinal pattern (Figure 5e) in this zone.
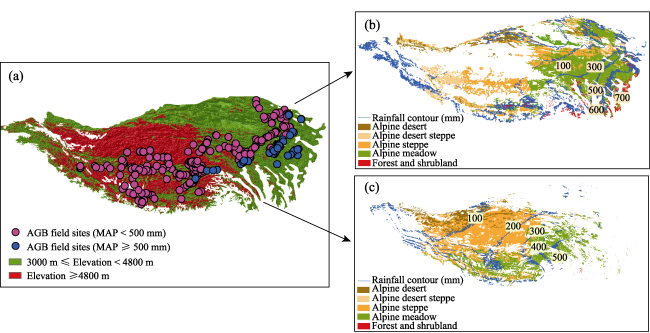
Figure 4 The spatial distribution of AGB field sites and vegetation type in the east and southeast margins (elevation < 4800 m) and on the surface (elevation > 4800 m) of the Tibetan Plateau
(a) The spatial distribution of aboveground biomass field sites in the Tibetan Plateau; (b) The spatial distribution of vegetation type in the east and southeast margins of the Tibetan Plateau; (c) The spatial distribution of vegetation type on the Tibetan Plateau surface (elevation > 4800 m)
Figure 5 The correlations of AGB to latitude, longitude, and elevation on the surface (elevation ≥ 4800 m) and the east and southeast margins (elevation < 4800 m) of the Tibetan Plateau
The error bars show the SD (standard deviation) of AGB, **indicates the regression equation was significant at the 0.01 level, *** at the 0.001 level, and p>0.05 indicates that AGB has no correlation to the latitude, longitude, or elevation.

3.2 Impact of environmental factors on spatial patterns of AGB

The effect of climate and soil on the spatial variation in AGB were firstly examined by Pearson Correlation Analysis (Table 1). The results showed that AGB was not significantly related to Sand, Silt and Clay all in the Eurasian steppe and its three subregions. Thus, we furthermore used linear, exponential and polynomial regressions to analyze correlations of AGB to climatic variables (MAR, MAT and MAP) and soil factors (Gravel, pH and SOC).
Table 1 Correlations between AGB and environmental factors in the Eurasian steppe
AGB MAP MAT MAR Gravel Sand Silt Clay SOC pH
(mm) (℃) ( MJ m-2a-1) (%vol.) (%wt.) (%wt.) (%wt.) (%wt.) (-log(H+))
Eurasian steppe region Pearson Correlation 0.45** 0.16* -0.26** -0.28** -0.09 0.07 0.08 -0.01 0.08
Sig. (2-tailed) 0.00 0.02 0.00 0.00 0.19 0.34 0.25 0.88 0.47
N 199 199 199 199 199 199 199 199 199
Black Sea-Kazakhs
tan steppe
subregion
Pearson Correlation 0.54** 0.07 -0.04 -0.34 -0.37 0.44 0.13 0.55** -0.06
Sig. (2-tailed) 0.00 0.72 0.85 0.07 0.05 0.06 0.51 0.00 0.59
N 28 28 28 28 28 28 28 28 28
Mongolian Plateau steppe subregion Pearson Correlation 0.60** -0.53** -0.28* -0.04 -0.18 0.27 -0.01 0.37 -0.17
Sig. (2-tailed) 0.00 0.00 0.01 0.74 0.11 0.06 0.96 0.08 0.13
N 85.00 85.00 85.00 85.00 85.00 85.00 85.00 85.00 85.00
Tibetan Plateau alpine steppe subregion Pearson Correlation 0.53** 0.17* -0.40** -0.28 0.17 -0.29 -0.05 -0.07 0.38**
Sig. (2-tailed) 0.00 0.02 0.00 0.89 0.11 0.09 0.65 0.50 0.00
N 85 85 85 85 85 85 85 85 85

Note: *: p<0.05, and **: p<0.01

Figure 6 illustrated that an inverted U-shaped quadratic function was found between AGB and MAR in the Eurasian steppe overall (Figure 6a) and in the Mongolian Plateau steppe subregion (Figure 6g). However, AGB was linearly in negative correlation with MAR in the Tibetan Plateau alpine steppe subregion (Figure 6j). No significant correlation between AGB and MAR was found in the Black Sea-Kazakhstan steppe subregion (Figure 6d). With the increase of MAT, AGB represented a significant increasing trend in the Eurasian steppe overall (Figure 6b) and in the Tibetan Plateau alpine steppe subregion (Figure 6k). The correlation of AGB to MAT could be well expressed by a U-shaped quadratic function in the Mongolian Plateau steppe subregion (Figure 6h). AGB was not remarkably related to MAT in the Black Sea-Kazakhstan steppe subregion (Figure 6e).
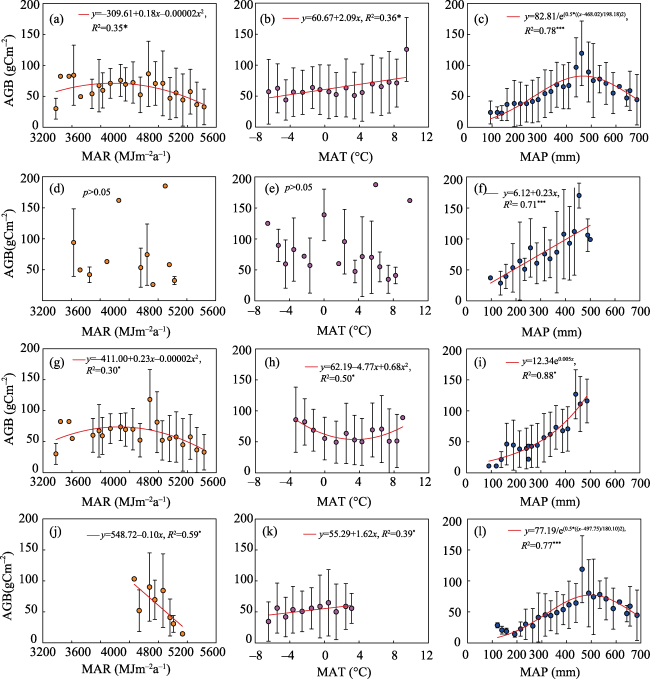
Figure 6 The relationships between AGB in the Eurasian steppe and climatic variables
(a-c): the Eurasian steppe; (d-f): the Black Sea-Kazakhstan steppe subregion; (g-i): the Mongolian Plateau steppe subregion; (j-l): the Tibetan Plateau steppe subregion^The error bars show the SD (standard deviation) of AGB;*indicates the regression equation was significant at the 0.05 level, *** at the 0.001 level, p>0.05 indicates that AGB has no correlation to the climatic variable
A Gaussian function was found between AGB and MAP in the Eurasian steppe overall (Figure 6c). With the increase of MAP, AGB significantly increased linearly in the Black Sea-Kazakhstan steppe subregion (Figure 6f), and increased exponentially in the Mongolian Plateau steppe subregion (Figure 6i). Nevertheless, AGB varied in a Gaussian function curve with increasing MAP in the Tibetan Plateau alpine steppe subregion (Figure 6l), which was similar to that in the whole Eurasian steppe. Further analyses on the AGB - MAP relationship in the Tibetan Plateau alpine steppe subregion showed that a simple linear relationship was found between AGB and MAP on the surface (elevation ≥ 4800 m) of the Tibetan Plateau (Figure 7a), while a Gaussian function in the east and southeast margins (elevation < 4800 m) of the Tibetan Plateau (Figure 7b).
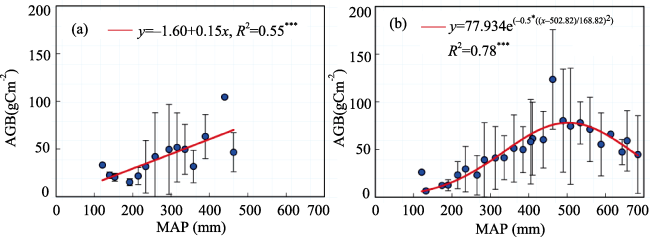
Figure 7 The correlations of spatial patterns of AGB to MAP on the surface (elevation > 4800 m) and the east and southeast margins (elevation < 4800 m) of the Tibetan Plateau
(a) The correlation of AGB to MAP on the Tibetan Plateau surface; (b) the correlation of AGB to MAP in the east and southeast margins of the Tibetan Plateau^The error bars show the SD (standard deviation) of AGB; *** indicates the regression equation was significant at the 0.001 level
Regression analyses of spatial patterns of AGB and soil variables at the depth of 0-30 cm suggested that Gravel had markedly negative effect on the spatial variation of AGB in the Eurasian steppe (Figure 8a), while had little impact on AGB variations in the three subregions (Figures 8d, 8g and 8j). An inverted U-shaped quadratic function was found between AGB and pH in the Tibetan Plateau alpine steppe subregion (Figure 8k). Nevertheless, AGB was insignificantly correlated to pH in the Eurasian steppe (Figure 8b), in the Black Sea-Kazakhstan steppe subregion (Figure 8e) and in the Mongolian Plateau steppe subregion (Figure 8h). AGB was linearly in positive correlation with SOC in the Black Sea-Kazakhstan steppe subregion (Figure 8f), while not remarkable relevant with SOC in the Eurasian steppe (Figure 8c), in the Mongolian Plateau steppe subregion (Figure 8i), and in the Tibetan Plateau alpine steppe subregion (Figure 8l).
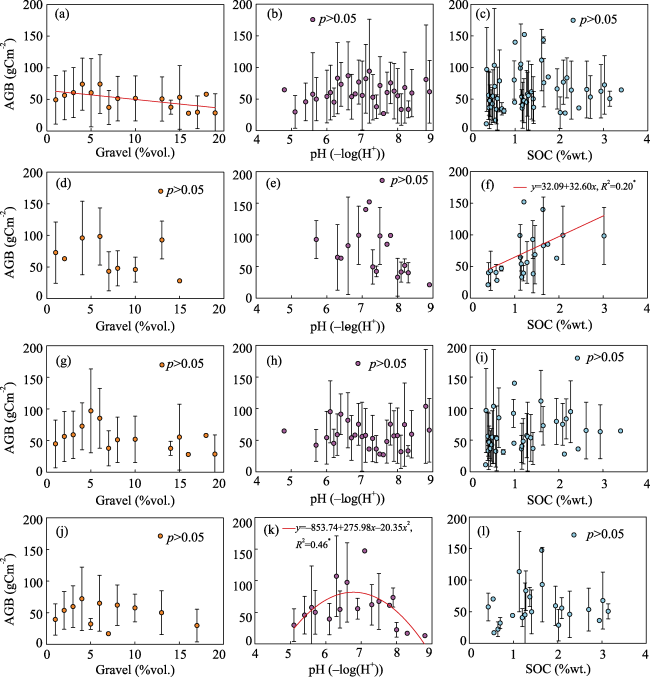
Figure 8 The relationships between AGB in the Eurasian steppe and soil factors
(a-c): the Eurasian steppe; (d-f): the Black Sea-Kazakhstan steppe subregion; (g-i): the Mongolian Plateau steppe subregion; (j-l): the Tibetan Plateau steppe subregion^The error bars show the SD (standard deviation) of AGB; *indicates the regression equation was significant at the 0.05 level, and p>0.05 indicates that AGB has no correlation to the soil factor

3.3 Quantitative correlations of AGB to environmental variables

We used the stepwise regression to quantify relationships between the spatial variation of AGB and environmental variables. Analysis results (Table 2) suggested that environmental variables (MAP, MAT, MAR and Gravel) explained 35% of the overall AGB variation in the Eurasian steppe. Of variables examined, MAP explained the largest proportion (~24.91%) of the AGB variation. In addition, MAT, MAR and Gravel could respectively explain 3.94%, 2.09%, and 3.98% of the AGB variation. The best-fit regression equation to describe the correlation of AGB to environmental variables in the Eurasian steppe could be expressed as Eq. (1).
\[AGB_E=84.82+54.69exp(-0.5(\frac{MAP-500.83}{154.16})^2)+\\1.15MAT-0.01MAR-1.163Grael,R^2=0.35,n=199 \ \ (1)\]
where AGBE was the aboveground biomass, MAP was the mean annual precipitation, MAT was the mean annual temperature, MAR was the mean annual shortwave radiation, and Gravel was the soil volume percentage gravel at a depth of 0-30 cm in the Eurasian steppe.
Table 2 Summary of the results obtained from stepwise multiple regressions between AGB and environmental variables, showing the integrative effects of environmental factors on the spatial variation of AGB in the Eurasian steppe
Factor df SS% F
Eurasian steppe
region
MAP 1 24.91*** 55.28
MAT 1 3.94** 10.96
Gravel 1 3.98** 11.09
MAR 1 2.09* 5.83
MAP×Gravel 1 0.88 2.44
Residual 193 64.21

Black Sea-Kazakhstan
steppe subregion
MAP 1 29.65*** 13.67
SOC 1 12.60* 5.81
MAP×SOC 1 5.72 2.64
Residual 24 52.04
Mongolian
Plateau steppe
subregion
MAP 1 35.62*** 49.39
MAP×MAT 1 4.49* 6.23
MAP×MAR 1 2.73. 3.78
MAT 1 0.20 0.27
Residual 79 56.96
Tibetan Plateau
alpine steppe
subregion
MAP 1 27.93*** 36.68
pH 1 7.18** 9.43
MAP×MAR 1 3.16 4.16
MAR 1 0.23 0.30
MAT 1 1.33 1.74
Resiudal 79 60.16

Note: *: p<0.05, **: p<0.01, and ***: p<0.001

In the Black Sea-Kazakhstan steppe subregion, 42.25% of the spatial variation in AGB could be explained by environmental factors (MAP, SOC). MAP and SOC respectively explained 29.65% and 12.60% of the AGB variation. The best-fit regression equation to quantify the relationship between AGB and environmental factors in the Black Sea-Kazakhstan steppe subregion could be expressed as Eq (2).
\[AGB_B=-15.35+0.18MAP+28.75SOC,R^2=0.42, n=28\ \ (2)\]
where AGBB was the aboveground biomass, MAP was the mean annual precipitation, and SOC was the soil organic content at the depth of 0-30 cm in the Black Sea-Kazakhstan steppe subregion.
In the Mongolian Plateau steppe subregion, the spatial variation in AGB was primarily influenced by MAP and MAT. They could explain 40.11% of the overall AGB variation. MAP explained about 35.62%, and interactions of MAP with MAT could further explain another 4.49% of the variation. The best-fit regression equation to illustrate the relationship between AGB and environmental factors in the Mongolian Plateau steppe subregion could be expressed as Eq. (3).
\[AGB_M=17.95+6.33exp(0.006MAP)-0.001MAP\times MAT,R^2=0.40,n=85 \ \ (3)\]
where AGBM was the aboveground biomass, MAP was the mean annual precipitation, and MAT was the mean annual temperature in the Mongolian Plateau steppe subregion.
In the Tibetan Plateau alpine steppe subregion, MAP and soil pH at the depth of 0-30 cm affected the spatial pattern of AGB. They could explain 35.11% of the overall spatial variation in AGB. MAP and soil pH respectively explained about 27.93% and 7.18% of the variation. The best-fit regression equation to describe the correlation of AGB to environmental factors in the Tibetan Plateau alpine steppe subregion could be expressed as Eq (4).
\[AGB_T=-440.32+65.97exp(-0.5(\frac{MAP-532.92}{219.13})^2)\\ +137.71pH-137.17pH^2,R^2=0.35,n=85 \ \ (4)\]
where AGBT was the aboveground biomass, MAP was the mean annual precipitation, and pH was the soil pH at the depth of 0-30 cm in the Tibetan Plateau alpine steppe subregion.

4 Discussion

4.1 Spatial patterns of AGB in grasslands

Vegetation biomass is one of the key parameters closely related to nutrient cycles, energy flow and carbon cycles (Jiang et al., 2015). It is also fundamental to understanding biogeochemical dynamics of terrestrial ecosystems (Luo et al., 2002). Therefore, exploring spatial patterns of vegetation biomass is of significance for evaluating carbon dioxide budgets of terrestrial ecosystems (Houghton et al., 2009). At the global scale, the spatial variation of biomass in terrestrial ecosystems shows a significantly latitudinal pattern, with maxima in the tropics and declining with increasing latitude (Lieth, 1975; Kicklighter et al., 1999; Begon et al., 2005).
Our results suggested that the spatial variation of AGB exhibited a decreasing trend in the Black Sea-Kazakhstan steppe subregion (Figure 3e) while an increasing trend in the Mongolian Plateau steppe subregion (Figure 3h) with the increase of the longitude. That made AGB variation represent a parabola form with the longitude in the “Black Sea-Kazakhstan - Mongolian Plateau steppe belt”. In addition, latitude and elevation had little impact on AGB variation in these two subregions. The horizontal distribution rule of AGB in the Eurasian steppe drawn in our study was in agreement with conclusions reported in previous studies like that conducted in the Central grassland of the United States by Sala et al. (1988), in the Patagonian steppe by Jobbágy et al. (2002), and in the Inner Mongolian temperate grassland by Ma et al. (2008) and Dai et al. (2016).
In the Tibetan Plateau alpine steppe subregion, the spatial distribution of AGB showed both significant vertical zonality with elevation and marked horizontal zonality with latitude and longitude. That is, AGB exhibited a significantly decreasing trend with the increase of elevation (Figure 3l), while an increasing trend with the increase of latitude (Figure 3j) and longitude (Figure 3k). The horizontal zonality of AGB variation in this subregion was determined by the spatial pattern of AGB in grasslands of the Plateau surface (Figures 4c and 5b), while the vertical zonality was dominated by AGB variation of grasslands in the east and southeast margins of the Plateau (Figures 4b and 5f). That enriched conclusions on the spatial distribution rules of AGB reported in the study conducted on the surface of the Tibetan Plateau by Yang et al. (2009), and the study conducted on a south-facing slope of the Nyaiqentanglha Mountains by Wang et al. (2013).
As for the Eurasian steppe overall, the horizontal distribution rule of AGB showed an inverted parabola curve with the latitude, and a parabola curve with the longitude. The vertical distribution rule of AGB exhibited an inverted U-shaped quadratic function with the elevation. That represented the superposition of AGB variations in the three subregions and provided an overview of the horizontal and vertical distribution rules of AGB variation in the Eurasian steppe.

4.2 Environmental controls of spatial variations in AGB

Spatial patterns of vegetation biomass and net primary productivity (NPP) were usually sensitive to a number of environmental variables like climate, soil and human disturbance etc. (Churkina and Running, 1998). However, spatial variations in climate dominated patterns of vegetation biomass and NPP (Rosenzweig, 1968; Sala et al., 1988; Churkina and Running, 1998; Kicklighter et al., 1999; Knapp and Smith, 2001; Jobbágy et al., 2002; Begon et al., 2005; Houghton et al., 2009; Wang et al., 2013). Lieth (1975) provided a world map of terrestrial primary production based on MAT and MAP alone. Churkina and Running (1998) suggested that temperature or water availability controlled spatial patterns of NPP over large land areas (31% and 52%, respectively) than did radiation limitation (5%).
Spatial variations of AGB in grasslands were generally related to MAP, MAT, soil texture, and soil nutrition (Eapstein et al., 1997; Lane et al., 1998; Anwar et al., 2006; Fang et al., 2010). MAP was the dominant factor (Sala et al., 1998; Yang et al., 2009), which had been confirmed in some studies like that conducted in the Central grassland of the United States by Sala et al. (1988) and Lauenroth and Sala (1992), in the Patagonian steppe by Jobbágy et al. (2002), in the Inner Mongolian temperate grassland by Bai et al. (2004) and in the Tibetan Plateau alpine grassland by Yang et al. (2009). Our results demonstrated spatial patterns of AGB in the Eurasian steppe and its three subregions were correlated to MAP, MAT, MAR, Gravel, pH and SOC. Nevertheless, MAP explained the largest proportion of the AGB variation (Figure 6 and Table 2), which furthermore verified the universality of conclusions reported in previous studies.
It should be noted that the shape of the relationship between AGB and MAP in the Eurasian steppe was similar to a Gaussian function curve (Figure 6c). It differed from conclusions reported in previous studies that AGB was linearly or exponentially in positive correlation with MAP in grasslands.
The special correlation of AGB to MAP in the Eurasian steppe overall was the comprehensive representation of AGB - MAP relationships in the three subregions. Figure 6 demonstrated that a linear relationship was found between AGB and MAP in the Black Sea-Kazakhstan steppe subregion (Figure 6f), an exponential relationship in the Mongolian Plateau steppe subregion (Figure 6i), while a Gaussian function relationship in the Tibetan Plateau alpine steppe subregion (Figure 4l). Unique spatial patterns of grasslands and environment in the Tibetan Plateau determined the special relationship between AGB and MAP in the whole Eurasian steppe.

4.3 Causes of the special AGB-MAP relationship in the Tibetan Plateau

In the Tibetan Plateau alpine steppe subregion, a Gaussian function was found between the spatial variation of AGB and MAP. It was a special ecological phenomenon in grasslands of the Tibetan Plateau formed by unique plateau environmental conditions. As for the Tibetan Plateau overall, AGB was positively related to MAP in the area where MAP was less than 500 mm while negatively correlated to MAP where MAP was more than 500 mm (Figure 6l).
On the surface of the Tibetan Plateau (elevation ≥ 4800 m), MAP of most AGB field sites were less than 500 mm (Figures 4a and 4c). The natural vegetation in this region was dominated by alpine steppes and alpine meadows. In addition, alpine steppes occupied larger proportion in area (Figure 4c). On the Plateau surface, the spatial distribution rule of AGB and its formation mechanism were in agreement with that in other grasslands located in low elevations like the Black Sea-Kazakhstan steppe subregion (elevation<3000 m) and the Mongolian Plateau steppe subregion (elevation<3000 m). That is, AGB variation was dominated by MAP and showed an increasing trend from the northwest to the southeast coinciding with the precipitation pattern in this region (Figures 4c and 7a).
In the east and southeast margins of the Tibetan Plateau (elevation<4800 m), MAP ranged from 100 mm to 700 mm. MAP of most AGB field sites was more than 500 mm located in this area of this study. Dominant vegetation types were alpine steppes and alpine meadows, and alpine meadows covered larger proportion in area (Figure 4b). In this region, the spatial distribution of AGB obeyed vertical zonality. Relationships between AGB and MAP were pretty complicated with the significant variation of elevation (Figure 7b).
It was demonstrated from Figure 4b that 300 mm isohyet was an important boundary of climate. In the area where MAP was less than 300 mm, dominant grassland types were alpine steppes (Figure 4b), the spatial variation in AGB of which was mainly determined by MAP, while was not significantly correlated to MAT (Figure 9a). Nevertheless, in the zone where MAP was more than 300 mm (Figure 4b), vegetation was dominated by alpine meadows. In addition, MAT became one of the influencing factors of the spatial variation in AGB and had significantly positive effect on AGB variation in this region (Figure 9a).
Figure 9b illustrated that MAP was positively correlated to MAT, so AGB showed a gradually increasing trend with the increase of MAP in the region where MAP ranged from 300 mm to 500 mm (Figure 9b and 7b). However, MAP was in negative correlations to MAT (Figure 9b), and AGB decreased with the increasing MAP due to limitation of low temperature to plant growth in the zone in which MAP varied from 500 mm to 600 mm (Figure 7b). There was no correlation between MAP and MAT (Figure 9b), and AGB variation was determined by MAT (Figure 9d) but not MAP (Figure 9c) in the region with MAP ranging from 600 mm to 700 mm.
In short, determining factors of the spatial variation in AGB varied with the precipitation gradient in the east and southeast margins of the Tibetan Plateau overall. In detail, AGB variation was significantly related to MAP in the area where MAP was less than 300 mm, both MAP and MAT in the zone in which MAP ranged from 300 mm to 600 mm, and MAT in the region where MAP varied from 600 mm to 700 mm. It was the spatial negative correlation between MAP and MAT in the zone with MAP from 500 mm to 600 mm that made the special AGB-MAP relationship showing a Gaussian function in the east and southeast margins of the Tibetan Plateau.
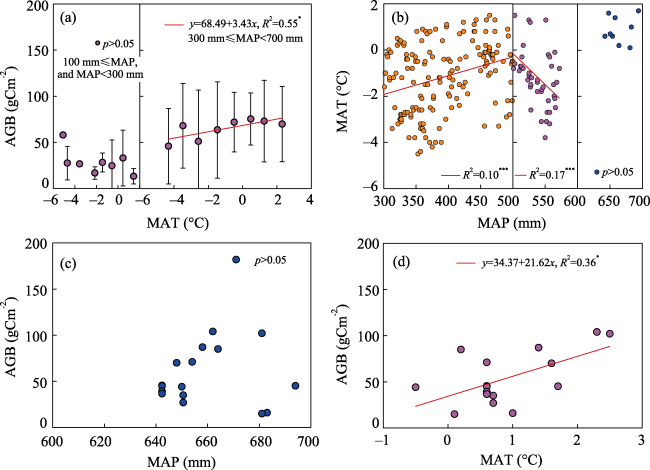
Figure 9 The correlations of AGB to MAT (a), MAT to MAP (b) along the precipitation gradient and correlations of AGB to MAP (c) and MAT (d) in the zone where MAP ranged from 600 mm to 700 mm in the east and southeast margins of the Tibetan Plateau^The error bars show the SD (standard deviation) of AGB; *indicates the regression equation was significant at the 0.05 level; ***at the 0.001 level; p> 0.05 indicates that the relationships were not significant between the two variables
In summary, a linearly positive relationship was found between the spatial variation in AGB and MAP on the surface of the Tibetan Plateau (Figure 7a), and a Gaussian function in the east and southeast margins of the Tibetan Plateau (Figure 7b). With the superposition of both, AGB variation showed a Gaussian function with the increasing MAP in the Tibetan Plateau overall.

5 Conclusions

We initially selected the whole Eurasian steppe as study area, and provided more comprehensive knowledge of spatial patterns of AGB and their environmental controls in grasslands than previous studies only conducted in local regions like the Inner Mongolian temperate grassland, the Tibetan Plateau alpine grassland etc. Primary conclusions were summarized below.
(1) The spatial variation of AGB was determined by MAP, and positively related to it in the Black Sea-Kazakhstan steppe subregion (elevation < 3000 m, MAP ≤ 500 mm), the Mongolian Plateau steppe subregion (elevation < 3000 m, MAP ≤ 500 mm), and on the surface of the Tibetan Plateau (elevation ≥ 4800 m, MAP≤ 500 mm).
(2) In the east and southeast margins of the Tibetan Plateau (elevation < 4800 m), the spatial distribution rule of AGB primarily showed the vertical zonality. Determining factors of the spatial pattern of AGB varied with precipitation gradients. In detail, dominant factors of AGB variation were MAP in the area where MAP varied from 100 mm to 300 mm, both MAP and MAT in the zone in which MAP ranged from 300 mm to 600 mm, and MAT in the region where MAP was from 600 mm to 700 mm.
(3) With the superposition of spatial patterns of AGB in the three subregions, the spatial distribution rule of AGB in the Eurasian steppe overall had significant horizontal zonality that AGB exhibited an inverted parabola curve with the latitude, a parabola curve with the longitude, and marked vertical zonality that AGB showed an inverted U-shaped quadratic function with the elevation. The controlling factor of AGB variation in the whole Eurasian steppe was MAP. In addition, a Gaussian function relationship was found between AGB and MAP, which was mainly caused by unique spatial patterns of grasslands and environment in the Tibetan Plateau.
In this study, several sources of uncertainty also existed. We did not discuss the impact on AGB which human activities like grazing had. In addition, the spatial distribution of grassland biomass sites was spatially biased with few sites in the western part of the study region. These work need to be conducted completely and deeply in the future studies.

The authors have declared that no competing interests exist.

[1]
Anwar M, Yang Y H, Guo Zhaodi et al., 2006. Grassland aboveground biomass in Xinjiang.Acta Scientiarum Naturalium Universitatis Pekinensis, 42(7): 521-526. (in Chinese)The authors estimated aboveground biomass in 6 grasslands of Xinjiang according to data composed of 460 plots from 92 sites in Xinjiang Uigur Autonomous Region. Meanwhile, the authors evaluated the relationship between aboveground biomass and environmental factors. The primary results are summarized as follows: (1) Aboveground biomass density varies significantly in different grassland type. In the steppe, desert steppe has the minimum, temperate steppe and alpine steppe has the medium, while meadow steppe has the maximum. In the meadow, montane meadow has higher aboveground biomass density than alpine meadow. (2) The total aboveground biomass in 6 grasslands of Xinjiang is 14.65 Tg C, which accounts for about 10% of China鈥檚 grassland biomass. The grassland aboveground biomass is distributed primarily in alpine steppe and alpine meadow, which accounts for 41.7%. (3) Aboveground biomass of steppe grassland is controlled by annual precipitation, while aboveground biomass of meadow grassland is determined by mean annual temperature. (4) Aboveground biomass of steppe grassland is mediated by soil moisture and soil total N content. However, no significant correlation is found between soil resource availability and aboveground biomass in meadow grassland.

[2]
Archibold O W, 2012. Ecology of World Vegetation. Springer Science & Business Media.

[3]
Bai Y, Han X, Wu Jet al., 2004. Ecosystem stability and compensatory effects in the Inner Mongolia grassland.Nature, 431(7006): 181-184.Numerous studies have suggested that biodiversity reduces variability in ecosystem productivity through compensatory effects109“6;that is, a species increases in its abundance in response to the reduction of another in a fluctuating environment1,7. But this view has been challenged on several grounds809“10. Because most studies have been based on artificially constructed grass- lands with short duration, long-term studies of natural ecosystems are needed. On the basis of a 24-year study of the Inner Mongolia grassland, here we present three key findings. First, that January-July precipitation is the primary climatic factor causing fluctuations in community biomass production; second, that ecosystem stability (conversely related to variability in community biomass production) increases progressively along the hierarchy of organizational levels (that is, from species to functional group to whole community); and finally, that the community-level stability seems to arise from compensatory interactions among major components at both species and functional group levels. From a hierarchical perspective, our results corroborate some previous findings of compensatory effects1,4,7,11. Undisturbed mature steppe ecosystems seem to culminate with high biodiversity, productivity and ecosystem stability concurrently. Because these relationships are correlational, further studies are necessary to verify the causation among these factors. Our study provides new insights for better management and restoration of the rapidly degrading Inner Mongolia grassland.

DOI PMID

[4]
Bai Y, Wu J, Xing Q et al.Xing Q , 2008. Primary production and rain use efficiency across a precipitation gradient on the Mongolia plateau.Ecology, 89(8): 2140-2153.Understanding how the aboveground net primary production (ANPP) of arid and semiarid ecosystems of the world responds to variations in precipitation is crucial for assessing the impacts of climate change on terrestrial ecosystems. Rain-use efficiency (RUE) is an important measure for acquiring this understanding. However, little is known about the response pattern of RUE for the largest contiguous natural grassland region of the world, the Eurasian Steppe. Here we investigated the spatial and temporal patterns of ANPP and RUE and their key driving factors based on a long-term data set from 21 natural arid and semiarid ecosystem sites across the Inner Mongolia steppe region in northern China. Our results showed that, with increasing mean annual precipitation (MAP), (1) ANPP increased while the interannual variability of ANPP declined, (2) plant species richness increased and the relative abundance of key functional groups shifted predictably, and (3) RUE increased in space across different ecosystems but decreased with increasing annual precipitation within a given ecosystem. These results clearly indicate that the patterns of both ANPP and RUE are scale dependent, and the seemingly conflicting patterns of RUE in space vs. time suggest distinctive underlying mechanisms, involving interactions among precipitation, soil N, and biotic factors. Also, while our results supported the existence of a common maximum RUE, they also indicated that its value could be substantially increased by altering resource availability, such as adding nitrogen. Our findings have important implications for understanding and predicting ecological impacts of global climate change and for management practices in arid and semiarid ecosystems in the Inner Mongolia steppe region and beyond.

DOI PMID

[5]
Begon M, Townsend C R, Harper J L,2005. Ecology: From Individuals to Ecosystems. 4th ed. Oxford: Blackwell Publishing.

[6]
Cao M K, Woodward F I, 1998. Net primary and ecosystem production and carbon stocks of terrestrial ecosystems and their responses to climate change.Global Change Biology, 4(2): 185-198.Abstract Evaluating the role of terrestrial ecosystems in the global carbon cycle requires a detailed understanding of carbon exchange between vegetation, soil, and the atmosphere. Global climatic change may modify the net carbon balance of terrestrial ecosystems, causing feedbacks on atmospheric CO 2 and climate. We describe a model for investigating terrestrial carbon exchange and its response to climatic variation based on the processes of plant photosynthesis, carbon allocation, litter production, and soil organic carbon decomposition. The model is used to produce geographical patterns of net primary production (NPP), carbon stocks in vegetation and soils, and the seasonal variations in net ecosystem production (NEP) under both contemporary and future climates. For contemporary climate, the estimated global NPP is 57.0 Gt C y 鈥1 , carbon stocks in vegetation and soils are 640 Gt C and 1358 Gt C, respectively, and NEP varies from 鈥0.5 Gt C in October to 1.6 Gt C in July. For a doubled atmospheric CO 2 concentration and the corresponding climate, we predict that global NPP will rise to 69.6 Gt C y 鈥1 , carbon stocks in vegetation and soils will increase by, respectively, 133 Gt C and 160 Gt C, and the seasonal amplitude of NEP will increase by 76%. A doubling of atmospheric CO 2 without climate change may enhance NPP by 25% and result in a substantial increase in carbon stocks in vegetation and soils. Climate change without CO 2 elevation will reduce the global NPP and soil carbon stocks, but leads to an increase in vegetation carbon because of a forest extension and NPP enhancement in the north. By combining the effects of CO 2 doubling, climate change, and the consequent redistribution of vegetation, we predict a strong enhancement in NPP and carbon stocks of terrestrial ecosystems. This study simulates the possible variation in the carbon exchange at equilibrium state. We anticipate to investigate the dynamic responses in the carbon exchange to atmospheric CO 2 elevation and climate change in the past and future.

DOI

[7]
CGIAR-CSI, 2006. NASA Shuttle Radar Topographic Mission (SRTM). The SRTM data is available as 3 arc second (approx. 90 m resolution) DEMs. The dataset is available for download at: .

[8]
Chapin F S, Mcfarland J, Mcguire A D et al.Mcguire A D , 2009. The changing global carbon cycle: Linking plant-soil carbon dynamics to global consequences.Journal of Ecology, 97(5): 840-850.1.Most current climate-carbon cycle models that include the terrestrial carbon (C) cycle are based on a model developed 40 years ago by Woodwell & Whittaker (1968) and omit advances in biogeochemical understanding since that time. Their model treats net C emissions from ecosystems as the balance between net primary production (NPP) and heterotrophic respiration (HR, i.e. primarily decomposition).2.Under conditions near steady state, geographic patterns of decomposition closely match those of NPP, and net C emissions are adequately described as a simple balance of NPP and HR (the Woodwell-Whittaker model). This close coupling between NPP and HR occurs largely because of tight coupling between C and N (nitrogen) cycles and because NPP constrains the food available to heterotrophs.3.Processes in addition to NPP and HR become important to understanding net C emissions from ecosystems under conditions of rapid changes in climate, hydrology, atmospheric CO2, land cover, species composition and-or N deposition. Inclusion of these processes in climate-C cycle models would improve their capacity to simulate recent and future climatic change.4.Processes that appear critical to soil C dynamics but warrant further research before incorporation into ecosystem models include below-ground C flux and its partitioning among roots, mycorrhizas and exudates; microbial community effects on C sequestration; and the effects of temperature and labile C on decomposition. The controls over and consequences of these processes are still unclear at the ecosystem scale.5.Carbon fluxes in addition to NPP and HR exert strong influences over the climate system under conditions of rapid change. These fluxes include methane release, wildfire, and lateral transfers of food and fibre among ecosystems.6.Water and energy exchanges are important complements to C cycle feedbacks to the climate system, particularly under non-steady-state conditions. An integrated understanding of multiple ecosystem-cli

DOI

[9]
Chapin F S, Woodwell G M, Randerson J T et al., 2006. Reconciling carbon-cycle concepts, terminology, and methods. Ecosystems, 9(7): 1041-1050.Recent projections of climatic change have focused a great deal of scientific and public attention on patterns of carbon (C) cycling as well as its controls, particularly the factors that determine whether an ecosystem is a net source or sink of atmospheric carbon dioxide (CO 2 ). Net ecosystem production (NEP), a central concept in C-cycling research, has been used by scientists to represent two different concepts. We propose that NEP be restricted to just one of its two original definitions鈥攖he imbalance between gross primary production (GPP) and ecosystem respiration (ER). We further propose that a new term鈥攏et ecosystem carbon balance (NECB)鈥攂e applied to the net rate of C accumulation in (or loss from [negative sign]) ecosystems. Net ecosystem carbon balance differs from NEP when C fluxes other than C fixation and respiration occur, or when inorganic C enters or leaves in dissolved form. These fluxes include the leaching loss or lateral transfer of C from the ecosystem; the emission of volatile organic C, methane, and carbon monoxide; and the release of soot and CO 2 from fire. Carbon fluxes in addition to NEP are particularly important determinants of NECB over long time scales. However, even over short time scales, they are important in ecosystems such as streams, estuaries, wetlands, and cities. Recent technological advances have led to a diversity of approaches to the measurement of C fluxes at different temporal and spatial scales. These approaches frequently capture different components of NEP or NECB and can therefore be compared across scales only by carefully specifying the fluxes included in the measurements. By explicitly identifying the fluxes that comprise NECB and other components of the C cycle, such as net ecosystem exchange (NEE) and net biome production (NBP), we can provide a less ambiguous framework for understanding and communicating recent changes in the global C cycle.

DOI

[10]
Churkina G, Running S W, 1998. Contrasting climatic controls on the estimated productivity of global terrestrial biomes.Ecosystems, 1(2): 206-215.Net primary productivity (NPP) represents the greatest annual carbon flux from the atmosphere to the biosphere, is an important component of seasonal fluctuations in atmospheric COconcentrations, and is the most critical biotic component of the global carbon cycle. NPP measures products of major economic and social importance, such as crop yield and forest production. Given that global NPP can not be measured directly, model simulations must provide understanding of its global spatial and temporal dynamics. In this study, we used the biogeochemical model BIOME-BGC to simulate global terrestrial NPP and assessed relative importance of climatic controls (temperature, water availability, and radiation) in limiting NPP in the array of climatic combinations found globally. The degree of limitation on NPP by climatic controls was defined by using an empirical membership function. Results showed that temperature or water availability limited NPP over larger land areas (31% and 52%, respectively) than did radiation limitation (5%). Climatic controls appeared to be important in limiting productivity in most vegetation biomes, except for evergreen broadleaf forests. Nevertheless, there were areas of the globe (12%) where none of the climatic factors appeared to limit NPP. Our research has suggested that other environmental controls, such as nutrient availability or biological constraints, should then be considered. The wide distribution of NPP between zero and the upper boundary values in the correlation plots indicated that multivariate environmental balances, not single limiting factors, controlled biospheric productivity.

DOI

[11]
Dai E F, Huang Y, Wu Z, et al., 2016. Analysis of spatio-temporal features of a carbon source/sink and its relationship to climatic factors in the Inner Mongolia grassland ecosystem.Journal of Geographical Sciences, 26(3): 297-312.Global climate change has become a major concern worldwide. The spatio-temporal characteristics of net ecosystem productivity(NEP), which represents carbon sequestration capacity and directly describes the qualitative and quantitative characteristics of carbon sources/sinks(C sources/sinks), are crucial for increasing C sinks and reducing C sources. In this study, field sampling data, remote sensing data, and ground meteorological observation data were used to estimate the net primary productivity(NPP) in the Inner Mongolia grassland ecosystem(IMGE) from 2001 to 2012 using a light use efficiency model. The spatio-temporal distribution of the NEP in the IMGE was then determined by estimating the NPP and soil respiration from 2001 to 2012. This research also investigated the response of the NPP and NEP to the main climatic variables at the spatial and temporal scales from 2001 to 2012. The results showed that most of the grassland area in Inner Mongolia has functioned as a C sink since 2001 and that the annual carbon sequestration rate amounts to 0.046 Pg C/a. The total net C sink of the IMGE over the 12-year research period reached 0.557 Pg C. The carbon sink area accounted for 60.28% of the total grassland area and the sequestered 0.692 Pg C, whereas the C source area accounted for 39.72% of the total grassland area and released 0.135 Pg C. The NPP and NEP of the IMGE were more significantly correlated with precipitation than with temperature, showing great potential for C sequestration.

DOI

[12]
Editorial Committee of Vegetation Map of China, Chinese Academy of Sciences, 2007. Vegetation Map of China and Its Geographical Pattern: Vegetation Map of the People’s Republic of China (1:1000 000). (in Chinese)

[13]
Epstein H E, Lauenroth W K, Burke I C, 1997. Effects of temperature and soil texture on ANPP in the US Great Plains.Ecology, 78(8): 2628-2831.Aboveground net primary production (ANPP) in grassland ecosystems is positively related to mean annual precipitation (MAP). However, at any given level of precipitation, other factors may effect ANPP. Our objective was to determine the importance of temperature and soil texture in explaining ANPP in the Great Plains of the United States. We constructed a spatial database of ANPP, climate, and soil texture for the region using a geographic information system. Holding MAP constant at 5-cm intervals, we related ANPP to mean annual temperature (MAT), and soil sand and clay contents. Our findings indicate that MAT and soil texture are important variables for explaining patterns of ANPP, after accounting for the variability explained by MAP. There is a negative relationship between temperature and ANPP when MAP is held constant; this has important climate-change implications. Results revealed an MAP crossover point for the inverse texture effect at 鈭 80 cm of rainfall, much higher than previously reported. The consequences of this are substantial for grasslands throughout the globe, where precipitation ranges between 25 and 100 cm.

DOI

[14]
Eswaran H, van den Berg E, Reich P, 1993. Organic carbon in soils of the world.Soil Science Society of America Journal, 57(1): 192-194.The C stored in soils is nearly three times that in the aboveground biomass and approximately double that in the atmosphere. Reliable estimates have been difficult to obtain due to a lack of global data on kinds of soils and the amount of C in each soil. With new data bases, our study is able to provide more reliable data than previous estimates. Globally, 1576 Pg of C is stored in soils, with [approx] 506 Pg (32%) of this in soils of the tropics. It is also estimated that [approx] 40% of the C in soils of the tropics is in forest soils. Other studies have shown that deforestation can result in 20 to 50% loss of this stored C, largely through erosion. 13 refs., 5 tabs.

DOI

[15]
Fang J, Yang Y, Ma W et al.Ma W , 2010. Ecosystem carbon stocks and their changes in China’s grasslands.Science in China Series C-Life Sciences, 53(7): 757-765.The knowledge of carbon(C) stock and its dynamics is crucial for understanding the role of grassland ecosystems in China's terrestrial C cycle.To date,a comprehensive assessment on C balance in China's grasslands is still lacking.By reviewing published literature,this study aims to evaluate ecosystem C stocks(both vegetation biomass and soil organic C) and their changes in China's grasslands.Our results are summarized as follows:(1) biomass C density(C stock per area) of China's grasslands differed greatly among previous studies,ranging from 215.8 to 348.1 g C m-2 with an average of 300.2 g C m-2.Likewise,soil C density also varied greatly between 8.5 and 15.1 kg C m-2.In total,ecosystem C stock in China's grasslands was estimated at 29.1 Pg C.(2) Both the magnitude and direction of ecosystem C changes in China's grasslands differed greatly among previous studies.According to recent reports,neither biomass nor soil C stock in China's grasslands showed a significant change during the past 20 years,indicating that grassland ecosystems are C neutral.(3) Spatial patterns and temporal dynamics of grassland biomass were closely correlated with precipitation,while changes in soil C stocks exhibited close associations with soil moisture and soil texture.Human activities,such as livestock grazing and fencing could also affect ecosystem C dynamics in China's grasslands.

DOI PMID

[16]
Gao T, Xu B, Yang X et al.Yang X , 2013. Using MODIS time series data to estimate aboveground biomass and its spatio-temporal variation in Inner Mongolia’s grassland between 2001 and 2011.International Journal of Remote Sensing, 34(21): 7796-7810.It is critical to understanding grassland biomass and its dynamics to study regional carbon cycles and the sustainable use of grassland resources. In this study, we estimated aboveground biomass (AGB) and its spatio-temporal pattern for Inner Mongolia's grassland between 2001 and 2011 using field samples, Moderate Resolution Imaging Spectroradiometer normalized difference vegetation index (MODIS-NDVI) time series data, and statistical models based on the relationship between NDVI and AGB. We also explored possible relationships between the spatio-temporal pattern of AGB and climatic factors. The following results were obtained: (1) AGB averaged 19.1 TgC (1Tg=10(12)g) over a total area of 66.01x10(4)km(2) between 2001 and 2011 and experienced a general fluctuation (coefficient of variation=9.43%), with no significant trend over time (R-2=0.05, p>0.05). (2) The mean AGB density was 28.9 gCm(-2)over the whole study area during the 11 year period, and it decreased from the northeastern part of the grassland to the southwestern part, exhibiting large spatial heterogeneity. (3) The AGB variation over the 11 year period was closely coupled with the pattern of precipitation from January to July, but we did not find a significant relationship between AGB and the corresponding temperature changes. Precipitation was also an important factor in the spatial pattern of AGB over the study area (R-2=0.41, p <0.001), while temperature seemed to be a minor factor (R-2=0.14, p <0.001). A moisture index that combined the effects of precipitation and temperature explained more variation in AGB than did precipitation alone (R-2=0.45, p <0.001). Our findings suggest that establishing separate statistical models for different vegetation conditions may reduce the uncertainty of AGB estimation on a large spatial scale. This study provides support for grassland administration for livestock production and the assessment of carbon storage in Inner Mongolia.

DOI

[17]
Guo Q, Hu Z, Li S et al. , 2012. Spatial variations in aboveground net primary productivity along a climate gradient in Eurasian temperate grassland: Effects of mean annual precipitation and its seasonal distribution.Global Change Biology, 18(12): 3624-3631.Abstract Concomitant changes of annual precipitation and its seasonal distribution within the context of global climate change have dramatic impacts on aboveground net primary productivity (ANPP) of grassland ecosystems. In this study, combining remote sensing products with in situ measurements of ANPP, we quantified the effects of mean annual precipitation (MAP) and precipitation seasonal distribution (PSD) on the spatial variations in ANPP along a climate gradient in Eurasian temperate grassland. Our results indicated that ANPP increased exponentially with MAP for the entire temperate grassland, but linearly for a specific grassland type, i.e. the desert steppe, typical steppe, and meadow steppe from arid to humid regions. The slope of the linear relationship appeared to be steeper in the more humid meadow steppe than that in the drier typical and desert steppes. PSD also had significant effect on the spatial variations in ANPP. It explained 39.4% of the spatial ANPP for the entire grassland investigated, being comparable with the explanatory power of MAP (40.0%). On the other hand, the relative contribution of PSD and MAP is grassland type specific. MAP exhibited a much stronger explanatory power than PSD for the desert steppe and the meadow steppe at the dry and wet end, respectively. However, PSD was the dominant factor affecting the spatial variation in ANPP for the median typical steppe. Our results imply that altered pattern of PSD due to climate change may be as important as the total amount in terms of effects on ANPP in Eurasian temperate grassland.

DOI

[18]
Hall D O, Scurlock J M O, 1991. Climate change and productivity of natural grasslands.Annals of Botany, 67(Supp1.): 49-55.Natural grasslands, especially in the tropics, urgently need more detailed study in order to determine the response of this undervalued major ecosystem type to possible climate changes. Feedback effects through environmental variables such as temperature, water and nutrient stress may be at least as significant as the increase in atmospheric CO鈧 concentration, but there is scarcely enough data at present to develop and validate modelling. Annual burning of large areas of tropical grasslands plays a significant role in the global carbon cycle. Net loss of soil carbon and nitrogen may result, depending upon the frequency of fire, overgrazing and drought. The UNEP Project on productivity and photosynthesis in tropical grasslands attempts to correct the gap in baseline data, and has found these ecosystems to be far more productive than previously appreciated. Based on data from three terrestrial grassland sites, the gross flux of carbon from burning of tropical grasslands falls in the range 2.4-4.2 Gt per annum, a significant amount compared with the net fluxes of 1.8 Gt estimated from deforestation and 5.3 Gt from fossil combustion. Data from this project is also being applied to modelling work in collaboration with SCOPE, in order to study climate change effects on carbon cycling in grasslands.

DOI

[19]
Han F, Zhang Q, Buyantuev A, et al., 2015. Effects of climate change on phenology and primary productivity in the desert steppe of Inner Mongolia.Journal of Arid Land, 7(2): 251-263.

DOI

[20]
Hijmans R J, Cameron S E, Parra J L et al. , 2005. Very high resolution interpolated climate surfaces for global land areas.International Journal of Climatology, 25(15): 1965-1978.Abstract We developed interpolated climate surfaces for global land areas (excluding Antarctica) at a spatial resolution of 30 arc s (often referred to as 1-km spatial resolution). The climate elements considered were monthly precipitation and mean, minimum, and maximum temperature. Input data were gathered from a variety of sources and, where possible, were restricted to records from the 1950鈥2000 period. We used the thin-plate smoothing spline algorithm implemented in the ANUSPLIN package for interpolation, using latitude, longitude, and elevation as independent variables. We quantified uncertainty arising from the input data and the interpolation by mapping weather station density, elevation bias in the weather stations, and elevation variation within grid cells and through data partitioning and cross validation. Elevation bias tended to be negative (stations lower than expected) at high latitudes but positive in the tropics. Uncertainty is highest in mountainous and in poorly sampled areas. Data partitioning showed high uncertainty of the surfaces on isolated islands, e.g. in the Pacific. Aggregating the elevation and climate data to 10 arc min resolution showed an enormous variation within grid cells, illustrating the value of high-resolution surfaces. A comparison with an existing data set at 10 arc min resolution showed overall agreement, but with significant variation in some regions. A comparison with two high-resolution data sets for the United States also identified areas with large local differences, particularly in mountainous areas. Compared to previous global climatologies, ours has the following advantages: the data are at a higher spatial resolution (400 times greater or more); more weather station records were used; improved elevation data were used; and more information about spatial patterns of uncertainty in the data is available. Owing to the overall low density of available climate stations, our surfaces do not capture of all variation that may occur at a resolution of 1 km, particularly of precipitation in mountainous areas. In future work, such variation might be captured through knowledge-based methods and inclusion of additional co-variates, particularly layers obtained through remote sensing. Copyright 漏 2005 Royal Meteorological Society.

DOI

[21]
Hou X Y, 2014. Thinking and practice on the protection and development of the Eurasian steppe based on the northern China’s grasslands.Chinese Journal of Grassland, 36(1): 1-2.

[22]
Houghton R A, Forrest H, Goetz S J, 2009. Importance of biomass in the global carbon cycle. Journal of Geophysical Research: Biogeosciences, 114: G00E03. doi: 10.1029/2009JG000935.1] 聽Our knowledge of the distribution and amount of terrestrial biomass is based almost entirely on ground measurements over an extremely small, and possibly biased sample, with many regions still unmeasured. Our understanding of changes in terrestrial biomass is even more rudimentary, although changes in land use, largely tropical deforestation, are estimated to have reduced biomass, globally. At the same time, however, the global carbon balance requires that terrestrial carbon storage has increased, albeit the exact magnitude, location, and causes of this residual terrestrial sink are still not well quantified. A satellite mission capable of measuring aboveground woody biomass could help reduce these uncertainties by delivering three products. First, a global map of aboveground woody biomass density would halve the uncertainty of estimated carbon emissions from land use change. Second, an annual, global map of natural disturbances could define the unknown but potentially large proportion of the residual terrestrial sink attributable to biomass recovery from such disturbances. Third, direct measurement of changes in aboveground biomass density (without classification of land cover or carbon modeling) would indicate the magnitude and distribution of at least the largest carbon sources (from deforestation and degradation) and sinks (from woody growth). The information would increase our understanding of the carbon cycle, including better information on the magnitude, location, and mechanisms responsible for terrestrial sources and sinks of carbon. This paper lays out the accuracy, spatial resolution, and coverage required for a satellite mission that would generate these products.

DOI

[23]
Hu Z, Fan J, Zhong H et al. , 2007. Spatiotemporal dynamics of aboveground primary productivity along a precipitation gradient in Chinese temperate grassland.Science in China Series D: Earth Sciences, 50(5): 754-764.Investigating the spatial and temporal variance in productivity along natural precipitation gradients is one of the most efficient approaches to improve understanding of how ecosystems respond to climate change. In this paper, by using the natural precipitation gradient of the Inner Mongolian Plateau from east to west determined by relatively long-term observations, we analyzed the temporal and spatial dynamics of aboveground net primary productivity (ANPP) of the temperate grasslands covering this region. Across this grassland transect, ANPP increased exponentially with the increase of mean annual precipitation (MAP) (ANPP=24.47e 0.005MAP , R 2 =0.48). Values for the three vegetation types desert steppe, typical steppe, and meadow steppe were: 60.86 gm 612 a 611 , 167.14 gm 612 a 611 and 288.73 gm 612 a 611 respectively. By contrast, temperature had negative effects on ANPP. The moisture index ( K ), which takes into account both precipitation and temperature could explain the spatial variance of ANPP better than MAP alone (ANPP=2020.34 K 1.24 , R 2 =0.57). Temporally, we found that the inter-annual variation in ANPP (calculated as the coefficient of variation, CV) got greater with the increase of aridity. However, this trend was not correlated with the inter-annual variation of precipitation. For all of the three vegetation types, ANPP had greater inter-annual variation than annual precipitation (PPT). Their difference (ANPP CV/PPT CV) was greatest in desert steppe and least in meadow steppe. Our results suggest that in more arid regions, grasslands not only have lower productivity, but also higher inter-annual variation of production. Climate change may have significant effects on the productivity through changes in precipitation pattern, vegetation growth potential, and species diversity.

DOI

[24]
Hu Z, Yu G, Fan J et al., 2010. Precipitation-use efficiency along a 4500-km grassland transects.Global Ecology and Biogeography, 19(6): 842-851.Aims Clarifying the spatiotemporal variations in precipitation-use efficiency (PUE), the ratio of vegetation above-ground productivity to annual precipitation, will advance our understanding of how ecosystems' carbon and water cycles respond to climate change. Our goal is to investigate the variations in PUE at both regional and site scales along a 4500-km climate-related grassland transect.Location The Inner Mongolian Plateau in northern China and the Qinghai-Tibetan Plateau.Methods We collected data on 580 sites from four data sources. The data were acquired through field surveys and long-term in situ observations. We investigated the relationships between precipitation and PUE at both regional and site scales, and we evaluated the effects of the main biotic and climatic factors on PUE at both spatial scales.Results PUE decreased with decreasing mean annual precipitation (MAP), except for a slight rise toward the dry end of the gradient. The maximum PUE showed large site-to-site variation along the transect. Vegetation cover significantly affected the spatial variations in PUE, and this probably accounts for the positive relationship between PUE and MAP. However, there was no significant relationship between inter-annual variations in precipitation or vegetation cover and PUE within given ecosystems along the transect.Conclusions The findings of this research contradict the prevailing view that a convergent maximum PUE exists among diverse ecosystems, as presented in previous reports. Our findings also suggest the action of distinct mechanisms in controlling PUE at different spatial scales. We propose the use of a conceptual model for predicting vegetation productivity at continental and global scales with a sigmoid function, which illustrates an increasing PUE with MAP in arid regions. Our approach may represent an improvement over use of the popular Miami model.

DOI

[25]
Jiang Y, Tao J, Huang Y et al. , 2015. The spatial pattern of grassland aboveground biomass on Xizang Plateau and its climatic controls.Journal of Plant Ecology, 8(1): 30-40.中国科学院机构知识库(中国科学院机构知识库网格(CAS IR GRID))以发展机构知识能力和知识管理能力为目标,快速实现对本机构知识资产的收集、长期保存、合理传播利用,积极建设对知识内容进行捕获、转化、传播、利用和审计的能力,逐步建设包括知识内容分析、关系分析和能力审计在内的知识服务能力,开展综合知识管理。

DOI

[26]
Jobbágy E G, Sala O E, Paruelo J M, 2002. Patterns and controls of primary production in the Patagonian steppe: A remote sensing approach. Ecology, 83(2): 307-319.We took advantage of regional gradients to study the spatial relationships between aboveground net primary production (ANPP) and climate in the Patagonian steppe of South America. We explored the same relationships through time, considering the natural variations of ANPP and climate for 11 yr. Based on NOAA/AVHRR satellite normalized difference vegetation index (NDVI) data, we evaluated the effects of climate on annual and seasonal ANPP across regional gradients of precipitation (100-500 mm/yr) and temperature (-1鈿-9鈿珻 of annual mean). We studied ANPP climatic controls through time at four sites using NDVI and meteorological data. We used annual NDVI integral as a surrogate of annual ANPP. Annual NDVI integral increased linearly along regional gradients of precipitation, and its annual variability decreased exponentially. Annual NDVI integral was, in most cases, unrelated to precipitation through time. We described the seasonality of ANPP using four variables derived from seasonal NDVI curves: the dates of growing season start and end, the date of maximum NDVI, and the length of the growing season. The growing season started later toward the cold extreme of the regional temperature gradients and, within a given site through time, during the coldest years. The dates of maximum NDVI and end of the growing season occurred later toward the humid or cold extremes of the regional gradients, whereas the length of the growing season was positively affected by precipitation and temperature along these gradients. These variables were not associated with climate through time. The response of the start of the growing season to temperature was greater in time, following the natural climatic fluctuations, than in space, accompanying regional temperature gradients. This difference probably resulted because the time required for shifts in community composition and plant adaptation is longer than one year. Climatic determinants of ANPP shifted from precipitation alone to precipitation plus temperature when the temporal scale of analysis changed from annual to seasonal. Our results indicate the feasibility of forecasting forage availability a few months prior to the beginning of the growing season, but not during the whole year. Longer term data sets and manipulative experiments are required to forecast annual ANPP and predict its response to climate change.

DOI

[27]
Kicklighter D W, Bondeau A, Schloss A L et al. , 1999. Comparing global models of terrestrial net primary productivity (NPP): Global pattern and differentiation by major biome.Global Change Biology, 5(S1): 16-24.A cellular protein, previously described as p55, binds specifically to the plus strand of the mouse hepatitis virus (MHV) leader RNA, We have purified this protein and determined by partial peptide sequencing that it is polypyrimidine tract-binding protein (PTB) (also known as heterogeneous nuclear ribonucleoprotein [hnRNP] I), a nuclear protein which shuttles between the nucleus and cytoplasm, PTB plays a role in the regulation of alternative splicing of pre-mRNAs in normal cells and translation of several viruses. By UV cross-linking and immunoprecipitation studies using cellular extracts and a recombinant PTB, we have established that PTB binds to the MHV plus-strand leader RNA specifically. Deletion analyses of the leader RNA mapped the PTB-binding site to the UCUAA pentanucleotide repeats. Using a defective-interfering RNA reporter system, we have further shown that the PTB-binding site in the leader RNA is critical for MHV RNA synthesis, This and our previous study (H,-P. Li, X, Zhang, R Duncan, L, Comai, and M, M, C. Lai, Proc. Natl, Acad, Sci, USA 94:9544-9549, 1997) combined thus show that two cellular hnRNPs, PTB and hnRNP Al, bind to the transcription-regulatory sequences of MHV RNA and may participate in its transcription.

DOI

[28]
Knapp A K, Smith M D, 2001. Variation among biomes in temporal dynamics of aboveground primary production.Science, 291(5503): 481-484.

[29]
Лавренко, 1959. Geography, dynamics and history of the Eurasian steppe. In: Лавренко (ed.). Grasslands in Soviet Union. Beijing: Science Press. (in Chinese)

[30]
Lane D R, Coffin D P, Lauenroth W K, 1998. Effects of soil texture and precipitation on above-ground net primary productivity and vegetation structure across the Central Grassland region of the United States.Journal of Vegetation Science, 9(2): 239-250.Abstract Abstract. A potentially important organizing principle in arid and semi-arid systems is the inverse-texture hypothesis which predicts that plant communities on coarse-textured soils should have higher above-ground net primary productivity (ANPP) than communities on fine-textured soils; the reverse is predicted to occur in humid regions. Our objectives were: (1) to test predictions from the inverse-texture hypothesis across a regional precipitation gradient, and (2) to evaluate changes in community composition and basal cover on coarse- and fine-textured soils across this gradient to determine how these structural parameters may affect ANPP. Sites were located along a precipitation gradient through the Central Grassland region of the United States: mean annual precipitation ranges from 311 mm/y to 711 mm/y, whereas mean annual temperature ranges from 9 掳C to 11 掳C. For both coarse- and fine-textured sites in 1993 and 1994, August - July precipitation in the year of the study explained greater than 92% of the variability in ANPP. Soil texture did not explain a significant proportion of the variability in ANPP. However, soil texture did affect the proportion of ANPP contributed by different functional types. Forbs and shrubs made up a larger proportion of total ANPP on coarse- compared to fine-textured sites. Shrubs contributed more to ANPP at the drier end of the gradient. Basal cover of live vegetation was not significantly related to precipitation and was similar for both soil textures. Our results revealed that across a regional precipitation gradient, soil texture may play a larger role in determining community composition than in determining total ANPP.

DOI

[31]
Lauenroth W K, Sala O E, 1992. Long-term forage production of North American shortgrass steppe.Ecological Applications, 2(4): 397-403.We evaluated the relationship between annual forage production and annual and seasonal precipitation and temperature at a shortgrass steppe site in north-central Colorado using a long-term data set (52 yr). We also constructed a relationship between forage production and aboveground net primary production (ANPP). Precipitation fluctuated randomly, but temperature had clear warming and cooling trends including a 17-yr warming trend from 1974 to 1990. Forage production was significantly related to both annual and seasonal precipitation but not temperature. Precipitation events between 15 and 30 mm accounted for most of the variability in production because they accounted for most of the variability in precipitation and because they wetted the soil layers that have the largest effect on production. Forage production amplified variability in annual precipitation. Production showed time lags of several years in responding to increases in precipitation. Change in vegetation structure has a characteristic response time, which contrains production responses in wet years. Constraint caused by vegetation structure is the reason why regional ANPP-precipitation models have a steeper slope than long-term models and point out a weakness of exchanging space for time in predicting production patterns.

DOI PMID

[32]
Li B, 1979. General characters of vegetation in grasslands in China.Chinese Journal of Grassland, 1: 1-13. (in Chinese)

[33]
Lieth H, 1975. Modeling the primary productivity of the world. In: Lieth H, Whittaker R H. Primary Productivity of the Biosphere. New York: Springer-Verlag.

[34]
Luo T, Li W, Zhu H, 2002. Estimated biomass and productivity of natural vegetation on the Tibetan Plateau.Ecological Applications, 12(4): 980-997.We developed a methodology for linking together data from forest and grassland inventories and ecological research sites, and provided a comprehensive report about live biomass and net primary productivity (NPP) on the Tibetan Plateau, the "Third Pole" of the earth where little information about plant biomass and production had been available outside China. Results were as follows. (1) The total live biomass of the natural vegetation in the Xizang (Tibet) Autonomous Region and Qinghai Province was estimated as 2.17 Gg dry mass, of which 72.9% was stored in forests where spruce-fir accounted for 65.1%. (2) The total annual NPP of the natural vegetation in these two administrative regions was estimated as 0.57 Gg dry mass, of which grasslands and forests accounted for 69.5% and 18.1%, respectively. (3) The alpine spruce-fir forests of the Tibetan Plateau had the highest maximum live biomass of the spruce-fir forests globally, with values up to 500-1600 Mg DM/ha (including both aboveground and belowground biomass). (4) The QZNPP model generally predicted NPP well for most of the biomes on the plateau, and simulated the various Chinese vegetation divisions. Model results showed a positive reinforcing effect of monsoon climate in China where the warmest season coincides with the wettest season. (5) The live biomass map for 117 counties of Xizang (Tibet) and Qinghai and the potential NPP map for the whole plateau both showed the same decreasing trend from southeast to northwest.

DOI

[35]
Ma W, Yang Y, He J et al., 2008. Above- and belowground biomass in relation to environmental factors in temperate grasslands, Inner Mongolia.Science in China Series C-Life Sciences, 51(3): 263-270.

[36]
Myneni R B, Keeling C D, Tucker C J et al., 1997. Increased plant growth in the northern high latitudes from 1981 to 1991.Nature, 386(6626): 698-702.

[37]
Nachtergaele F, van Velthuizen H, Verelst L, 2012. Harmonized World Soil Database Version 1.2. Food and Agriculture Organization of the United Nations(FAO), International Institute for Applied Systems Analysis(IIASA), ISRIC-World Soil Information, Institute of Soil Science - Chinese Academy of Sciences (ISSCAS), Joint Research Centre of the European Commission (JRC).

[38]
New M, Hulme M, Jones P, 1999. Representing twentieth-century space-time climate variability. Part I: Development of a 1961-90 mean monthly terrestrial climatology.Journal of Climate, 12(3): 829-856.

[39]
New M, Hulme M, Jones P, 2000. Representing twentieth-century space-time climate variability. Part II: Development of 1901-1996 monthly grids of terrestrial surface climate. Journal of Climate, 13(13): 2217-2238.

[40]
New M, Jones P, Hulme M.ISLSCP II Climate Research Unit CRU05 Monthly Climate Data. In: Hall, Forrest G, Collatz G, Meeson B et al. (eds.). ISLSCP Initiative II Collection. Dataset. Available on-line [http://daac.ornl.gov/] from Oak Ridge National Laboratory Distributed Active Archive Center, Oak Ridge, Tennessee, U.S.A. doi: 10.3334/ORNLDAAC/1015, 2011.

[41]
Noy-Meir I, 1973. Desert ecosystems: environment and producers.Annual Review of Ecology and Systematics, 4: 23-51.desert ecosystems: environment and producers

DOI

[42]
R Development Core Team, 2011. R: A language and environment for statistical computing. R Foundation for Statistical Computing, Vienna, Austria. .

[43]
Rosenzweig M L, 1968. Net primary productivity of terrestrial communities: Prediction from climatological data.American Naturalist, 102(923): 67-74.Actual evapotranspiration (AE) is shown to be a highly significant predictor of the net annual above-ground productivity in mature terrestrial plant communities. Communities included ranged from deserts and tundra to tropical forests. It is hypothesized that the relationship of AE to productivity is due to the fact that AE measures the simultaneous availability of water and solar energy, the most important rate-limiting resources in photosynthesis.

DOI

[44]
Sala O E, Parton W J, Joyce L A et al., 1988. Primary production of the central grassland region of the United States.Ecology, 69(1): 40-45.Aboveground net primary production of grasslands is strongly influenced by the amount and distribution of annual precipitation. Analysis of data collected at 9500 sites throughout the central United States confirmed the overwhelming importance of water availability as a control of production. The regional spatial pattern of production reflected the east-west gradient in annual precipitation. Lowest values of aboveground net primary production were observed in the west and highest values in the east. This spatial pattern was shifted eastward during unfavorable years and westward during favorable years. Variability in production among years was maximum in northern New Mexico and southwestern Kansas and decreased towards the north and south. The regional pattern of production was largely accounted for by annual precipitation. Production at the site level was explained by annual precipitation, soil water-holding capacity, and an interaction term. Our results support the inverse texture hypothesis. When precipitation is <370 mm/yr, sandy soils with low water-holding capacity are more productive than loamy soils with high water-holding capacity, while the opposite pattern occurs when precipitation is >370 mm/yr.

DOI

[45]
Schimel D S, Emanuel W, Rizzo B et al., 1997. Continental scale variability in ecosystem processes: Models, data, and the role of disturbance.Ecological Monographs, 67(2): 251-271.

[46]
Schlesinger W H, 1977. Carbon balance in terrestrial detritus.Annual Review of Ecology and Systematics, 8: 51-81.

[47]
Scurlock J M O, Hall D O, 1998. The global carbon sink: A grassland perspective.Global Change Biology, 4(2): 229-233.The challenge to identify the biospheric sinks for about half the total carbon emissions from fossil fuels must include a consideration of below-ground ecosystem processes as well as those more easily measured above-ground. Recent studies suggest that tropical grasslands and savannas may contribute more to the 'missing sink' than was previously appreciated, perhaps as much as 0.5 Pg (= 0.5 Gt) carbon per annum. The rapid increase in availability of productivity data facilitated by the Internet will be important for future scaling-up of global change responses, to establish independent lines of evidence about the location and size of carbon sinks.

DOI

[48]
Scurlock J M O, Johnson K, Olson R J, 2002. Estimating net primary productivity from grassland biomass dynamics measurements. Global Change Biology, 8(8): 736-753.Abstract To address the need for a high quality data set based upon field observations suitable for parameterization, calibration, and validation of terrestrial biosphere models, we have developed a comprehensive global database on net primary productivity (NPP). We have compiled field measurements of biomass and associated environmental data for multiple study sites in major grassland types worldwide. Where sufficient data were available, we compared aboveground and total NPP estimated by six computational methods (algorithms) for 31 grassland sites. As has been found previously, NPP estimates were 2鈥5 times higher using methods which accounted for the dynamics of dead matter, compared with what is still the most commonly applied estimate of NPP (maximum peak live biomass). It is suggested that assumptions such as the use of peak biomass as an indicator of NPP in grasslands may apply only within certain subbiomes, e.g. temperate steppe grasslands. Additional data on belowground dynamics, or other reliable estimates of belowground productivity, are required if grasslands are to be fully appreciated for their role in the global carbon cycle.

DOI

[49]
Scurlock J M O, Johnson K R, Olson R J, 2015. NPP Grassland: NPP Estimates from Biomass Dynamics for 31 Sites, 1948-1994, R1. Data set. Available on-line [. NPP Grassland: NPP Estimates from Biomass Dynamics for 31 Sites, 1948-1994, R1. Data set. Available on-line [] from Oak Ridge National Laboratory Distributed Active Archive Center, Oak Ridge, Tennessee, USA. .

[50]
Solomon S, Qin D, Manning M et al., 2007.Climate Change 2007: The Physical Science Basis, Contribution of Working Group 1 to the Fourth Assessment Report of the Intergovernmental Panel on Climate Change. Cambridge: United Kingdom Cambridge University Press.

[51]
Turner D P, Ritts W D, Cohen W B et al., 2005. Site-level evaluation of satellite-based global terrestrial gross primary production and net primary production monitoring.Global Change Biology, 11(4): 666-684.Operational monitoring of global terrestrial gross primary production (GPP) and net primary production (NPP) is now underway using imagery from the satellite-borne Moderate Resolution Imaging Spectroradiometer (MODIS) sensor. Evaluation of MODIS GPP and NPP products will require site-level studies across a range of biomes, with close attention to numerous scaling issues that must be addressed to link ground measurements to the satellite-based carbon flux estimates. Here, we report results of a study aimed at evaluating MODIS NPP/GPP products at six sites varying widely in climate, land use, and vegetation physiognomy. Comparisons were made for twenty-five 1 km 2 cells at each site, with 8-day averages for GPP and an annual value for NPP. The validation data layers were made with a combination of ground measurements, relatively high resolution satellite data (Landsat Enhanced Thematic Mapper Plus at 6530 m resolution), and process-based modeling. There was strong seasonality in the MODIS GPP at all sites, and mean NPP ranged from 80 g C m 612 yr 611 at an arctic tundra site to 550 g C m 612 yr 611 at a temperate deciduous forest site. There was not a consistent over- or underprediction of NPP across sites relative to the validation estimates. The closest agreements in NPP and GPP were at the temperate deciduous forest, arctic tundra, and boreal forest sites. There was moderate underestimation in the MODIS products at the agricultural field site, and strong overestimation at the desert grassland and at the dry coniferous forest sites. Analyses of specific inputs to the MODIS NPP/GPP algorithm – notably the fraction of photosynthetically active radiation absorbed by the vegetation canopy, the maximum light use efficiency (LUE), and the climate data – revealed the causes of the over- and underestimates. Suggestions for algorithm improvement include selectively altering values for maximum LUE (based on observations at eddy covariance flux towers) and parameters regulating autotrophic respiration.

DOI

[52]
Wang Z, Luo T,Li R et al., 2013. Causes for the unimodal pattern of biomass and productivity in alpine grasslands along a large altitudinal gradient in semi-arid regions.Journal of Vegetation Science, 24(1): 189-201.QuestionsHow can we understand the limitations to plant growth at high altitudes? Our aim was to test the hypotheses that for alpine grasslands along a large altitudinal gradient in semi-arid regions, plant growth is mainly limited by drought at low altitudes but by low temperature at high altitudes, resulting in a unimodal pattern of biomass and productivity associated with an optimal combination of temperature and precipitation. Such knowledge is important to understanding the response of alpine ecosystems to climate change.LocationWe conducted a 5-yr livestock exclosure experiment along the south-facing slope of the Nyaiqentanglha Mountains, central Tibetan Plateau.MethodsWe measured above- and below-ground biomass, species richness, leaf δ13C and water potential, and related climate and soil variables across 42 fenced and unfenced quadrats near seven HOBO weather stations along the slope. The vegetation changed from alpine steppe-meadow at 4390–4500 m to alpine meadow at 4600–5210 m.ResultsTotal above- and below-ground biomass across fenced and unfenced quadrats increased with increasing altitude up to 4950–5100 m, and then decreased above 5100 m. Altitudinal trends in leaf δ13C and water potential of dominant species also showed a unimodal pattern corresponding to that of vegetation biomass. Total above- and below-ground biomass as well as sedge above-ground biomass all showed a quadratic relationship with mean temperatures and the ratio of growing season precipitation (GSP) to ≥5 °C accumulated temperature (AccT; R2 = 0.83610.88, P < 0.001). In general, above- and below-ground biomass increased with increasing water availability when the GSP/AccT ratio was lower than the threshold level of 0.80–0.84, but decreased when the GSP/AccT ratio was higher than this threshold level. No significant relationship was found between residuals of above-ground biomass and species richness after removing the effects of climate factors on both stand variables.ConclusionsThe results support our hypotheses, further suggesting a threshold of water limitation that is consistent with the model prediction over the Tibetan Plateau. Species richness per se appears to weakly affect community-level productivity. The response of alpine grasslands to climate warming may vary with altitude because of altitudinal shifts in factors limiting plant growth.

DOI

[53]
Woodward S L, 2008. The Temperate Grassland Biome. In: Woodward S L (ed.). Grassland Biomes. Westport, Connecticut • London: Greenwood Press.

[54]
Wu Z Y, 1979. Chinese Vegetation. Beijing: Science Press. (in Chinese)

[55]
Yang J, Mi R, Liu J, 2009. Variations in soil properties and their effect on subsurface biomass distribution in four alpine meadows of the hinterland of the Tibetan Plateau of China.Environmental Geology, 57(8): 1881-1891.To understand and predict the role of soils in changes in alpine meadow ecosystems during climate warming, soil monoliths, extending from the surface to the deepest roots, were collected from Carex moorcroftii , Kobresia humilis , mixed grass, and Kobresia pygmaea alpine meadows in the hinterland of the Tibetan Plateau, China. The monoliths were used to measure the distribution with depth of biomass, soil grain size, soil nutrient levels, and soil moisture. With the exception of the K. pygmaea meadow, the percentages of gravel and coarse sand in the soils were high, ranging from 37.7 to 57.8% for gravel, and from 18.7 to 27.9% for coarse sand. The texture was finest in the upper 10cm soil layer, and generally became coarser with increasing depth. Soil nutrients were concentrated in the top 15cm soil layer, especially in the top 10cm. Soil water content was low, ranging from 3 to 28.4%. Most of the subsurface biomass was in the top 10cm, with concentrations of 79.8% in the K. humilis meadow, 77.6% in the mixed grass meadow, and 62.3% in the C. moorcroftii meadow. Owing to deeper root penetration, the concentration of subsurface biomass in the upper 10cm of K. pygmaea soil was only 41.7%. The subsurface biomass content decreased exponentially with depth; this is attributed to the increase in grain size and decrease in soil nutrient levels with depth. Soil water is not a primary factor influencing the vertical and spatial distribution of subsurface biomass in the study area. The lack of fine material and of soil nutrients resulted in low surficial and subsurface biomass everywhere.

DOI

[56]
Yang Y, Fang J, Ma W et al., 2010. Large-scale pattern of biomass partitioning across China’s grasslands.Global Ecology and Biogeography, 19(2): 268-277.ABSTRACT Aim68 To investigate large-scale patterns of above-ground and below-ground biomass partitioning in grassland ecosystems and to test the isometric theory at the community level. Location68 Northern China, in diverse grassland types spanning temperate grasslands in arid and semi-arid regions to alpine grasslands on the Tibetan Plateau. Methods68 We investigated above-ground and below-ground biomass in China's grasslands by conducting five consecutive sampling campaigns across the northern part of the country during 2001–05. We then documented the root:shoot ratio (R/S) and its relationship with climatic factors for China's grasslands. We further explored relationships between above-ground and below-ground biomass across different grassland types. Results68 Our results indicated that the overall R/S of China's grasslands was larger than the global average (6.3 vs. 3.7). The R/S for China's grasslands did not show any significant trend with either mean annual temperature or mean annual precipitation. Above-ground biomass was nearly proportional to below-ground biomass with a scaling exponent (the slope of log–log linear relationship between above-ground and below-ground biomass) of 1.02 across various grassland types. The slope did not differ significantly between temperate and alpine grasslands or between steppe and meadow. Main conclusions68 Our findings support the isometric theory of above-ground and below-ground biomass partitioning, and suggest that above-ground biomass scales isometrically with below-ground biomass at the community level.

DOI

[57]
Yang Y, Fang J, Pan Y D et al., 2009. Aboveground biomass in Tibetan grasslands.Journal of Arid Environments, 73(1): 91-95.This study investigated spatial patterns and environmental controls of aboveground biomass (AGB) in alpine grasslands on the Tibetan Plateau by integrating AGB data collected from 135 sites during 2001–2004 and concurrent enhanced vegetation index derived from MODIS data sets. The AGB was estimated at 68.8 g m 612, with a larger value (90.8 g m 612) in alpine meadow than in alpine steppe (50.1 g m 612). It increased with growing season precipitation (GSP), but did not show a significant overall trend with growing season temperature (GST) although it was negatively correlated with GST at dry environments (<200 mm of GSP). Soil texture also influenced AGB, but the effect was coupled with precipitation; increased silt content caused a decrease of AGB at small GSP, and generated a meaningful increase under humid conditions. The correlation between AGB and sand content indicated an opposite trend with that between AGB and silt content. An analysis of general linear model depicted that precipitation, temperature, and soil texture together explained 54.2% of total variance in AGB. Our results suggest that moisture availability is a critical control of plant production, but temperature and soil texture also affect vegetation growth in high-altitude regions.

DOI

[58]
Yu G R, Fang H J, Fu Y L et al., 2011. Research on carbon budget and carbon cycle of terrestrial ecosystems in regional scale: A review.Acta Ecologica Sinica, 31(19): 5449-5459. (in Chinese )Changes of carbon pools and carbon cycles in the earth system are important factors affecting the climate system,and the mechanism of carbon budget and carbon cycle of terrestrial ecosystems is the research focus in the field of global climate change cause,trend forecasting,mitigation and adaptation countermeasure.This paper focuses on reviewing the research frontiers of regional carbon cycle and carbon budget of terrestrial ecosystems and its key scientific issues in the past few decades,and analyzing the technical requirements and development in this research field.Presently,the frontier areas and focus of research include inventory of ecosystems and regional carbon storage and their budget,a comprehensive measurement and certification of carbon sinks,network observation of carbon fluxes in terrestrial ecosystems and its driving mechanisms,controlled experiments on the responses and adaption of terrestrial ecosystems carbon cycle to climate change,and the coupling cycles of water,carbon,nitrogen processes in terrestrial ecosystem and model simulation.Simultaneously,some key scientific issues need to be resolved in this research field was suggested.In China,recent research should focus on building the three-dimensional monitoring system of integrated carbon storage and carbon budget,prospectively researching ecosystem carbon-nitrogen-water coupling cycle and its regulation,quantitatively evaluating the carbon budget and potential carbon sink of Chinese terrestrial ecosystems,and assessing the economic benefits of typical increasing carbon sink technology.These can provide reports,measurable and verifiable scientific data and technical support for greenhouse gas management,carbon trading scheme and policy system build.

[59]
Zhang Y L, Qi W, Zhou C P et al., 2014. Spatial and temporal variability in the net primary production of alpine grassland on the Tibetan Plateau since 1982.Journal of Geographical Sciences, 24(2): 269-287.基于 GIMMS AVHRR NDVI 数据( 8 km 空间分辨率)为 19822000 , SPOT 植被 NDVI 数据( 1 km 空间分辨率)为 19982009 ,并且观察植物生物资源数据, CASA 模型习惯于在高山的草地的变化在西藏的高原( TP )上让主要生产( NPP )赚的模型。这研究将帮助评估高山的草地生态系统的健康条件,并且对高原牧场并且到 TP 上的国家生态的安全躲蔽处的函数的理解的持续开发的提升很重要。NPP 变化的时间空间的特征用空间统计分析被调查,独立根据 physico 地理的因素(自然地区,高度,纬度和经度) ,河盆,和县级的行政区域。处理的数据用一个 ENVI 4.8 平台被执行,当一个 ArcGIS 9.3 和 ANUSPLIN 平台被用来进行空间分析并且印射时。主要结果如下:(1 ) TP 上的高山的草地的 NPP 逐渐地从东南减少到西北,它在降水和温度对应于坡度。从 1982 ~ 2009,在 TP 高山的草地的平均年度全部的 NPP 是 177.2 ?? ?? ? x

DOI

[60]
Zhou X M, 1980. A summary of alpine grasslands in the Tibetan Plateau and their correlation to the Eurasian steppe.Acta Agrestia Sinica, 4: 1-6. (in Chinese)

Outlines

/