Orginal Article

The spatio-temporal variations of frost-free period in China from 1951 to 2012

  • NING Xiaoju , 1, 2 ,
  • LIU Gangjun 3 ,
  • ZHANG Lijun 1 ,
  • QIN Xiaoyang 4 ,
  • ZHOU Shenghui 1 ,
  • QIN Yaochen , 1, 2, *
Expand
  • 1. College of Environment and Planning, Key Laboratory of Geospatial Technology for Middle and Lower Yellow River Regions, Henan University, Kaifeng 475004, Henan, China
  • 2. College of Resources and Environment, Henan Three New-Types Coordinated Development Center, Henan University of Economics and Law, Zhengzhou 450046, China
  • 3. College of Science, Engineering and Health, RMIT University, 124 LaTrobe Street, Melbourne 3000, Australia
  • 4. Institute of Geography, Henan Academy of Sciences, Zhengzhou 450052, China

Author: Ning Xiaoju (1987-), specialized in sustainable development. E-mail:

*Corresponding author: Qin Yaochen (1959-), Professor, specialized in a regional model on sustainable development and geographic information science. E-mail:

Received date: 2016-07-06

  Accepted date: 2016-08-30

  Online published: 2017-02-10

Supported by

National Basic Program of China (973 Program), No.2012CB955800

National Natural Science Foundation of China, No.41671536, No. 41501588

Qinghai Key Laboratory Open Fund of Disaster Prevention and Reduction, No.QHKF201401

Key Scientific Research Projects in Colleges and Universities, No.17A170005

Copyright

Journal of Geographical Sciences, All Rights Reserved

Abstract

The frost-free period (FFP), first frost date (FFD) and last frost date (LFD) have been regard as the important climate variables for agricultural production. Understanding the spatio-temporal variations of the FFP, FFD and LFD is beneficial to reduce the harmful impacts of climate change on agricultural production and enhance the agricultural adaptation. This study examined daily minimum temperatures for 823 national-level meteorological stations, calculated the values of FFD, LFD and FFP for station-specific and region-specific from 1951 to 2012, estimated the gradients of linear regression for station-specific moving averages of FFD, LFD and FFP, and assessed station-specific time series of FFP and detected the abrupt change. The results as follows: at both the station level and the regional level, the FFP across China decreases with the increase of latitude from south to north, and with the increase of altitude from east to west generally. At the station level, the inter-annual fluctuations of FFD, LFD and FFP in south and west agricultural regions are greater than those in north and east. At the regional level, excluding the QT region, temporal changes of FFP are relatively small in both the low-latitude and the high-latitude regions, but for the mid-latitude regions. According to the linear trend gradients of the moving average values of station-specific FFD, LFD and FFP, FFD was delayed, LFD advanced, and FFP extended gradually over the 80% of China. Furthermore, the change magnitudes for FFD, LFD and FFP in the north and east agricultural regions are higher than that in the southern and western. Among the 659 station-specific time series of FFP examined by the Mann-Kendall test, 341 stations, located mainly in the north region, have one identifiable and significant abrupt change. And at the 341 stations with identified abrupt changes, most (57%) abrupt changes occurred during 1991-2012, followed by the periods of 1981-1990 (28%), 1971-1980 (12%), and 1951-1970 (3%). The spatio-temporal variations of FFD, LFD and FFP would provide important guidance to agricultural practices.

Cite this article

NING Xiaoju , LIU Gangjun , ZHANG Lijun , QIN Xiaoyang , ZHOU Shenghui , QIN Yaochen . The spatio-temporal variations of frost-free period in China from 1951 to 2012[J]. Journal of Geographical Sciences, 2017 , 27(1) : 23 -42 . DOI: 10.1007/s11442-017-1362-z

1 Introduction

Global warming increases the heat stress of crops and hence influences the crop yields (IPCC, 2014; Edmar et al., 2013; Ramirez-Villegas et al., 2013). The frost-free period (FFP), and the related first frost date (FFD) and last frost date (LFD), are important indicators of temperature variations (Li et al., 1988). We could reduce the negative impacts of extreme low temperature events on agriculture production, and select the suitable crop types and adjust the crop systems to enhance the agricultural adaptation to climate change by analyzing the spatio-temporal variation in FFP, FFD and LFD (Han et al., 2010; Zhang et al., 2014). Therefore, there have been a great number of literatures highlighting the FFP and the related FFD and LFD (Qian et al., 2012; Skaggs and Irmak, 2012).
On the onset of FFD, Han et al. (2010) revealed a clear later FFD in northern China since 2000. The FFD was delayed significantly in Shanxi province between 1970 and 2009, with an abrupt change occurring in 2000 (Qian et al., 2010). The similar delayed trend of FFD was observed in the neighboring Shaanxi province, with an average delaying for 1.4 days per 10 years (Bai et al., 2013). FFD was delayed for about 11 days between 1960 and 2011 in the Xinjiang region (Pan et al., 2013), with the delayed rate of 2.21 days per 10 years (Zhang et al., 2013). Under the influence of climate warming, the delayed rate of FFD in northwest China was 1.8 days per decade, and FFD witnessed the abrupt change in 1986 (Chen et al., 2013; Li and Shen, 2013). In the last five decades, records from some stations in the Tibet region on the FFD also showed a delaying trend (Du et al., 2013). The delayed rate for the FFD in the Hengduan Mountains was about 1.09 days per decade (Wang et al., 2014). Even for the Chongqing region located in the south, the FFD also displayed a delaying trend during the last four decades (Du et al., 2014).
With regards to the arrival of LFD, the LFD of Shanxi province fluctuated on the dominant temporal variation, with multiple abrupt changes occurring between 1975 and 1996. However, the spatial differentiation of LFD was obvious in Shanxi province. There was a much earlier LFD in the central-western and southern parts, contrasted by the much later LFD in the central-eastern and northwestern parts (Li et al., 2013). In average, the LFD has advanced for about 1.7 days per decade in Shaanxi province (Bai et al., 2013), and for about 1.41 days per decade from 1960 to 2011 in the Xinjiang region (Pan et al., 2013; Zhang et al., 2013). The LFD has also advanced significantly in the north China and the Hengduan Mountains from1963 to 2009 and from 1990 to 1999, respectively (Dai et al., 2013; Wang et al., 2014). However, the LFD in the Chongqing region was delayed (Du et al., 2014).
Influenced by changes in both the FFD and LFD, the FFP also varied. Researchers have revealed that the FFP has increased in some areas, such as northwest China, Shanxi province, Shaanxi province, and Hengduan Mountains, due to the combined effects of a later FFD and an earlier LFD (Qian et al., 2010; Bai et al., 2013; Pan et al., 2013; Zhang et al., 2013; Li and Shen, 2013; Wang et al., 2014). The slow increase of FFP in the Chongqing region was due to the combined effects of much delayed FFD and slightly delayed LFD (Du et al., 2014). With readily available FFP observations, some researchers did not relate the changes in FFP with the timing of FFD and LFD, but focused on the trends of change in FFP. For instance, Zhang et al. (2013) found that the rate of increase in FFP in the Ningxia region was about 4.7 days per decade between 1961 and 2010, with an abrupt change occurring in 1982. The rate of increase in FFP was about 3.5 days per decade in northeast China, with the contour line of FFP towards the north (Hu et al., 2015). In the Tibet region, changes in the number of frost days have been used as a proxy for characterizing changes in FFP. The number of frost days has decreased in the Tibet region, but the decreased range varied in different parts of Tibet (Labaciren et al., 2014). Through the frost days forecasted by the R/S method, Du et al. (2013) hinted that the FFP would increase in many parts of the Tibet region gradually in future.
However, researches on FFD, LFD, FFP and its abrupt changes, as well as the inter-relationships among these agro-climate variables by now, only covered limited areas, concerned inconsistent time periods, and have not yet established a clear understanding of the characteristics of spatio-temporal variations of FFP across China. This study aims at, first, establishing a general understanding of the characteristics of spatio-temporal variations of FFP across China between 1951 and 2012, in terms of estimated regional averages of FFD, LFD and FFP based on the 9 agricultural regions of China (NAZC, 1981); and then, through spatial interpolation of station-based calculation of FFD, LFD and FFP, to reveal China-wide spatial distributions of FFD, LFD and FFP, estimate their linear trends and inter-relationships, and examine when and where abrupt changes in FFP occurred.

2 Data and method

2.1 Data

Both time series of daily minimum temperature between 1951 and 2012 and location data for national-level meteorological stations are obtained for this study from the Chinese meteorological data hub (http://www.escience.gov.cn/metdata/page/index.html). In China, there are only 152 national-level meteorological stations in 1951; the number increased rapidly to 766 in 1960; and 824 stations are in operation till 2012. Among the 824 stations, one station takes records only in certain seasons, and 97 stations are located in the southern agricultural regions that recorded only a few frost days between 1951 and 2012. Therefore, time series of daily minimum temperature between 1951 and 2012 from only 726 stations can be used for the determination of FFD, LFD and FFP. At the 726 stations, 67 stations missing records in some years, and only 659 stations’ data are usable for the Mann-Kendall test for detecting abrupt changes in time series. Boundary of the 9 agricultural regions in China is downloaded from National Earth System Science Data Sharing Information (http://www2.geodata. cn/index.html) in shape file format. The types of spatial distribution for the 9 agricultural regions in China are shown in Figure 1.
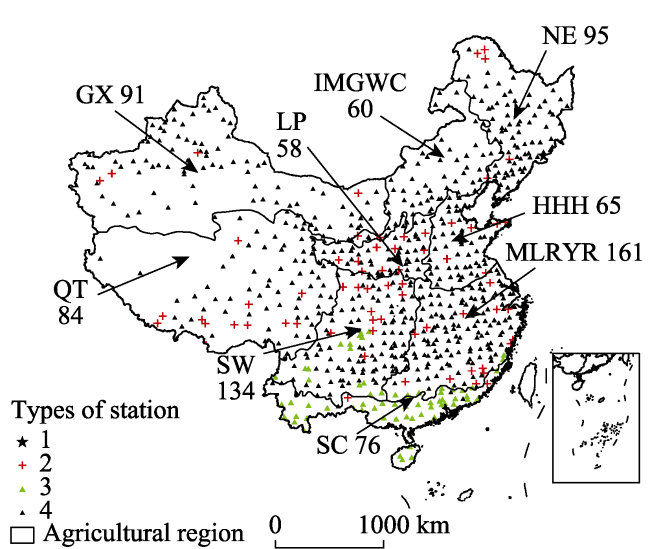
Figure 1 The 9 agricultural regions and 824 national-level meteorological stations used in the study
Notes: I. Station types: 1. The station with records only in certain seasons; 2. The 67 stations with missing records for some years; 3. The 97 stations recorded frost-free period longer than 360 days; 4. The 659 stations with records of frost periods that are usable for the Mann-Kendall test. II. Agricultural regions:Gansu-Xinjiang (GX) region, Inner Mongolia and Great Wall Corridor (IMGWC) region, Northeast (NE) region, Huang-Huai-Hai (HHH) region, Loess Plateau (LP) region, Southwest (SW) region, South China (SC) region, Mid-and-Lower Reaches of the Yangtze River (MLRYR) region, Qinghai-Tibet (QT) region. III. The northern agricultural regions include IMGWC, NE, HHH, and LP regions; while the southern agricultural regions include SW, SC, and MLRYR.

2.2 Method

The characteristic spatio-temporal variations in FFD, LFD, and FFP across China between 1951 and 2012 are derived via the following procedures (Figure 2): calculate station-specific values of FFD, LFD, and FFP; compute region-specific values of FFD, LFD, and FFP; estimate linear trends of station-specific values of FFD, LFD, and FFP; and detect abrupt changes in station-specific time series of FFP.
2.2.1 Calculate the station-specific values of FFD, LFD and FFP
Generally, both FFD and LFD are calculated with measured ground temperatures (Han et al., 2010). However, due to limited availability of measured ground temperatures, daily minimum temperatures (DMT) are usually used to calculate the FFD and LFD. In this study, the DMT data, which obtained from the meteorological stations, are adopted to calculate station-specific FFD, LFD and FFP. Then convert the FFD, LFD and FFP to Julian calendar for analyzing their temporal changes and trends.
For each of the 823 stations, year-specific dates of FFDij, LFDij, the corresponding FFPij, and their means (µFFDi, µLFDi, µFFPi) and standard deviations (sFFDi, sLFDi, sFFPi) between 1951 and 2012 are obtained, where i (= 1…823) refers to stations and j (= 1…62) refers to years. For most stations, mainly in the northern parts of China, FFDij is specified as the first time since autumn when daily minimum temperature observed at the station (DMTij) is equal to or below 0℃, LFDij is specified as the last time before summer when DMTij is equal to or below 0℃, and FFPij is specified as the total number of days fall between LFDij and FFDij. For some stations, mainly in the southern parts of China, where the records indicate no dates when DMTij is equal to or below 0℃, both FFDij and LFDij are set to null, and FFPij is set to 365 days for non-leap years, and 366 for leap years.
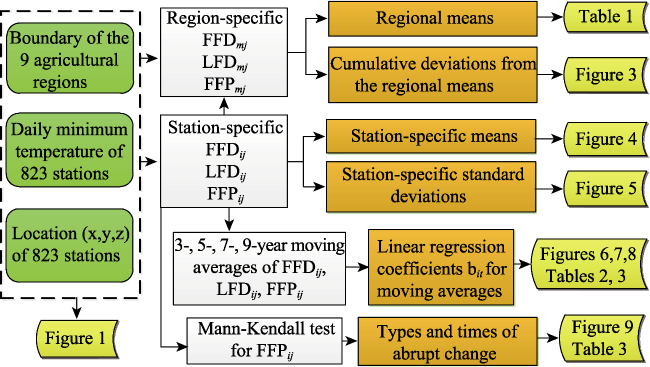
Figure 2 The methodology applied in this study
Universal kriging is regarded as a useful and data-driven spatial interpolation method for transforming a point-based representation of climate variables into climate surfaces or fields (Tang and Yang, 2012). This study transforms the 823 point-base values into a set of raster surfaces by the universal kriging, and characterise the spatial variations of FFD, LFD and FFP.
2.2.2 Compute region-specific values of FFD, LFD and FFP
Cumulative deviation from the mean (CDFM) is a commonly used technique for detecting trends in time series (Wei, 2007). In this study, the cumulative annual deviations from the regional averages of FFD, LFD and FFP are derived to illustrate their region-specific trends of temporal variations. Based on the spatial overlay and statistical summary, the cumulative annual deviations from the regional average for each of the 9 agricultural regions are derived through three steps:
First, select all stations within each region, and calculate the 9×62 annual regional averages for FFD, LFD and FFP (µFFDmj, µLFDmj, µFFPmj) and the 9 regional averages over the 62 years (µFFDm, µLFDm, µFFPm), where m (= 1…9) refers to specific region and j (= 1…62) specific year. The regional averages are summarised in Table 1.
Second, calculate the 9×62 annual deviations from the regional averages (DFFDmj = µFFDmj - µFFDm, DLFDmj = µLFDmj - µLFDm, DFFPmj = µFFPmj - µFFPm).
Third, calculate the 9×61 cumulative annual deviations from the regional average (SDFFDmj, SDLFDmj, SDFFPmj) in a manner of SDFFDmj+2 = SDFFDmj + SDFFDmj+1, SDLFDmj+2 = SDLFDmj + SDLFDmj+1, and SDFFPmj+2 = SDFFPmj + SDFFPmj+1, and to illustrate the general trends of temporal variations of FFD, LFD and FFP for each region, by plotting SDFFDmj, SDLFDmj and SDFFPmj on the y-axis against the year on the x-axis (Figure 3).
2.2.3 Estimate linear trends of station-specific values of FFD, LFD and FFP
Linear trend estimate is regarded as useful for indicating trends and rates of changes in time series of climate variables (Wei, 2007). In this study, moving averages of station-specific time series of FFD, LFD and FFP are used to build linear trend models and, based upon these models, to examine their trends and rates of changes between 1951 and 2012. This task also involves three steps:
First, calculate 3-, 5-, 7-, and 9-year moving averages of FFDij, LFDij and FFPij (FFDit, LFDit or FFPit, where t = 3, 5, 7, 9).
Second, determine station-specific linear regression coefficients bit (as in yit = ai + bitxit, where xit = FFDit, LFDit or FFPit, and yit are best linearly fitted values of FFDit, LFDit or FFPit, and use bit as a proxy for the linear trend gradient of temporal variations in FFDit, LFDit, and FFPit.
Third, characterise the spatial variations of station-specific linear trends of FFD, LFD and FFP, by transforming the 823 point-based values of bit into a set of raster surfaces (Figures 6-8), and summarising area percentage associated with bit for FFDit, LFDit and FFPit (Tables 2 and 3).
2.2.4 Detect abrupt changes in station-specific time series of FFP
The Mann-Kendall test (Mann, 1945; Kendall, 1967; Goossens and Berger, 1986) is a non-parametric (distribution-free) test that can be used in place of a parametric linear regression analysis to test if the slope of the estimated linear regression line is different from zero. The Mann-Kendall test is often used to statistically assess if there is a monotonic, linear or non-linear, upward or downward trend of the variable of interest over time, or detect if and when abrupt changes happen in time series from one monotonic upward (downward) trend to another (Fu and Wang, 1992). In this study, the Mann-Kendall test is used to detect abrupt changes in station-specific time series of FFP across China, and is implemented in the Matlab environment as follows:
(1) Let xij denote FFPij, the FFP value at station i for year j,and for each station i, order xij over time, xi1, xi2,…, xin.
(2) Find all n(n-1)/2 possible differences rik = xik - xil, where k > l, k=2,…, n, l=1, 2, 3, …, k, including xi2-xi1, xi3-xi1,..., xin-xi1, xi3-xi2, xi4-xi2, ..., xin-xin-2, xin-xin-1.
(3) Let rik = 1, if xik-xil > 0, means that the value of x at time k is greater than that at time l; and rik = 0, if xik-xil £ 0, means that the value of x at time k is less than that at time l.
(4) Compute Sik as follows:\(S_{ik}=\sum^n_{k=2}\sum^k_{l=1}r_{ik}\) .
(5) For each Sik, compute its expected value, E(Sik) = k(k-1)/4, variance, V(Sik) = k(k-1)(2k+5)/72, and UFik value, UFik =\(\frac{s_{ik}-E(S_{ik})}{\sqrt{Var(_{ik})}}\).
(6) Reverse the order of xij over time, xin, xin-1, xin-2, …, xi1, and then compute the UBik in the same manner as described in steps 2-5 above.
(7) Plot the UFik and UBik curves, detect the abrupt changes (or intersection points, if any), and classify the 659 qualified stations into three types (Figure 9 and Table 4):
a) for type 1 stations, the UFik and UBik curves have only one intersect point which lies within the confidence region (ua=0.05=±1.96);
b) for type 2 stations, the UFik and UBik curves also have only one intersect point but lies outside the confidence region (ua=0.05=±1.96);
c) for type 3 stations, the UFik and UBik curves have more than two intersect points.
(8) Identify time of abrupt changes in FFP that are associated only with type 1 station UFik and UBik curves.

3 Results and analysis

3.1 Evolving spatial distributions of FFD, LFD and FFP in agricultural regions

Regional average values of FFD, LFD and FFP determined for the 9 agricultural regions in China are summarised in Table 1. It is clear that the QT region has the shortest frost-free period, the earliest onset of FFD, and the latest arrival of LFD. As for the NE and IMGWC regions, they have similar lengths of frost-free period and similar dates for both FFD and LFD. Compared with the IMGWC region, the onset of FFD in the GX region is about one week later, the arrival of LFD is about two weeks earlier, and consequently, the frost-free period is about 20 days longer. Compared with the GX region, the onset of FFD in the LP region is about two weeks later, the arrival of LFD is about one week earlier, and consequently, the frost-free period is about 20 days longer. Located toward the east of the LP region, with a lower altitude, and closer to the sea, the HHH region has a much later onset of FFD, a much earlier LFD, and consequently, a longer frost-free period. Compared with the northern agricultural regions (of NE, IMGWC, GX, LP, HHH), the southern agricultural regions (of MLRYR, SW) exhibit greater variations in FFD, LFD and FFP: the FFD varies orderly from November in the north, through December in the middle, to January next year in the south, corresponding changes are shown for the LFD, and the FFP varies between 200 and 365 days, with an average about 300 days. In the SC region, no stable dates of FFD and LFD exist, and the FFP covers almost the whole year.
Table 1 Regional averages for FFD, LFD and FFP determined for the 9 agricultural regions in China
Region-ID (m) Region code µFFDm (date) µLFDm (date) µFFPm (days)
1 QT 18 September 27 May 116
2 NE 3 October 3 May 154
3 IMGWC 1 October 2 May 152
4 GX 9 October 19 April 173
5 LP 22 October 13 April 192
6 HHH 10 November 26 March 229
7 MLRYR Uncertain Uncertain 295
8 SW Uncertain Uncertain 300
9 SC Uncertain Uncertain 363
The temporal variations in FFD, LFD and FFP throughout the 62 years, within each of the nine agricultural regions, are characterised by means of the CDFM curves (Figure 3). In the QT region, the CDFM curve for FFD (i.e. the red curve in Figure 3a) indicates three phases: (1) a short initial increasing phase until the mid-1950s, indicating the FFD is gradually postponed; (2) a long, continuous decreasing phase until about 1990, indicating the FFD is shifted continuously to an earlier date; and (3) another increasing phase since about 1990, indicating FFD is again postponed gradually. Temporal variation in LFD in the QT region shifted gradually to an earlier date until the mid-1950s, then postponed continuously until about 1990, and again shifted gradually to an earlier date since around 1990 (i.e. the blue curve in Figure 3a). Consequently, FFP in the QT region increased gradually until the mid-1950s, then decreased continuously until about 1990, and again increased gradually since the early 1990s (i.e. the green curve in Figure 3a).
The temporal variations in the onset of FFD for both GX and NE regions (i.e. the red curves in Figures 3b and 3c), are as follows: the arrival of LFD in both regions are postponed continuously until the mid- to late-1980s; then, shifted gradually to an earlier date; and consequently, the temporal variation in FFP (i.e. the green curves in Figures 3b and 3c), exhibits fluctuating patterns similar to the temporal variations in FFD.
For both IMGWC and LP regions, the onset of FFD shifted gradually to an earlier date until the mid-to-late 1980s, then postponed continuously since the 1980s (i.e. the red curves in Figures 3d and 3e). The arrival of LFD is postponed gradually until the mid-to-late 1980s, and then shifted continuously to an earlier date since the 1990s (i.e. the blue curves in Figures 3d and 3e). Consequently, FFP decreased gradually until the mid-to-late 1980s, and since then, increased continuously, as indicated by the CDFM curves for FFP (i.e. the green curves in Figures 3d and 3e).
In the HHH region, the onset of FFD postponed gradually until the early 1970s, then shifted continuously to an earlier date (i.e. the red curve in Figure 3f); the arrival of LFD postponed gradually until the mid-to-late 1980s, then shifted to an earlier date (i.e. the blue curve in Figure 3f). Consequently, FFP in the HHH region decreased gradually until the early 1990s and then increased continuously (i.e. the green curve in Figure 3f).
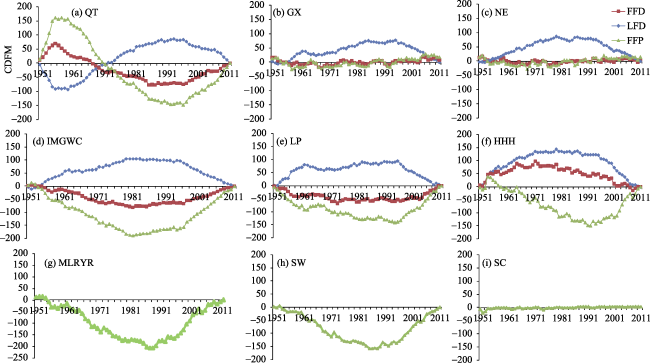
Figure 3 CDFM curves indicating temporal variations in FFD (red), LFD (blue) and FFP (green) in the 9 agricultural regions in China
For the MLRYR, SW and SC regions, temporal variation is characterised only for FFP (Figures 3g, 3h and 3i), due to unstable dates of FFD onset and LFD arrival. In the SC region, the temporal variation in FFP is not obvious, since the frost-free period covers almost the whole year. In both MLRYR and SW regions, FFP decreased gradually until the mid-to-late 1980s, and then increased continuously, with more pronounced changes shown in the MLRYR region.

3.2 Spatial variations of FFD, LFD and FFP across China

The spatial variation of FFP across China and its changes with time are shown in Figure 4, including the spatial variations in the FFP for 1960 (Figure 4a), 1970 (Figure 4b), 1980 (Figure 4c), 1990 (Figure 4d) and 2000 (Figure 4e), and the average of FFP (µFFP) between 1951 and 2012 (Figure 4f). It is clear that the FFP decreases from south to north as latitude increases, and decreases from east to west as altitude increases. The µFFP is over 300 days across the SC region, most parts of the SW region and the southern MLRYR region, and reduced to about 250-300 days for the northern MLRYR region and part of the SW region. The contour line of µFFP = 200 days stretches from the NE to the SW across China: from the northern HHH region, across the LP and SW regions, to the southeastern edge of the QT region, where the contours of µFFP change rapidly. The µFFP for most part of the QT region is under 100 days. Many parts of the QT region, in fact, have permafrost and daily average temperatures as low as 0°C in most part of the year, leading to none or only a few frost-free days. The µFFP for the GX region ranges from about 150 days in the north, due to higher latitude and altitude and lower temperature resulted from the orographic effect of the Tianshan Mountains. The contour line of µFFP = 150 days basically delineates the IMGWC and the NE region into two parts: the µFFP is less than 150 days in the north, due to higher latitude and altitude, and the µFFP is about 150-200 days in the south, due to lower latitude and altitude.
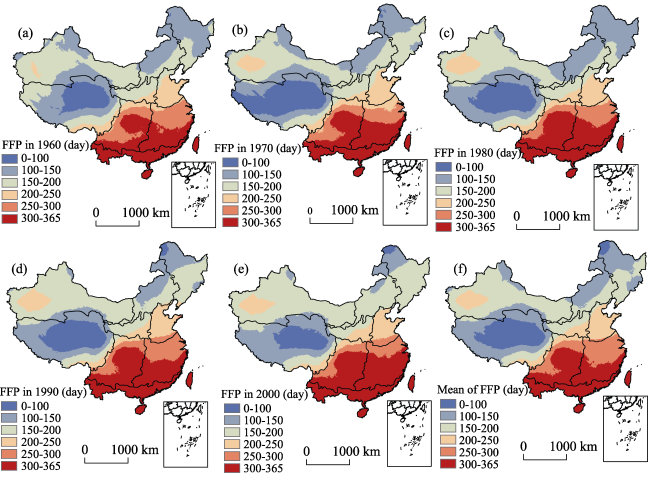
Figure 4 Spatial distributions of FFP in 1960 (a), 1970 (b), 1980 (c), 1990 (d), 2000 (e), and mean FFP (f)
Changes in the spatial distribution of FFP across China through time are revealed through changes in the contours of FFP in the five annual maps (Figures 4a-4e). The annual maps show that the contour line of FFP = 300 days shifted gradually towards the north between 1960 and 1980, and that the area with FFP >300 days expanded noticeably. This trend reversed in 1990. But since 2000, the contour line of FFP = 300 days shifted continuously northward again, resulted in the largest extent of area with FFP>300 days in 2000. In the QT region, the area with FFP<100 days expanded between 1960 and 1970, and then contracted from 1980 to 2000. For the IMGWC and NE regions, noticeable changes are shown for areas bounded by contours of FFP = 100 days and FFP =150 days: the areas contracted in 1970 then expanded markedly and occupied over 80% of the two regions in 1980, and contracted again rapidly and sequentially in 1990 and 2000.
The spatial distributions in the magnitudes of inter-annual changes in FFD, LFD and FFP are shown by means of the thematic maps of sFFD (Figure 5a), sLFD (Figure 5b), and sFFP (Figure 5c), interpolated from their respective station-based values using universal kriging to take local trends into account.
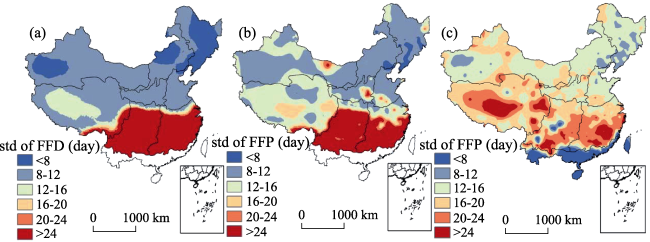
Figure 5 Spatial distributions of the standard deviations of the FFD (a), LFD (b) and FFP (c)
Figures 5a and 5b show that, in general, both sFFD and sLFD decrease from south to north, as latitude increases, and increase from east to west as altitude increases. The spatial distribution of sLFD is more fragmented than that of sFFD. In terms of the dates of FFD and LFD, the northern agricultural regions have more stability while the southern agricultural regions have larger magnitudes of fluctuations, because the southern regions are influenced more by changes in the strength or intensity of the southward moving cold air mass during winters. Most areas have greater stabilities in the date of FFD but greater fluctuations in the date of LFD. The SC region has no values for both sFFD and sLFD, due to the fact that few FFD and LFD records are found at stations in the region.
Figure 5c shows that, in general, sFFP increases with altitude from east to west. With the increase in latitude northward, sFFP shows a general trend of increase in the QT, SW and MLRYR regions, followed by a general trend of decrease in the northern agricultural regions. However, low sFFP are clearly observable in relatively low-lying plains and basins across China. Higher values of sFFP are observed in the QT, SW and MLRYR regions, while the SC region has the lowest sFFP value. These results indicate strong influence of topography on the spatial distributions in the magnitudes of inter-annual changes in FFP, and confirm in principle the findings of Ye and Zhang (2008). The numerical results presented here do not compare exactly in values with previous findings, due to different datasets used. For example, Ye and Zhang (2008) used a dataset covering the 1961-2007 period, but this study uses a dataset covering a longer period between 1951 and 2012.

3.3 Temporal variations in FFD, LFD and FFP across China

3.3.1 Linear trends of changes in FFD, LFD and FFP
The general trends in the spatio-temporal variations in FFD, LFD and FFP from 1951 to 2012 across China, are represented with a set of thematic maps, displaying surfaces of linear trend gradients bt (t = 3, 5, 7, 9) of FFD (Figure 6), LFD (Figure 7) and FFP (Figure 8). These surfaces are interpolated from station-based values using the universal kriging technique. No linear trend gradients bt of FFD, LFD and FFP are estimated for stations in the SC region because few FFD and LFD events have been recorded for most part of the region.
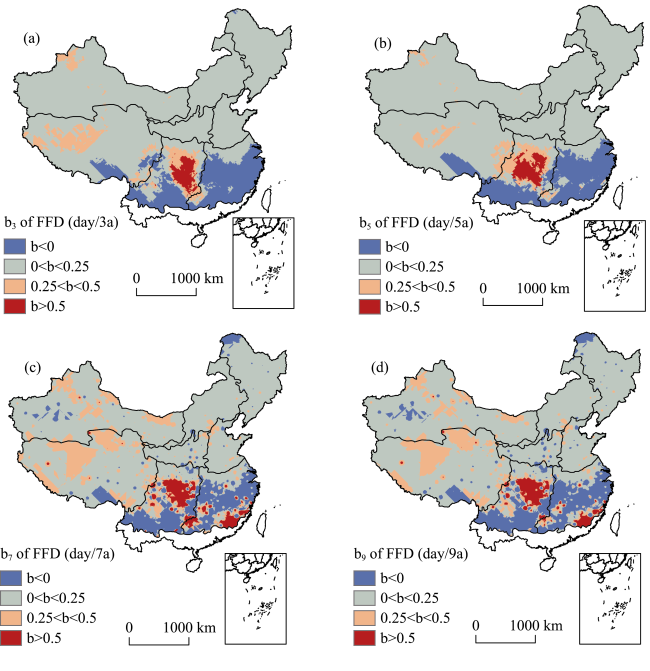
Figure 6 Surfaces of linear trend gradients bt in FFD for the 3-, 5-, 7-, and 9-year moving averages (a, b, c, d)
Figure 6 shows that the linear trend gradients bt for FFD increase as latitude increases from south to north. The linear trend gradients bt for FFD are shown as positives in most parts of the agricultural regions and as negatives only in the SW and MLRYR regions, indicating a general trend of postponing in the onset of FFD for most part of China from 1951 to 2012. The linear trend gradients bt for FFD fall between 0 and 0.25 for over 70% of China most of the times. Areas associated with linear trend gradients of 0<bt<0.25 expand to the largest extent on the 5-year moving average surface (i.e. the b5 surface of FFD), and become relatively fragmented on the b7 and b9 surfaces of FFD, due to the emergence of larger patches associated with linear trend gradients of 0.25<bt<0.5 and smaller patches associated with negative linear trend gradients of bt<0 on these surfaces. Areas associated with higher linear trend gradients of bt>0.5 concentrate in the Sichuan Basin and surrounding areas on the b3 and b5 surfaces of FFD, and expand into the southern MLRYR region on the b7 and b9 surfaces of FFD.
Figure 7 shows that the linear trend gradients bt for LFD basically decrease from south to north as latitude increases. The linear trend gradients bt for FFD are negatives in most part of the agricultural regions and as positives mainly in the SW and MLRYR regions, indicating a general trend of earlier arrival of LFD for most part of China from 1951 to 2012. The linear trend gradients bt for LFD fall between -0.25 and 0 for over 54% of China most of the times. The areas associated with linear trend gradients of -0.25<bt<0 change on different bt surfaces of LFD. From b3 to b5, the area increased markedly in QT and GX regions but decreased noticeably in the SW and MLRYR regions. From b5 to b7, the area decreased in the GX region but expanded in the southern QT region. And from b7 to b9, the area became relatively stabilised in most part of China, with some increase for both LP and HHH regions. Changes in the area associated with linear trend gradients of -0.5<bt<-0.25 are directly opposite to the changing patterns described above for the area associated with linear trend gradients of -0.25<bt<0. In general, as the size of moving average window increased from 3-year through 5-year and 7-year to 9-year, areas associated with linear trend gradients of bt>0 expand, but areas associated with linear trend gradients of bt<-0.5 occur only as small patches on all bt surfaces of LFD.
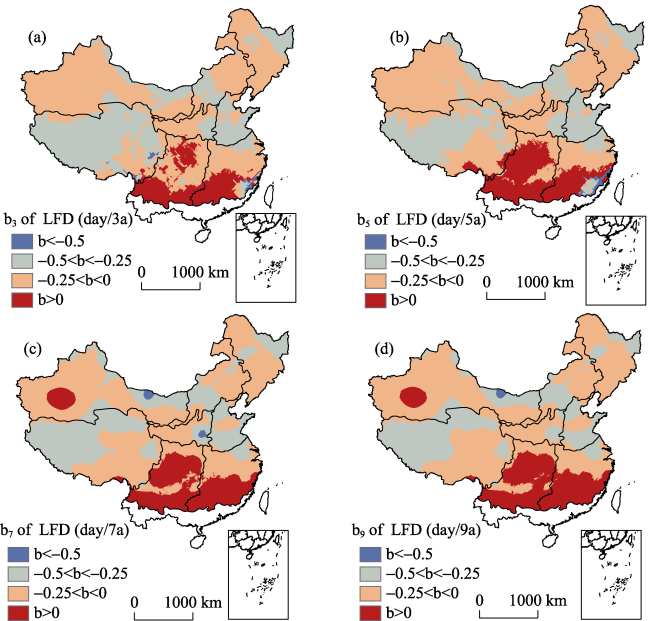
Figure 7 Surfaces of linear trend gradients bt in LFD for the 3-, 5-, 7-, and 9-year moving averages (a, b, c, d)
Figure 8 shows that the linear trend gradients bt for FFP are positives for over 98% of China, and areas associated with linear trend gradients of 0.25<bt<0.5 take the largest part. Areas associated with negative linear trend gradients of bt<0 are scattered throughout the agricultural regions, with larger patches of such area concentrated mainly in the southern GX region. As the size of moving average window increased successively from 3-year through 5-year and 7-year to 9-year, the number of small patches associated with linear trend gradients of bt<0 increases, resulting in the gradual fragmentation of areas associated with linear trend gradients of 0.25<bt<0.5, and areas associated with linear trend gradients of 0<bt<0.25 expand in the LP and SW regions but show little change in the east and north ends of the NE region.
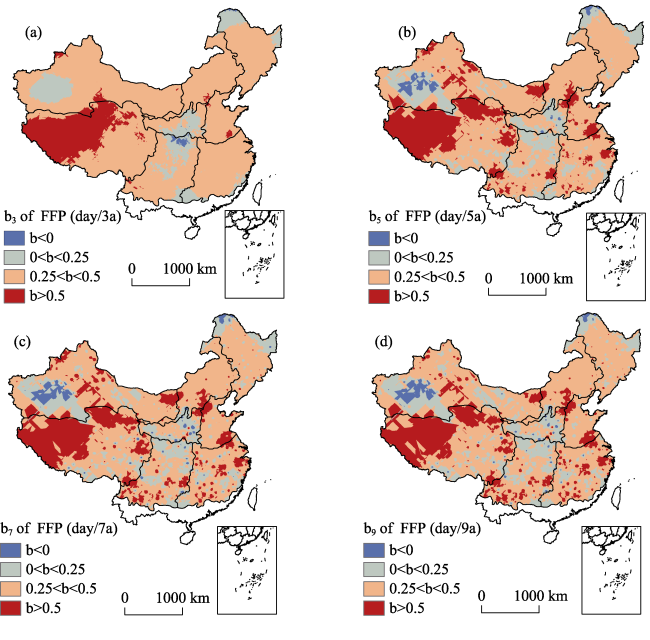
Figure 8 Surfaces of linear trend gradients bt in FFP for the 3-, 5-, 7-, and 9-year moving averages (a, b, c, d)
Table 2 presents a summary of area percentage associated with different linear trend gradients bt for FFD, LFD and FFP, as shown in Figures 5-7. It is clear that the 7-year moving average yields consistently the minimum percentage for the respective dominant types of areas for FFD (0<b<0.25), LFD (-0.25<b<0) and FFP (0.25<b<0.5). Accordingly, the linear trend gradients b7 for FFD, LFD and FFP (Figures 6c, 7c, 8c) are used to further analyse the changes of their distributions throughout the agricultural regions, as well as their interrelationships.
According to the linear trend gradients b7 for FFD, LFD and FFP (as shown in Figures 6c, 7c and 8c, and summarised in Table 3), most of the northern agricultural regions (i.e. NE, IMGWC, LP, and HHH), GX, and QT region exhibit the general trends of later FFD, earlier LFD, and extended FFP, but with some areal differentiations. For example, during the period under consideration, in the northern QT region, FFD is 0.25-0.5 days later every 7 years, LFD is 0.25-0.5 days earlier every 7 years, resulting in a 0.5 days increase of FFP every 7 years; while in the southern QT region, FFD is 0-0.25 days later every 7 years, LFD is 0-0.25 days earlier every 7 years, resulting in 0.25-0.5 days increase of FFP every 7 years. In the southern Xinjiang part of the GX region, and in the northern part of the NE region, there exist some localised patches that have an earlier FFD, later LFD, and shortened FFP. Varying degrees of later FFD and LFD result in extended FFP across both the Sichuan Basin in the SW region and southern part of the MLRYR region. In other parts of the SW and the MLRYR regions, the FFP extended due to varying degrees of earlier FFD and LFD. In summary, the joint effects of later FFD and earlier LFD result in extended FFP in most parts of China, but for some part of China the slightly increased FFP are due to varying degrees of either earlier FFD and LFD, or later FFD and LFD.
Table 2 Distribution of area percentage associated with different linear trend gradients bt for FFD, LFD and FFP, as shown in Figures 6-8
FFD LFD FFP
bt>0 0<bt
<0.25
0.25<
bt<0.5
bt>
0.5
bt>
-0.5
-0.5<bt
<-0.25
-0.2<
bt<0
bt>0 bt>0 0<bt<
0.25
0.25<
bt<0.5
bt>
0.5
b3 13.04 78.22 7.02 1.72 0.41 33.69 56.42 9.49 0.40 11.03 75.64 12.92
b5 13.04 79.79 5.14 2.03 0.47 29.03 57.55 12.94 0.59 16.13 62.94 19.33
b7 11.69 70.43 14.55 3.33 0.44 30.02 54.90 14.64 0.21 18.58 59.93 19.27
b9 13.12 71.29 12.73 2.86 0.25 26.70 57.84 15.21 0.17 19.16 60.83 17.84
Table 3 Distribution of area percentage in different agricultural regions associated with linear trend gradients b7 for FFD, LFD and FFP, as shown in Figures 6c, 7c and 8c
Agricultural region FFD area percentage (%) LFD area percentage (%) FFP area percentage (%)
ID (m) Code b7>0 0<b7<
0.25
0.25<b7
<0.5
b7>
0.5
b7>
-0.5
-0.5<b7
<-0.25
-0.25<
b7<0
b7>0 b7>0 0<b7
<0.25
0.25<b7
<0.5
b7>
0.5
1 QT 4.13 90.72 5.15 0.00 0.00 55.5 43.42 1.08 4.89 45.25 43.47 6.39
2 NE 6.32 93.33 0.35 0.00 0.00 24.26 75.74 0.00 2.38 25.15 72.01 0.46
3 IMGWC 2.11 81.73 16.10 0.06 0.00 31.65 68.35 0.00 6.06 21.13 60.28 12.53
4 GX 1.08 91.99 6.93 0.00 1.10 20.71 71.26 6.93 0.00 4.87 75.63 19.50
5 LP 3.64 67.25 28.74 0.37 3.70 27.24 69.06 0.00 0.25 8.91 44.12 46.72
6 HHH 0.70 97.08 2.22 0.00 0.00 73.38 26.62 0.00 0.21 6.18 86.10 7.51
7 MLRYR 37.63 29.01 14.88 18.48 0.00 9.24 43.55 47.21 1.04 33.01 54.96 10.99
8 SW 48.01 31.89 9.20 10.90 0.00 0.38 31.38 68.24 0.38 19.28 66.97 13.37
China 11.69 70.43 14.55 3.33 0.44 30.02 54.90 14.64 2.21 18.58 59.93 19.28
3.3.2 Spatial distribution of stations with abrupt changes in FFP
Results of Mann-Kendall tests show that intersect points between the UFk and UBk curves are found for all the 659 stations considered in the study, with 341 type 1 stations, 27 type 2 stations, and 291 type 3 stations (Figure 9a). It can be seen that types 1 and 3 stations are found next to each other, widely distributed, with some localised clustering; and that type 2 stations are found mainly in mountainous locations.
Geomorphologically, type 1 stations are more concentrated in the Guanzhong plain in southern LP region, the contiguous expanse of the central-southern HHH region and the northern MLRYR region, the northern HHH region, the neighbourhood of the IMGWC region, and the zones flanking the Tianshan Mountains of the GX region. Type 3 stations are more concentrated in the SW region and the neighbourhood of the MLRYR region. Statistically, as shown in Table 4, over 50% of stations in the HHH, IMGWC, NE, LP and GX regions are type 1 stations, and in the QT, MLRYR and SW regions, the percentage of all type 1 stations exceeds 40%. Over 50% of stations in the MLRYR and SW regions are type 3 stations; the percentage of type 3 stations falls between 35%-45%, in other agricultural regions except the HHH region which has the lowest percentage (28%) of type 3 stations. Figure 9b and Table 4 show that: (1) abrupt changes in FFP occurred in 46 years between 1951 and 2012 at the 341 type 1 stations; (2) fewer stations have abrupt changes in FFP between 1951 and 1970; (3) the number of stations with abrupt changes in FFP increased steadily since 1978, adding more than 5 stations annually; and (4) the number of stations with abrupt changes in FFP peaked in 1994.
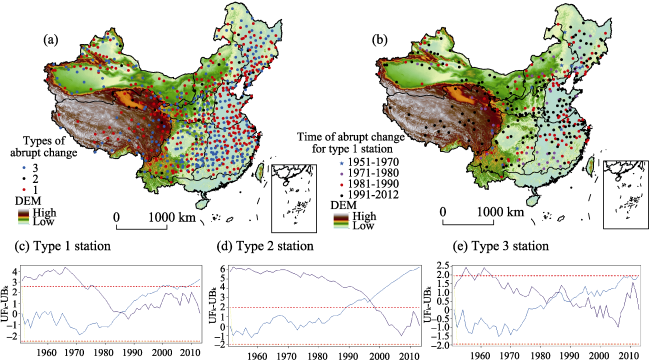
Figure 9 Spatial distribution of stations by types (a) and spatial distribution of type 1 stations by specified time periods (b). For type 1 stations, the UFk and UBk curves have only one intersect point within the confidence region (ua=0.05=±1.96) (c Station ID: 56182). Type 2 stations also have only one intersect point but outside the confidence region (d Station ID: 53463). Type 3 stations have more than one intersect points (e Station ID: 50936).
Table 4 Region-based statistical summary (counts and percentages) of stations by types and by time periods
Agricultural region Station (count) Type 1 station (count)
ID (k) Code Type 1 Type 2 Type 3 Sum 1951-1970 1971-1980 1981-1990 1991-2012
1 QT 35 6 30 71 1 5 2 27
2 NE 51 5 34 90 4 5 17 25
3 IMGWC 33 4 20 57 1 6 12 14
4 GX 45 3 39 87 0 5 12 28
5 LP 27 2 20 49 2 0 5 20
6 HHH 39 3 16 58 0 5 11 23
7 MLRYR 65 0 73 138 1 9 25 30
8 SW 45 3 58 106 3 5 12 25
9 SC 1 1 1 3 0 0 0 1
China 341 27 291 659 12 40 96 193
Figure 9b and Table 4 also show that: (1) during 1951-1970, only about a dozen of stations with abrupt changes in FFP are found scattered across China; (2) during 1971-1980, a total of 40 stations with abrupt changes in FFP are found scattered in all agricultural regions, except the LP and SC regions, with the MLRYR region has the most (9 stations); (3) during 1981-1990, the number of stations with abrupt changes in FFP increased to 96, with the MLRYR region has the most (25 stations) and the QT region has the least (2 stations); and (4) during 1991-2012, the number of stations with abrupt changes in FFP reached the highest (196 stations) with the MLRYR region still has the most (30 stations); and the SC region appeared at the only type 1 station. These stations for abrupt change occurrence are concentrated in a zone extending from neighbourhood regions of the Huaihe catchment in the east, via the LP region, to the GX region in the west.

4 Discussion

This study investigated both the region-based and station-based spatial distributions of FFD, LFD and FFP across China, their temporal trends and interrelationships, with findings useful for guiding region-based management of agricultural production. During the 62-year period (1951-2012), the northern agricultural regions have witnessed steadily later FFD in autumns, earlier LFD in springs, and increasing FFP. These regions also exhibit small magnitude of inter-annual fluctuations in FFD and LFD, and accelerated increase of FFP since 1980.
The findings suggest that earlier dates of crop planting should be adopted in the NE and IMGWC regions, either to increase crop growing period or to reduce likely frost damage on crops at the final stage of growth in early autumn. Many winter varieties of wheat crops are planted over large areas in the HHH region. In early spring, post-jointing winter wheat crops are very susceptible to frost damage. Earlier LFD may reduce this susceptibility, but it is also closely linked with the rise in temperature. Warming trend in climate leads earlier jointing of wheat crops, which are very susceptible to frost damage during cold spells in early spring (Gu et al., 2012; Li et al., 2005).
Changes in FFD, LFD and FFP in most of the LP region are favouring crops with long growing period, increasing the yield or improving the quality of agricultural products. In the GX and QT regions, changes in FFD, LFD and FFP have little impact on agricultural productions that are dominated by animal husbandry. In oasis in the GX region and in the highland barley and rapeseed growing areas above 3800 m in altitude in the QT region, however, crop growing periods are defined by the LFD in spring and FFD in autumn. Later LFD and earlier FFD will increase crop growing period, reduce crops susceptibility to frost damage, increase the percentage of mature grains, and help winter wheat in the river valleys to live safely through the winter.
In the southern agricultural regions, the increase of FFP in different areas may result from three different mechanisms: the synergistic impact of later FFD and earlier LFD, much later FFD than LFD, and much earlier LFD than FFD. The increased FFP and associated increase in heat resources can be used to adjust the spatial arrangement of crop growing, e.g. pushing the boundary of some crops toward the north, or adopting crop varieties with longer growing periods. We should pay attention to possible meteorological hazards due to the irregular occurrence of frost when FFP exhibits a trend of increase. For example, during periods of higher dekad (ten days) or monthly mean temperatures, 3 consecutive daily minimum temperatures lower than 5˚C could result in cold damage in the southern regions, let alone the occurrence of frosts when daily minimum temperatures are lower than 0˚C. Therefore, we should be prudent when making such adjustments in crop growth in southern agricultural regions to minimize the negative impact of meteorological hazards.
Some aspects of the study have been identified for improvement in future studies. First, the dataset used in the study should be improved. This study is based on daily minimum temperature recorded at 823 meteorological stations across China. We identified stations with incomplete records for the 62 years and excluded them from further analysis. We calculated FFD, LFD and FFP for each of the remaining stations, converted the FFD and LFD into Julian dates, and analysed their changing trends. The direct exclusion of stations with incomplete records is not desirable since it reduced the density of data points in space. One way to improve is to estimate the missing records using neighbouring observations in space and/or time. The use of Julian calendar for dates of FFD and LFD can result in incorrect FFP values and pseudo changing trends, especially in the southern agricultural regions. The dates for FFD and LFD in the southern agricultural regions may fluctuate between December and January. When transformed using the Julian dates, shorter interval between actual dates of FFD and LFD may appear much longer, affecting the outcome of analysis. One way to reduce this effect is to use, for example, day one in the warmest or coldest month as the first day of the year in transforming dates for FFD and LFD.
Second, the characterisation of changes in FFD, LFD and FFP may be improved. In this study, a few key time snapshots are used to analyse the changing spatial distribution of FFP across China. In the future, we may overlay annual spatial distributions to identify and delineate both core areas where climate conditions are relatively stable over time and peripheral zones where climate conditions exhibit more pronounced fluctuations. We probably should pay more attention to these more dynamic peripheral zones when studying agricultural adaptation under changing climate. In addition, changes of climate variables over time (e.g. during the 62 years considered in this study) may well be non-linear, with some periodic or rythmic fluctuations. In this study, we used moving average smoothing to minimise the impact of extreme climate events, and the linear fitting technique adopted is inadequate for uncovering more characteristics of changes in FFD, LFD and FFP. Finally, Geomorphology imposes obvious influence on regional changes of climate variables. This study only applied simple overlay of station-based changes in FFP with a DEM. Clearly, geomorphological influence on the distributions and changes in FFD, LFD and FFP deserve more in depth analysis in the future.

5 Conclusions

This study examined daily minimum temperatures for 823 national-level meteorological stations and determined annual station-specific dates of FFD and LFD, and lengths of FFP from 1951 to 2012, computed region-specific values of FFD, LFD and FFP, including the annual regional averages and cumulative deviations from the means, for the 9 agricultural regions; estimated the gradients of linear regression for station-specific 3-, 5-, 7-, and 9-year moving averages of FFD, LFD and FFP, and mapped their spatial variations across China; assessed station-specific time series of FFP and detected times of abrupt changes.
The results revealed the following characteristics of the spatio-temporal variations in FFD, LFD and FFP:
(1) In general, at both the station level and the regional level, the FFP across China decreases with the increase of latitude from south to north, and with the increase of altitude from east to west.
(2) The station-level standard deviations of FFD, LFD and FFP decrease with the increase of latitude from south to north, but increase with the increase of altitude from east to west, indicating the inter-annual fluctuations in FFD, LFD and FFP in the south and west agricultural regions are greater than that in the north and east agricultural regions.
(3) At the regional level, temporal changes in the length of FFP from 1951 to 2012, as indicated by the CDFM curves are relatively small in both the low latitude region (SC) and the high latitude regions (GX and NE), but for the mid-latitude regions (IMGWC, LP, HHH, MLRYR, and SW), the length of FFP decreases till the 1980s and then increases. Influenced by high altitudes, the QT region shows a unique pattern of changes in the length of FFP, increases till the 1960s, then decreases till the 1980s, and then increases again.
(4) In general, over 80% of China exhibits a later FFD and earlier LFD, and consequently, increased FFP. However, there exist some regional differences. For instance, in the north and east regions, temporal variations in FFD, LFD and FFP exhibit higher magnitudes than that in the southern and western agricultural regions. In many agricultural regions, NE, GX, IMGWC, LP, HHH, and some areas in the SW and MLRYR regions, the increase in FFP is due to the later FFD and earlier LFD. But for other areas in the SW and MLRYR regions, the increase in FFP is resulted either from much delayed FFD and slightly delayed LFD, or from slightly earlier FFD and much earlier LFD.
(5) Among the 659 station-specific time series of FFP examined with the Mann-Kendall test, 341 stations (52%), located mainly in the IMGWC, HHH, QT, and GX regions, and the central-western part of the NE, have one identifiable and significant abrupt change detected. And at the 341 stations with identified abrupt changes, most (57%) abrupt changes occurred during 1991-2012, followed by the periods of 1981-1990 (28%) and 1971-1980 (12%), and less than 4% occurred during 1951-1970.
(6) The improved understanding on the characteristic spatio-temporal variations of FFD, LFD and FFP, achieved through this study, would provide important guidance to regional agricultural practices. The increased FFP may help to extend crop growing period, increase crop yield, improve agricultural products quality, and reduce crops susceptibility to frost damage in NE, IMGWC and LP regions, in the oasis of GX region and the highland barley growing areas in QT region. For the HHH region, earlier arrival of LFD may help to reduce the susceptibility of winter wheat crops to frost damage, but the warming trend in climate change may lead to earlier jointing of wheat crops, which can be very susceptible to frost damage during cold spells in early spring. In the southern regions, possible meteorological hazards may result from the irregular occurrence of frost even with the increase trend of FFP.

The authors have declared that no competing interests exist.

[1]
Bai Q F, Li X M, Zhu L, 2013. The changes of the frost-free periods from 1961 to 2010 and its impact on apple industry in Shanxi province.Journal of Arid Land Resources and Environment, 27(8): 65-70. (in Chinese)Using the Daily minimum temperature data from 1961 to 2010 of 96 weather stations in Shaanxi province,we calculated the first frost dates,last frost dates and frost-free periods of 96 weather stations from 1961 to 2010,and analyzed its distribution characteristics and inter-annual changes.The results showed that the contours of the first frost dates,last frost dates and frost-free periods was shown latitude distribution in Northern Shaanxi and showed latitude distribution in Guanzhong area and southern Shaanxi.During the 50 years,the difference of average earliest and latest first frost date of 96 weather stations was 44 days;the difference of average earliest and latest last frost date of 96 weather stations was 49 days;the difference of average longest and shortest frost-free periods of 96 weather stations was 68 days;the average first frost date of 96 weather stations showed postponed trend and about postponed 1.4 days every 10 years;the average last frost date showed advanced trend and about advanced 1.7 days every 10 years;the average frost-free periods showed increased trend and about increased 3.1 days every 10 years.Finally we analyzed the apple frost damage risk of some apple's base counties of Shaanxi according to the theory of risk analysis and got its spatial distribution feature.The conclusion has a reference on guiding and launching disaster prevention and reduction work accurately.

[2]
Chen S Y, Zhang Y X, Lou W P,et al., 2013. Changes in the first frost date from 1961 to 2009 in Northwest China.Resources Science, 35(1): 165-172. (in Chinese)Using daily surface minimum air temperature data from 135 observational stations from 1961 to 2009 in northwest China and NCEP/NCAR reanalysis data, we examined changes in the date of first frost over time. We found that first frost starts in southern Gansu and south Shanxi in the first 10 days in November and in southern Xinjiang in mid-October. On the Qinghai plateau first frost appears in late August. The first frost period has poor stability, especially in northern Xinjiang and the Qinghai plateau. The average first frost date occurred later at a rate of 1.8 d/10a, and 9 days for the whole area. There was an abrupt change in patterns in 1986. For 85% of stations, the date of first frost was postponed, and majority were postponed at a speed of(2~4)d/10a. Since 1980, 50% of stations have a late first frost date, especially in the last 10 years where a late first frost date was found at 90% of stations. The subtropical high and polar vortex affect first frost across northwestern China, the subtropical high has a positive correlation and the polar vortex is has negative correlation. The 500 hPa composite analysis indicated, in first frost late years the East Asian trough is week, the Western Pacific vice-high in the west strong, and the Mid-northern Asian is the prevalent zonal circulation. In first frost early years, the Ukraine mountain high ridge is strong, the East Asian trough is deep, the Western Pacific vice-high easterly is weak, and the Mid-northern Asian is the prevalent radial circulation. We suppose that a changing polar vortex and high-pressure results in the date of first frost being postponed; climate warming is also contributing. Frost is a by-product of cold air and climate warming causes increased vice-high and a decreasing vortex, and prevents cold air moving south.

[3]
Dai J H, Wang H J, Ge Q S, 2013. Changes of spring frost risks during the flowering period of woody plants in temperate monsoon area of China over the past 50 years.Acta Geographica Sinica, 68(5): 593-601. (in Chinese)The temperate monsoon area of China is an important agricultural region but late spring frosts have frequently caused great damage to plants there.Based on phenological data derived from the Chinese Phenological Observation Network(CPON),corresponding meteorological data from 12 study sites and phenological modeling,changes in flowering times of multiple woody plants and the frequency of frost occurrence were analyzed.Through these analyses,frost risk during the flowering period at each site was estimated.Results of these estimates suggested that first flowering dates(FFD) in the study area advanced significantly from 1963 to 2009 at average rates of-1.52 days decade-1 in Northeast China(P 0.01) and-2.22 days decade-1(P 0.01) in North China.During this same period,the number of frost days in spring decreased and the last frost days(LFD) advanced across the study area.Considering both flowering phenology and occurrence of frost,the frost risk index,which measures the percentage of species exposed to frost during the flowering period in spring,showed a decreasing trend of-0.37% decade-1(insignificant) in Northeast China and-1.80% decade-1(P 0.01) in North China.The results indicated the frost risk in the study region decreased over the past half century,and showed remarkable regional difference.These conclusions provide important information for agriculture and forestry managers in devising frost protection schemes.

[4]
Du J, Shi L, Yuan L, 2013. Responses of climatic change on the frost days in main agricultural area of Tibet from 1961 to 2010.Chinese Journal of Agrometeorology, 34(3): 264-271. (in Chinese)According to the frost index defined by the minimum air temperature 鈮0鈩,the climatic change of the anomalous first frost date,last frost date,frostless period and frost days were analyzed in this paper,using the daily minimum temperature of 9 stations at main agricultural area of Tibet from 1961 to 2010 and modern statistical diagnosis methods,such as linear trend analysis,accumulative anomaly,signal noise ratio and rescaled range analysis(R/S analysis).The results showed that,(1)in recent 50 years,the first frost date appeared late,the last frost date ended early,so that the frostless period was extended significantly in the part stations,while decrease trend of the frost days was detected with a rate of 1.9-9.6d/10y in all stations at main agricultural area of Tibet.(2) From 1980s to 2000s,because the first frost date appeared late and the last frost date ended early made frostless period prolong,and the frost days had a decreasing tendency,especially in the 2000s.(3) In addition,it was found that the frequency of anomalous early first frost date was 1 to 5 times at main agricultural area of Tibet,especially the maximum in Bome,meanwhile the frequency of anomalous late ending frost date was 1 to 6 times,the most in Bome and occurred in the 1960s.Frequency of anomalous short frostless period was 1 to 7 times,it was the most in Bome.Furthermore,the frequency of anomalous less frost days was 2 to 10 times and occurred in the 2000s,and the anomalous more frost days occurred in the 1960s with a frequency of 1 to 7 times.(4)It was found with abrupt change test that frost days in Lhasa,last frost date,frostless period and frost days in Tesdang,frostless period and frost days in Nagarze had abrupt change,which happened respectively in 1992,1991 and 1998.(5)The results of R/S analysis showed that changes of last frost date had the persistence with a Hurst index of larger than 0.5 in the part stations,which indicates that it will assume continuous earlier in future,especially in Tesdang.Also the Hurst index of frost days was larger than 0.5 in all stations,and it will assume continuous decrease in future.

[5]
Du L, Zhao G X, Yang L M, 2014. The variation characteristics analysis of frost in Chongqing City in recent 40 years. Chinese Agricultural Science Bulletin, 30(17): 279-283. (in Chinese)In order to know the feature of frost event in Chongqing under the back of global warming, andprovide more reference for optimizing agricultural planting structure, the variation characteristics of frost inChongqing was analyzed by using surface observe data day by day of Chengkou meteorological station, andapplying statistical method. The results showed that:(1) In recent 40 years, the first frost and the last frost alsooccurred later, the rate of the first frost was faster more than the last frost. The frost-free period present longertrend slowly. Since 21 century, the later trend of the first frost and were increasing, while the frost-free periodwas decreasing.(2) The change of intensity of the frost was gradual, but the last frost was stronger more thanthe first frost. Since 21 century, no matter what the first frost nor the last frost, its intensity became weaken.(3)In recent 40 year, the first frost, the last frost, and the frost-free period all showed apparent decadal andperiodic change characteristics. The first frost had about 30 years periodic, while the last frost has about 23years periodic. The trend of deviation from normal of the first frost was at first increasing and then decreasing,but the last frost was decreasing continuously. Since 21 century, the rate of extreme later of the first frost wasincreasing.(4) As a whole, the number of abnormal year of the first frost was more than the last frost. But since21 century, abnormal degree became more serious. So only know regular of the frost, improving dulyagricultural planting structure, people could improvethequalityof agricultureindustry.

[6]
Edmar I T, Guenther F, Harrij V V,et al., 2013. Global hot-spots of heat stress on agricultural crops due to climate change.Agriculture and Forest Meteorology, 170: 206-215.The productivity of important agricultural crops is drastically reduced when they experience short episodes of high temperatures during the reproductive period. Crop heat stress was acknowledged in the IPCC 4th Assessment Report as an important threat to global food supply. We produce a first spatial assessment of heat stress risk at a global level for four key crops, wheat, maize, rice and soybean, using the FAO/IIASA Global Agro-Ecological Zones Model (GAEZ). A high risk of yield damage was found for continental lands at high latitudes, particularly in the Northern Hemisphere between 40 and 60°N. Central and Eastern Asia, Central North America and the Northern part of the Indian subcontinent have large suitable cropping areas under heat stress risk. Globally, this ranged from less than 502Mha of suitable lands for maize for the baseline climate (1971–2000) to more than 12002Mha for wetland rice for a future climate change condition (2071–2100) assuming the A1B emission scenario. For most crops and regions, the intensity, frequency and relative damage due to heat stress increased from the baseline to the A1B scenario. However for wheat and rice crops, GAEZ selection of different crop types and sowing dates in response to A1B seasonal climate caused a reduction in heat stress impacts in some regions, which suggests that adaptive measures considering these management options may partially mitigate heat stress at local level. Our results indicate that temperate and sub-tropical agricultural areas might bear substantial crop yield losses due to extreme temperature episodes and they highlight the need to develop adaptation strategies and agricultural policies able to mitigate heat stress impacts on global food supply.

DOI

[7]
Editorial Committee of the National Agricultural Zoning Committee ‘Comprehensive Agricultural Regionalization in China’ (NAZC), 1981. Comprehensive Agricultural Regionalization in China. Beijing: Agricultural Press. (in Chinese)

[8]
Fu C B, Wang Q, 1992. The definition and detection of the abrupt climatic change.Scientia Atmospherica Sinica, 16(4): 482-493. (in Chinese)This is part of the review on study of abrupt climatic change, addressing mainly the definition of catastrophe and abrupt change of climate, the detecting methods of abrupt changes of various types, such as changes in mean, changes in variability, transit jump and seesaw jump.Finally the Mann-Kendall rank statistical test is applied to detect the abrupt change in 1920's on global scale.

[9]
Goossens C, Berger A.1986. Annual and seasonal climatic variations over the Northern Hemisphere and Europe during the last century.Annales Geophysicae, 4(4): 385-400.Provides a method which allows the detection of an abrupt climatic change and which localizes approximately the date of its beginning. The identification of such a change is made by means of a non-parametric test, the Mann-Kendall rank statistic. The efficiency of this test has been compared to the efficiency of other usual techniques used for detecting a change and the reliability of the localization of the change has been analysed using a Monte-Carlo technique. The data used are the long-term series of average northern hemisphere temperature, the instrumental records of temperature and precipitation for western european countries and the long-term european reconstructed series. Most of the temperature series exhibit a general long-term warming which supports the reality of the early 20th century northern hemisphere warming, as noted by many authors. However, this study shows that an abrupt change towards a warming occurred generally around 1900+/-25 years and that we are still experiencing this longterm warm climate.

DOI

[10]
Gu W L, Ji X J, Zhu Y Y,et al., 2012. Risk regionalization of winter wheat late freezing injury in Henan province.Journal of Catastrophology, 27(3): 39-44. (in Chinese)Late frost injury of winter wheat that occurs after jointing stage is one of the dominating agrometeorological disasters in Henan province.Frost damage reduces winter wheat yield and threatens the food security.More attentions need to be paid to the spatial distribution of frost injury risk for both scientists and decision-makers who concern about winter wheat production in this area.Based on the data of winter wheat growing area,Digital Elevation Model(DEM) and daily minimum temperature from 111 meteorological stations in the period between 1971 and 2010,the days of mild frost,moderate frost and severe frost are calculated according to the frost injury disaster indices value derived from the minimum temperature after jointing stage and the days after jointing stage and the criteria of frost disaster grades by use of daily minimum temperature interpolation method.The risk assessment index was represented of the frost days and the actual winter wheat growing area percentage.The spatial distribution characteristics of frost injury disaster days and its risk were analyzed.The results showed as follows.During 1971-2010,more days of mild frost were mainly distributed in northern regions,eastern regions and some western hilly and mountainous regions.While more days of moderate and severe frost in western hilly and mountainous regions,and the maximum days of frost was 67 d,48 d and 120 d,respectively.The north of Zhumadian region and Nanyang basin except Zhengzhou region had a higher risk of mild frost disaster,the northern part and western hilly and mountainous regions had a higher risk of moderate frost disaster,and western hilly and mountainous region were more vulnerable to the severe frost disaster.The risk indexes of mild,moderate and severe frost disaster were 28%,18% and 17%,respectively.For the spatial distribution of late frost injury disaster days and risk,the effected area for mild frost was the largest,followed by moderate frost,and severe frost.The eastern,northern and western parts in Henan Province were mainly winter wheat late freezing injury prevention regions.Among the three levels,the mild frost damage should be paid more concentration.

[11]
Han R Q, Li W J, Ai W X,et al., 2010. The climatic variability and influence of first frost dates in Northern China.Acta Geographica Sinica, 65(5): 525-532. (in Chinese)At present, there is no uniform standard of forecasting system and serving products for first-frost date forecasting studies and operations in China's meteorological departments in spite of agricultural autumn harvests depending greatly on the first frost occurring earlier or later in northern China, which restrained the development of prediction studies and operations on the first-frost dates. Therefore the study aims at the above problems and analyzes 3 aspects of them. The first is about the discrepancy analyses of the three kinds of first frost date data, in which two of them are defined by surface ground temperature and air temperature from instrument shelter, respectively, and the other data are from observing first frost dates. And then the study enlarges the number of the representative stations in northern China (north of 30oN) of National Climate Center operation from 65 in the past to 233 at present for improving the spatial resolving power of the prediction products. The second is the analyses of the climate features of the first frost dates based on the aforementioned surface ground temperature data of the 233 stations from 1961 to 2008. Finally, the study shows that it is outstanding for the significant effects of the climatic variability of the first frost dates on single outputs of rice and maize separately in Heilongjiang Province, as long as without the continuing and lasting cold days before the autumn, whereas the effects from anomalous air temperature before the autumn, for example from cool summer, are dominant.

DOI

[12]
Hu Q, Pan X B, Zhang D, 2015. Variation of temperature and frost-free period in different time scales in Northeast China.Chinese Journal of Agrometeorology, 36(1): 1-8. (in Chinese)Based on observed data from 71 meteorological stations in Northeast China from 1961 to 2012,the variation of temperature and frost-free period in decade scale,annual scale,month scale,and ten-day scale,were analyzed. The results showed that both contour lines of temperature and frost-free period moved northward in decade scale,and maximum value occurred in 1980-1999. Compared with 1961-1979,contour line of 3℃ temperature moved northward about 1 latitude,and the area of temperature over 3℃ increased 1. 14 × 105km2,and contour line of 155 d frost-free moved northward about2-4 latitudes,and the area of frost-free 155 d increased 2. 02 × 105km2. The average temperature increasing rate in Northeast China was 0. 30℃·10y-1,and maximum increasing in winter at the rate of 0. 47℃·10y-1. The frost-free period increasing rate was 3. 5d·10y-1,and first/latest frost date delayed/advanced 8. 1d and 9. 8d,respectively. The temperature increasing rate in February was 0. 8℃·10y-1,which was key factor to large temperature increasing in winter. In which the final 10 days in February temperature increasing rate was 1. 00℃·10y-1. Climate warming might have some impacts on agricultural production and agro-climatic zone in Northeast China,the results could provide references for heat resources utilization and crop cultivation under climate change.

[13]
IPCC, 2014. Climate Change 2014: Impact, Adaptation and Vulnerability [M/OL]. Cambridge: Cambridge University Press (in press). http://www.ipcc-wg2.gov/.

[14]
Kendall M A, Stuart A, 1967. The Advanced Theory of Statistics. 2nd ed. Londres: Charles Griffin.

[15]
Labaciren, Suolangjiacuo, Baima, 2014. Spatial and temporal distribution of frost days over Tibet from 1981 to 2010.Acta Geographica Sinica, 69(5): 690-696. (in Chinese)The annual and decadal variations, anomalous and abrupt change of the frost days are analyzed in this paper, using the daily minimum temperature of 38 stations over Tibet from 1981 to 2010 and modern statistical diagnosis methods, such as linear trend analysis, accumulative anomaly, signal noise ratio and rescaled range analysis (R/S analysis). The results showed that, (1) in recent 30 years, the frost days decreased with a rate of (3.3-14.6) d/ 10a (P<0.01, at 37 stations), and the damping of frost days increased with increasing altitude. (2) In terms of decadal variations, the frost days presented a negative anomaly in the 1980s and a positive anomaly in the 2000s, the positive anomaly range of frost days was larger than the negative anomaly in the 1990s. (3) It was found with abrupt change test that frost days at eight stations had abrupt change, which occurred in the 1990s with the year 1997 having the largest number. (4) The results of R/S analysis showed that changes of frost days had the persistence with a Hurst index larger than 0.5 at most of the stations, and indicated that it will assume a continuous decrease in future and the decreasing rate will became larger. (5) In addition, it was found that the frequency of anomalous (more than normal) frost days was 0 to 3 times and occurred mainly in the 1980s, while the anomalous (less than normal) frost days occurred in the 2000s with a frequency of 0 to 4 times. There is little correlation between altitude (or latitude, longitude) and anomalous more frost days frequency, while altitude has negative correlation with anomalous less frost days frequency.

DOI

[16]
Li F, Zhang J X, Wu Y L,et al., 2013. Spatial and temporal distribution and its impact factors of the last frost over Shanxi Province from 1961 to 2010.Acta Geographica Sinica, 68(11): 1472-1480. (in Chinese)Based on each day's minimum ground temperature data of 62 meteorological stations in Shanxi from 1961 to 2010,the spatial and temporal distribution characteristics of the province's last frost dates are analyzed.The results show:(1) Shanxi's average last frost date is April 12,the last frost date of the southern part is generally earlier than that of the north,but for a particular site,"early" or "late" of the last frost date also depends on its topography and location.The average last frost date has obvious positive correlations with altitude and latitude,and the correlation with altitude is closer than that with latitude.(2) M-K mutation test shows that the last frost date of most meteorological stations had obvious mutations from 1975 to 1996,and that the mutation year has negative correlations with altitude and latitude,and that the correlation with latitude is closer than that with altitude.(3) The changing trend of last frost dates has apparent regional difference,the large advancing scope region is located in the central-western and southern parts,while the large delaying scope region is observed in the northwestern and central-eastern parts.The changing trend has negative correlations with altitude and latitude,and the correlation with altitude is closer than that with latitude.(4) Probability of the normal last frost in this province is 54%-74%,and the maximum probability appears in the southeastern and northern-central parts.Probability of the later last frost in Shanxi is 2%-22%,and the maximum probability appears in the northern and southeastern parts of the province.Probability of the latest last frost in Shanxi is 14%-36%,and the larger probability area is located in the northern-central and central-western parts.(5) Altitude has negative correlation with later last frost probability,and latitude has positive correlation with the latest last frost probability,and there is little correlation between altitude(or latitude) and normal last frost probability.Latitude has greater impacts on all degrees' last frost probability than altitude.

DOI

[17]
Li M S, Wang D L, Zhong X L,et al., 2005. Current situation and prospect of research on frost of winter wheat.Journal of Natural Disasters, 14(4): 72-78. (in Chinese)Recently frost of winter wheat tends to be more frequent in the major winter wheat production area in China.Based on the results of research at home and abroad,this article investigated the current situation of research on frost of winter wheat,the trends of comprehensive frost-resisting technology and the frost research in the future.

[18]
Li S, Shen Y J, 2013. Impact of climate warming on temperature and heat resource in arid Northwest China.Chinese Journal of Eco-Agriculture, 21(2): 227-235. (in Chinese)Climate change has changed agro-climatic resources,especially the degree of heat and the spatio-temporal distributions of resources.Against global warming,temperature has increased in arid Northwest China.Also arid Northwest China has been most influenced by climate change.Using daily meteorological data from 67 stations in arid Northwest China,this paper analyzed change patterns and trends of temperature,accumulated temperature,frost over the period for 1961—2011.The results showed that in the arid northwest region,temperature increased at 0.33 ℃.10a 1,higher than the national average.The warming trend in Northern Xinjiang was larger than in other areas and winter season having the highest yearly variation in temperature.Accumulated temperature higher than 0 ℃ and 10 ℃ increased by 67.8 ℃.10a 1 and 68.8 ℃.10a 1.Accumulated temperature duration also increased over the 1961—2011 period.The increased days with ≥0 ℃ and ≥10 ℃ accumulated temperature were mainly caused by the delayed ending dates and the earlier initial dates,respectively.In the study area,there was delayed first frost,earlier last frost and lengthened frost free period.The rates of change in the first and last frost were 2 d.10a 1 and 1.4 d.10a 1,respectively.In the region,the longer frost-free period was mainly driven by delayed first frost.Inter-annual fluctuation in the first frost was less than that in the last frost in the arid Northwest China.The last frost date was more or less 10 days later than it used to be;even though climate warming caused no change in frost condition.Mostly,the last date of ≥10 ℃ accumulated temperature occurred earlier than the first frost date.

DOI

[19]
Li S K, Hou G L, Ouyang Hai et al., 1988. Agricultural Climate Resources and Agricultural Climate Zoning of China. Beijing: Science Press. (in Chinese)

[20]
Mann H. B.1945. Non-parametric tests against trend.Econometrica, 3(13): 245-259.A family of two-sample non-parametric tests is described, in which only the tails of the distributions are used. Some are presented as tests of dispersion and some as tests of location. Critical values for certain of the tests are given for large samples. The power of the tests is discussed, and fresh results are given for a test of dispersion against rectangular alternatives.

DOI

[21]
Pan S K, Zhang M J, Wang B L,et al., 2013 Changes of the first frost dates, last frost dates and duration of frost-free season in Xinjiang during the period of 1960-2011.Arid Zone Research, 30(4): 735-742. (in Chinese)In this paper,the first frost date,last frost date and duration of frost-free season as well as their change trends were analyzed using the linear trend estimation,anomaly analysis and five-year moving average based on the daily minimum temperature data observed by 51 meteorological stations in Xinjiang during the period from 1960 to 2011.The results showed that the average first frost date was postponed by 11 days,the average last frost date was moved up by 7 days,and the duration of frost-free season was extended by 17 days.The first frost dates,last frost dates and durations of frost-free season in north Xinjiang,south Xinjiang and the Tianshan Mountains were consistent with those in whole Xinjiang,but the change extent was not different.Their variation was the most significant in the Tianshan Mountains,and then in north Xinjiang and south Xinjiang.The first frost date,last frost date and duration of frost-free season were closely related to the geographical and temperature factors.The first frost date occurred earlier,the last frost date later,and the duration of frost-free season became shorter along with the increase of latitude and altitude.Along with the temperature increasing,however,the first frost date became later,the last frost date earlier,and the duration of frost-free season longer.The effect of minimum temperature was higher than that of average temperature and maximum temperature.

[22]
Qian B D, Gameda S, Zhang X B,et al., 2012. Changing growing season observed in Canada.Climatic Change, 112: 339-353.It is theoretically interesting for climate change detection and practically important for agricultural producers to know whether climate change has influenced agroclimatic conditions and, if so, what the potential impacts are. We present analyses on statistical differences in means and variances of agroclimatic indices between three 30-year periods in the 20th century (i.e., 1911–1940, 1941–1970 and 1971–2000). We found many occurrences of statistically significant changes in means between pairs of the three 30-year periods. The findings consistently support agroclimatic trends identified from trend analysis as an earlier growing season start and an earlier end to spring frost (SF), together with an extended growing season, more frost-free days (FFD) and more available heat units were often found in the later 30-year periods as compared to the earlier ones. In addition, this study provides more detailed quantitative information than the trend signals for the practical interests of agricultural applications. Significant changes were detected for SF and FFD at a much larger percentage of stations between the latter two 30-year periods (1941–1970 vs. 1971–2000) as compared to the earlier two periods (1911–1940 vs. 1941–1970). In contrast, changes in variances of the selected agroclimatic indices were less evident than changes in their means, based on the percentage of stations showing significant differences. We also present new climate averages of the selected agroclimatic indices that can be useful for agricultural planning and management.

DOI

[23]
Qian J X, Zhang X, Zhang J X,et al., 2010. The changing trends of the first and last frost dates over Shanxi province for the past 40 years.Acta Geographica Sinica, 65(7): 802-808. (in Chinese)Based on the frost date data of 52 meteorological stations over Shanxi Province from 1970 to 2009, the basic characteristics of the first and last frost dates and their changing trends were analyzed in this paper using linear trend estimation method, cumulative filter method and non-parametric statistical test method respectively, and the abrupt changing feature of the frost dates was also analyzed with Mann-Kendall method. The results show that the frost dates and frost-free period have obvious spatial and temporal changing features. Along with the latitude moving northward and the altitude rising high, the first frost appears earlier, the last frost occurs later, and the frost-free period becomes shorter. With the time changing over the past 40 years, the first frost event occurs later and the frost-free period becomes longer, while the last frost date fluctuates from year to year. For the abrupt changing feature, they all have one obvious abrupt change over the past 40 years. The abrupt change of the first frost date appears in 2000, while the abrupt changes of the last frost date and the frost-free period are detected in 1997. For the spatial distribution of their changing trend, the area in which the first frost date is postponed significantly includes the east of Jinzhong city, the north of L眉liang city, the west of Xinzhou city, the south of Yuncheng city, the northwest of Linfen city and the southern part of Datong city; the area in which the last frost date appears obviously earlier includes the east mountainous region of Jinzhong city, the eastern part of L眉liang Mountains and the western part of Xinzhou city; the area in which the frost-free period extends obviously includes the region near the Yellow River, the central-eastern part of the province and the south of Yuncheng city.

DOI

[24]
Ramirez-Villegas J, Jarvis A, Läderach P, 2013. Empirical approaches for assessing impacts of climate change on agriculture: The EcoCrop model and a case study with grain sorghum.Agricultural and Forest Meteorology, 170: 67-78.Climate has been changing in the last three decades and will continue changing regardless of any mitigation strategy. Agriculture is a climate-dependent activity and hence is highly sensitive to climatic changes and climate variability. Nevertheless, there is a knowledge gap when agricultural researchers intend to assess the production of minor crops for which data or models are not available. Therefore, we integrated the current expert knowledge reported in the FAO-EcoCrop database, with the basic mechanistic model (also named EcoCrop), originally developed by Hijmans et al. (2001). We further developed the model, providing calibration and evaluation procedures. To that aim, we used sorghum (Sorghum bicolor Moench) as a case study and both calibrated EcoCrop for the sorghum crop and analyzed the impacts of the SRES-A1B 2030s climate on sorghum climatic suitability. The model performed well, with a high true positive rate (TPR) and a low false negative rate (FNR) under present conditions when assessed against national and subnational agricultural statistics (min TPR=0.967, max FNR=0.026). The model predicted high sorghum climatic suitability in areas where it grows optimally and matched the sorghum geographic distribution fairly well. Negative impacts were predicted by 2030s. Vulnerabilities in countries where sorghum cultivation is already marginal are likely (with a high degree of certainty): the western Sahel region, southern Africa, northern India, and the western coast of India are particularly vulnerable. We highlight the considerable opportunity of using EcoCrop to assess global food security issues, broad climatic constraints and regional crop-suitability shifts in the context of climate change and the possibility of coupling it with other large-area approaches.

DOI

[25]
Skaggs K E, Irmak S, 2012. Long-term trends in air temperature distribution and extremes, growing degree-days, and spring and fall frosts for climate impact assessments on agricultural practices in Nebraska.Journal of Applied Meteorology and Climatology, 51(11): 2060-2073.Air temperature influences agricultural practices and production outcomes, making detailed quantifications of temperature changes necessary for potential positive and negative effects on agricultural management practices to be exploited or mitigated. Temperature trends of long-term data for five agricultural locations, ranging from the subhumid eastern to the semiarid western parts of Nebraska, were studied to determine local temperature changes and their potential effects on agricultural practices. The study quantified trends in annual and monthly average maximum and minimum air temperature (Tmax and Tmin), daily temperature range (DTR), total growing degree-days, extreme temperatures, growing-season dates and lengths, and temperature distributions for five heavily agricultural areas of Nebraska: Alliance, Central City, Culbertson, Fremont, and Hastings. July and August were the months with the greatest decreases in Tmax for the central part of Nebraska鈥擟ulbertson, Hastings, and Central City. Alliance, Culbertson, and Fremont had year-round decreases in DTR. Central City and Hastings experienced growing-season decreases in DTR. Increases in growing-season length occurred at rates of 14.3, 16.7, and 11.9 days century-1 for Alliance, Central City, and Fremont, respectively. At Hastings, moderately earlier last spring frost (LS) at a rate of 6.6 days century-1 was offset by an earlier (2.7 days century-1) first fall frost (FF), resulting in only a 3.8 days century-1 longer growing season. There were only slight changes in LS and FF dates of around 2 days earlier and 1 day later per century, respectively, for Culbertson.

DOI

[26]
Tang G A, Yang X, 2012. ArcGIS: GIS Spatial Analysis Experiment Tutorial. Beijing: Science Press. (in Chinese)

[27]
Wang B Y, Fan G Z, Wei M,et al., 2014. Frost spatial and temporal variations analysis in Hengduan Mountains.Plateau and Mountain Meteorology Research, 34(2): 17-21. (in Chinese)In this paper,using the climate diagnostic analysis method and surface temperature not more than 0 鈩 as a indicator of frost,the first frost date,the last frost date and frost-free period variations were analyzed,according to the minimum daily surface temperature data of 27 meteorological stations in Hengduan Mountains during 1961-2007. The results showed that the first frost date postponed by 1. 09d /10a climate tendency rate,the last frost date ahead by 4. 02d /10a,Frost-free period extended by 4. 08d /10a,and there were obvious geographical differences in Hengduan Mountains. In most districts of Hengduan Mountains,the last frost dates' inter-annual differences were more than the first frost dates',but the frost-free periods' inter-annual differences was the most. From the decadal changes,since the 1990s,the date of the first frost in the1990s significantly delayed,the last frost date significantly ahead,and the frost-free period significantly longer than before.

[28]
Wei F Y, 2007. Modern Climate Statistics Diagnosis and Prediction Technology. 2nd ed. Beijing: China Meteorological Press. (in Chinese)

[29]
Xu J H, 2012. Mathematical Methods in Contemporary Geography. Beijing: Higher Education Press. (in Chinese)

[30]
Ye D X, Zhang Y, 2008. Characteristics of frost changes from 1961 to 2007 over China.Journal of Applied Meteorological Science, 19(6): 661-665. (in Chinese)Based on the daily minimum temperature data at 577 meteorological stations over China from 1961 to 2007,the first frost date,the last frost date and the frost-free days are calculated by using the common climatic index on frost day.The results show that the standard deviation of the first frost date,the last frost date and the frost-free days is less in the north than in the south of China,which indicates that they are more stabile in the north than in the south.The inter-annual variation of the last frost date is larger than those of the first frost date,and the inter-annual variation of the frost-free days is larger than those of the last frost date in most areas of China.It can be seen from the linear change trend that the last frost date is 2.0 d/10a ahead of time,the first frost date has 1.3 d/10a delay and the frost-free days prolong 3.4 d/10a over the past 47 years.From the climate trend it can be found that the range of the ahead last frost date is more than that of the delayed first frost date,which implies that the main cause of the prolonged frost-free days is the ahead of last frost day.The first-frost date obviously delays since 1990s.The last frost date is obviously ahead of time and the frost-free days obviously prolong since 1980s.The ahead of last frost date is earlier than the first frost date delay in China from the inter-annual variation.

DOI

[31]
Zhang D, Xu W H, Li J Y,et al., 2014. Frost-free season lengthening and its potential cause in the Tibetan Plateau from 1960 to 2010.Theoretical and Applied Climatology, 115(3/4): 441-450.Frost-free season was an important index for extreme temperature, which was widely discussed in agriculture and applied meteorology research. The frost-free season changed, which was associated with global warming in the past few decades. In this study, the changes in three indices (the last frost day in spring, the first frost day in autumn, and the frost-free season length) of the frost-free season were investigated at 73 meteorological stations in the Tibetan Plateau from 1960 to 2010. Results showed that the last frost day in spring occurred earlier, significantly in 3902% of the 73 stations. For the regional average, the last frost day in spring occurred earlier, significantly at the rate of 1.902days/decade during the last 5002years. The first frost day in autumn occurred later, significantly in 3102% of the stations, and the regional average rate was 1.502days/decade from 1960 to 2010. The changing rate of the first frost day in autumn below 3,00002m was 1.8 times larger than the changing rate above 3,00002m. In addition, the first frost day in autumn above 3,00002m fluctuated dramatically before the early 1990s and then it was later sharply after the early 1990s. The frost-free season length increased significantly at almost all stations in the Tibetan Plateau from 1960 to 2010. For the regional average, the frost-free season lengthened at the rate of 3.102days/decade. The changing rate of the frost-free season length below 3,00002m was more significant than the changing rate above 3,00002m. Eight indices of large-scale atmospheric circulation were employed to investigate the potential cause of the frost-free season length change in the Tibetan Plateau during the past 5002years. There was a significant relationship between the frost-free season length and the Northern Hemisphere Polar Vortex indices. The weakening cold atmospheric circulation might be an essential factor to the Tibetan Plateau warming since 1960.

DOI

[32]
Zhang L, Zhang X Y, Li H Y,et al., 2013. Characteristics of frost-free days changes over Ningxia from 1961 to 2010.Ecology and Environmental Sciences, 22(5): 801-805. (in Chinese)Based on the daily minimum temperature data at 20 meteorological stations over Ningxia from 1961 to 2010,the frost-free days are calculated according to the climatic index on frost day.Using basic statistical methods and analyzing methods of climatic diagnosis,the climate characteristics and changes trend of frost-free days were studied.The results showed that the spatial distribution of frost-free days was obvious difference: the longest is 166 day(s Wuzhong weather station),and the shortest is only 117 days(Longde weather station),the biggest difference of temporal distribution was 49 d;The temporal distribution of frost-free days was also obvious difference: The shortest is in 1972(17 days),the longest is in 2000 and 2001(167 days),and the shortest is only 117 days(Longde weather station).The biggest spatial distribution鈥檚 was 46 d.The sort order of the average annual frost-free days,frost-free days under 80% and 90% of the guaranteed-rate all were Yellow river irrigation areaMiddle dry areaSouth mountain area.In recent 50 years,the frost-free days of Ningxia was lengthening with a tendency of 4.7 days per 10 years.Meanwhile the frost-free days of three regions all was obvious lengthening trend,and South mountain area鈥檚 lengthening rate was the highest among them,up to 5.8 days per 10 years.Mutation of the frost-free days appeared in 1982 over Ningxia.Among three regions,Yellow river irrigation area and Middle dry area鈥檚 mutation was the same,South mountain was 2 years in advance.Study of decadal changes of frost-free showed the longest frost-free days occur at 70s of the 20 century,and the shortest in early 21century,a difference of 20 days.The reasons for lengthening of frost-free days was that the first frost days was postponed,meanwhile the last frost day was earlier.On the whole,lengthening of frost-free days was more favorable for Ningxia's agricultural production.

[33]
Zhang S Q, Pu Z C, Li J L,et al., 2013. The impact of global warming on frost-free periods from 1961 to 2010 in Xinjiang.Resources Science, 35(9): 1908-1916. (in Chinese)Based on daily temperature data from 1961 to 2010 from 101 meteorological stations in Xinjiang,the spatial-temporal change characteristic of annual mean temperature,first and late frost dates,and frost-free period were analyzed using linear regression,accumulative anomaly,T-tests and mixed spatial interpolation methods.We found that the spatial distribution of first and late frost dates and frost-free periods closely corresponded to annual mean temperature.For example,when the annual mean temperature is higher,the late frost date is earlier,first frost date is later and frost-free period is longer.Under a context of global warming,annual mean temperature rose 0.33掳 C/10 a and the late frost date advanced by-1.41 d/10 a,the first frost date was delayed by 2.21 d/10 a,and the frost-free period increased by 3.59 d/10 a.These changes experienced significant mutation in 1997 or 1995 whereby the rate of change before and after these dates was different in different areas.Generally,the advance rate or range of late frost dates,the delayed rate or range of first frost dates,and the increasing rate or range of frost-free periods were greater in areas that underwent a greater increase in annual mean temperature.

Outlines

/