Orginal Article

Assessment of diurnal variation of summer precipitation over the Qilian Mountains based on an hourly merged dataset from 2008 to 2014

  • LIU Xuemei ,
  • ZHANG Mingjun ,
  • WANG Shengjie ,
  • WANG Jie ,
  • ZHAO Peipei ,
  • ZHOU Panpan
Expand
  • College of Geography and Environmental Science, Northwest Normal University, Lanzhou 730070, China
*Corresponding author: Zhang Mingjun, Professor, E-mail:

Received date: 2016-05-16

  Accepted date: 2016-06-15

  Online published: 2017-03-30

Supported by

National Natural Science Foundation of China, No.41461003

National Basic Research Program of China (973 Program), No.2013CBA01801

Copyright

本文是开放获取期刊文献,在以下情况下可以自由使用:学术研究、学术交流、科研教学等,但不允许用于商业目的.

Abstract

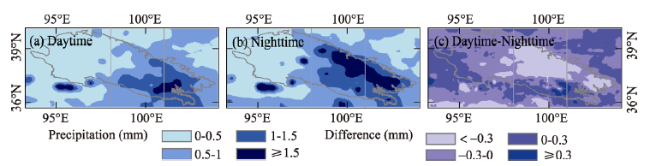
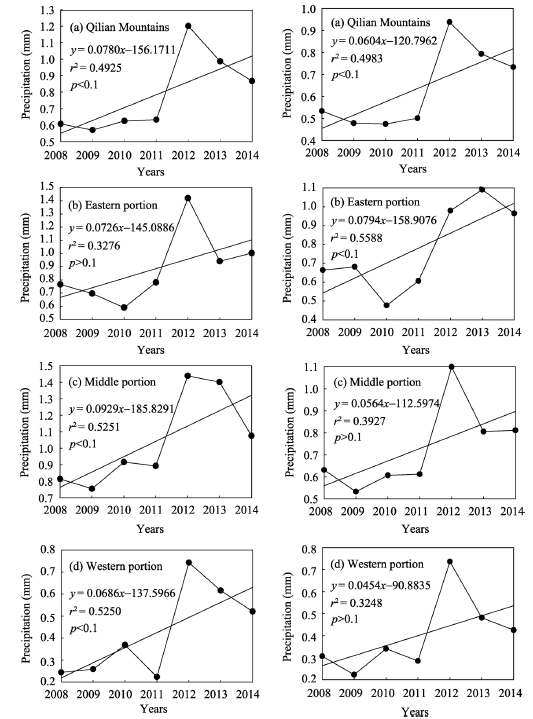
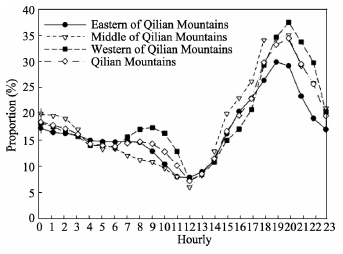
To investigate the diurnal variation of summer precipitation in the Qilian Mountains in the northeast Tibetan Plateau, the hourly precipitation amount for this region during the summers of 2008-2014 are analyzed using an hourly merged precipitation product at 0.1°×0.1° resolution. The main results are as follows. (1) The spatial distribution and temporal variation of mean hourly precipitation amount and frequency are generally similar and hourly precipitations in the eastern and middle portions are larger and more frequent than that in the western portion. The high value area of precipitation intensity is obviously different from that of precipitation amount and frequency. (2) The spatial distribution of daytime precipitation is generally similar to that of nighttime precipitation, and the daytime precipitation is heavier than the nighttime precipitation. (3) The change rate of precipitation has a maximum at 20:00 Beijing time, and a minimum at 12:00. The hourly precipitation amount significantly correlated with frequency, especially for the middle and eastern portions.

Cite this article

LIU Xuemei , ZHANG Mingjun , WANG Shengjie , WANG Jie , ZHAO Peipei , ZHOU Panpan . Assessment of diurnal variation of summer precipitation over the Qilian Mountains based on an hourly merged dataset from 2008 to 2014[J]. Journal of Geographical Sciences, 2017 , 27(3) : 326 -336 . DOI: 10.1007/s11442-017-1379-3

1 Introduction

The rapid warming trend has been evidenced in the middle-latitude of the Northern Hemisphere, which may result in an acceleration of regional and global water cycles (Ji et al., 2014; IPCC, 2014). The diurnal variation of precipitation is related to the thermal and dynamic processes in the atmosphere, and is attracting increasing attention in global change studies (e.g., Sperber and Yasunari, 2006; Bowen and Fowler, 2015; Wu et al., 2015). It is therefore of great importance to investigate the spatial regime and dynamic mechanism of the diurnal variation of precipitation (Jeong et al., 2011; Folkins et al., 2014; Betts et al., 2013).
Based on in-situ observations, precipitation has been found to have significant diurnal variations in China (e.g., Li et al., 2008; Guo et al., 2014; Zhang et al., 2014). In southern and northeastern China, precipitation in the summer usually peaks in the late afternoon, but most areas of the Tibetan Plateau have rainfall that peaks at around midnight (Yu et al., 2007). Recent studies regarding the diurnal variation of summer rain in China have been reviewed by Yu et al. (2014).
The Qilian Mountains are located at the northeast margin of the Tibetan Plateau, and the surrounding areas are much more arid than the mountains (Jia et al., 2012). Although the diurnal variation of precipitation is mentioned in a previous nationwide assessment (Zhu et al., 2016), detailed information for this region is absent, mostly due to the uneven distribution of the observation network. Satellite data provide a good coverage of high elevations; however, the uncertainty in the satellite-based precipitation data and the short observation period cannot be ignored (Joyce et al., 2004; Guo et al., 2014). In recent years, a nationwide hourly 0.1°×0.1° precipitation database across China has been released by the National Meteorological Information Center, and measurements using automatic meteorological stations were merged with CMORPH (Climate Precipitation Center Morphing) data (Shen et al., 2013, 2014). The merged dataset has been widely used to study the precipitation pattern in China (e.g., Wang et al., 2014; Zhou et al., 2015; Kang et al., 2015; Zhu et al., 2016). In this study, we focus on hourly precipitation in the Qilian Mountains, and provide a systemic assessment of diurnal variation of the summer precipitation.

2 Data and methods

2.1 Study area

The Qilian Mountains are located in the northeastern margin of the Tibetan Plateau, where the elevation is generally 4000-5000 m. The Hexi Corridor lies on the northern slope of the Tianshan Mountains, and the Qaidam Basin is on the southern slope (Figure 1). According to the second Chinese Glacier Inventory (Sun et al., 2015), existing glaciers in the mountains are 1597.81±70.30 km2 in area and approximately 84.48 km3 in volume. During the past decades, the glaciers have undergone rapid shrinkage (Wang et al., 2011; Tian et al., 2010; Chen et al., 2015). Owing to various water vapor sources and huge elevation fluctuations, the spatial distribution and seasonal pattern of precipitation are complex in the Qilian Mountains (Jia et al., 2008, 2012; Qiang et al., 2016). To investigate the spatial diversity, longitudes of 101°E and 98°E were selected as the boundaries of the eastern, middle and western portions of the Qilian Mountains in this study, which was also suggested by Chen et al. (2012). As shown in Figure 1, subregions I, II and III are the eastern, middle and western portions of the Qilian Mountains, respectively.
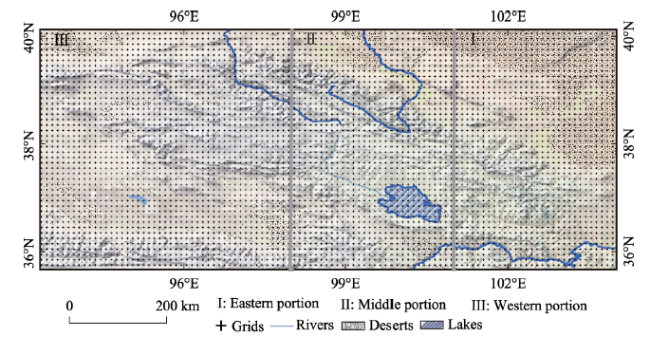
Figure.1 Spatial distribution of grid boxes for hourly precipitation at 0.1°×0.1° resolution in the Qilian Mountains

2.2 Data

The hourly merged precipitation data from 2008 to 2014 used in this study were provided by the National Meteorological Information Center (available online at http://data.cma.cn). The nationwide automatic meteorological station data were merged with CMORPH data, and nationwide hourly precipitation with a spatial resolution of 0.1°×0.1° was acquired from 2008 to the present. Details about this product have been described in previous studies (Pan et al., 2012; Shen et al., 2013, 2014). Owing to the seasonal distribution of precipitation in the study region (Yin et al., 2009; Qiang et al., 2016), summer (June, July and August) is the season with the most precipitation of the four seasons. In this paper, the focus is on summer precipitation over the Qilian Mountains during 2008-2014.

2.3 Methods

The precipitation amounts for each hour were processed to give hourly mean series over 24 hours (usually on a monthly basis). The precipitation frequency describes the existence of rainfall within a specific period, and is a dimensionless parameter. The precipitation intensity is the mean value of the hourly precipitation amount during rainfall hours. To study the difference in precipitation amount between daytime and nighttime, they are defined as periods from 08:00 to 20:00 (Beijing time) and from 20:00 to 08:00, respectively. To assess the variation of hourly precipitation, the precipitation change rate is also applied in this paper, and can be calculated as:
where xi is the hourly precipitation amount in mm/h, ヌis the mean hourly precipitation amount in mm/h, i is the hour of the precipitation and the n is the total hour of the precipitation.
Pearson’s correlation coefficient (r) and two-tailed t tests were used to assess linear correlation and statistical significance.

3 Results and analysis

3.1 Hourly precipitation amount

The diurnal variation of mean hourly precipitation amount during the summers of 2008-2014 is shown in Figure 2. It is clear that the precipitation amount in the eastern and middle portions is much larger than that in the western portion, which is consistent with previous studies using interpolated grid products (e.g., Qiang et al., 2016) and in-situ measurements (e.g., Jia, 2012) for this region. On a monthly basis, the maximum is usually seen for the July series, especially for the eastern and middle portions. In the middle portion, the peak time for both the July and summer series is 18:00 Beijing time, while for June and August it is 17:00 and 20:00, respectively. Generally, the precipitation peak time is between 17:00 and 20:00, which means that the rainfall is usually concentrated in the evening.
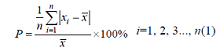
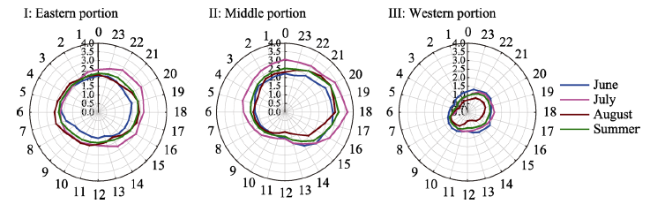
Figure.2 Mean hourly precipitation amount in mm/month for each subregion in the Qilian Mountains during the summers of 2008-2014
The spatial distribution of the mean hourly precipitation amounts in the Qilian Mountains is shown in Figure 3, with the eastern and middle portions displaying larger precipitation amounts. From 08:00 to 12:00, the precipitation amount generally declines for the whole region. After 12:00, the hourly precipitation amount increases significantly. It should be mentioned that the precipitation amount on the northern slope is larger than that on the southern slope for these hours. There is a significant decreasing trend of the amount from 22:00 to 07:00, and then the amount on the southern slope is larger than that on the northern slope. In addition, the precipitation is mainly concentrated in the hours from 17:00 to 21:00.

3.2 Hourly precipitation frequency

As shown in Figure 4, the hourly precipitation frequency in the eastern and middle portions is larger than that in the western portion. For the eastern and middle portions, the month with the maximum precipitation frequency is July, and for the western portion, June shows the maximum frequency. In the middle portion, the peak time of precipitation frequency for the June series is 17:00 and the peak time for the July and August series is 21:00 and 18:00, respectively. The precipitation frequency peak time of the Qilian Mountains is generally consistent with the above-mentioned mean hourly precipitation. The spatial distribution of precipitation frequency in the Qilian Mountains is shown in Figure 5. In addition, the precipitation frequency of the mountains is larger than that of the surrounding areas, indicating the importance of high elevation in the regional water cycle.

3.3 Hourly precipitation intensity

Figure 6 demonstrates that the diurnal variation of precipitation intensity is different from that of the hourly precipitation amount and frequency, and the precipitation intensity is generally similar for each subregion of the Qilian Mountains. In the western portion, the precipitation intensity peak time in June is 23:00-00:00; in contrast, the peak times in July are 12:00 and 07:00, while the time in August is 06:00-07:00. The spatial distribution of precipitation intensity is exhibited in Figure 7. The high value area of precipitation intensity is very different from that of the precipitation amount and frequency. There is no good correlation of precipitation intensity with elevation.
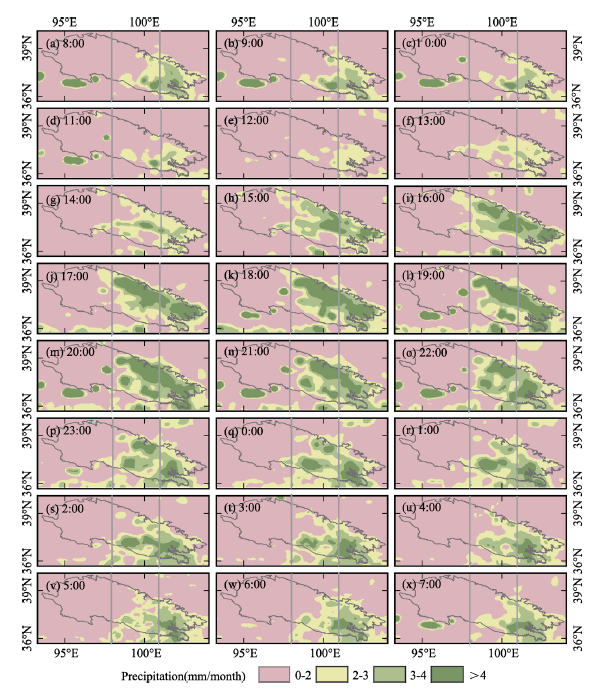
Figure.3 Spatial distribution of mean hourly precipitation amount in mm/month for each hour in the Qilian Mountains during the summers of 2008-2014
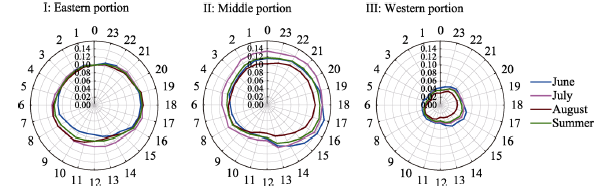
Figure.4 Mean hourly precipitation frequency for each subregion in the Qilian Mountains during the summers of 2008-2014
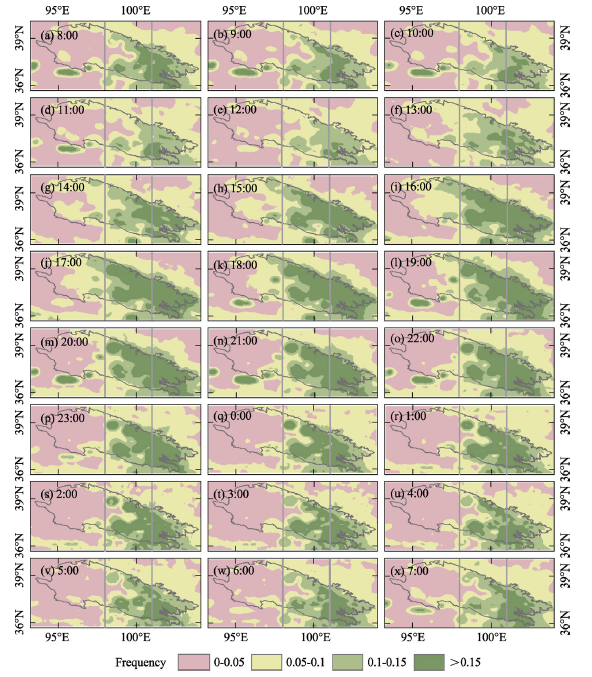
Figure.5 Spatial distribution of mean hourly precipitation frequency for each hour in the Qilian Mountains during the summers of 2008-2014
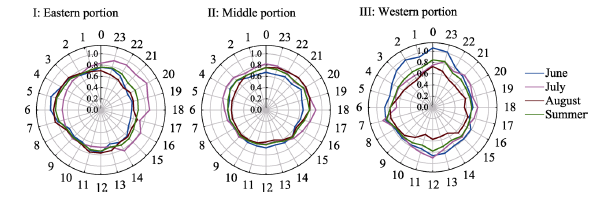
Figure.6 Mean hourly precipitation intensity in mm/h for each subregion in the Qilian Mountains during the summers of 2008-2014
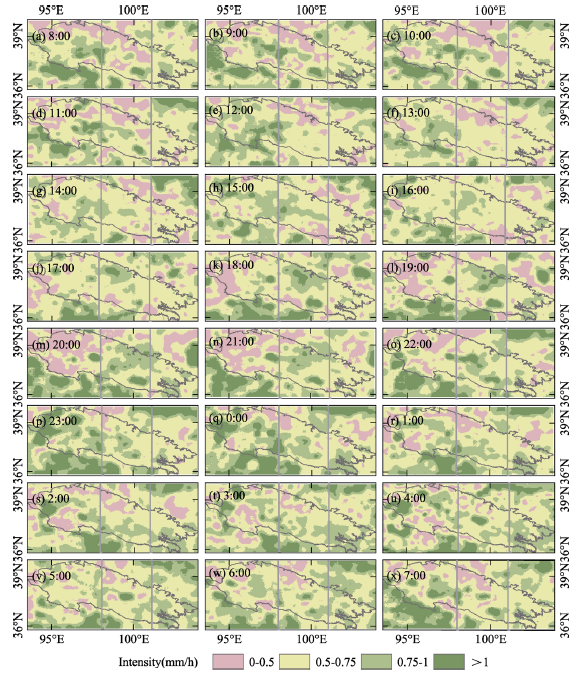
Figure.7 Spatial distribution of mean hourly precipitation intensity in mm/h for each hour in the Qilian Mountains during the summers of 2008-2014

3.4 Daytime and nighttime precipitation

Figure 8 shows that the spatial distribution of daytime precipitation is generally similar to that of the nighttime, and the precipitation in the eastern and middle portions is heavier than that in the western portion. As shown in Figure 9, there is an increasing trend in both daytime and nighttime precipitation amounts. In the first four years, precipitation during the daytime and nighttime was generally stable, and the fluctuation of precipitation amount was very limited. However, the precipitation peaked in 2012 for the entire study region. After 2012, the precipitation amount decreased to some degree. A similar inter-annual trend can be detected in each subregion, but detailed differences still exist.
Figure.8 Spatial distribution of precipitation in daytime (a), nighttime (b) and their difference (c) in mm/day for each subregion in the Qilian Mountains during the summers of 2008-2014
Figure.9 Inter-annual change of daytime and nighttime precipitation in mm per day in the Qilian Mountains during the summers of 2008-2014
Figure.10 Hourly variation of precipitation change rate in the Qilian Mountains during the summers of 2008-2014

3.5 Change rate and correlation coefficient

The changes in rates of precipitation in the Qilian Mountains during the summers of 2008-2014 are shown in Figure 10. The changes in rates in all the subregions vary between 5% and 38%, with a maximum at 20:00 in the middle and western portions, while in the eastern portion, the maximum value is seen at 19:00. When the change rate of precipitation is high, extreme weather events and disasters may occur frequently (Fu, 2013). The minimum value of change rate is found at 12:00, which is consistent across the three subregions. The correlation analysis results in the different subregions are shown in Table 1. The correlation between precipitation amount and frequency is the strongest among these parameters. All the coefficients between the precipitation amount and frequency are statistically significant, especially for the eastern and middle portions in the Qilian Mountains.
Table 1 Correlation coefficients of the mean hourly precipitation amount, frequency and intensity in the Qilian Mountains during the summers of 2008-2014
Eastern portion Middle portion Western portion Qilian Mountains
r(amount vs. Intensity) 0.366 0.887** -0.062 0.194
r(amount vs. frequency) 0.834** 0.963** 0.598** 0.931**
r(intensity vs. frequency) -0.036 0.806** -0.483* -0.071

Note: *Statistically significant at the 0.01 level. ** Statistically significant at the 0.05 level.

4 Conclusions

Based on an hourly merged precipitation product at 0.1°×0.1° resolution, the mean hourly precipitation amount, frequency and intensity in the Qilian Mountains during the summers of 2008-2014 have been analyzed. The main conclusions are as follows.
The diurnal variation of the mean hourly precipitation amount is consistent with that of precipitation frequency, and the amount and frequency in the eastern portion are larger than those in the western portion. The high value area of precipitation intensity is obviously different from that of the precipitation amount and frequency.
The spatial distribution of daytime precipitation is generally similar to that of nighttime precipitation. The daytime precipitation is generally heavier than that of the nighttime precipitation. During 2008-2014, the daytime and nighttime precipitation series increased, with a peak in 2012.
The change rate of precipitation in the study region has a maximum at 20:00 Beijing time, and a minimum at 12:00. The linear correlation between the precipitation amount and frequency is strong, especially in the eastern and middle portions.

The authors have declared that no competing interests exist.

[1]
Betts A K, Desjardins R, Worth D et al., 2013. Impact of land use change on the diurnal cycle climate of the Canadian Prairies. Journal of Geophysical Research: Atmospheres, 118(21): 11, 996-12, 011.This paper uses hourly observations from 1953 to 2011 of temperature, relative humidity, and opaque cloud cover from 14 climate stations across the Canadian Prairies to analyze the impact of agricultural land use change on the diurnal cycle climate, represented by the mean temperature and relative humidity and their diurnal ranges. We show the difference between the years 1953-1991 and 1992-2011. The land use changes have been largest in Saskatchewan where 1520% of the land area has been converted in the past four decades from summer fallow (where the land was left bare for 1 year) to annual cropping. During the growing season from 20 May to 28 August, relative humidity has increased by about 7%. During the first 2months, 20 May to 19 July, maximum temperatures and the diurnal range of temperature have fallen by 1.2 degrees C and 0.6 degrees C, respectively, cloud cover has increased by about 4%, reducing surface net radiation by 6W m(-2), and precipitation has increased. We use the drydowns after precipitation to separate the impact of cloud cover and show the coupling between evapotranspiration and relative humidity. We estimate, using reanalysis data from ERAInterim, that increased transpiration from the larger area of cropland has reduced the surface Bowen ratio by 0.140.2. For the month on either side of the growing season, cloud cover has fallen slightly; maximum temperatures have increased, increasing the diurnal temperature range and the diurnal range of humidity.

DOI

[2]
Bowman K P, Fowler M D, 2015. The diurnal cycle of precipitation in tropical cyclones.Journal of Climate, 28(13): 5325-5334.Abstract Position and intensity data from the International Best Track Archive for Climate Stewardship (IBTrACS) are combined with global, gridded precipitation estimates from the Tropical Rainfall Measuring Mission (TRMM) Multisatellite Precipitation Analysis (TMPA) for the period 1998- 2013 to study the diurnal cycle of precipitation in tropical cyclones. The comprehensive global coverage and large sample size afforded by the two datasets allow robust statistical analysis of storm-averaged diurnal variations and permit stratification of the data in various ways. There is a clearly detectable diurnal variation of precipitation in tropical cyclones with peak rainfall occurring near 0600 local time. For storms of all intensities the amplitude of the diurnal harmonic, which dominates the diurnal cycle, is approximately 7% of the mean rain rate. This corresponds to a peak-to-peak variation of about 15% over the course of the day. The diurnal cycle is similar in all ocean basins. There is evidence that the amplitude of the diurnal cycle increases with increasing storm intensity, but the results are not statistically significant. The results have implications for hurricane forecasting and for a greater understanding of the processes that regulate oceanic convection.

DOI

[3]
Chen H, Li Z Q, Wang P Y et al., 2015. Five decades of glacier changes in the Hulugou Basin of central Qilian Mountains, Northwest China.Journal of Arid Land, 7(2): 159-165.

[4]
Chen Zhikun, Zhang Shuyu, Luo Jiali et al.Luo Jiali ., 2012. Analysis on the change of precipitation in the Qilian Mountains.Arid Zone Research, 29(5): 847-853. (in Chinese)In this paper,the various trends and distributional characteristics of precipitation in the Qilian Mountains were studied using the data of hourly and daily precipitation in the mountains.Moreover,the tree-ring data of Picea asperata growing in the study area were used to analyze the response of tree-ring width to precipitation in the mountainous.A unitary linear regression model was used to develop a transfer equation so as to reveal the relationships between the standardized chronology of tree-ring width and the average precipitation at Minle Meteorological Station during the period from August to next July and the change of annual precipitation in recent 200 years.The results show that precipitation in 19th century was higher than that in 20th century.Drought occurred increasingly in 20th century,especially severe drought occurred in the 1920s and 1930s,such trend was consistent with that in north China.Precipitation in the Qilian Mountains was closely related to the altitude,and most precipitation occurred in the afternoon and nighttime.Flood season in the study area is in July and August.Moreover,the frequency of extreme precipitation was increased in recent decades,and the change of annual precipitation was not significant.

DOI

[5]
Folkins I, Mitovski T, Pierce J R, 2014. A simple way to improve the diurnal cycle in convective rainfall over land in climate models.Journal of Geophysical Research: Atmospheres, 119(5): 2113-2130.No abstract available.

DOI

[6]
Fu Yuaihai, 2013. The projected temporal evolution in the interannual variability of East Asian summer rainfall by CMIP3 coupled models.Science China Earth Sciences, 56(8): 1434-1446.

[7]
Guo Jianping, Zhai Panmao, Wu Lu et al.Wu Lu ., 2014. Diurnal variation and the influential factors of precipitation from surface and satellite measurements in Tibet.International Journal of Climatology, 34(9): 2940-2956.ABSTRACTSome new features concerning the diurnal variation of precipitation over the Tibetan Plateau (TP) are revealed from rainfall data acquired by a network of rain gauge stations and estimated by the Climate Precipitation Center Morphing (CMORPH) technique collected during the summer of 2010 and 2011. Maxima in precipitation amount and frequency are associated with the afternoon-to-evening precipitation regime at approximately 60% of the stations in the network. CMORPH data also capture this pattern, but miss the late morning peak that occurs at some stations. The timing of maximum occurrence agrees well with the diurnal cycle of synoptic conditions favouring the development of precipitation over this area. There is no distinct west-to-east propagation of the diurnal cycle, implying that the diurnal cycle is more driven by local effects than by large-scale circulation. It turns out that the diurnal cycle in precipitation frequency depends largely on topography and landscape. The geographical transition in precipitation peak time is distinct from hilly regions (daytime peak) towards lakes and valleys (evening-to-nocturnal peaks). Stations located in mountainous regions (valleys) tend to experience more precipitation in either late morning or early afternoon (late afternoon or evening). Overall, precipitation amount shows a similar topographic dependence, as does the precipitation frequency, suggesting that local-scale effects, such as the mountain valley circulation effect, has a great impact on the diurnal variation in precipitation when large-scale dynamical processes are weak. A possible mechanism for the non-uniform diurnal cycle of precipitation over the TP is proposed. The major conclusion is that plateau-scale synoptic systems, as well as local circulation systems caused by the complex topography, should be taken into account when determining the diurnal variation in precipitation over the TP.

DOI

[8]
IPCC(Intergovernmental Panel on Climate Change), 2014 . Climate Change 2013: The Physical Science Basis. In: Contribution of Working Group I to the Fifth Assessment Report of IPCC. Cambridge, UK: Cambridge University Press.

[9]
Jeong J H, Walther A, Nikulin G et al., 2011. Diurnal cycle of precipitation amount and frequency in Sweden: Observation versus model simulation.Tellus A, 63(4): 664-674.ABSTRACTThis study investigated the diurnal cycle of precipitation in Sweden using hourly ground observations for 1996–2008. General characteristics of phase and amplitude for the diurnal cycle of precipitation, both in amount and frequency, were identified. In the warm season (April–September), the ‘typical’ afternoon (14–16 LST) peaks are dominant over inland Sweden, whereas late night to early morning (04–06 LST) peaks with relatively weak amplitude are discernable in the east coast along the Baltic Sea. The diurnal variation is almost negligible in the cold season (October–March), due to the weak solar radiation at high latitudes. The variations of convective activity forced by solar heating and modulated by geographical characteristics were suggested as primarily factors to invoke the cycles and spatial variation identified. The observed cycle was compared with the cycle simulated by a regional climate model. The model fairly well captures the spatial pattern of the phase of the diurnal cycle. However, the warm season afternoon peak is simulated too early and too uniformly across the stations, associated with too frequent occurrences of convective rainfall events with relatively light intensity. These discrepancies point to the need to improve the convection parametrization and geographic representation of the model.

DOI

[10]
Ji Fei, Wu Zhaohua, Huang Jianping et al., 2014. Evolution of land surface air temperature trend.Nature Climate Change, 4(6): 462-466.Global warming is non-uniform in time and space, but to understand potential impacts we need better understanding of its evolution. This work breaks down the warming trend and finds that it began in the subtropical and subpolar regions of the Northern Hemisphere, followed by the subtropical region of the Southern Hemisphere. The warming bands in the Northern Hemisphere expanded during the period 1950–1985 and merged to cover the entire hemisphere.

DOI

[11]
Jia Wenxiong, 2012. Temporal and spatial changes of precipitation in Qilian Mountains and Hexi Corridor during 1960-2009.Acta Geographica Sinica, 67(5): 631-644. (in Chinese)Based on daily precipitation data of 18 weather stations in Qilian Mountains and Hexi Corridor during 1960 to 2009, the spatial and temporal changes of day number and intensity for different grades of precipitation were analyzed by the methods of linear trend, five-year moving trend, IDW, Morlet wavelet and Mann-Kendall. The results indicated that the spatial distributions of day number and intensity for different grades of precipitation changed from east to west and from south to north. In the last 50 years, the annual variations of day number of different grades of precipitation were increasing in most of the regions and the increasing scales are decreasing from east to west, which is consistent with the intensity of heavy rainfall events. However the annual variations present an increasing trend in some parts or decreasing in other parts in terms of the intensities of light rain, moderate rain and extreme rain. The annual changes of day number of different grades of precipitation showed an increasing trend, and they are significant for light rain, moderate rain and heavy rain. Intensity of light rain and heavy rain prohibited an unobvious decreasing trend, but it is opposite to intensities of moderate rain and extreme rain. The main change cycles of day number of different grades of precipitation have quasi-periods of 2a, 5a, 8a, 11 a and 19a, and those of intensity of different grades of precipitation have quasi-periods of 2a, 5a, l la, 15a and 25a. Except for the abrupt decrease in intensity of light rain, the day number and intensity of different grades of precipitation increased abruptly.

DOI

[12]
Jia Wenxiong, He Yuanqing, Li Zongxing et al., 2008. Spatio-temporal distribution characteristics of climate change in Qilian Mountains and Hexi Corridor.Journal of Desert Research, 28(6): 1151-1155. (in Chinese)Based on climatic data of 20 stations in Qilian Mountains and Heixi corridor,methods of regression analysis and moving average were used to study the climatic changing trend of the study area,in addition,the method of Spline interpolation was also employed to research the spatial distribution characteristics of climatic change in study area.It is indicated that temperature is lower during 1960s 1980s and higher after 1990s.Trend of temperature rise is obvious and the inter-annual ratio of temperature is 0.0298 鈩 per year.The temperature rise ratio varies from 0.02 to 0.04 centigrade per year,and temperature rise in Qilian Mountains is more obvious than Hexi corridor.The regional difference in temperature rise is,with the Heihe River as the divided,characterized by the fact that it is increasing in middle-eastern while decreasing in middle-western from south to north in the study area.Precipitation is less in 1960s,whereas it is more in other periods especially after 2000.Trend of precipitation rise is weak and the inter-annual ratio is 0.6571 mm per year.The precipitation rise ratio varies from 0 to 2 mm per year,and precipitation rise in Qilian Mountains is also more obvious than Hexi corridor.Precipitation rise decreased from south to north in study area.

DOI

[13]
Joyce R J, Janowiak J E, Arkin P A et al., 2004. CMORPH: A method that produces global precipitation estimates from passive microwave and infrared data at high spatial and temporal resolution.Journal of Hydrometeorology, 5(3): 487-503.

[14]
Kang Yanzhen, Chen Shihong, Zhang Ying et al., 2015. Precipitation during 2008-2013 in the Kumtagh Desert and Altun Mountains.Journal of Desert Research, 35(1): 203-210. (in Chinese)The Kumtagh Desert is an extremely arid desert,while the Altun Mountains,southward of the Kumtagh Desert,is quite moist.Thus,We expect that a comparison of the precipitation in these two regions could provide some insight about the water supply mechanism and topography formation of the Kumtagh Desert.To this end,we analyzed China automatic observation stations-CMORPH combined 0.1 grid hourly precipitation dataset.We first found that precipitation in the Kumtagh Desert mainly concentrated in summer while concentrated in spring and autumn in the Altun Mountains,and that there existed a large precipitation belt in the Altun Mountains,which was most extensive during March but almost disappeared in summer.Therefore,the Altun Mountains mainly provided water supplement to the Kumtagh Desert during spring and autumn and precipitation of these two regions was most different in spring while almost comparable in summer.Also we found that the monthly mean hourly precipitation in the Alutn Mountains varied significantly with season: "the early morning" type dominated in December and January of winter and in June and July of summer,which may be related with instability resulted from cloud top radiation cooling; "the afternoon-twilight" type dominated in spring and autumn,which may be related with the instability resulted from surface heating by solar radiation in afternoon;February and August are the transition periods.Our findings could provide a basis for further exploration of the water supply mechanisms and the unique "feathery dunes" landscape in the Kumtagh Desert.

[15]
Liang Hong, Liu Jingmiao, Chen Yue, 2010. Characteristics and cause of diurnal variation of precipitable water vapor derived from ground-based GPS in Qilian Mountains in summer.Plateau Meteorology, 29(3): 726-736. (in Chinese)Based on the precipitable water(PW) derived from ground-based GPS and the observations from radiosondes and automatic weather stations in Qilian mountains of Northwestern China during the period of July~August 2007,the diurnal variations of PW are systematically investigated.The results show that PW exhibited a pronounced diurnal variation in Qilian Mountains in summer.The diurnal variations of PW without precipitation days are more prominent than with precipitation days.The diurnal(24 h) and semidiurnal(12 h) cycles of the PW are fitted using the harmonic analysis method.The results show that the diurnal and semidiurnal cycles together can represent the diurnal variations very well.During the without precipitation days,diurnal cycle,which explains over 76% of the subdaily variance,has an amplitude of 0.8~1.6 mm and peaks appear at 18:00~21:00.The semidiurnal cycle is generally weaker,with an amplitude of 0.6~0.7 mm,and peaks appear in 05:00~06:00 and 17:00~18:00 respectively.However,during the with precipitation days,the characteristics of diurnal variation of PW at different stations are different.At some stations,the diurnal cycle explains more the subdaily variance than semidiurnal cycle.At other stations the semidiurnal cycle is more significant than diurnal cycle.The causes of diurnal variation of PW are preliminarily discussed.It can be seen that the diurnal variations of PW occur prior to the changes of hourly accumulated precipitation frequency.The former phase is two and half hours earlier than that of the latter.The diurnal variations of PW can be affected by surface air temperature,specific humidity and mountain-valley breeze.

DOI

[16]
Lv Xiang, Xu Haiming, 2007. Diurnal variations of rainfall in summer over the Indo-China Peninsula.Journal of Nanjing Institute of Meteorology, 30(5): 632-642. (in Chinese)TRMM(Tropical Rainfall Measuring Mission)satellite observations 3B42RT and 3G68 averaged over 8 years(1998—2005)in summer(JJA)are used to investigate diurnal variations of rainfall over the Indo-China peninsula.Conclusions are as follows:maximum rainfall and daily-rainfall variance occur on the west coast of Indo-China peninsula and on the windward slope of the Annam Cordillera during the whole summer.Precipitations over the flat land of Indo-China Peninsula and offshore reach their peaks in 16—19LST while in 07—10LST over the coastal areas.Rainfall peaks migrate from coastal areas to the inland and offshore,respectively,in the daytime,and migration from offshore to coastal areas in the nighttime is found,but from inland to coastal areas is not found.The south and north of the windward side of the Annam Cordillera show great difference in the diurnal variation of rainfall,which is related to migration of rainfall.Rainfall over coastal areas of the Thailand Gulf in 01—04LST migrates to inland northeastwards and then heavy rainfall occurs over areas southwest of the Annam Cordillera in 16—19LST,after that heavy rainfall migrates northwestward along the Annam Cordillera to areas northwest of the Annam Cordillera in 01—04LST in the next day.The migration of rainfall results in different characteristics of diurnal variation on the windward side of Annam Cordillera.

DOI

[17]
Pan Yang, Shen Yan, Yu Jingjing et al., 2012. Analysis of the combined gauge-satellite hourly precipitation over China on the OI technique.Acta Meteorologica Sinica, 70(6): 1381-1389. (in Chinese)In order to develop a high-quality Chinese precipitation product at the highly spatial-temporal resolution, the optimum interpolation (OI) technique was adopted to combine the CMORPH with the Chinese Precipitation Analyses (CPA),which was based on the hourly gauged rainfall from about 30,000 automatic weather stations (AWS), at 0.1掳lat/lon resolution. The CMORPH was set to the first guess, while the CPA was used as observations to modify the first guess. The error statistics of the first guess and observations were defined based on the data from June to August of 2009 and the error structures were employed to compute the weights. The examination of the combined precipitation (COMB) at 00:00 UTC 2 July 2009 showed that the CMORPH at the target grid was able to be improved by the CPA if the gauge within a searching radius was available. Otherwise, the CMORPH was remained where there was no gauge within the searching radius. The independent validation result of the COMB from June to August of 2009 was that, the Bias/RMSE/RE of the COMB were -0.004 mm/h, 1.271 mm/h and 15.964%, respectively, with the averaged spacial correlation coefficient of 0.778. It was indicated that the COMB had a better quality than the CMORPH, as well as the FY-2C merged precipitation product.

DOI

[18]
Qiang Fang, Zhang Mingjun, Wang Shengjie et al., 2016. Estimation of areal precipitation in the Qilian Mountains based on a gridded dataset since 1961.Journal of Geographical Sciences, 26(1): 59-69.

DOI

[19]
Shen Yan, Pan Yang, Yu Jingjing et al., 2013. Quality assessment of hourly merged precipitation product over China.Transactions of Atmospheric Science, 36(1): 37-46. (in Chinese)Based on the hourly precipitation observed by automatic weather stations(AWS) in China and retrieved from CMORPH(CPC MORPHing technique) satellite data,the merged precipitation product at hourly/0.1°lat/0.1°lon temporal-spatial resolution in China is developed through the two-step merging algorithm of PDF(probability density function) and OI(optimal interpolation).In this paper,the quality of merged precipitation product is assessed from the points of temporal-spatial characteristics of error,accuracy at different precipitation rates and cumulative times,merging effect at three station network densities and monitoring capability of the heavy rainfall.Results indicate that:1)The merged precipitation product effectively uses the advantages of AWS observations and satellite product of CMORPH,so it is more reasonable both at the precipitation amount and spatial distribution;2)The regional mean bias and root-mean-square error of the merged precipitation product are decreased remarkably,and they have a little change with time;3)The relative bias of merged precipitation product is -1.675%,less than 15% and about 30% for the medium(1.0—2.5 mm/h),medium to large(1.0—8.0 mm/h) and heavy rainfall(≥8.0 mm/h),respectively,and the product quality is improved further with the cumulative time increases.The merged precipitation product can capture the precipitation process very well and have a definite advantage in the quantitatively rainfall monitoring.

[20]
Shen Yan, Zhao Ping, Pan Yang et al., 2014. A high spatiotemporal gauge-satellite merged precipitation analysis over China.Journal of Geophysical Research: Atmospheres, 119(6): 3063-3075.Using hourly rain gauge data at more than 30,000 automatic weather stations in China, in conjunction with the Climate Precipitation Center Morphing (CMORPH) precipitation product for the 2008–2010 warm seasons (from May through September), we assess the capability of the probability density function–optimal interpolation (PDF-OI) methods in generating the daily, 0.25°65×650.25° and hourly, 0.1°65×650.1° merged precipitation products between gauge observations and the CMORPH product. We find that error correlation, error variances of gauge and satellite data, and matching strategy in the PDF-OI method are dependent on the spatial and temporal resolutions of the used data. Efforts to improve the parameters and matching strategy for the hourly and 0.1°65×650.1° product have been conducted. These improvements are not only suitable to a high-frequency depiction of no-rain events, but accurately describe the error structures of hourly gauge and satellite fields. The successive merged precipitation algorithm or product is called the original PDF-OI (Orig_PDF-OI) and the improved PDF-OI, respectively. The cross-validation results show that the improved method reduces systematic bias and random errors effectively compared with both the CMORPH precipitation and the Orig_PDF-OI. The improved merged precipitation product over China at hourly, 0.1° resolution is generated from 2008 to 2010. Compared with the Orig_PDF-OI, the improved product reduces the underestimation greatly and has smaller bias and root-mean-square error, and higher spatial correlation. The improved product can better capture some varying features of hourly precipitation in heavy weather events.

DOI

[21]
Sperber K R, Yasunari T, 2006. Workshop on monsoon climate systems: Toward better prediction of the monsoon.Bulletin of the American Meteorological Society, 87(10): 1399-1403.The Earth's monsoon systems are the life-blood of more than two-thirds of the world's population through the rainfall they provide to the mainly agrarian societies they influence. More than 60 experts gathered to assess the current understanding of monsoon variability and to highlight outstanding problems simulating the monsoon.

DOI

[22]
Sun Meiping, Liu Shiyin, Yao Xiaojun et al., 2015. Glacier changes in the Qilian Mountains in the past half century: Based on the revised first and second Chinese glacier inventory.Acta Geographica Sinica, 70(9): 1402-1414. (in Chinese)According to the Second Chinese Glacier Inventory (SCGI) that were mostly compiled based on Landsat TM/ETM+images, the Qilian Mountains contained 2684 glaciers covering an area of 1597.81±70.30βkmand ice volume of ~84.48βkmfrom 2005 to 2010. While most glaciers are small (85.66% are smaller than 1.0βkm), some larger ones (12.74%, with each having 1.0 and 5.0βkm) cover 42.44% of the total glacier area. The Laohugou No.12 Glacier (20.42βkm) located on the north slope of the Daxue Range is the only one larger than 20 kmin the Qilian Mountains. The average median altitude of glacier was 4972.7βm a.s.l. and gradually rose from east to west. Glaciers in the Qilian Mountains are mostly distributed in Gansu and Qinghai provinces, which have 1492 glaciers (760.96βkm) and 1192 glaciers (836.85βkm), respectively. In 11 watersheds, the Shule River contains most of the glaciers in either area or volume. However, the Heihe River, the second longest interior river in China, has the minimum average area of glacier. Comparison of glaciers from the SCGI and the revised glacier inventory based on topographic maps and aerial photos taken from 1956 to 1983 indicated that all the glaciers in the Qilian Mountains were receding, which is consistent with other mountains and plateaus in western China. In the past half century, the area and volume of glaciers decreased by 420.81βkm(-20.88%) and 21.63βkm(-20.26%), respectively. The glaciers which are smaller than 1.0βkmconstituted the main body of glacier number depression and area recession. Due to shrinkage, the glaciers below 4000βm a.s.l. completely disappeared.

DOI

[23]
Tian Hongzhen, Yang Taibao, Liu Qinping, 2014. Climate change and glacier area shrinkage in the Qilian mountains, China, from 1956 to 2010.Annals of Glaciology, 55(66): 187-197.Glaciers in the Qilian mountains, located in the northeastern part of the Tibetan Plateau, constitute an important freshwater resource for downstream populations and natural systems. To enhance our understanding of the variability of the glaciers, temporally and spatially comprehensive information on them is needed. In this study, the glacier outlines of ~1990, ~2000 and ~2010 for the whole area were delineated in a semi-automated manner using band TM3/TM5 ratio images of Landsat ETM+ or TM scenes with the help of a merged ASTER GDEM/SRTM v4.1 digital elevation model. Combining our own results with those of previously published studies that span the period back to 1956, we found that the glacier area shrank by 30 8% from 1956 to 2010 and the shrinkage accelerated remarkably in the past two decades. The linear trends of annual air temperature and precipitation measured at weather stations within the glacierized areas were 0.03-0.058C a-1 (significant only after 2000) and 0.37-1.58mm a-1 (not significant) respectively from 1961 to 2010. Glaciers shrank mainly due to the increasing temperature. Glaciers in the Qilian mountains are very unlikely to have experienced positive mass balance over the past decade. Moreover, given the trend toward higher temperatures, the glaciers in this region will continue to shrink.

DOI

[24]
Wang Hao, Luo Jing, Ye Jinyin et al., 2014. Comparative analysis of area rainfall in Huaihe River Basin estimated by CMORPH-Gauge merged data and observed rain gauge data.Journal of Hohai University (Natural Sciences), 42(3): 189-194. (in Chinese)Based on the CMORPH-Gauge merged data and observed rain gauge data,the daily area rainfall of 15 sub-catchments in the Huaihe River Basin was calculated during flood seasons( June to September) from 2008 to 2011,using the Thiessen polygon method and the grid arithmetic average method. Comparative statistical analysis was conducted on the results of the two methods. The results show that the two sets of area rainfall of the 15 subcatchments exhibited systematic differences and a significant linear correlation. The daily area rainfall also showed systematic difference. The area rainfall based on rain gauge data was generally greater than that based on the CMORPH-Gauge merged data. There was a strong correspondence for the magnitude between the two sets of area rainfall. The overall correspondence ratio was 78. 8%,with the ratio of rainfall values that differed by an order of magnitude being 20. 5%. The correspondence ratio for the light-rainfall magnitude reached 91. 4%.

DOI

[25]
Wang Puyu, Li Zhongqin, Gao Wenyu, 2011. Rapid shrinking of glaciers in the middle Qilian Mountain region of northwest China during the last 50 years.Journal of Earth Science, 22(4): 539-548.During the past five decades,fluctuations of glaciers were reconstructed from historical documents,aerial photographs,and remote sensing data.From 1956 to 2003,910 glaciers investigated had reduced in area by 21.7%of the 1956 value,with a mean reduction for the individual glacier of 0.10km2.The relative area reductions of small glaciers were usually higher than those of large ones,which exhibited larger absolute loss,indicating that the small glaciers were more sensitive to climate change than large ones.Over the past-50 years,glacier area decreased by 29.6% in the Heihe(黑河)River basin and 18.7% in the Beidahe(北大河)River basin,which were the two regions investigated in the Middle Qilian(祁连)Mountain region.Compared with other areas of the Qilian Mountain region,the most dramatic glacier shrinkage had occurred in the Middle Qilian Mountain region,mainly resuiting from rapid rising temperatures.Regional differences in glacier area changes are related to local climate conditions,the relative proportion of glaciers in different size classes,and other factors.

DOI

[26]
Wu Qiaoyan, Ruan Zhenxin, Chen Dake et al., 2015. Diurnal variations of tropical cyclone precipitation in the inner and outer rainbands.Journal of Geophysical Research: Atmospheres, 120(1): 1-11.Abstract Using 1565years (1998–2012) of satellite-measured precipitation data and tropical cyclone (TC) information, this study estimates the diurnal variations of TC precipitation in its inner core and outer rainbands. It is found that for both weak (tropical storms to category 1 TCs) and strong (categories 2–5 TCs) storms over all six TC basins, the TC precipitation reaches its daily maximum in the morning, but the mean rain rate and diurnal variations are larger in the inner core than in the outer rainbands. With increasing radial distance from the TC center, the diurnal amplitude of precipitation decreases, and the peak time appears progressively later. The outward propagation of diurnal signals from the TC center dominates as an internal structure of the TC convective systems. For all basins examined, the diurnal precipitation maximum within the inner core of a strong storm occurs earlier than the maximum observed in non-TC precipitation; the same result is not found for the outer rainbands. In the North Atlantic, the diurnal variations of TC precipitation in weak storms are much weaker than those in other basins, and the TC precipitation in strong storms shows a semidiurnal cycle in the inner core while exhibiting a clear diurnal cycle with a peak around noon in the outer rainbands.

DOI

[27]
Yin Xianzhi, Zhang Qiang, Xu Qiyun et al., 2009. Characteristics of climate change in Qilian Mountains region in recent 50 years.Plateau Meteorology, 28(1): 85-90. (in Chinese)Based on the observational air temperature and precipitation data at 5 meteorological stations in Qilian mountains region over 2800 m above sea level,the characteristic of climate change in recent 50 years are discussed.Annual mean air temperature of Qilian mountains region was on the rise during the recent 50 years,its abrupt change occured in middle of 1980s,while air temperature rose slowly before it and rapidly after it.Temperature rising rate of winter was higher than that of summer,meanwhile that of night was higher than that of daytime.And it was the highest in east and weast regions of Qilian mountains region.Simultaneously,the precipitation totally presented an increasing tendencyin Qilian mountains region.There were drought years in 1960s and 1970s.The more rain years are mostly in recent 20 years.Precipitation in spring and summer,and in west region of Qilian mountains region showed a markedincreasing tendency.

DOI

[28]
Yu Rucong, Li Jian, Chen Haoming et al., 2014. Progress in studies of the precipitation diurnal variation over contiguous China.Journal of Meteorological Research, 28(5): 877-902.

[29]
Yu Rucong, Zhou Tianjun, Xiong Anyuan et al., 2007. Diurnal variation of summer precipitation over contiguous China.Geophysical Research Letters, 34, L01704. doi: 10.1029/2006GL028129.Diurnal variations of summer precipitation over contiguous China are studied using hourly rain-gauge data from 588 stations during 1991 2004. It is found that summer precipitation over contiguous China has large diurnal variations with considerable regional features. Over southern inland China and northeastern China summer precipitation peaks in the late afternoon, while over most of the Tibetan Plateau and its east periphery it peaks around midnight. The diurnal phase changes eastward along the Yangtze River Valley, with a midnight maximum in the upper valley, an early morning peak in the middle valley, and a late afternoon maximum in the lower valley. Summer precipitation over the region between the Yangtze and Yellow Rivers has two diurnal peaks: one in the early morning and another in the late afternoon.

DOI

[30]
Zhang Yuanchun, Zhang Fuqing, Sun Jianhua, 2014. Comparison of the diurnal variations of warm-season precipitation for east Asia vs. north America downstream of the Tibetan Plateau vs. the Rocky Mountains.Atmospheric Chemistry and Physics, 14(19): 10741-10759.

[31]
Zhou Tianjun, Yu Rucong, Chen Haoming et al.Chen Haoming ., 2008. Summer precipitation frequency, intensity, and diurnal cycle over China: A comparison of satellite data with rain gauge observations.Journal of Climate, 21(16): 3997-4010.Hourly or 3-hourly precipitation data from Precipitation Estimation from Remotely Sensed Information using Artificial Neural Networks (PERSIANN) and Tropical Rainfall Measuring Mission (TRMM) 3B42 satellite products and rain gauge records are used to characterize East Asian summer monsoon rainfall, including spatial patterns in June ugust (JJA) mean precipitation amount, frequency, and intensity, as well as the diurnal and semidiurnal cycles. The results show that the satellite products are comparable to rain gauge data in revealing the spatial patterns of JJA precipitation amount, frequency, and intensity, with pattern correlation coefficients for five subregions ranging from 0.66 to 0.94. The pattern correlation of rainfall amount is higher than that of frequency and intensity. Relative to PERSIANN, the TRMM product has a better resemblance with rain gauge observations in terms of both the pattern correlation and root-mean-square error. The satellite products overestimate rainfall frequency but underestimate its intensity. The diurnal (24 h) harmonic dominates subdaily variations of precipitation over most of eastern China. A late-afternoon maximum over southeastern and northeastern China and a near-midnight maximum over the eastern periphery of the Tibetan Plateau are seen in the rain gauge data. The diurnal phases of precipitation frequency and intensity are similar to those of rainfall amount in most regions, except for the middle Yangtze River valley. Both frequency and intensity contribute to the diurnal variation of rainfall amount over most of eastern China. The contribution of frequency to the diurnal cycle of rainfall amount is generally overestimated in both satellite products. Both satellite products capture well the nocturnal peak over the eastern periphery of the Tibetan Plateau and the late-afternoon peak in southern and northeastern China. Rain gauge data over the region between the Yangtze and Yellow Rivers show two peaks, with one in the early morning and the other later in the afternoon. The satellite products only capture the major late-afternoon peak.

DOI

[32]
Zhou Xuan, Luo Yali, Guo Xueliang, 2015. Application of a CMORPH-AWS merged hourly grided precipitation product in analyzing characteristics of short-duration heavy rainfall over southern China.Journal of Tropical Meteorology, 31(3): 333-344. (in Chinese)The CMORPH-AWS merged hourly gridded precipitation product is evaluated in terms of representing the characteristics of short-duration heavy rainfall(≥15 mm/h) by comparing with rain gauge observations at the national observing stations, and then used to investigate the relationship between short-duration heavy rainfall and heavy rainfall days(≥50 mm/d) over southern China during April to October of 2008—2013. The main results are as follows:(1) Compared to the rain gauge records, the merged precipitation dataset can describe the main spatial characteristics of short-duration heavy rainfall correctly and better reflect the impact of terrains; however, it underestimates the rainfall intensity to a certain extent.(2) The seasonal variations of short-duration heavy rainfall are closely related to the break and outbreak period of East Asian Monsoon and the seasonal march of rain belts.(3) The short-duration heavy rainfall is closely related to heavy rainfall days. First, the spatial distribution characteristics are similar to their seasonal changes. Second, the weather backgrounds leading to heavy rainfall days tend to trigger short-duration heavy rainfalls in many circumstances, as over 60% short-duration heavy rainfalls occur in heavy rainfall days during late April to early October. Third, the short-duration heavy rainfall is a significant factor for formation of heavy rainfall days; the proportion of short-duration heavy rainfall days is 68.6% and that of heavy rainfall days without short-duration heavy rainfall is only 31.4%.

[33]
Zhu Xiaofan, Zhang Mingjun, Wang Shengjie et al., 2016. Diurnal variation characteristics of precipitation of Xinjiang in summer during 2008-2013.Chinese Journal of Ecology, 35(2): 478-488. (in Chinese)The diurnal variation characteristics of precipitation( such as hourly precipitation amount,frequency and intensity) of Xinjiang in summer during 2008-2013 were analyzed with0.1 gridded hourly precipitation dataset merged from automatic weather stations in China and the Climate Precipitation Center Morphing( CMORPH) precipitation product. The results showed that the diurnal variation features of hourly precipitation amount and frequency were similar; both indexes were much larger in northern Xinjiang than in southern Xinjiang and much larger in mountains than in basins,but the higher values of hourly precipitation intensity occurred more in arid basins. The values of hourly precipitation amount,frequency and intensity in most areas of Xinjiang were the largest in June and the least in August. In addition,the peak time of hourly precipitation amount and frequency had a parallel spatial pattern,and the latter was more prominent,in which the peak time of both indexes happened from 18: 00 to 23: 00 in mountains and from 0: 00 to 5: 00 in basins. Additionally,the precipitation amount in daytime and nighttime showed a similar spatial pattern. Moreover,the correlation between hourly precipitation amount and frequency was the highest,secondly by the correlation between hourly precipitation amount and intensity,while the correlation between hourly precipitation frequency and intensity was poor,especially in arid basins.

DOI

Outlines

/