Orginal Article

Drought characteristics of Henan province in 1961-2013 based on Standardized Precipitation Evapotranspiration Index

  • SHI Benlin , 1 ,
  • *ZHU Xinyu , 1 ,
  • HU Yunchuan 2 ,
  • YANG Yanyan 1
Expand
  • 1. College of Environment and Planning, Shangqiu Normal University, Shangqiu 476000, Henan, China
  • 2. College of Life Sciences, Shangqiu Normal University, Shangqiu 476000, Henan, China
*Corresponding author: Zhu Xinyu, PhD, E-mail:

Received date: 2016-03-10

  Accepted date: 2016-05-21

  Online published: 2017-03-30

Supported by

National Natural Science Foundation of China, No.41140019

No.41501263

The Key Program of Higher Education of Henan Province of China, No.15A180054

Copyright

本文是开放获取期刊文献,在以下情况下可以自由使用:学术研究、学术交流、科研教学等,但不允许用于商业目的.

Abstract

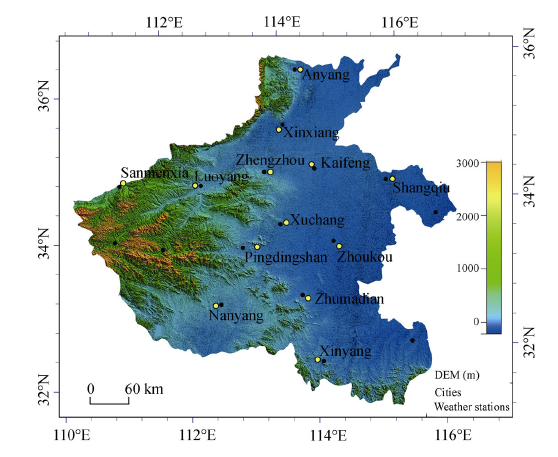
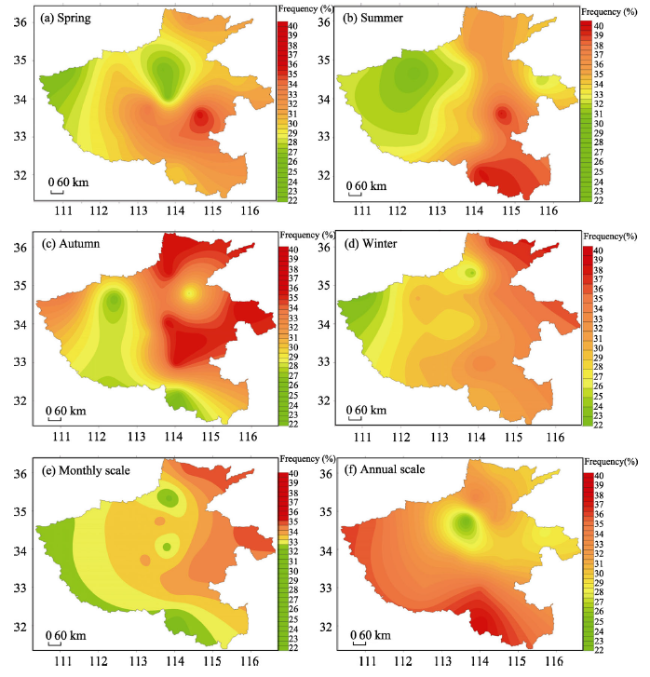
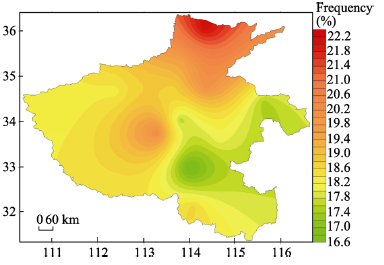
Drought is one of the most complex natural hazards affecting agriculture, water resources, natural ecosystems, and society. The negative societal consequences of drought include severe economic losses, famine, epidemics, and land degradation. However, few studies have analyzed the complexity of drought characteristics, both at multiple time scales and with variations in evapotranspiration. In this study, drought occurrences were quantified using a new drought index, the Standardized Precipitation Evapotranspiration Index (SPEI), based on observed data of monthly mean temperature and precipitation from 1961 to 2013 in Henan province, central China. Based on the SPEI values of each weather station in the study, the frequency and severity of meteorological droughts were computed, and the monthly, seasonal, and annual drought frequency and intensity over a 53-year period were analyzed. The spatial and temporal evolution, intensity, and the primary causes of drought occurrence in Henan were revealed. The results showed that the SPEI values effectively reflected the spatial and temporal pattern of drought occurrence. As the time scale decreased, the amplitude of the SPEI increased and droughts became more frequent. Since 1961, drought has occurred at the annual, seasonal, and monthly scales, and the occurrence of drought has increased. However, regional distribution has been uneven. The highest drought frequency, 35%, was observed in the Zhoukou region, while the lowest value, ~26%, was measured in central and western Henan. The most severe droughts occurred in the spring and summer, followed by autumn. Annually, wide-ranging droughts occurred in 1966-1968, 1998-2000, and 2011-2013. The drought intensity showed higher values in north and west Henan, and lower values in its east and south. The maximum drought intensity value was recorded in Anyang, and the minimum occurred in Zhumadian, at 22.18% and 16.60%, respectively. The factors with the greatest influence on drought occurrence are increasing temperatures, the Eurasian atmospheric circulation patterns, and the El Niño effect.

Cite this article

SHI Benlin , *ZHU Xinyu , HU Yunchuan , YANG Yanyan . Drought characteristics of Henan province in 1961-2013 based on Standardized Precipitation Evapotranspiration Index[J]. Journal of Geographical Sciences, 2017 , 27(3) : 311 -325 . DOI: 10.1007/s11442-017-1378-4

1 Introduction

As one of the most frequent and most complicated natural disasters, drought exerts relatively widespread effects on human society that usually last for several months or even a few years, causing huge economic loss, reduction in food yield, starvation and land degradation (Piao et al., 2010; Lobell et al., 2012; 2014; Asseng et al., 2015). As a country in the monsoon region of East Asia, China is climatically vulnerable to frequent meteorological disasters because of its geographical conditions and complex climatic changes (Jung et al., 2010). With the increasingly apparent climatic warming and drying, the occurrence of natural disasters increases considerably. It was noted in the 4th and 5th IPCC reports that the global surface temperature increased by 0.56 to 0.92℃ during the past century and that climatic warming will enhance the frequency and intensity of the occurrence of extreme meteorological disasters, thus exerting extremely widespread effects on agricultural eco-systems (IPCC, 2007; IPCC, 2013). Therefore, quantitative studies on the characteristics of temporal and spatial drought changes and the mechanisms of their formation are of great importance for the scientific management of agricultural eco-systems and for early warning of meteorological disasters.
In recent years, many scholars proposed a variety of drought indices for quantitative studies on drought occurrence and for monitoring trends of drought change (Yuan et al., 2004; Wu et al., 2015; Karabulut, 2015). Currently, the PDSI (Palmer Drought Severity Index) and the SPI (Standardized Precipitation Index) cannot comprehensively reflect the joint effects of temperature and precipitation on drought occurrence under the global circumstances of climatic changes (Palmer, 1965; McKee et al., 1993; Dai, 2011). Therefore, on the basis of the SPI, the SPEI (Standardized Precipitation Evapotranspiration Index) was proposed and became the most useful tool for monitoring the effects of drought occurrence processes and rising temperatures on drought (Vicente-Serrano et al., 2010a; 2010b). In recent years, this index was gradually accepted and applied by Chinese scholars. Xiong et al. (2013) investigated the characteristics of drought changes in China’s southwestern areas from 1961 to 2012 through adopting SPEI, and their results showed that drought has increased dramatically since 2000 in those areas. Using SPEI, Zhou et al. (2014) and Su et al. (2012) investigated the characteristics of drought occurrence in Shaanxi province and the relationship between low-frequency drought occurrence in Beijing and climatic indices. Li et al. (2010) adopted SPEI to investigate drought tendency in China from the late 1950s to 2009. These research results are in relative accordance with the historical records. As for the mechanisms for drought occurrence, investigations were mainly concentrated with the effects of land-air interactions on drought formation. However, changes in ocean temperature and the effects of large-scale annual climatic factors and climate warming on drought formation have become recognized as important factors (Mishra et al., 2010; Dai, 2011).
As a province located on the middle and lower reaches of the Yellow River, a middle-latitude zone in China, Henan province represents an area of transition between the subtropical zone and the warm temperate zone. Henan is characterized by extremely unevenly distributed precipitation and regular high temperatures, which usually generate frequent occurrences of meteorological disasters; drought is one of the most frequent natural disasters, with long duration and maximum area (Zhang et al., 2013). In recent years, increasing temperature and decreasing precipitation have aggravated the deterioration of the water resource environment of Henan. Additionally, since the 1970s the frequent seasonal channel cutoff of the Yellow River has brought about huge damage to the residents along the banks, leading to great loss in agricultural production and ecological environments. Therefore, the future trend and conditions of disaster development and the sustainable availability of water resources are of wide concern (Xu et al., 2014). Henan has become a main part of the Central Plains Economic Zone since its approval, and a typical agricultural area in the Huang-Huai-Hai Plain. Thanks to its unique geographical position, Henan has also become an important base for agricultural and sideline products, and for food production in China. Drought disasters exert relatively huge effects on agricultural development in Henan province. In recent years, studies on drought mainly focused on large-scale regional ranges and short time spans. Differences in views existed about the periodic occurrences of drought, their changing trend and causes and the effects of large-scale climatic factors on climatic components such as temperature and precipitation (Li et al., 2012). The comprehensive effects of drought indices were insufficiently researched in the main areas of agricultural crop production, and because of inadequate knowledge it is hard to comprehensively grasp the rules and mechanisms for the temporal and spatial changes in drought.
Because of the above-mentioned factors, we analyzed the frequency and intensity of drought occurrence in Henan province during the past 53 years and studied the characteristics of the temporal and spatial changes at various time scales on the basis of meteorological data consisting of daily temperatures and precipitation recorded from 1961 to 2013, and through the use of the drought index SPEI. The causes for drought in Henan were discussed to provide necessary support for policies concerning drought prevention and alleviation and to offer references for the evaluation, monitoring and forecast of drought situations in the future.

2 Study area

Henan province is located in the middle and lower reaches of the Yellow River in the central-east China, with a boundary ranging between 110°21′-116°39′E and 31°23′-36°22′N (Figure 1). As a province located in the warm temperate and subtropical zone, Henan is characterized by a humid and semi-humid monsoon climate featuring a cold winter with little rain and snow, a dry spring with frequent wind and blowing sand, a hot summer with abundant rains and a clear autumn with sufficient daily sunlight. The actual daily sunlight in the whole province ranges from 2000 to 2600 hours, average annual temperature ranges from 12℃ to 16℃ with the extreme maximum and minimum temperatures reaching 44.2℃ and 21.7℃, respectively. The frost-free period ranges from 180 to 240 days, and annual precipitation ranges from 500 to 900 mm, which decreases gradually from southeast to northwest. Affected by the monsoon, precipitations are unevenly distributed in Henan, and 50% of annual precipitation is concentrated in summer with frequent occurrences of heavy rains (Zhang et al., 2013). Four water systems, including the Yellow River, the Huaihe River, the Haihe River and the Yangtze River, flow across Henan (Fan et al., 2014).
Figure.1 Distribution of meteorological stations in Henan province

3 Material and methods

3.1 Data collection

The county-level and above-county-level observatory stations were selected, and monthly data of precipitation and average temperature recorded through on-the-spot surveys from 1961 to 2013 and collected from 21 ground observatory stations were analyzed. Because the time period for the inaccuracies and shortages in surveys conducted by three stations exceeded 360 days, data from 53-year on-the-spot surveys collected from another 18 stations with better data quality were investigated (Figure 1). Among these stations, 6, 3, 3, 3 and 3 are in the north, east, west, south, and middle of Henan province, respectively. The even distribution of these stations shows a relatively good regional representation. The above-mentioned data were provided by the Henan Provincial Meteorological Bureau and the Shangqiu Municipal Meteorological Bureau. We studied monthly, quarterly and yearly time scales in this research. Spring was designated as the period from March to May, summer from June to August, autumn from September to November and winter from December to February of the next year.

3.2 Methods

(1) Standardized Precipitation Evapotranspiration Index (SPEI)
SPEI can be calculated as follows (Li et al., 2012):
First, potential evapotranspiration (PET) is calculated according to Thornthwaite’s method:
where A represents a constant, H refers to annual heat index and Ti represents 30 day average temperature. Constants A and H are calculated as follows:
Second, the differences between annual monthly precipitation and evapotranspiration are calculated as:
where Di represents the difference between precipitation and evapotranspiration, Pi and PETi refer to monthly precipitation and evapotranspiration, respectively.
Third, Di data were sequentially normalized. Di is fitted using a log-logistic probability distribution F(x), and SPEI values corresponding to each Di value were calculated according to formulas (7) and (8). If the cumulative probability P ≤ 0.5, these values can be calculated as follows:
where d1=1.432788, d2=0.189269, d3=0.001308, c0=2.515517, c1=0.802853, and c2= 0.010328.
If P>0.5, P value can be represented by 1-P:
SPEI has characteristics of being calculated over particular time scales. The month-scale SPEI can relatively clearly reflect the delicate changes in drought processes, whereas the 3-month-scale SPEI can mirror the conditions of seasonal drought (Li et al., 2012). The average annual SPEI (month-scale) values of 18 meteorological stations can be adopted to represent month-scale SPEI values for Henan. Meteorologically, January, April, July and October are designated as representative months for winter, spring, summer and autumn, respectively. Therefore, the average SPEI values of these 4 months obtained from 18 stations were applied as season-scale SPEI values for Henan province. Altogether, the 12 monthly scales constitute an annual scale. The average SPEI value of these 18 meteorological stations was adopted as the average annual scale for SPEI values in this province.
(2) Probability of drought occurrence
The probability of drought occurrence p can be calculated by the following:
where n refers to the frequency of drought occurrence in a data sequence, and N represents the number of data points in the sequence.
(3) Intensity of drought occurrence
In this research, a continuous 3-month occurrence of slight-level drought and above-slight-level drought (represented by the month-scale value of SPEI) was called a continuous drought process. According to the definition of a continuous drought process, month-scale values of SPEI in a continuous 3-month occurrence of slight-level drought and above-slight- level drought were selected, and month-scale values of SPEI were designated according to drought levels and probabilities described in the reference (Zhou et al., 2014) (Table 1), and the intensity of drought occurrence in the research area was calculated as the average value of the above-mentioned SPEI values.
Table 1 SPEI drought gradation hierarchies and corresponding cumulative probability
Extreme drought Severe drought Moderate drought Slight drought Normal years
SPEI value ≤-2.0 ≤-1.5 ≤-1.0 ≤-0.5 -0.5 to 0.5
Cumulative probability (%) 2.28 4.40 15.87 30.85 50.00

4 Results

4.1 Characteristics of various time scales of drought

Rules for SPEI value fluctuation were significantly different for different time scales. With the expansion of time scales, such fluctuation gradually decreased, whereas the 3-month- scale fluctuation magnitude was relatively large from 1997 to 2002 (Figure 2). Month-scale SPEI values (SPEI-1) fluctuated within the maximum magnitude, 3-month-scale SPEI values (SPEI-3) had a slightly longer fluctuation period than that of SPEI-1, and 12-month- scale SPEI values (SPEI-12) remained relatively stable. Therefore, SPEI values under different time scales can reflect the changing conditions of drought and wetness in all parts of Henan. Affected by monthly temperature and changes in water conditions, SPEI-1 can reflect soil content more accurately and is applicable to the stipulation of drainage and irrigation periods for agricultural production. Affected by the effects of seasonal and annual precipitation and temperature, SPEI-3 and SPEI-12 can better mirror water contents within underground soil layers.
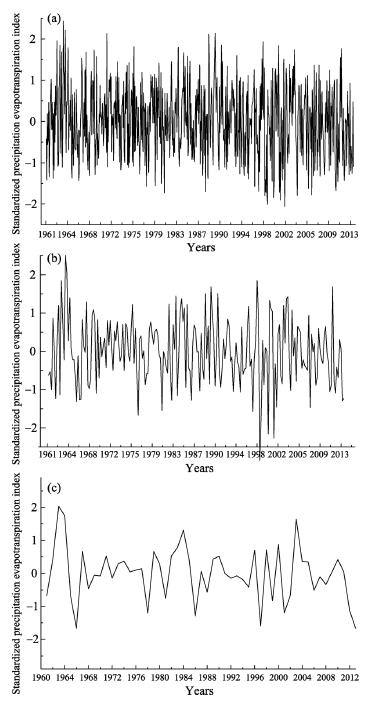
Figure.2 SPEI values at different time scales in Henan from 1961 to 2013
(Note: A, B, and C represent month-scale, season-scale, and year-scale SPEI values, respectively)
The changing trend of average SPEI values at different time scales from 1961 to 2013 was shown in Figure 3. It can be clearly seen that average annual SPEI-1 values fluctuated most smoothly, followed by average annual SPEI-3 values, and that average annual SPEI-12 values had maximum magnitude fluctuations. The SPEI-12-characterization of drought was in accordance with the historically recorded conditions in Henan. For example, the typical drought years in this province included 1966 (Severe Drought), 1978 (Moderate Drought), 1986 (Moderate Drought), 1997-1998 (Moderate-Slight Drought), 2000-2001 (Slight-Moderate Drought) and 2012-2013 (Moderate-Extreme Drought). Through the utilization of the Mann-Kendall mutation test (MK test), the average annual SPEI values in Henan recorded from 1961 to 2013 were analyzed, and the results are shown in Figure 4. It is obvious that most UF values were below 0, with a trend of decrease-increase-decrease and a general trend of slow decrease within fluctuations (Figure 4). In the 1980s, the UF value began to mutate and decrease; the concrete mutation point occurred in 1987.
Within the range of the confidence test line, mutation points appeared in 1965, 1983 and 2008, respectively.

4.2 Characteristics of the spatial distribution of drought

At the seasonal scale, spring droughts mainly occurred in the east, south and north of Henan with relatively huge differences among different regions (Figure 5). The maximum frequency of spring drought, over 35%, appeared in Zhoukou, followed by values in Pingdingshan and Zhumadian, reaching over 33%; values in the middle and west of Henan province were the minimum, approximately 26%. Summer droughts occurred more frequently than spring droughts, with slight differences among different regions. The low frequency of summer drought occurrence appeared in the west of Henan province, reaching approximately 30%. The maximumfrequency of summer drought occurrence was in the south of Henan, approaching 40%, and the frequency of summer drought occurrence in other parts of Henan ranged from 30% to 35%. The frequency of autumn drought occurrence was over 35% throughout the province except for the southwest and Xinyang in the south of Henan province, where the frequency of autumn drought occurrence ranged from 26% to 28%. Therefore, the frequency of autumn drought occurrence was generally lower than that of summer drought occurrence with relatively small regional differences. The frequency of winter drought occurrence was higher in the east than in the west, with relatively large differences. The frequency of winter drought occurrence was relatively higher in the north and east of Henan province, approximately 35% to 37%, with values in the middle and southwest of Henan province ranging from 30% to 33% and relatively low values in the west of Henan province, especially in Sanmenxia where the frequency of winter drought occurrence was only 22.64%.
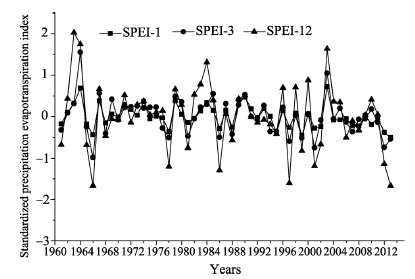
Figure.3 The annual SPEI values at different time scales in Henan from 1961 to 2013
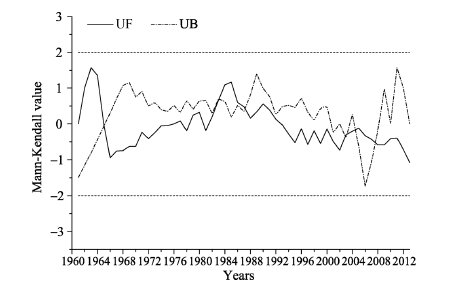
Figure.4 Mann-Kendall test for annual SPEI-12 series in Henan from 1961 to 2013
At the monthly scale, the frequency of drought occurrence was generally high, all having values over 32%. The maximum values were over 35% in the north and east of Henan, while they were relatively low in the west, southwest and south of Henan and were a minimum of approximately 32% in Xinxiang, Luoyang and Xinyang. Regional differences were relatively small at the monthly scale of drought occurrence frequency in Henan province.
At the annual scale, the frequency of drought occurrence was relatively high in the west, southwest and south of Henan province, all more than 35%, and was relatively low in the north, middle and east of Henan province, especially in Zhengzhou where the minimum was approximately 24%. Regional differences were relatively large at the annual scale of drought occurrence frequency and unevenly distributed in Henan province.

4.3 Distribution of drought occurrence intensity

4.3.1 Occurrence of continuous drought
Among the areas that had over 3 months of continuous drought occurrence, Zhengzhou was the one that had the most frequent occurrence, 23 over the past 53 years. Meanwhile, Xuchang, Luoyang and Sanmenxia had the least frequent droughts, 12-13. The longest drought duration appeared in Xihua County in the southwest of Zhoukou in 1986, lasting 8 months (within 1 drought). Frequency of over 5 months of continuous drought occurrence was 25, including 9 occurrences in the 1960s (in 1961, 1965, 1966 and 1968), 2 occurrences in the 1980s (concentrated in 1968), 7 occurrences in the 1990s (in 1992, 1997 and 1998-1999) and 7 occurrences from 2000 to 2013 (4 in 2013, 1 in 2001, 1 in 2008-2009 and 1 in 2011). Therefore, in the 1960s, 1990s and 2013, a large range of continuous drought occurred in Henan province, which was relatively in line with the actual conditions.
Figure.5 Drought frequency distribution at different scales in Henan
Figure.6 Spatial distribution characteristics of drought intensity in Henan
It is shown that the intensity of drought occurrence in Henan province was the minimum in the east and south, followed by the west and middle, and the value was the maximum in the north (Figure 6). Zhumadian in the south of the province had the weakest intensity of drought occurrence, 16.60%, followed by values reaching 17.52% and 17.70% in Shangqiu and Xuchang, respectively, both lower than 20%. Anyang in the north of Henan province had the strongest intensity of drought occurrence, 22.18%, followed by values of 21.12% and 20.23% in Kaifeng in the east and Pingdingshan in the west, respectively.
4.3.2 Distribution of moderate and above-moderate droughts
It is shown that in spring, moderate and above-moderate droughts mainly occurred in the east of eastern Henan province and the north of southern Henan, and relatively rarely occurred in the southwest of northern Henan and the south of southern Henan (Figure 7a). Shangqiu in the east of Henan and Zhumadian in the south of Henan had the maximum frequencies of drought occurrence, both amounting to more than 20%. Xinyang in the south of Henan had the minimum frequency of drought occurrence, less than 10%. Frequency of drought occurrence in other parts of Henan ranged from 11% to 18% with relatively large regional differences. In summer, moderate and above-moderate droughts mainly occurred in the middle of Henan (Figure 7b). Xuchang in the middle of Henan had the maximum frequency of drought occurrence, 22.64%, whereas Xinyang in the same area had the minimum frequency of drought occurrence, 11.32%. Meanwhile, frequencies of drought occurrence in other parts ranged from 15% to 18% with regional differences smaller than those in spring. In autumn, the frequency of moderate and above-moderate drought occurrence was generally low (Figure 7c). Kaifeng in the east of the province had the maximum frequency, 18.87%, whereas Xuchang in the middle of the province had the minimum frequency, less than 10%, and frequencies of drought occurrence in other parts ranged from 11% to 16% with slight regional differences. In winter, there were relatively large regional differences in the occurrence frequency of moderate and above-moderate droughts, with high frequencies in the east and low frequencies in the west (Figure 7d). Anyang in the north and Zhoukou in the middle of Henan province had the maximum frequencies of moderate and above-moderate drought occurrence, both 20.75%, followed by Xinyang in the south, with 18.87%. Sanmenxia in the west of Henan province had the lowest value, only 7.55%, and values in other parts ranged from 11% to 15%.
At the monthly scale, the frequency of drought occurrence was higher in the east and middle of Henan province and was lower in the north, south and west, with relatively small regional differences (Figure 7e). Shanqgiu in the east had the highest frequency of drought occurrence, 21.22%, followed by Zhoukou in the east, with 19.81%, whereas Xinxiang in the north and Kaifeng in the east had the highest frequencies of drought occurrence, both with 16.35%; in other parts, the values ranged from 16% to 18%.
Figure.7 Moderate or above drought frequency distribution at different scales in Henan
At the annual scale, the frequency of drought occurrence was higher in the north and south of Henan province and was lower in the east and west with relatively small regional differences (Figure 7f). Kaifeng in the east had the highest frequency of drought occurrence, amounting to 22.64%, followed by Zhumadian and Xinxiang in the south, both with 20.75%, whereas Shangqiu and Zhoukou in the east and Luoyang in the west had the lowest frequency of drought occurrence, 15.09%.

5 Discussion

(1) The SPEI values at different time scales recorded over the recent 53-year period shows that drought trends have increased significantly since the 1980s. According to the MK mutation test and within confidence test lines, mutation points occurred in 1965, 1983 and 2008, and the occurrences of drought at these points were in accordance with the actual conditions (EBMDC, 2005). When the annual scale SPEI value in the testing year gradually changed into a relatively low value, relatively severe drought would appear, which was mainly because different fluctuation amplitudes, periods and initial positions of SPEI values at different time scales may bring about severe droughts caused by the superposition of different time scales of droughts at particular time points. Meanwhile, at short time scales (3 months), SPEI values mainly exhibited seasonal scale changes, and when SPEI values at annual scales were relatively lower, such values would accumulate with those at short time scales, thus causing extreme droughts.
(2) Seasonal droughts in Henan province are relatively severe in spring and summer, moderate in autumn, and the weakest in winter. As a core pilot area for food production in the Central Plain Economic Zone, Henan province demands relatively large amounts of water. However, precipitation in Henan is unevenly distributed, mainly concentrates in July and August and is not very abundant. Additionally, relatively small amounts of rainfall in summer with relatively large annual changes, precipitation reduction and temperature increase over the recent 53-year period have resulted in relatively severe drought in spring and summer (Zhu et al., 2012; Shi et al., 2012; Xu et al., 2014). Moreover, drought represents a major relatively frequent meteorological disaster in Henan province. Since the founding of New China, severe spring droughts, summer droughts and continuous droughts have occurred in 1966-1968, 1998-2000 and 2011-2013 in Henan province (EBMDC, 2005). Since the beginning of the 21st century, temperatures in a vast number of areas in China have been increasing and are higher than those at the same period of the non-drought years. Average monthly temperatures in drought areas of north China increased by 0.5-2℃ compared with those in non-drought years. Increasing temperatures caused the acceleration of soil water evaporation, which further promotes the rapid development of drought conditions in combination with the occurrence of El Nino phenomena (Sutanto et al., 2015).
(3) Henan province, located in the middle and lower reaches of the Yellow River, namely the transition area of south and north climates and of the secondary and tertiary gradients from east to west, represents an important base for food production in the Central Plains Economic Zone. Frequent meteorological disasters (especially drought) occurring after the founding of New China greatly restrained food production and sustainable development in this zone (Zhu et al., 2012). In the most recent 50 years, the trend of climatic warming was relatively obvious in this zone with huge precipitation fluctuations and frequent drought disasters (Shi et al., 2012). Relevant research showed that the trend of climatic warming was obvious in Henan province over the past 50 years, with huge precipitation fluctuations and with temperature increase and precipitation reduction bringing about more frequent droughts (Shi et al., 2012; Zhang et al., 2013). The results of Xu et al. (2014) showed that in spring and summer in the Huang-Huai-Hai Plain, the increasing temperature led to an increasing tendency for drought occurrence. Additionally, evaporation in spring was far greater than precipitation. Since late October, 2008, no effective rainfall had appeared in Henan province within 100 days and precipitation from 2008 to 2009 was extremely small in Henan’s historical record; meanwhile, extremely severe droughts afflicted 63.1% of the area of Henan province (2009-02-04). According to the characteristics of atmospheric circulation in typical drought-occurring years and due to the strong stability of atmospheric circulation in Eurasia, the seasonal changes in the intensity and location of western Pacific subtropical high pressure zones and Siberian high pressure zones could readily bring about droughts in the middle and lower reaches of the Yellow River (Xu et al., 2014). Abnormal atmospheric circulation led to relatively weak cold and hot air masses that could not converge at the basins of the Yellow River and Huaihe River, thus causing the occurrence of droughts in Henan province. In addition, the relatively weak warm and wet airflow over Henan also affected the occurrence of droughts. For example, from the end of 2008 to 2009, the prevailing northwest airflow over Henan was accompanied by dry and cold air and winds, whereas southwest warm and wet airflow, which can bring about effective precipitation, did not appear. Effective precipitation cannot come only from dry and cold air; therefore, drought can develop and be maintained (2009-02-04). ENSO (El Nino phenomenon) is the main embodiment of the interactions between sea and air, and exerts relatively large effects on drought disasters in Henan province. From the comparison analysis of ENSO events occurring in the past decades and drought conditions in the study area (Sutanto et al., 2015), our results clearly show that the occurrence of ENSO events was closely related to drought occurrence in Henan province, and the fact that drought occurred in the same year or in the year following ENSO occurrence became a general rule. For example, ENSO events that occurred from 1965 to 1966, from 1997 to 1998 and from 2009 to 2010 were closely related to the occurrences of large-range continuous drought from 1966 to 1968, from 1998 to 2000 and from 2011 to 2013, respectively, indicating that ENSO events increased the frequency of drought occurrence.
(4) In this paper, through the adoption of SPEI, the rules for the temporal and spatial changes of drought over the recent 53-year period in Henan province were analyzed at various time scales. SPEI integrated the roles of evapotranspiration in the formation of drought and, in the recognition of the characteristics of drought occurrence in Henan province over the past 53 years, better embodied the responses of drought to global warming since the 1980s. SPEI provides a necessary basis for the monitoring and early warning of drought occurrences in other regions. However, if SPEI is applied, the annual precipitation in the research area should also be considered. The results of Zhuang et al. (2013) showed that SPEI cannot better reflect the conditions of regional drought monitoring in areas where annual precipitation amounts to less than 200 mm because relatively small evapotranspiration and precipitation bring about limitations in analyses at small scales (such as 1-month, 3-month and 6-month scales). The annual precipitation in Henan province ranges from 500 mm to 900 mm. Therefore, SPEI can better reflect the rules for the temporal and spatial changes of drought in the recent 53 years in Henan province. Additionally, given that the scale classifications of the SPEI drought indices were not constant values, the conditions of scale classifications in different regions were diverse, which led to ambivalences in evaluating the frequency and grade of drought occurrences. Therefore, research concerning this aspect should be strengthened in the future. In this paper, drought formation and its mechanisms of occurrence were discussed from such aspects as global climatic changes, atmospheric circulations, and ENSO phenomena. However, drought formation is related to a variety of factors, for example, water resource conditions, human activities, geomorphology, relative humidity and wind speed, which have relatively large effects on drought formation (Barnett et al., 2008; Xu et al., 2014). Therefore, issues concerning the mechanism of drought occurrence and the detailed causes of small-range disaster occurrence should be of urgently concern in the future.

6 Conclusions

(1) The rules for the fluctuation of SPEI values in Henan province in the past 53 years were different at different time scales, and SPEI values fluctuated with huge amplitudes at smaller time scales, demonstrating that such values can better reflect the temporal characteristics of drought changes and the conditions of dryness and wetness evolution in Henan province. It was shown in MK mutation tests that drought increased significantly in Henan province after 1987.
(2) Frequency of drought occurrence was higher at monthly scales than at annual scales, and drought was more severe in spring and summer, followed by drought in autumn. Drought occurrences were extremely unevenly distributed among different regions, the highest drought frequency, 35%, was observed in Zhoukou, while the lowest value, 26%, was measured in the middle and west of Henan province.
(3) With respect to the characteristics of the distribution of drought occurrence intensities, such intensities were higher in the north of Henan province and in the east of western Henan province, and lower in the east of Henan province and in the north of southern Henan province. The maximum drought intensity value was recorded in Anyang, and the minimum occurred in Zhumadian, at 22.18% and 16.60%, respectively. In the inter-annual variations, from 1966 to 1968, from 1998 to 2000 and from 2011 to 2013, vast ranges of continuous droughts occurred in Henan province, and Anyang and Pingdingshan had the maximum intensities of drought occurrence.

The authors have declared that no competing interests exist.

[1]
Asseng S, Ewert F, Martre P et al.Martre P ., 2015. Rising temperatures reduce global wheat production.Nature Climate Change, 5(2): 143-147.Crop models are essential tools for assessing the threat of climate change to local and global food production(1). Present models used to predict wheat grain yield are highly uncertain when simulating how crops respond to temperature(2). Here we systematically tested 30 different wheat crop models of the Agricultural Model Intercomparison and Improvement Project against field experiments in which growing season mean temperatures ranged from 15 degrees C to 32 degrees C, including experiments with artificial heating. Many models simulated yields well, but were less accurate at higher temperatures. The model ensemble median was consistently more accurate in simulating the crop temperature response than any single model, regardless of the input information used. Extrapolating the model ensemble temperature response indicates that warming is already slowing yield gains at a majority of wheat-growing locations. Global wheat production is estimated to fall by 6% for each degrees C of further temperature increase and become more variable over space and time.

DOI

[2]
Barnett T P, Pierce D W, Hidalgo H G et al.Hidalgo H G ., 2008. Human-induced changes in the hydrology of the Western United States.Science, 319(5866): 1080-1083.

[3]
Dai A G, 2011. Drought under global warming: A review. Wiley Interdisciplinary Reviews.Climate Change, 2(1): 45-65.

[4]
Editorial Board of Meteorological Disasters in China(EBMDC), 2005 . The Meteorological Disasters in China · Henan Volume. Beijing: China Meteorological Press, 11-116. (in Chinese)

[5]
Fan Q D, Liang G F, Ma S X, 2014. Analysis on ecosystem service change based on land use in Henan province. Journal of Henan Agricultural University, 48(2): 224-228. (in Chinese)Ecosystem service change research based on Land Use / Coverage Change is the basic fields of global environment change research. With the aim to investigate variations in ecosystem services in response to land use changes,techniques of geographic information system and methods of COSTANZA and Xie Gao-di were integrated into the evaluation model to calculate the ecosystem services value in Henan province from 1990 to 2010. The result shows that: the index of total change of land use is 1. 7% which has led to the ecosystem service value of 6 109yuan. Henan ecosystem service has fallen down in this term. If there is little change of area of cultivated land and woodland,change of area of water is the most important factor affecting the decreasing of ecosystem service value. This paper can make a base of ecosystem service change which based on pattern and process,and provide suggestion for government to make decisions.

[6]
IPCC, 2007. Climate Change 2007: The Physical Science Basis, Summary for Policy Makers. Paris: IPCC WGI Fourth Report, 195-199.Each of the last three decades has been successively warmer at the Earth’s surface than any preceding decade since 1850, reports the Summary for Policymakers of the IPCC Working Group I assessment report, Climate Change 2013: the Physical Science Basis, approved on Friday by member governments of the IPCC in Stockholm, Sweden. Human influence on the climate system is clear and his is evident in most regions of the globe, the new assessment by the Intergovernmental Panel on Climate Change (IPCC) concludes.

[7]
IPCC, 2013. Working Group I Contribution to the IPCC Fifth Assessment Report, Climate Change 2013: The Physical Science Basis: Summary for Policymakers. [2013-10-28].

[8]
Jung M, Reichstein M, Ciais Pet al., 2010. Recent decline in the global land evapotranspiration trend due to limited moisture supply.Nature, 467(7318): 951-954.More than half of the solar energy absorbed by land surfaces is currently used to evaporate water. Climate change is expected to intensify the hydrological cycle and to alter evapotranspiration, with implications for ecosystem services and feedback to regional and global climate. Evapotranspiration changes may already be under way, but direct observational constraints are lacking at the global scale. Until such evidence is available, changes in the water cycle on land61a key diagnostic criterion of the effects of climate change and variability61remain uncertain. Here we provide a data-driven estimate of global land evapotranspiration from 1982 to 2008, compiled using a global monitoring network, meteorological and remote-sensing observations, and a machine-learning algorithm. In addition, we have assessed evapotranspiration variations over the same time period using an ensemble of process-based land-surface models. Our results suggest that global annual evapotranspiration increased on average by 7.165±651.065millimetres per year per decade from 1982 to 1997. After that, coincident with the last major El Ni09o event in 1998, the global evapotranspiration increase seems to have ceased until 2008. This change was driven primarily by moisture limitation in the Southern Hemisphere, particularly Africa and Australia. In these regions, microwave satellite observations indicate that soil moisture decreased from 1998 to 2008. Hence, increasing soil-moisture limitations on evapotranspiration largely explain the recent decline of the global land-evapotranspiration trend. Whether the changing behaviour of evapotranspiration is representative of natural climate variability or reflects a more permanent reorganization of the land water cycle is a key question for earth system science.

DOI PMID

[9]
Karabulut M.2015. Drought analysis in Antakya-Kahramanmaraş Graben, Turkey.Journal of Arid Land, 7(6): 741-754.

[10]
Li W G, Hou M T, Chen H L, 2012. Study on drought trend in south China based on standardized precipitation evapotranspiration index.Journal of Natural Disasters, 21(4): 84-90. (in Chinese)In recent years,drought in south China occurred frequently.In order to investigate the trend of drought in this region,the standardized precipitation evapotranspiration index(SPEI) and monthly precipitation and average temperature data from the representative 50 sites in South China during 1961-2010 were used to analyze the drought trend,the space distribution of extreme drought events,the drought occurrence frequency and drought duration in the region during nearly 50 years.The results show that south China is meeting with a widespread drought trend.The most severe drought has occurred in the last 10 years.Based on the method of Mann-Kendall test,it is known that the average SPEI index of the region mutated from 1998.The most severe drought area is the southern and western parts of Guangxi Province and Hainan Island,while the drought trend in Guangdong Province is the lightest.The extreme drought event occurred scarcely during the 1970s,and extreme drought events significantly increase subsequently and the drought duration extended.Significant temperature rise and weak increase in precipitation in this region resulting in the increase in potential evapotranspiration,which is probably the main reason of the drought trend in South China.The fact indicates that SPEI is a good drought trend indicator under climate warming.In addition,the high frequency of occurrence of extreme drought events is partly attributed to the decreased frequency of precipitation events and the rainfall concentration in recent years.

DOI

[11]
Lobell D B, Roberts M J,Schlenker WS . et al.2014. Greater sensitivity to drought accompanies Maize yield increase in the U.S. Midwest. Science, 344(6183): 516-519.

[12]
Lobell D B, Sibley A, Ortiz-Monasterio J I, 2012. Extreme heat effects on wheat senescence in India.Nature Climate Change, 2(3): 186-189.An important source of uncertainty in anticipating the effects of climate change on agriculture is limited understanding of crop responses to extremely high temperatures1, 2. This uncertainty partly reflects the relative lack of observations of crop behaviour in farmers fields under extreme heat. We used nine years of satellite measurements of wheat growth in northern India to monitor rates of wheat senescence following exposure to temperatures greater than 34 C. We detect a statistically significant acceleration of senescence from extreme heat, above and beyond the effects of increased average temperatures. Simulations with two commonly used process-based crop models indicate that existing models underestimate the effects of heat on senescence. As the onset of senescence is an important limit to grain filling, and therefore grain yields, crop models probably underestimate yield losses for +2 C by as much as 50% for some sowing dates. These results imply that warming presents an even greater challenge to wheat than implied by previous modelling studies, and that the effectiveness of adaptations will depend on how well they reduce crop sensitivity to very hot days.

DOI

[13]
McKee T B, Doesken N J, Kleist J, 1993. The relationship of drought frequency and duration to time scales // Proceedings of the 8th Conference on Applied Climatology. Boston, MA: American Meteorological Society, 17(22): 179-183.

[14]
Mishra A K, Singh V P, 2010. A review of drought concepts.Journal of Hydrology, 391(1/2): 202-216.Owing to the rise in water demand and looming climate change, recent years have witnessed much focus on global drought scenarios. As a natural hazard, drought is best characterized by multiple climatological and hydrological parameters. An understanding of the relationships between these two sets of parameters is necessary to develop measures for mitigating the impacts of droughts. Beginning with a discussion of drought definitions, this paper attempts to provide a review of fundamental concepts of drought, classification of droughts, drought indices, historical droughts using paleoclimatic studies, and the relation between droughts and large scale climate indices. Conclusions are drawn where gaps exist and more research needs to be focussed.

DOI

[15]
Palmer W C, 1965. Meteorological Drought. Washington DC, USA: US Department of Commerce, Weather Bureau.

[16]
Piao S L, Ciais P, Huang Y et al.Huang Y ., 2010. The impacts of climate change on water resources and agriculture in China.Nature, 467(2): 43-51.Abstract China is the world's most populous country and a major emitter of greenhouse gases. Consequently, much research has focused on China's influence on climate change but somewhat less has been written about the impact of climate change on China. China experienced explosive economic growth in recent decades, but with only 7% of the world's arable land available to feed 22% of the world's population, China's economy may be vulnerable to climate change itself. We find, however, that notwithstanding the clear warming that has occurred in China in recent decades, current understanding does not allow a clear assessment of the impact of anthropogenic climate change on China's water resources and agriculture and therefore China's ability to feed its people. To reach a more definitive conclusion, future work must improve regional climate simulations-especially of precipitation-and develop a better understanding of the managed and unmanaged responses of crops to changes in climate, diseases, pests and atmospheric constituents.

DOI PMID

[17]
Rare drought occurred in the history of China and nearly forty percent of winter wheat was afflicted, 2009-02-04. (in Chinese)

[18]
Shi B L, Zhu X Y,Li H Z et al.., 2012. Impacts of climate change on winter wheat yield in central plains of China: Case study of Shangqiu.Geographical Research, 31(1): 14-22. (in Chinese)Global climate change has significant impacts on agricultural production.Climate variability adversely impacts crop production and imposes a major constraint on farming planning,mostly on how to enhance the yileds of winter wheat,across the world.Owing to the fundamental importance of food to human welfare and of climate to crop and livestock production,various investigations showed that agriculture has been a focus of research on the impacts of climate change on wheat yield.However,considering the recent investigations in the field of the impacts of climate change on wheat yield,many studies were focused on the climate change in large scale regions.Few studies have been done with respect to the impacts of climate change on wheat yields in small scale regions.Therefore,in order to determine the effects of the climate changes on winter wheat yields in the Central Plains,taking Shangqiu,Henan as a study area,the climate data and wheat yields of observation stations from 1991 to 2010 were used in analyses with principal component analysis,correlation analysis,multiple linear regression analysis and Thornthwaite Memoriae model.The prediction results in the future and possible increase extent of the climate productivity of winter wheat were discovered.The results showed that winter wheat yields increased with fluctuations in recent 20 years.The results of principal component analysis illustrated that the main factors affecting winter wheat yields were temperature,precipitation,evaporation and extreme temperature.Excessive evaporation and extreme low temperature had adverse effects on the winter wheat production.The warm-wet climate was beneficial to wheat production,while the cold-dry climate was detrimental to wheat production.In the future decades,the climate variation will present a warm-wet tendency,which could be favorable to the grain yields in the Central Plains,especially in Shangqiu.

DOI

[19]
Su H X, Li G Q, 2012. Low-frequency drought variability based on SPEI in association with climate indices in Beijing.Acta Ecologica Sinica, 32(17): 5467-5475. (in Chinese)Drought occurs in nature when precipitation is significantly lower than normal.When lasting many months or even years in a large area,drought will develop into a natural hazard that permanently damages the environment and causes great economic losses.Thus,improving our knowledge about the variability and impacts of drought is fundamental to quantify the drought hazard and improve the prediction and drought mitigation.Beijing is located in the middle and lower reaches of Haihe River Basin,which belong to a temperate continental monsoon climate zone.The precipitation distribution is very uneven,and often accompanied by high temperature.So drought is one of the most frequently and enduring natural hazard that influences most area in Beijing,north China.In this paper,we analyzed the variability and possible teleconnections between drought occurrences and large-scale climate indices between 1868—2010 in Beijng,such as El Nio-Southern Oscillation(ENSO),North Atlantic Oscillation(NAO),Arctic Oscillation(AO),and Pacific Decadal Oscillation(PDO).The drought occurrences were quantified by a new drought index,Standardized Precipitation Evapotranspiration Index(SPEI) based on the data of monthly mean temperature and precipitation.The SPEI considers not only precipitation but also temperature data by means of evapotranspiration in calculation,allowing for a more complete approach to explore the effects of climate changes on drought occurrences under global warming.The SPEI can also be calculated at several time scales to adapt to the critical times of responses to drought in target natural and economic systems and to determine their resistance to drought.Local historical drought hazard records in Beijing since 1868 were used to improve the validation of SPEI.We then used the method of continuous wavelet transform(CWT) to analyze inter-decadal and decadal oscillation in the time and frequency of drought.Finally,we analyzed the correlations between SPEI and four large scale climate indices through the cross wavelet transform(XWT).The good agreement between SPEI and historical drought records proves that SPEI can effectively reflect the intensity and duration of drought in multi-temporal dimension in this region.SPEI of Beijing had 80—120 month,250 month,and 480 month oscillation circles,which was similar to the pattern of the four large-scale climate indices.The significant coherence was found between SPEI and the four large-scale climate indices.There were the common patterns of 100—120 month decadal and 250 month inter-decadal oscillation circles between SPEI and NAO,AO,PDO,as well as a common pattern of 32—64 month inter-decadal oscillation circle between SPEI and ENSO during the whole period.There was a clear lag time(2—6 months) during the coherence circle.Therefore,we can forecast the future drought variations in Beijing based on the data of large scale climate indices and SPEI,which is useful for water resources management and agriculture.This article is an initial step to application of the new multi-scalar SPEI drought index in studying the drought variability and impacts in China.

DOI

[20]
Sutanto S J, Hoffmann G, Worden J et al.., 2015. Atmospheric processes governing the changes in water isotopologues during ENSO events from model and satellite measurements.Journal of Geophysical Research Atmospheres, 120(13): 6712-6729.Abstract ENSO (El Ni09o–Southern Oscillation) has profound effects on the global water cycle, which can be examined at the process level by investigating the associated water isotopologues. Many isotope-based studies are aimed at understanding ENSO variability in the tropics, however, focusing principally on near-surface processes and isotopologue signals. The goal of the present study is to investigate the atmospheric processes governing the changes in the isotopic composition of water vapor both near the surface and at midtroposphere in the Pacific region during ENSO events, using a combination of remote sensing data and model simulations. For the lower atmosphere (i.e., 100065hPa), our results show that rainout processes, less rain reevaporation of falling droplets, and increase of convective updrafts and diffusive exchange within the convective systems contribute to “the isotope amount effect” and isotopically deplete the water vapor during wet conditions, in agreement with previous studies. However, we find that the ENSO-associated isotopic signal in the midtroposphere (i.e., 50065hPa) diverges from the near-surface response. Analysis suggests that transport of enriched water vapor from lower atmospheric layers through convective updrafts controls the enrichment of midtropospheric water vapor over the Pacific Ocean. In the observations, a strong positive correlation between the increase of convective precipitation and the isotopic composition of water vapor clearly points to such a mechanism ( R of 0.7–0.8 in the Central Pacific and 0.5–0.6 in the West Pacific). Model results confirm this mechanisms though producing slightly lower correlation values, with R values of 0.6 in the Central Pacific and 0.5 in the West Pacific. However, the distinction between convective and stratiform precipitation remains a result of model-dependent parameterization. Our analysis suggests that two issues should be investigated in more detail in further studies: (1) the equilibrium and disequilibrium between rain droplets and surrounding vapor for convective and stratiform precipitation and (2) different convection schemes in the different isotopic general circulation models (GCMs) describing the triggering of convection and uplift of lower layer air to higher layers. Ideally, such a comparison of different isotopic GCMs can provide us with an interesting benchmark test for the performance of the different convection schemes during ENSO and can help to disentangle the importance of the different processes contributing to the amount effect.

DOI

[21]
Vicente-Serrano S M, Beguería S, López-Moreno J I, 2010a. A multiscalar drought index sensitive to global warming: the standardized precipitation evapotranspiration index.Journal of Climate, 23(7): 1696-1718.

[22]
Vicente-Serrano S M, Beguería S, López-Moreno J I et al., 2010b. A new global 0.5 gridded dataset (1901-2006) of a multiscalar drought index: Comparison with current drought index datasets based on the Palmer Drought Severity Index.Journal of Hydrometeorology, 11(4): 1033-1043.ABSTRACT A monthly global dataset of a multiscalar drought index is presented and compared in terms of spatial and temporal variability with the existing continental and global drought datasets based on the Palmer drought severity index (PDSI). The presented dataset is based on the standardized precipitation evapotranspiration index (SPEI). The index was obtained using the Climatic Research Unit (CRU) TS3.0 dataset at a spatial resolution of 0.5 degrees. The advantages of the new dataset are that (i) it improves the spatial resolution of the unique global drought dataset at a global scale; (ii) it is spatially and temporally comparable to other datasets, given the probabilistic nature of the SPEI; and, in particular, (iii) it enables the identification of various drought types, given the multiscalar character of the SPEI. The dataset is freely available on the Web page of the Spanish National Research Council (CSIC) in three different formats [network Common Data Form (netCDF), binary raster, and plain text].

DOI

[23]
Wu Y F, Bake B, Zhang J S et al.Zhang J S ., 2015. Spatio-temporal patterns of drought in North Xinjiang, China, 1961-2012 based on meteorological drought index.Journal of Arid Land, 7(4): 527-543.Drought, which is one of the most frequently occurring severe hazards with long time scales and covering wide geographical areas, is a natural phenomenon resulting in significant economic losses in agriculture and industry. Drought is caused by an imbalance between the inputs of and the demand for water which is insufficient to meet the demands of human activities and the eco-environment. As a major arid and semi-arid area and an important agricultural region in Northwest China, North Xinjiang (NX) shows great vulnerability to drought. In this paper, the characteristics of inter-annual and seasonal drought were analyzed in terms of drought occurrence and drought coverage, by using the composite index of meteorological drought and the data of daily precipitation, air temperature, wind speed, relative humidity and sunshine duration from 38 meteorological stations during the period 1961–2012. Trend analysis, wavelet analysis and empirical orthogonal function were also applied to investigate change trend, period and regional characteristics, respectively. In NX, annual and seasonal drought occurrence and drought coverage all showed a decreasing trend that was most significant in winter (with rates of 610.26 month/10a and 6115.46%, respectively), and drought occurrence in spring and summer were more frequent than that in autumn and winter. Spatially, drought was severe in eastern regions but mild in western regions of NX. Annual and seasonal drought occurrence at 38 meteorological stations displayed decreasing trends and were most significant in “Shihezi-Urumqi-Changji”, which can help to alleviate severe drought hazards for local agricultural production and improve human livelihood. NX can be approximately classified into three sub-regions (severe drought region, moderate drought region and mild drought region), which were calculated from annual drought frequencies. The cross wavelet transform suggested that SOI (Southern Oscillation Index), AOI (Arctic Oscillation Index), AAOI (Antarctic Oscillation Index), PAOI (Pacific/North American Oscillation Index) and NAOI (North Atlantic Oscillation Index) have significant correlation with the variation of drought occurrence in NX. To prevent and mitigate the occurrence of drought disasters in NX, agricultural and government managers should pay more attention to those drought events that occur in spring and summer.

DOI

[24]
Xiong G J, Zhang B K, Li C Y et al., 2013. Characteristics of drought variations in Southweat China in 1961-2012 based on SPEI. Advances in Climate Change Research, 9(3): 192-198. (in Chinese)

[25]
Xu J W, Ju H, Liu Q et al., 2014. Variation of drought and regional response to climate change in Huang-Huai-Hai Plain.Acta Ecologica Sinica, 34(2): 460-470. (in Chinese)It is widely recognized that the frequency and intensity of extreme weather events and climate disasters have strongly increased with global warming. The area of influence of climate disasters has also increased,which has had adverse effects on sustainable social and economic development. Drought is a recurring natural phenomenon,and is associated with a deficit of water resources over a large geographic area and long duration. Drought is attracting increased attention from scholars,with a focus on its intensity,duration and areal extent in northern China within the context of global change. Investigation of the variation of drought and regional response to climate change is very important to agricultural production, and can provide a reference fordeveloping appropriate measures to reduce droughts on the Huang-Huai-Hai( 3H) Plain. At present,relevant research is more inclined to study meteorological drought itself, without consideration of drought characteristics in different phases in crop-growing seasons and the climate background of global change. In this paper,we determine drought characteristics in all four seasons and the winter wheat growing season on the 3H Plain,together with the effects of climate change. Based on data of 34 meteorological stations from 1961 to 2011,a relative moisture index was calculated to investigate the spatial pattern and temporal variability of drought characteristics on the 3H Plain. The results show varying degrees of drought in spring,winter and the winter wheat growing season. Drought frequency exceeded 90% over the past 50 years on the plain,with spring and winter the driest seasons. There were high-frequency drought areas in central and northern parts of the plain during spring,winter and the winter wheat growing season. The regional distribution of drought intensity and frequency showed an increasing tendency from south to north. A wet trend was detected on the plain in the winter wheat growing season over the last 50 years. However,the relative moisture index changed since 1978. That is to say,the index had an increasing trend from 1961 to 1980 when the plain was wetter; the index decreased from 1980 to 2011 when it was drier. Overall,although drought eased over the entire analysis period,a serious drought tendency has emerged over the last 20 years. In addition,temporal variability of the relative moisture index was significantly correlated with precipitation,solar radiation and relative humidity. This indicates that drought characteristics of the plain were more sensitive to these three climate variables. This has received increased attention in recent years with respect to addressing climate change. The results of our study indicate an arid trend,with increase of temperature in spring and summer on the 3H Plain. Therefore,relevant agencies should create an early warning system of extreme weather events and natural disasters,toward improvement of future regional agricultural scientific management and decision support systems in agricultural production. These agencies should also adapt to climate change by selecting strongly drought-resistant crop varieties and by adjusting cultivation methods and management measures,especially irrigation measures aimed at spring drought on the 3H Plain.

DOI

[26]
Yuan W P, Zhou G S, 2004. Theoretical study and research prospect on drought indices.Advances in Earth Science, 19(6): 982-991. (in Chinese)Droughts are a recurring phenomena that have plagued civilization throughout history. They affect natural habitats, ecosystems, and many economic and social sectors. Droughts are the world's costliest natural disasters, causing an average of $6-$8b billion in global damages annually and collectively affecting more people than any other form of natural disasters. The wide variety of sectors affected by a drought, its diverse geographical and temporal distribution, and the demand placed on water supply by human-use systems make it difficult to develop a single definition of drought. The American Meteorological Society groups drought definitions and types into four categories: meteorological, agricultural, hydrological, and socioeconomic. Although many studies of drought and drought indices have been made, but it's very difficult to reflect mechanism of drought because of complexity and comprehensive influence of drought. Every drought index is aimed at special terrain and period, and has respective domain and space-time scale. So it's indispensable to review and appraise the definition and indices of drought, in order to provide method and foundation for drought inspect and evaluation, and climate-vegetation relationship study based on ground of global change. The paper analyzes respectively several drought indices of four categories in theory. Meteorological drought results from a shortage of precipitation. So, early meteorological drought indices incorporated some measure of precipitation over a given period of time or consecutive days with no rain. Most of these indices ,which fenced with mechanism of drought, were valid only for their specific application in their specific region. Indices developed for one region may not be applicable in other regions because the meteorological conditions that result in drought are highly variable around the world. Since 1960's, many simple indices with mechanism of drought have been founded. Palmer drought severity index(PDSI) is the most prominent index of these meteorological drought indices. Since its inception ,the Plamer Index has become widely used by a variety of people (Hydrologists, foresters, field meteorologists, economists and researchers) as a tool to monitor and assess long-term meteorological drought and wet spell conditions. With global change studies, analysis of the relationship between drought and ecosystem, crown condition, plant growth or species composition on a regional level becomes very important. During the past years many models were developed describing the water balance of ecosystem. Examples are the AKWA model, the Hydrocycle-1.0 model, the water balance of Granier and WAWAHAMO. These models share a largely conceptual view of hydrological processes with some components of the water cycle being described in a more physical way. The paper introduces the structure and characteristic of WAWAHAMO. Since most crops are planted, agricultural drought is specifically concerned with cultivated plants, as opposed to natural vegetation. Due to the continuous need of adequate water by plants, agriculture drought may set in rapidly, and can similarly terminate suddenly. It is characterized by important, short-term changes to the volumetric soil moisture in the root zone. In this paper, the various methods and indices used in appraising the rainfall index, soil moisture index, crop drought index, crop water requirement index and comprehensive index are introduced. Hydrological drought is associated with a deficiency in the bulk water supply, which may include water levels in streams, lake, reservoirs and aquifers. A traditional assessment of a hydrological drought is total water deficit, synonymous with the drought severity S. This severity is the product of the duration D, during which flow is consistently below some truncation level, and the magnitude M, which is the average departure of streamflow from the truncation level during the drought period. Socioeconomic drought refers to the situation that occurs when water shortages begin to affect people and their live

DOI

[27]
Zhang J J, Guo Z F, Li Z G, 2013. Research on time and spatial characteristics of flood and drought disasters risk in Henan.Journal of Natural Resources, 28(6): 957-968. (in Chinese)Henan Province is located in the north-south climatic transitional zone with frequent flood and drought disasters.The risk probability of flood and drought disasters in Henan Province were researched with comprehensive utilization of disaster data and information diffusion model from two aspects of disaster-produced and disaster-consequence,so as to provide a theoretical basis for strengthening flood and drought risk assessment and management.The results showed that: 1) during the period of 1988-2007,the flood years are mainly 2003,2000,1998,1996 and 2005,and the drought years are 1997,2001,1999,1992 and 1988.2) When the rainfall anomaly percentage were at 20%,30% and 40%,the floods probabilities were 0.10,0.06 and 0.04;when the rainfall anomaly percentage were at-20%,-30% and-40%,the droughts probabilities were 0.13,0.07 and 0.03.3) When the disaster occurrence rates of floods were 5%,10%,15%,the risk probabilities were 0.81,0.54,0.35 respectively,that was 1-3 a encounter,and when disaster rate was greater than 20%,approximately 4.5 a encounter;while the disaster rates of droughts were at 5%,10%,15%,20%,25%,the risk probabilities were respectively 0.87,0.72,0.58,0.47,0.38,and that were 1.2 a,1.4 a,1.7 a,2.1 a,2.6 a encounter.4) The droughts occurred more frequently than the floods in Henan Province.There was a larger regional difference in space,both flood and drought high risk zones were mainly in Zhumadian,Nanyang,Pingdingshan,the regions with higher drought risk than floods were mainly in Sanmenxia,Luoyang,Zhengzhou,Jiaozuo,Anyang,Xuchang,and the regions with higher flood risk than drought were mainly in Xinyang,Luohe,Kaifeng,Shangqiu,Zhoukou,Puyang,in addition,the regions with both small flood and drought disasters risk were in Jiyuan and Hebi.

DOI

[28]
Zhou D, Zhang B, Ren P G et al., 2014. Analysis of drought characteristics of Shaanxi province in recent 50 years based on Standardized Precipitation Evapotranspiration Index.Journal of Natural Resources, 29(4): 677-688. (in Chinese)Drought disaster is one of the main natural disasters in Shaanxi Province, suffering from it often "nine out of ten years". It impacts the people's daily life and social production to different extent. In this paper, the observed meteorological data of 18 meteorological stations from 1961 to 2010 in Shaanxi Province were collected and the standardized precipitation evapotranspiration index(SPEI) was used. Based on the monthly SPEI values of each station in recent 50 years, the drought processes of each station were confirmed one by one and the occurrence frequencies, scopes and severities of the meteorological droughts were computed and the annual, seasonal and monthly drought occurrence frequency, coverage and intensity over years were analyzed, and the spatial and temporal evolution and the intensity of drought occurrence of the province were revealed. Research results show that there was an obviously growing trend in frequency of drought in recent 50 years, especially in recent 20 years since 1990; drought occurred without exception in the annual, spring, summer, autumn, winter and monthly scales. Among them, the most serious drought occurred in autumn and spring. In decadal variability, the province witnessed the worst drought in the 1990s, next since the year 2000; drought in Shaanxi was either widespread throughout the province or locally, with quite uneven distribution regionally, the overall distribution characteristics are more in the north and less in the south; the strongest drought distribution intensity presented in Guanzhong of Shaanxi, followed by southern Shaanxi and northern Shaanxi is the weakest.

DOI

[29]
Zhu X Y, Liu J, Shi B L et al., 2012. Variation of climate suitability of winter wheat in central plains under the condition of climate warming.Geographical Research, 31(8): 1479-1489. (in Chinese)Global climate change has significant impacts on agricultural production.Climate variability adversely impacts crop production and imposes a key constraint on agricultural production,mostly on how to enhance the yields of winter wheat,across the world.Owing to the fundamental importance of food to human welfare,crop and livestock production,we used the data of winter wheat experimental field and meteorological data of eight agrometeorological experiment stations and agrometeorological observation stations from 1991 to 2010 to establish the models of climate suitability.The variation of climate suitability in the whole growth period from 1971 to 2010 was analyzed.The results showed that the suitability degrees of temperature,sunshine,precipitation and integrated index were 0.54,0.64,0.37 and 0.50 respectively during the whole growth period of winter wheat.The sunshine suitability degree was the best,temperature suitability degree took the second place and the precipitation suitability degree was the worst.It is indicated that precipitation is the major limiting factor affecting winter wheat growth and development.It was shown that the temperature and precipitation suitability degrees decreased by 0.001 every year and sunshine suitability degree decreased by 0.002 every year from 1971 to 2010.The weaken combination effects of temperature,sunshine and precipitation were unfavorable for the growth of winter wheat.The temperature,sunshine and precipitation suitability degrees were weaker and these factors had poor combination effects in sowing to emergence period from 1971 to 2010.The precipitation suitability degree was good,sunshine and temperature suitability degrees were weaker in emergence to jointing period of winter wheat.In jointing to milk period of winter wheat,temperature and sunshine suitability degrees were good,and precipitation suitability degree was weak;and the combination of climate factors tended to be better.The sunshine and precipitation suitability degrees were good,temperature suitability degree was weaker in milk to maturity period of winter wheat;and the integrated climate suitability degree began to deteriorate.Per unit yield of winter wheat had a significant correlation with sunshine,temperature and precipitation suitability degrees in the middle-late growth period of winter wheat.

DOI

[30]
Zhuang S W, Zuo H C, Ren P C et al.Ren P C ., 2013. Application of standardized precipitation evapotranspiration index in China.Climatic and Environmental Research, 18(5): 617-625. (in Chinese)Applicability of the standardized precipitation evapotranspiration index(SPEI) is examined on the basis of monthly precipitation and monthly-mean temperature data recorded by 160 stations in China from 1951 to 2010.Results indicate that the SPEI at multiple time scales can be used to examine drought in areas with annual precipitation greater than 200 mm.In other regions,the index is effective for time scales longer than 12 months.In addition,the lack of precipitation and evapotranspiration during winter months results in reduced confidence of SPEI values when applying 1-,3-,and 6-month SPEIs in arid climatic regimes with annual precipitation less than 200 mm.Moreover,time series of SPEI,standardized precipitation index(SPI),and H index were compared for two observatories with different climate characteristics located in various regions of China.Of the three indices,only the SPEI was able to identify an increase in drought severity associated with higher water demand as a result of evapotranspiration under global warming.Further,the SPEI was able to determine the beginning and end of drought events.Therefore,SPEI carries an advantage when used for drought analysis and monitoring.

DOI

Outlines

/