Orginal Article

Influencing mechanism of energy-related carbon emissions in Xinjiang based on the input-output and structural decomposition analysis

  • WANG Changjian , 1 ,
  • WANG Fei 2 ,
  • ZHANG Xiaolei 3 ,
  • ZHANG Hongou 1
Expand
  • 1. Guangzhou Institute of Geography, Guangdong Open Laboratory of Geospatial Information Technology and Application, Guangzhou 510070, China
  • 2. College of Geography Science and Tourism, Xinjiang Normal University, Urumqi 830054, China
  • 3. Xinjiang Institute of Ecology and Geography, CAS, Urumqi 830011, China

Received date: 2016-07-29

  Accepted date: 2016-10-21

  Online published: 2017-03-30

Supported by

National Natural Science Foundation of China, No.41501144

National Key Research and Development Program, No.2016YFA0602801

Guangdong Academy of Sciences Youth Science Foundation, No.qnjj201501

High-level Leading Talent Introduction Program of GDAS, No.2016GDASRC-0101

Scientific Platform and Innovation Capability Construction Program of GDAS, No.2016GDASPT-0210.

Copyright

本文是开放获取期刊文献,在以下情况下可以自由使用:学术研究、学术交流、科研教学等,但不允许用于商业目的.

Abstract

Analysis of carbon emission mechanism based on regional perspectives is an important research method capable of achieving energy savings and emission reductions. Xinjiang, an important Chinese energy production base, is currently going through a period of strategic opportunities for rapid development. Ensuring stable socio-economic development while achieving energy savings and meeting emission reductions targets, is the key issue currently facing the region. This paper is based on the input-output theory, and conducts a structural decomposition analysis on the factors affecting energy-related carbon emissions in Xinjiang from 1997 to 2007; this analysis employs a hybrid input-output analysis framework of “energy - economy - carbon emissions”. (1) Xinjiang’s carbon emissions from energy consumption increased from 20.70 million tons in 1997 to 40.34 million tons in 2007; carbon emissions growth was mainly concentrated in the production and processing of energy resources, the mining of mineral resources, and the processing industry. (2) The analysis of the direct effects of the influencing factors on carbon emissions showed that the change in per capita GDP, the final demand structure, the population scale, and the production structure were the important factors causing an increase in carbon emissions, while the decrease in carbon emission intensity during this period was the important influencing factor in stopping the growth of carbon emissions. This showed that while the sizes of Xinjiang’s economy and population were growing, the economic structure had not been effectively optimized and the production technology had not been efficiently improved, resulting in a rapid growth of carbon emissions from energy consumption. (3) The analysis of the indirect effects of the influencing factors of carbon emission showed that the inter-provincial export, fixed capital formation, and the consumption by urban residents had significant influence on the changes in carbon emissions from energy consumption in Xinjiang. (4) The growth of investments in fixed assets of carbon intensive industry sectors, in addition to the growth of inter-provincial exports of energy resource products, makes the transfer effect of inter-provincial “embodied carbon” very significant.

Cite this article

WANG Changjian , WANG Fei , ZHANG Xiaolei , ZHANG Hongou . Influencing mechanism of energy-related carbon emissions in Xinjiang based on the input-output and structural decomposition analysis[J]. Journal of Geographical Sciences, 2017 , 27(3) : 365 -384 . DOI: 10.1007/s11442-017-1382-8

1 Introduction

The international community has reached a consensus on the transition to a low-carbon economy, as climate change issues, characterized by global warming, have continued to attract widespread attention (Aldy and Stavins, 2012; Liu Weidong et al., 2016; Peters et al., 2013; Shen and Sun, 2016). China has become one of the world’s largest energy consumers and leading emitters of greenhouse gases (GHGs) (Feng et al., 2013; Wang et al., 2014b). The carbon emissions problem now receives extensive and continued attention from policy makers, industrial manufacturers, and researchers, due to the pressure from international climate negotiations. The need for energy conservation and emissions reductions due to the constraints in domestic resources and the environment is also effective in drawing attention to the carbon emissions problem (Cyranoski, 2007; Piao et al., 2010; Qiu, 2008, 2009, 2011; Streets et al., 2001; Zeng et al., 2008). Hence, the government of China is committed, as declared at the 2009 Copenhagen Summit, to reduce the carbon dioxide intensity per unit Gross Domestic Product (GDP) in 2020 by 40%-45% from the 2005 levels, and to increase the fraction of energy consumption of non-fossil fuel energy resources to 15% (Qiu, 2009). The 12th Five-Year Plan (2011-2015) of China proposed that the consumption of non-fossil fuel energy resources should be 11.4% of the total primary energy consumption, thus the per unit GDP energy consumption and per unit carbon dioxide emission should be reduced by 16% and 17%, respectively (Qiu, 2011). In 2013, the China State Council announced an energy consumption cap, equivalent to 4 billion tons of coal and in 2014, a United States- China joint announcement was made on climate change, with China pledging to achieve the carbon emissions reductions prior to 2030 (Malakoff, 2014). Therefore, in-depth studies on the factors influencing energy-related carbon emissions need to be performed, as the realization of a highly constraining carbon emissions reduction commitment while maintaining social stability and rapid economic development in the midst of China’s economic growth, industrialization, and urbanization poses great challenges. Priority industries for energy conservation and carbon emissions reductions should be identified in a scientific manner, thus promoting harmonious energy, environment, and socio-economic development. This further highlights the importance and urgency of the research on energy-related carbon emissions.
Current research on energy-related carbon emissions largely comprise the following aspects: estimation and accounting of total carbon emissions (Akimoto et al., 2006; Gregg et al., 2008; Le Quéré et al., 2009), factors influencing carbon emissions and their mechanism of action (Cheng et al., 2014; Chuai et al., 2012; Liu Yansui et al., 2016; Wang et al., 2017; Wang et al., 2015; Wang et al., 2016), scenario analyses and forecast of carbon emissions (O'Neill et al., 2010; Tollefson, 2015; Williams et al., 2012), and carbon emission reduction technologies, and policy simulations (Chu and Majumdar, 2012; He et al., 2016; Jiang et al., 2010; Wang et al., 2014a; Wang et al., 2013). The key to the formulation of carbon emissions reduction policies and implementation of scenario simulations however, lies in the identification and analyses of the influencing factors and drivers of carbon emissions. Previous studies have shown that a multitude of factors have an effect on energy-related carbon emissions, the most predominant ones being the rapid increase in energy consumption and rapid socio-economic development. Al-mulali et al. used panel data to perform a study on 30 Sub-Saharan African countries and demonstrated that energy consumption has a strong driving effect on economic development and carbon emissions growth (Al-mulali and Sab, 2012). Similarly, Al-mulali also performed an empirical study on the factors influencing carbon emissions in 12 countries in the Middle East, and concluded that the energy consumption, Foreign Direct Investment (FDI), and GDP constitute the most important factors influencing carbon emissions (Al-mulali, 2012). Li et al. used the Path-STIRPAT model to investigate the factors affecting carbon emissions in China and concluded that per capita GDP growth formed the most predominant factor (Li et al., 2011). Zhu et al. applied an input-output model to study the energy-related residential carbon emissions in China from 1992 to 2005 and showed that the continuous increase in household energy consumption levels played a key role in the growth of direct household carbon emissions (Zhu et al., 2012). Moreover, low-carbon optimizations in energy resources and industrial structures helped slow down the growth of carbon emissions (Zhang, 2003, 2006; Zhang et al., 2005). By conducting a comparative study of the long-term growth of developed and developing countries, Zhang found that the diversified development of economic structures results in slowing down the increase of energy consumption demands (Zhang, 2003). Moreover, Zhang analyzed the effects of changes in the energy resource structure and the evolution of industrial structures on the increase of total carbon emissions and on the spatial patterns in China by establishing assessment models on the respective association of industry-energy and energy-carbon emissions (Zhang, 2006). Wu et al. adopted a DEA model to show that continuous improvements in energy efficiency in China were primarily driven by technological advances (Wu et al., 2012). Li et al. employed the STIRPAT model to analyze the empirical factors impacting energy-related carbon emissions at the provincial level in China and showed that in most provinces, technological advances led to a decline in carbon emissions (Li et al., 2012). With the continued globalization of world economy, the impacts of international and regional trade on carbon emissions have received continuous attention. Thus, in addition to the improvement in production technologies and energy use efficiency, developing countries, such as China, should also intensify research on embodied carbon emissions related to imports and exports (Du et al., 2011; Su et al., 2013). All the factors influencing carbon emissions can be summarized as population, economy, energy, industry, technology, and policy.
Previous research on energy-related carbon emissions focused mostly on macroscopic regional levels such as the global, continental, and national levels and relatively few studies have been carried out on smaller scales, i.e., the provincial and city levels. From a geographical perspective, the eastern, central, and western regions, as well as various provinces, cities, and autonomous regions of China have significant disparities in population growth, household consumption, socio-economic development, energy resources endowments, and technological levels (Feng et al., 2013). Moreover, previous studies on mechanisms impact-
ing energy-related carbon emissions largely relied on econometric models to investigate the direct effects of various factors of carbon emissions other than the indirect effects from the perspective of the final demand level. Domestic research that analyzes the factors impacting
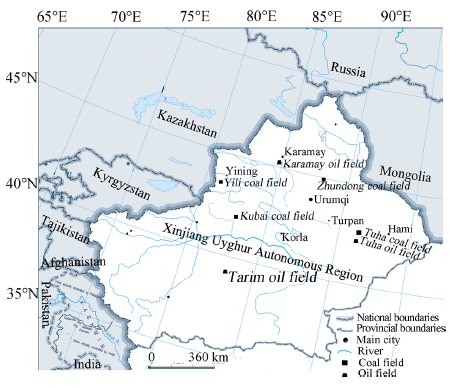
carbon emissions at the provincial and city levels has only recently begun emerging. This is highly significant in that the multi-factor mechanisms impacting carbon emissions that were previously obscured by regional differences can now be studied. These local studies will provide useful guidelines for the formulation of more targeted and workable regional policies for reducing carbon emissions (Geng et al., 2013; Liang and Zhang, 2011; Liu Zhu et al., 2012; Wang et al., 2014c; Wang et al., 2014; Wang et al., 2013; Xi et al., 2011). Liu et al. used an index decomposition analysis (IDA) to perform a comparative study on the factors affecting carbon emissions from 1995 to 2009 in four municipalities including Beijing, Shanghai, Tianjin, and Chongqing (Liu Zhu et al., 2012). Wang et al. used the LMDI model to perform a decomposition analysis of the factors affecting energy-related carbon emissions in Shandong Province from 1990 to 2009 and concluded that economic growth and population size were the most crucial factors of carbon emissions growth (Wang et al., 2014c). Wang et al. applied the STIRPAT model to analyze the factors of carbon emissions in Guangdong from 1980 to 2010 and found that the population size, level of urbanization, per capita GDP, and the level of industrialization to be the key factors (Wang et al., 2013). Wang et al. adopted the IDA model to analyze energy-related carbon emissions in Suzhou from 2005 to 2010 and demonstrated that the reduction in energy consumption intensity attributed to the energy resources and industrial restructuring proved conducive to the containment of growth in carbon emissions (Wang et al., 2014). The research of Xi et al. in Shenyang City revealed that the key sectors that should be targeted for carbon emissions reductions are the energy generation and processing industry, manufacturing industry, and construction industry (Xi et al., 2011). Liang et al. took the structural decomposition analysis (SDA) to perform a decomposition analysis of the factors impacting carbon emissions in the Eastern Coastal Manufacturing Center in Jiangsu Province. The study found that while reductions in energy consumption intensity and optimization of energy consumption structures were important, embodied carbon emissions from international trade should also be targeted for carbon emissions reductions in order to achieve low-carbon development in Jiangsu Province (Liang and Zhang, 2011). Geng et al. found that interprovincial trade outflow has a significant effect on the growth of carbon emissions, based on a decomposition analysis of factors impacting carbon emissions in the old industrial bases of Liaoning Province in Northeast China (Geng et al., 2013). Therefore, a thorough and wide-ranging study on the factors impacting carbon emissions at the provincial and city levels is urgently required to enable provincial contributions to the fulfillment of carbon emissions reduction pledges at the national level. Xinjiang is one of the major integrated energy bases of China and an important gateway for development in the western regions of China, as well as the core region of the Silk Road Economic Belt. Xinjiang is currently experiencing a strategic period of leapfrogging development; the fulfillment of constraining energy and carbon emissions reduction targets in an effective manner while maintaining stable socio-economic growth will be decisive for the harmonious energy, environment, and socio-economic development in Xinjiang.

2 Study area

The Xinjiang Uygur Autonomous Region lies on the northwestern border of China as one of the five ethnic minority autonomous regions of the country (Figure 1). It is a provincial administration with the largest land area in China, covering 1.66 million square kilometers and accounting for one-sixth of China’s total land area. Xinjiang is located in the hinterland of the Eurasian continent and has a land border stretching over 5600 km2 with eight countries including Russia, Kazakhstan, Kyrgyzstan, Tajikistan, Pakistan, Mongolia, India, and Afghanistan. Xinjiang, a historically important trade route for the ancient Silk Road, now forms a crucial gateway in the second “Eurasian Land Bridge” with its strategic location.
Figure.1 Location of Xinjiang Uygur Autonomous Region
Xinjiang has abundant reserves of energy resources. Based on the results of the Third National Coal Resources Forecast and Evaluation, the coal resources of Xinjiang amount to 2.19 trillion tons, accounting for 39% of the total national coal reserves, ranking first in China. According to the results of the Third National Oil and Gas Resources Evaluation, Xinjiang has 21.3 billion tons of crude oil prospective reserves and 10.8 trillion m3 of natural gas prospective reserves, accounting for 20% and 32% of total resource reserves for major petroliferous basins in China, respectively (Xiao, 2013). In the 12th Five-Year Plan, Xinjiang has aimed to build up the capacity to produce 50 million tons of crude oil, 100 billion m3 of natural gas and synthetic natural gas (SNG), and 30 million kW of power for external transfer. Moreover, large-scale oil and gas production and processing bases, coal-powered electricity and chemical plants, wind farms, and a major overland corridor for national energy resources will be established during this period. Xinjiang is rich in energy and mineral resources and also has abundant renewable energy resources, particularly wind and solar energy. According to the Xinjiang Uygur Autonomous Region Solar Photovoltaic Industry Development Plan (2011-2015), the theoretical potential reserve of solar energy (total solar radiation) in Xinjiang amounts to 5300-6700 MJ·m-2·y-1, the annual solar radiation of desert land area in Xinjiang can be equivalent to 4 thousand tons of standard coal. The available exploitation area for wind power is approximately 0.156 million km2 (Ma et al., 2013), the exploitable installed capacity for wind resources in Xinjiang amounts to 93.4 million kW, accounting for 41% of the total domestic capacity (Zhang, 2008).

3 Methodology

3.1 Structural Decomposition Analysis (SDA)

The most commonly and extensively applied research methods for the scientific evaluation and quantitative analysis of the key factors of carbon emissions consist of index decomposition analysis (IDA) and structural decomposition analysis (SDA). The IDA model employs data aggregation to analyze the direct effects of changes in various factors including demographic, economic, and structural factors on carbon emissions (Ang, 1995; Ang and Zhang, 2000). The SDA model, based on the classical input-output theory (Casler and Rose, 1998; Dietzenbacher and Los, 1998; Rose and Casler, 1996), features greater data integrity and a more detailed analysis, which remedies the deficiency of the IDA model for its failure to analyze the indirect effects of the changes in final demand sectors on carbon emissions (Guan et al., 2009; Minx et al., 2011; Peters et al., 2007; Su and Ang, 2012). The SDA model has increasingly become the preferred research approach for domestic and international scholars to analyze the economics of energy-related carbon emissions. Peters et al. used the SDA model to analyze the factors of carbon emissions in China in 1992-2002 and found that the economic structure, technological level, and urban residential consumption have significant effects on carbon emissions (Peters et al., 2007). Minx et al. expanded the early work of Peters et al. (2007) to reveal that technological improvements in production sectors from 2002 to 2007 largely offset carbon emissions induced by final demand sectors (Minx et al., 2011). Guan et al., using the SDA model from a final demand perspective, found that urban residential consumption, investment in fixed assets, and export trading had significant impacts on the growth of carbon emissions in China from 2002 to 2007 (Guan et al., 2009).
Based on the input-output analysis, the SDA model is used to perform an in-depth analysis for the information of sectors contained in the input-output table and their interconnections. In this paper, an IO-SDA model was constructed to analyze the factors influencing energy-related carbon emissions in Xinjiang and the associated mechanisms. The analytical framework is presented as follows: The energy resource and environmental factors (carbon emissions) were included in an input-output table (Table 1). In addition, monetary input-output tables (MIOTs) were employed for the analysis of input and output, whereas physical input-output tables (PIOTs) were adopted for the analysis of energy resource and carbon emission factors, thereby establishing a hybrid input-output model for “energy- economy-carbon emissions”.
Based on the input-output theory, we constructed the SDA Model for the influencing factors of energy-related carbon emissions, as follows (Feng et al., 2015; Feng et al., 2012; Guan et al., 2008; Guan et al., 2009; Guan et al., 2014; Liang et al., 2014; Liang et al., 2013; Minx et al., 2011; Peters et al., 2007):
C = E×(I-A) -1×y(1)
Table 1 Energy-economy-carbon emission input-output model
Intermediate use Final demands Import Inter-provincial
import
Total outputs
1,2,…,n Consumption Gross capital formation Export Inter-provincial
export
Intermediate inputs 1 Xij Yi Xi
2
n
Value added Vj
Total inputs Xj
Energy inputs 1 Ekj Eky Ek
2
m
Carbon emissions 1 Ckj Cky Ck
2
m
where C represents total carbon emissions; E represents carbon intensity vector on industrial scale; A represents the n×n coefficient matrix of direct consumptions; (I-A)-1 represents the n×n Leontief inverse matrix; and y represents the final demand sectors in quadrant II of the input-output table, which comprised the final consumptions (i.e., government consumptions, urban household consumptions, and rural household consumptions), gross capital formation (i.e., fixed capital formation and inventory increase), and gross imports and exports (i.e., inter-provincial import, international import, inter-provincial export, and international export).
Among these, the n×1 column vector y of the final demands can be further decomposed as the final demand structure ys and total final demand, whereby the latter can be further deposed as population size P and per capita final demand yv (i.e. per capita GDP).
Therefore, y = P×ys×yv (2)
Given the above, the SDA Model for energy-related carbon emissions can be derived as:
C = E×L×ys×yv×P(3)
where L = (I-A) -1 is the Leontief inverse matrix.
Then,
ΔC = ΔE×L×ys×yv×P + E×ΔL×ys×yv×P + E×L×Δys×yv×P +
E×L×ys×Δyv×P + E×L×ys×yv×ΔP(4)
Subsequently,
ΔC = f(ΔE) + f(ΔL) + f(Δys) + f(Δyv) + f(ΔP) (5)
Based on the above, changes in carbon emissions (ΔC) were decomposed into five main influencing factors: population size (P), carbon emission intensity (E), production structure (L), the final demand structure (ys), and per capita GDP (yv).
Advantages of the IO-SDA Model also include its ability to show the indirect effects of the final demand sectors on carbon emissions. Based on the categories of final demand sectors in the input-output table, the n×1 column vector y of the final demand was diagonalized, and the following equation was derived:
Ck = E× (I-A) -1×yk (6)
where yk represents the final demand of the k type, Ck represents the indirect carbon emission caused by changes in the final demand of the k type.

3.2 Data management

The data in this study were mainly based on the input-output tables of Xinjiang in 1997, 2002, and 2007. Demographic, economic, and energy resource data were primarily sourced from the Xinjiang Uygur Autonomous Region Statistical Yearbook. To maintain consistency with sectoral energy consumption data from the statistical yearbook, the input-output tables of the 40 sectors in Xinjiang for 1997 and 42 sectors for 2002 and 2007 were consolidated based on certain industrial consolidation principles (Geng et al., 2013; Liang and Zhang, 2011) into a single input-output table with 28 sectors (Table 2). The double-deflation method (Guan et al., 2008; Liang et al., 2013; Minx et al., 2011; Peters et al., 2007) was further employed to convert input-output tables of Xinjiang for 2002 and 2007 to constant prices in 1997 to be able to compare the data between years.
Table 2 Input-output table of 28 industries in Xinjiang
Code Industry Code Industry
1 Agriculture 15 Metal products
2 Coal mining and dressing 16 Common machines and special equipment manufacturing
3 Oil and natural gas extraction 17 Traffic equipment manufacturing
4 Metal ore mining 18 Electric equipment and parts manufacturing
5 Non-metallic mineral mining 19 Computer, communications and other electronic
equipment manufacturing
6 Food processing and tobacco manufacturing 20 Instrument, meter and stationery manufacturing
7 Textile 21 Other manufacturing
8 Manufacturing of clothes, leather, fur, feather and other fiber products 22 Electric power and heat power production and supply
9 Timber processing and furniture manufacturing 23 Gas production and supply
10 Paper making, printing, cultural and educational products manufacturing 24 Tap water production and supply
11 Oil processing and refining 25 Construction
12 Chemical materials and products manufacturing 26 Transportation, storage and telecommunications
13 Non-metallic mineral processing 27 Wholesale, retail and catering
14 Metal smelting and rolling processing 28 Other industries

3.3 Calculation of energy-related based carbon emissions

Based on the International Panel on Climate Change (IPCC) carbon emission calculation guide, with reference to the general default values and studies related to energy-related carbon emissions (Li and Chen, 2013; Zhang and Chen, 2014; Zhang et al., 2014), the main carbon emission coefficients were determined for use in the calculation of carbon emissions (Wang et al., 2014c; Wang et al., 2015), the equation is as follows:
where the superscript t represents time, i represents different types of energy, Ct represents total carbon emissions (million tons) at time t, Eti represents total consumption of the ith type of energy at timet (million tons), LCVi represents lower calorific value of the ith type of energy, CFti represents carbon emission coefficient of the ith type of energy, and Oi represents combustion oxidation rate of the ith type of energy (Table 3).
Table 3 Conversion factors, lower calorific value, and oxidation rate of energy sources
Energy sources Conversion
factors
LCV
(MJ/t or MJ/Mm3)
Oxidation rate Carbon emission
factors (t C/TJ)
Cleaned coal 0.900 tce/t 26.344 0.918 27.680
Raw coal 0.714 tce/t 20.908 0.918 25.800
Coke 0.971 tce/t 28.435 0.928 29.410
Other washed coal 0.286 tce/t 8.363 0.918 25.800
Crude oil 1.429 tce/t 41.816 0.979 20.080
Fuel oil 1.429 tce/t 41.816 0.985 21.090
Other petroleum products 1.429 tce/t 41.816 0.980 20.000
Gasoline 1.471 tce/t 43.070 0.986 18.900
Kerosene 1.471 tce/t 43.070 0.980 19.600
Diesel oil 1.457 tce/t 42.652 0.982 20.170
Nature gas 1.330 tce/103 m3 38.931 0.990 17.200
Refinery gas 1.571 tce/t 46.055 0.989 18.200
LPG 1.714 tce/t 50.179 0.989 17.200

4 Empirical analysis

4.1 Structural decomposition analysis of factors contributing to carbon emissions

Based on the IPCC energy-related carbon emissions accounting system, the energy-related carbon emissions in Xinjiang increased from 20.70 million tons in 1997 to 24.08 million tons in 2002, and 40.34 million tons in 2007, showing an increase of 94.88% over 11 years. In particular, the increased amount of carbon emissions for the period 2002-2007 accounted for 82.79% of the total increase in carbon emissions over the period 1997-2007 (Figure 2). From 1997 to 2007, the growth in carbon emissions from the 28 industrial sectors of Xinjiang was mainly attributed to the energy production and processing industry, electric power and heat power production and supply, and mineral resources mining and processing industry. The growth of carbon emissions was mainly concentrated in the following industries: oil processing and refining (14.67 million tons), electric power and heat power production and supply (7.87 million tons), metal smelting and rolling processing (1.56 million tons), non-metallic mineral processing (1.01 million tons), and chemical materials and products manufacturing (0.66 million tons). These energy-intensive sectors and high-carbon industries should get the priority for energy savings and carbon emissions reduction efforts in the current, medium-term, and long-term industrial development of Xinjiang.
As shown in Figure 2, the results of the calculations by formulas (1), (2), (3), (4), and (5) are as follows: Changes in population size, per capita GDP, final demand structures, and production structures from 1997 to 2002 resulted in 2.28 million tons, 4.71 million tons, 4.72 million tons, and 0.64 million tons of increase in carbon emissions, respectively. Changes in carbon emission intensity led to a reduction of carbon emissions by 8.97 million tons. From 2002 to 2007, changes in population size, per capita GDP, final demand structures, and production structures caused 2.43 million tons, 13.63 million tons, 3.17 million tons, and 2.64 million tons of increase in carbon emissions, respectively. Changes in carbon emission intensity led to a reduction of carbon emissions by 5.62 million tons.
Figure.2 Structure decomposition analysis of various driving factors in Xinjiang from 1997 to 2007
The rapid growth in per capita GDP had a significantly larger contribution to carbon emissions growth in the 2002-2007 period compared to the 1997-2002 period. The per capita GDP increased from 6052.39 yuan per person in 1997 to 8464.51 yuan per person in 2002, and further increased to 16815.47 yuan per person in 2007. This gives an annual per capita GDP growth of 6.87% in the 1997-2002 period, and 12.35% in the 2002-2007 period based on the calculations with comparable prices. Due to the scaling effects of rapid economic growth, the economic output was the most important factor contributing to the growth of carbon emissions in Xinjiang, during the 1997-2007 period. The reduction in carbon emissions contributed by the changes in carbon emission intensity had a significantly lower contribution in the 2002-2007 period compared with that in the 1997-2002 period. Carbon emission intensity in Xinjiang decreased from 199 tons of carbon/million yuan GDP in 1997 to 150 tons of carbon/million yuan GDP in 2002, and further decreased to 114 tons of carbon / million yuan GDP in 2007. The rate of decrease from 1997 to 2002 was 5.85% annually, whereas the decrease from 2002 to 2007 was only 3.28% annually. The effects of population size on carbon emissions growth were not significantly different between the 1997-2002 and 2002-2007 periods, with this factor having a uniformly positive effect on carbon emissions growth in both periods. The effect of changes in the final demand structure on carbon emissions growth weakened in 2002-2007 compared with that in the 1997-2007 period. The effect of changes in the production structure became significantly stronger because the proportion of secondary industries in Xinjiang increased from 37.1% in 1997 to 46.8% in 2007, whereas tertiary and primary industries decreased in proportion by varying degrees. Over the 1997-2007 period, the transformation strategy initialized in Xinjiang, i.e., the “advantageous resources transformation strategy” in the 9th Five-Year Plan, in which the development of new-type industries were underpinned and accelerated by the energy and mineral riches of Xinjiang. The full realization of the “Great Western Development Strategy” has brought about a significant increase in the level of investment in fixed assets, and further increases in the exploration and development of energy and mineral resources. The continuous expansion of energy and heavy chemical industries led to the current iteration of industrial structures in Xinjiang, which features rapid growth in secondary industries and a distinct inclination towards energy, mineral resources, and heavy chemical industries. Although the continued advancing of the new-type of industrialization has led to a decrease in energy consumption intensity in Xinjiang, from 301 tons of standard coal / million yuan GDP in 1997 to 224 tons of standard coal / million yuan GDP in 2002, and further to 186 tons of standard coal / million yuan GDP in 2007, the current energy consumption intensity is still over the national average, which further highlights the urgency of the transitioning to low-carbon production techniques.
From 1997 to 2007, the carbon emissions growth caused by changes in the per capita GDP, final demand structures, population size, and production structures contributed to 127.04%, 28.78%, 27.63%, and 25.48% of the total carbon emissions growth (Table 4). This implies that the continuous economic and population growth was not matched by effective optimizations and improvements in economic structure (final demand structures) and production techniques (production structure), thus leading to rapid growth in the energy-related carbon emissions of Xinjiang. Over the same period (1997-2007), the absolute value of carbon emission reductions contributed by the reductions in carbon emission intensity was 108.92%; carbon intensity is the only factor that had a suppressive effect on the growth of carbon emissions within this time period.
Table 4 Structure decomposition analysis of contributions of various driving factors in Xinjiang
Influencing factors Stage: 1997-2002 Stage: 2002-2007 Stage: 1997-2007
Population size 67.49 14.96 27.63
GDP per capita 139.24 83.82 127.04
Final demand structure 139.57 19.50 28.78
Production structure 19.02 16.25 25.48
Carbon emission intensity -265.33 -34.54 -108.92
Total change 100.00 100.00 100.00

4.2 Structural decomposition analysis of the influences of various categories of final demands on carbon emissions growth

Based on the calculation results using formula (6), the indirect effects due to changes in various final demands on overall energy-related carbon emissions and on carbon emissions of the individual industrial sectors were analyzed (Figure 3, Tables 5 and 6).
Figure.3 Increment of carbon emissions from different final demands in Xinjiang
From a final demands perspective, interprovincial trade outflow and inflow and gross fixed capital formation have significant impacts on energy-related carbon emissions. The effect that household consumption has on energy-related carbon emissions growth has also become more evident over time, especially the effect of the consumption of urban households.
Table 5 Contribution to carbon emissions of different final demands in Xinjiang
Final demands Stage: 1997-2002 Stage: 2002-2007 Stage: 1997-2007
Rural household consumption 9.31 6.72 7.10
Urban household consumption -10.90 24.59 19.32
Government consumption -1.36 12.51 10.45
Fixed capital formation 76.41 78.45 78.15
Inventory increase -47.64 7.67 -0.54
Inter-provincial export 28.20 90.52 81.27
International export 16.55 5.22 6.90
Inter-provincial import 63.09 -128.10 -99.72
International import -33.65 2.42 -2.93
Total change 100 100 100
Table 6 Carbon emission changes caused by different final demands from different sectors in Xinjiang (Million tons)
Code Rural household
consumption
Urban household
consumption
Government
consumption
Fixed capital
formation
Inventory
increase
Inter-
provincial export
International
export
Inter-
provincial import
International
import
1 0.1873 -0.0669 0.0313 -0.0868 -0.81 1.6655 0.882 0.1552 0.0321
2 0.0537 -0.0201 0 0 -0.0318 0.0038 -0.0002 0.2869 -0.0008
3 -0.0019 0.0117 0 0 -0.2239 -0.1839 0.0292 0.0623 -0.1864
4 0 0 0 0 0.0213 0.241 -0.0007 -0.0005 -0.0969
5 0 0 0 0 -0.0013 -0.0375 0.0052 0.1472 0.0003
6 -0.0058 0.3353 0 0 -0.0855 -0.165 0.1344 0.1263 -0.001
7 0.0269 0.0097 0 0 0.068 -0.4603 -0.1237 -0.0093 0.0022
8 0.0386 0.1053 0 0 0.0038 -0.1112 -0.0301 -0.0449 -0.0379
9 0.0162 0.0125 0 0.097 0.0266 -0.0049 0.0925 -0.2857 -0.0261
10 0.0014 -0.0493 0 0 0.005 -0.0275 -0.0101 -0.3415 0.0299
11 0.1111 -0.0118 0 0 0.1641 10.2867 -0.068 0.249 -0.0058
12 0.0626 0.2982 0 0 0.1675 1.7326 -0.0134 -1.697 -0.0559
13 0.196 0.1256 0 0 0.0477 -0.0265 0.0385 -0.846 -0.0038
14 0 -0.0864 0 0 0.0245 1.8133 0.1983 -3.136 0.3263
15 0.0015 0.0133 0 1.3395 0.2181 0.0153 -0.0183 -1.9461 -0.1637
16 -0.0002 0.0545 0 1.9104 0.2553 -0.1399 -0.0097 -3.1638 -0.1218
17 0.059 0.0614 0 -0.1649 -0.0067 -0.283 0.0506 0.9186 0.0095
18 0.006 0.0176 0 0.4871 0.0625 0.4347 0.0078 -0.4661 -0.0428
19 0.1216 0.6217 0 2.068 0.0599 0.3134 0.041 -3.9085 -0.1327
20 0.0028 -0.0142 0 -0.0112 0.0466 -0.0008 -0.0013 -0.0819 -0.0496
21 0.0024 0.0564 0 0 -0.0115 -0.0874 0.0034 -0.1143 0.0323
22 0.1893 1.0403 0 0 -0.0022 -0.0823 0 0.1589 0
23 0.0015 0.0255 0 0 -0.0052 -0.0596 0 0.0031 0
24 0.012 0.0212 0 0 0 0 0 0.0037 0
25 0.07 0 0 9.4413 0 0.0013 0 -2.3583 0
26 0.1719 0.6526 0.2587 -0.2954 -0.0605 1.6285 0.0197 -0.8819 -0.0428
27 -0.1495 -0.2458 0.0004 0.006 -0.0392 -0.5082 0.1278 -0.8033 -0.0408
28 0.2213 0.8268 1.7628 0.5593 0.0006 0.0055 0 -1.6142 0
Total change 1.3955 3.7952 2.0532 15.3504 -0.1063 15.9637 1.355 -19.5881 -0.5761
From 1997 to 2007, interprovincial trade outflow and inflow had far greater influence on carbon emissions as compared to international exports and imports in Xinjiang. International exports caused larger increases of carbon emissions than the reductions in carbon emissions caused by international imports, whereas domestic exports led to lower carbon emissions growth than the carbon emissions reductions induced by domestic imports. Interprovincial trade outflow (i.e. interprovincial exports) from 1997 to 2007 in Xinjiang has caused a carbon emissions growth of 15.96 million tons, which is 81.27% of the total carbon emissions growth within that period. Therefore, interprovincial trade outflow is the single most important factor that contributes to carbon emissions growth. Conversely, interprovincial trade inflow (i.e. interprovincial imports) reduced carbon emissions by 19.59 million tons, which is 99.72% (in terms of absolute value) of the change in carbon emissions from 1997 to 2007, and is therefore the largest contributor to carbon emissions reduction within this period. From 1997 to 2007, the sectors that made up the bulk of the 15.96 million tons of carbon emissions growth caused by interprovincial trade outflow are: the oil processing and refining industry (10.29 million tons), the metal smelting and rolling processing (1.81 million tons), chemical materials and chemical products manufacturing (1.73 million tons), and agriculture (1.67 million tons). The main sectors that contributed to the 19.59 million tons of carbon emissions reduction in this period are: the manufacturing of communications equipment, computers, and other electronic equipment (3.91 million tons), the common machines and special equipment manufacturing (3.16 million tons), and the metal foundries and presses industry (3.14 million tons). The net carbon emissions growth due to interprovincial trade outflow and inflow was -3.62 million tons.
The international exports led to 1.36 million tons of carbon emissions growth in the 1997-2007 period, with the main contributors being agriculture (0.88 million tons), the metal smelting and rolling processing (0.20 million tons), and the food manufacturing and tobacco processing industry (0.13 million tons). The international imports reduced carbon emissions by 0.58 million tons, with the main source of these reductions coming from the oil and gas exploration industry (0.19 million tons) and the metal products industry (0.16 million tons). The net balance of international trade was 0.78 million tons, which accounted for 3.97% of the growth of carbon emissions from 1997 to 2007. The main mode of the international trade in Xinjiang from 1997 to 2007 was the small-scale cross border trade, with 9.42 billion U.S. dollars in 2007, which accounts for 68.65% of all trade passing through Xinjiang customs. The main trade partners were Central Asian countries, Kazakhstan and Kyrgyzstan being the major ones. The exported goods were mainly electronics, shoes, textiles and apparel, and steel and agricultural products, while the imported goods were mainly petroleum, natural gas, and mineral resources.
The growth in carbon emissions caused by the gross fixed-capital formation from 1997 to 2007 in Xinjiang was 15.35 million tons, accounting for 78.15% of the total carbon emissions growth during that period. The carbon emissions growth arising from the gross fixed-capital formation was mainly concentrated in the construction industry (9.44 million tons), communications equipment manufacturing (2.07 million tons), the common machines and special equipment manufacturing (1.91 million tons), and the metal products industry (1.34 million tons). The gross fixed-capital formation in Xinjiang increased from 46.14 billion yuan to 85.67 billion yuan in 2002, and rapidly increased further to 200.50 billion yuan in 2007, mainly in industries that consume large amounts of energy, such as the construction industry, equipment manufacturing industry, and metal products industry. It is therefore important to prioritize carbon emissions reduction and energy conservation in the construction industry, and to improve the production technology in the equipment manufacturing and metal fabricating industries, for the implementation of low-carbon development in Xinjiang.
The carbon emissions growth induced by the household consumption from 1997 to 2007 was 5.19 million tons, with the consumption of urban and rural households accounting for 3.80 million tons and 1.40 million tons of that growth, respectively. The growth in urban household carbon emissions was mainly from the production and supply of electricity and heating (1.04 million tons), other tertiary industries (0.83 million tons), and the transportation, storage, and telecommunications sectors (0.65 million tons). The growth in rural household carbon emissions was mainly due to other tertiary industries (0.22 million tons), the non-metallic mineral products industry (0.20 million tons), and the production and supply of electricity and heating (0.19 million tons). With rapid urbanization, a large portion of the rural population has migrated into urban areas and the urbanization level of Xinjiang has increased from 35.20% in 1997 to 35.91% in 2002, and further to 39.15% in 2007. The average consumption level of urban residents increased from 3328 yuan per person in 1997 to 8986 yuan per person in 2007. At the same time, the consumption level of rural residents also increased from 1891 yuan per person in 1997 to 2320 yuan per person in 2007. The consumption gap between rural and urban residents has continued to increase over time, which explains why the consumption of urban households accounts for a much larger portion of carbon emissions growth than that of rural households. With the continued progression of the “new-type urbanization”, the consumption level of urban residents and their demands on the production and supply of electricity and heating, transportation, storage, and telecommunication industries will continue to increase. It is therefore of utmost importance to make improvements to the thermal power plants and coal-fired heating systems and to reduce carbon emissions and energy consumption in the transportation industry.
Interprovincial trade outflow has had a significant indirect effect upon the carbon emissions of Xinjiang far exceeding the emissions associated with international exports. The main contributors to these indirect effects are energy-intensive industries, such as the oil processing and refining industry, the metal smelting and rolling processing industry, and the chemical products industry, as well as the interprovincial trade outflow of agricultural products. The rapid development of energy-intensive industries and investments within this sector in Xinjiang is a consequence of its abundance in resources, cost advantages, and market demands. Xinjiang is very rich in coal, oil, and mineral deposits and have relatively low labor and land costs. The total social investment in fixed assets in Xinjiang increased from 44.68 billion yuan to 81.30 billion yuan in 2002, and rapidly increased to 185.08 billion yuan in 2007. The investment was primarily focused on energy-intensive industries, such as mining, manufacturing, and the production and supply of heat and electricity. In 2007, the fixed asset investments in the oil and gas exploration industry, the petroleum processing and coking industry, and the production and supply of electricity and heating accounted for 19.49%, 7.63%, and 5.69% of the total social investment in fixed assets, respectively. From 1997 to 2007, crude oil processing capacities increased from 8.51 million tons to 17.05 million tons, gasoline production increased from 2.08 million tons to 2.77 million tons, diesel production increased from 3.04 million tons to 8.20 million tons, cement production increased from 6.28 million tons to 15.37 million tons, and steel production increased from 1.00 million tons to 4.71 million tons. The domestic export of energy resource-based products from Xinjiang caused a noticeable shift in regional “embodied carbon emissions”. As the various regions of China are dependent on each other (Feng et al., 2013; Liu et al., 2015a; Liu et al., 2015b), the supply of energy resource-based products from Xinjiang to other provinces has increased the reliance of Xinjiang on the domestic market up to a certain degree. This has resulted in the interprovincial trade outflow having a significant effect on the carbon emissions growth of Xinjiang.
The regional shift of “embodied carbon emissions” (Li et al., 2013; Liu Weidong et al., 2012; Liu et al., 2010; Tang et al., 2014) due to domestic export of energy resource-based products, and the direct domestic export of energy resources are both detrimental to low-carbon development projects in the Xinjiang region. Since 2007, the energy consumption of Xinjiang has rapidly grown, especially the energy obtained from high-carbon resources such as coal. On the other hand, the growth in the consumption of energy from lower-carbon emission resources such as petroleum has been relatively slow (Figure 4, Top). Overall domestic energy exports from Xinjiang have rapidly increased since 2007 (Figure 4, Down). The domestic export of oil has maintained a state of continuous growth, with almost all of the oil produced in this region being exported. The volume of coal outflow has also exhibited a rapid growth since 2007. In the 12th Five-Year Plan, Shanxi, the Ordos Basin, Eastern Inner Mongolia, Southwest China, and Xinjiang were designated as the five national integrated energy bases of China. The Xinjiang base is the farthest of these bases from the primary consumption regions in China, and thus has the longest transportation distances that will result in enormous transportation costs. Therefore, Xinjiang should implement the appropriate differentiated energy-savings and carbon emissions reduction targets in the current and future growth periods.
Figure.4 Energy consumption (Top) and energy outflow (Down) in Xinjiang from 2000 to 2011

5 Conclusions

An analytical framework based on the “energy-economy-carbon emissions” hybrid model was constructed using the classical input-output theory. An input output-structural decomposition analysis model was used to perform a decomposition analysis of the factors that impact energy-related carbon emissions in Xinjiang from 1997 to 2007.
From 1997 to 2007, energy-related carbon emissions of Xinjiang increased from 20.70 million tons in 1997 to 24.08 million tons in 2002, and further increased to 40.34 million tons in 2007, showing an overall increase of 94.88% over 11 years. The main sources were the production and processing of energy resources as well as the mining and processing of mineral resources.
The results on the direct effects of factors impacting carbon emissions showed that changes in per capita GDP, final demand structures, production structures, and population size were the main factors that contributed to carbon emissions growth, whereas the decrease in carbon emission intensity was an important factor in suppressing the growth of emissions during this period. This implies that the continuous economic and population growth was not matched by optimizations in economic structure (final demand structure) and improvements in production techniques (production structure), which led to the rapid growth of carbon emissions in Xinjiang.
The analyses of the indirect effects of factors on carbon emissions from the final demand perspective revealed that domestic interprovincial trade outflow and inflow as well as gross fixed-capital formation have a significant impact on changes in the energy-related carbon emissions of Xinjiang. At the same time, the contribution of household consumption, especially the urban household consumption, to the growth of energy-related carbon emissions in Xinjiang is increasing. The increase in fixed capital investment in high-carbon industry sectors, and the growth in interprovincial trade outflow of energy resource-based products had a significant impact on the shifting of regional “embodied carbon emissions”.
With the new-type urbanization of Xinjiang and the promotion of new industrialization processes, as well as the implementation of the “Xinjiang Aid Policy” and the complete rebuilding of the “Silk Road Economic Belt”, the urbanization and industrialization levels and the total investment in fixed assets are expected to continue to increase. In the context of China’s western development and Xinjiang’s leapfrog development, a comprehensive analysis of the leading industries in the various prefectures of Xinjiang was performed. The results showed that most of these industries including coal production, coal-to-chemical production, petroleum processing, equipment manufacturing, the steel industry, cement manufacturing, electrolytic aluminum production, the polysilicon industry, light industry, and textiles manufacturing were reliant on resource and cost advantages. It remains to be seen whether it is possible to convert these energy and mineral resource advantages into economic advantages and whether the knowledge from developed regions such as eastern and central China will lead to technological improvements in the energy- and resource-intensive industries of Xinjiang for the implementation of sustainable and low-carbon development.
The effective utilization of industry correlation effects, such as driving the development of regional competitive processing industries that are currently reliant on local markets by prompting the development of energy and raw material industries, will have a profound impact on the transformation of economic structures in Xinjiang to a low-carbon economy. With the large influx of investment in Xinjiang, more work should be performed to upgrade the production processes and to eliminate the outdated production infrastructure. To enable the adoption of low-carbon techniques and energy saving measures in national industrial parks and new industrial districts, the government of the autonomous region and the energy resource sector should prioritize the hiring of top-tier talent for research and development work, especially in industries involved in electricity generation, new energy resources, modern chemical manufacturing, new materials, and high-end equipment manufacturing. While fossil fuels are currently being used intensively, the usage of renewable energy resources should be simultaneously expanded, through comprehensive plans for the development and distribution of solar and wind energy. Renewable energy systems should be planned and established for industrial parks of a larger scale, as well as for densely-populated residential areas.
The domestic export of energy resource-based products, which causes a regional shift in “embodied carbon emissions”, and the direct (domestic) export of energy resources are detrimental to the low-carbon development in the Xinjiang region. The progress in technological improvements, in the replacement of high-carbon energy sources with renewable, low-carbon energy sources, and in the reduction of carbon emissions and energy consumption in key industries is slow. Therefore, the following key questions should be answered before deciding on the main focus of the energy and carbon emissions reduction: How should an integrated energy base be built? How can the needs of local consumption and the energy export be reconciled? How can low-carbon energy sources (oil and natural gas) be obtained in larger quantities? Xinjiang should implement differentiated energy-savings and emission reduction goals, while taking into consideration the interdependence of the various regions, the continuous increase in domestic energy exports, and high costs of energy transport over long distances.
In the arid northwestern region, water is a key factor that restricts socio-economic development. The high-carbon industries of Xinjiang, such as coal production, coal chemical production, oil processing and refining, and metal foundries and presses are also highly water-intensive. It is thus necessary to pay close attention to the preservation of water resources, thereby restricting water usage in the development of energy-intensive industries in arid regions.

The authors have declared that no competing interests exist.

[1]
Akimoto Hajime, Ohara Toshimasa, Kurokawa Jun-ichi et al., 2006. Verification of energy consumption in China during 1996-2003 by using satellite observational data.Atmospheric Environment, 40(40): 7663-7667.There is substantial difference in the coal consumption data in China during 1996–2003 among the three official energy statistics; the province-by-province data in the China Energy Statistics Yearbook (PBP-CESY), the energy balance tables by International Energy Agency (IEA2004) [2004, Energy Statistics of Non-OECD Countries. IEA, Paris], and the country-total data in the China Energy Statistics Yearbook (CT-CESY). Verification of these data was made by GOME satellite observational data for tropospheric NO 2 column density in Northern China Plain reported by Irie et al. [2005, Evaluation of long-termtropospheric NO 2 data obtained by GOME over East Asia in 1996–2002. Geophysical Research Letter 32(11), L11810, doi: 10.1029/2005GL022770] and Richter et al. [2005, Increase in tropospheric nitrogen dioxide over China observed from space. Nature 437, 129–130]. The NO 2 column increase from 1996 to 2002 averaged for the two reports is about 50%, whereas the NO x emission increases based on the PBP-CESY and IEA2004 are 25% and 15%, respectively, and that for CT-CESY is even lower. The discrepancy of the increasing trends between the satellite data and the PBP-CESY emission inventory could be within the uncertainty level with a reservation that the increase in total fuel consumption in PBP-CESY may still be underestimated particularly after the year of 1999. The increasing rates of NO x emissions during 1996–2002 calculated by using the IEA2004 and CT-CESY statistics are apparently underestimated beyond the uncertainty level of the satellite observation, and they are recommended not to be used for emission inventory studies in China during the period.

DOI

[2]
Al-mulali Usama, 2012. Factors affecting CO2 emission in the Middle East: A panel data analysis.Energy, 44(1): 564-569.This study investigated the major factors that influence the CO 2 emission in 12 Middle Eastern countries, namely, Bahrain, Egypt, Iran, Jordan, Kuwait, Lebanon, Oman, Qatar, Saudi Arabia, Syria, the UAE, and Yemen. A panel model was used in this study and the period 1990鈥2009 was considered. The results showed that the total primary energy consumption, foreign direct investment net inflows, GDP, and total trade were important factors in increasing CO 2 emission in the investigated countries. Thus, it is important for these counties to examine the requirements for foreign investment to promote environmental protection and increase the technological transfer through foreign companies to reduce the environmental damage. It is also important for them to adopt trade-related measures and policies to increase environmental protection since total trade increases CO 2 emission. It is also crucial for these countries to increase energy productivity to achieve their GDP growth.

DOI

[3]
Al-mulali Usama, Sab Che Normee Binti Che, 2012. The impact of energy consumption and CO2 emission on the economic growth and financial development in the Sub Saharan African countries.Energy, 39(1): 180-186.This study investigated the impact of energy consumption and CO2 emission on GDP (gross domestic product) growth and the financial development in thirty Sub Saharan African Countries. The panel model was used in this study from the period 1980 to 2008. The results showed that energy consumption had played an important role to increase both economic growth and the financial development in the investigated economies but with the consequence of high po llution. This study recommended that these countries should increase energy productivity by increasing energy efficiency, implementation of energy savings projects, energy conservation, and energy infrastructure outsourcing to achieve its financial development and GDP growth and to increase their investment on energy projects to achieve the full energy potential.

DOI

[4]
Aldy Joseph E, Stavins Robert N, 2012. Climate negotiators create an opportunity for scholars.Science, 337(6098): 1043-1044.

[5]
Ang B W, 1995. Decomposition methodology in industrial energy demand analysis.Energy, 20(11): 1081-1095.We discuss some methodological and application issues related to decomposing national industrial energy consumption into changes associated with aggregate industrial production level, production structure and sectoral energy intensity. Past studies are classified and reviewed with respect to study scope and decomposition technique. A framework for decomposition method formulation which incorporates three different approaches is presented. Several specific methods are described and their applications are illustrated with an example. Relevant application issues, such as method selection, periodwise vs time-series decomposition, significance of levels of sector disaggregation, and result interpretation are discussed.

DOI

[6]
Ang B W, Zhang F Q, 2000. A survey of index decomposition analysis in energy and environmental studies.Energy, 25(12): 1149-1176.Index decomposition methodology was a technique first used in the late 1970s to study the impact of changes in product mix on industrial energy demand. A survey in 1995 listed a total of 51 studies. Since then, many new studies and several new decomposition methods have been reported and the methodology has been increasingly used in energy-related environmental analysis. We trace these new developments, discuss method formulation using an index number framework, and classify more than one hundred studies based on application area, aggregate indicator, and decomposition scheme. Application issues useful to researchers undertaking new studies and possible areas for future research are presented.

DOI

[7]
Casler Stephen D, Rose Adam, 1998. Carbon dioxide emissions in the U.S. economy: A structural decomposition analysis.Environmental and Resource Economics, 11(3/4): 349-363.This paper provides an empirical analysis of the impact of various influences on carbon dioxide emissions. It incorporates methodological refinements of input-output structural decomposition analysis, which is the examination of economic change by means of a set of comparative static variations in key parameters of I-O tables. The analysis is performed using a two-tiered KLEM model, which allows for estimation of substitution and technological change effects within and between input aggregates. The model is used to decompose the sources of change in CO 2 emissions in the U.S. over the 1972鈥82 timeframe using hybrid energy/value tables for the initial and terminal years. Results show the significant effect of substitution within the energy sector and between energy and other inputs as the leading causes of the decline in carbon dioxide emissions.

DOI

[8]
Cheng Yeqing, Wang Zheye, Ye Xinyue et al., 2014. Spatiotemporal dynamics of carbon intensity from energy consumption in China.Journal of Geographical Sciences, 24(4): 631-650.The sustainable development has been seriously challenged by global climate change due to carbon emissions. As a developing country, China promised to reduce 40%鈥45% below the level of the year 2005 on its carbon intensity by 2020. The realization of this target depends on not only the substantive transition of society and economy at the national scale, but also the action and share of energy saving and emissions reduction at the provincial scale. Based on the method provided by the IPCC, this paper examines the spatiotemporal dynamics and dominating factors of China's carbon intensity from energy consumption in 1997鈥2010. The aim is to provide scientific basis for policy making on energy conservation and carbon emission reduction in China. The results are shown as follows. Firstly, China's carbon emissions increased from 4.16 Gt to 11.29 Gt from 1997 to 2010, with an annual growth rate of 7.15%, which was much lower than that of GDP(11.72%). Secondly, the trend of Moran's I indicated that China's carbon intensity has a growing spatial agglomeration at the provincial scale. The provinces with either high or low values appeared to be path-dependent or space-locked to some extent. Third, according to spatial panel econometric model, energy intensity, energy structure, industrial structure and urbanization rate were the dominating factors shaping the spatiotemporal patterns of China's carbon intensity from energy consumption. Therefore, in order to realize the targets of energy conservation and emission reduction, China should improve the efficiency of energy utilization, optimize energy and industrial structure, choose the low-carbon urbanization approach and implement regional cooperation strategy of energy conservation and emissions reduction.

DOI

[9]
Chu Steven, Majumdar Arun, 2012. Opportunities and challenges for a sustainable energy future.Nature, 488(7411): 294-303.Access to clean, affordable and reliable energy has been a cornerstone of the world's increasing prosperity and economic growth since the beginning of the industrial revolution. Our use of energy in the twenty–first century must also be sustainable. Solar and water–based energy generation, and engineering of microbes to produce biofuels are a few examples of the alternatives. This Perspective puts these opportunities into a larger context by relating them to a number of aspects in the transportation and electricity generation sectors. It also provides a snapshot of the current energy landscape and discusses several research and development opportunities and pathways that could lead to a prosperous, sustainable and secure energy future for the world.

DOI PMID

[10]
Chuai Xiaowei, Huang Xianjin, Wang Wanjing et al., 2012. Spatial econometric analysis of carbon emissions from energy consumption in China.Journal of Geographical Sciences, 22(4): 630-642.Based on energy consumption data of each region in China from 1997 to 2009 and using ArcGIS9.3 and GeoDA9.5 as technical support, this paper made a preliminary study on the changing trend of spatial pattern at regional level of carbon emissions from energy consumption, spatial autocorrelation analysis of carbon emissions, spatial regression analysis between carbon emissions and their influencing factors. The analyzed results are shown as follows. (1) Carbon emissions from energy consumption increased more than 148% from 1997 to 2009 but the spatial pattern of high and low emission regions did not change greatly. (2) The global spatial autocorrelation of carbon emissions from energy consumption increased from 1997 to 2009, the spatial autocorrelation analysis showed that there exists a “polarization” phenomenon, the centre of “High-High” agglomeration did not change greatly but expanded currently, the centre of “Low-Low” agglomeration also did not change greatly but narrowed currently. (3) The spatial regression analysis showed that carbon emissions from energy consumption has a close relationship with GDP and population, R-squared rate of the spatial regression between carbon emissions and GDP is higher than that between carbon emissions and population. The contribution of population to carbon emissions increased but the contribution of GDP decreased from 1997 to 2009. The carbon emissions spillover effect was aggravated from 1997 to 2009 due to both the increase of GDP and population, so GDP and population were the two main factors which had strengthened the spatial autocorrelation of carbon emissions.

DOI

[11]
Cyranoski David, 2007. China struggles to square growth and emissions.Nature, 446(7139): 954-955.Rapid development is seeing carbon dioxide levels soar.

DOI PMID

[12]
Dietzenbacher Erik, Los Bart, 1998. Structural decomposition techniques: Sense and sensitivity.Economic Systems Research, 10(4): 307-324.Structural decomposition techniques are widely used to break down the growth in some variable into the changes in its determinants. In this paper, we discuss the problems caused by the existence of a multitude of equivalent decomposition forms which are used to measure the contribution of a specific determinant. Although it is well known that structural decompositions are not unique, the extent of the problem and its consequences seem to have been largely neglected. In an empirical analysis for The Netherlands between 1986 and 1992, results are calculated for 24 equivalent decomposition forms. The outcomes exhibit a large degree of variability across the different forms. We also examine the two approaches that have been used predominantly in the literature. The average of the two so-called polar decompositions appears to be remarkably close to the average of the full set of 24 decompositions. The approximate decomposition with mid-point weights appears to be almost exact. Although this last alternative might seem a solution to the problem of the marked sensitivity, in fact, it only conceals the problem.

DOI

[13]
Du Huibin, Guo Jianghong, Mao Guozhu et al., 2011. CO2 emissions embodied in China-US trade: Input-output analysis based on the emergy/dollar ratio.Energy Policy, 39(10): 5980-5987.To gain insight into changes in CO 2 emissions embodied in China–US trade, an input–output analysis based on the emergy/dollar ratio (EDR) is used to estimate embodied CO 2 emissions; a structural decomposition analysis (SDA) is employed to analyze the driving factors for changes in CO 2 emissions embodied in China's exports to the US during 2002–2007. The results of the input–output analysis show that net export of CO 2 emissions increased quickly from 2002 to 2005 but decreased from 2005 to 2007. These trends are due to a reduction in total CO 2 emission intensity, a decrease in the exchange rate, and small imports of embodied CO 2 emissions. The results of the SDA demonstrate that total export volume was the largest driving factor for the increase in embodied CO 2 emissions during 2002–2007, followed by intermediate input structure. Direct CO 2 emissions intensity had a negative effect on changes in embodied CO 2 emissions. The results suggest that China should establish a framework for allocating emission responsibilities, enhance energy efficiency, and improve intermediate input structure.

DOI

[14]
Feng Kuishuang, Davis Steven J, Sun Laixiang et al., 2013. Outsourcing CO2 within China.Proceedings of the National Academy of Sciences, 110(28): 11654-11659.

[15]
Feng Kuishuang, Davis Steven J, Sun Laixiang et al., 2015. Drivers of the US CO2 emissions 1997-2013.Nature Communications, (6): 7714.Fossil fuel CO2 emissions in the United States decreased by ~11% between 2007 and 2013, from 6,023 to 5,377 Mt. This decline has been widely attributed to a shift from the use of coal to natural gas in US electricity production. However, the factors driving the decline have not been quantitatively evaluated; the role of natural gas in the decline therefore remains speculative. Here we analyse the factors affecting US emissions from 1997 to 2013. Before 2007, rising emissions were primarily driven by economic growth. After 2007, decreasing emissions were largely a result of economic recession with changes in fuel mix (for example, substitution of natural gas for coal) playing a comparatively minor role. Energy鈥揷limate policies may, therefore, be necessary to lock-in the recent emissions reductions and drive further decarbonization of the energy system as the US economy recovers and grows.

DOI PMID

[16]
Feng Kuishuang, Siu Yim Ling, Guan Dabo et al., 2012. Analyzing drivers of regional carbon dioxide emissions for China.Journal of Industrial Ecology, 16(4): 600-611.China faces the challenge of balancing unprecedented economic growth and environmental sustainability. Rather than a homogenous country that can be analyzed at the national level, China is a vast country with significant regional differences in physical geography, regional economy, demographics, industry structure, and household consumption patterns. There are pronounced differences between the much-developed Eastern-Coastal economic zone and the less developed Central and Western economic zones in China. Such variations lead to large regional discrepancies in carbon dioxide (CO2) emissions. Using the 28 regional input-output tables of China for 2002 and 2007 and structural decomposition analysis (SDA), we analyze how changes in population, technology, economic structure, urbanization, and household consumption patterns drive regional CO2 emissions.The results show a significant gap between the three economic zones in terms of CO2 emission intensity, as the Eastern-Coastal zone possesses more advanced production technologies compared to the Central and Western zones. The most polluting sectors and largest companies are state-owned enterprises and thus are potentially able to speed up knowledge transfer between companies and regions. The 鈥済reening鈥 of the more developed areas is not only a result of superior technology, but also of externalizing production and pollution to the poorer regions in China. The results also show that urbanization and associated income and lifestyle changes were important driving forces for the growth of CO2 emissions in most regions in China. Therefore, focusing on technology and efficiency alone is not sufficient to curb regional CO2 emissions.

DOI

[17]
Geng Yong, Zhao Hongyan, Liu Zhu et al., 2013. Exploring driving factors of energy-related CO2 emissions in Chinese provinces: A case of Liaoning.Energy Policy, 60: 820-826.In order to uncover driving forces for provincial CO 2 emission in China, a case study was undertaken to shed light on the CO 2 emission growth in such a region. Liaoning province was selected due to its typical features as one industrial province. The environmental input鈥搊utput analysis and structure decomposing analysis have been conducted in order to provide a holistic picture on Liaoning's CO 2 emissions during 1997鈥2007. Research outcomes indicate that rapid increase of per capita consumption activities is the main driver for Liaoning to have a significant CO 2 emission growth, followed by consumption structure, production structure and population size. Energy intensity and energy structure partly offset the CO 2 emission increase. Electricity power and heat supply and construction sectors caused the most CO 2 emission, indicating that more specific mitigation policies for these two sectors should be prepared. From final demand point of view, it is clear that trade plays a leading role in regional CO 2 emission, followed by fixed capital investment and urban household consumption which become increasingly important over time. Consequently, in order to realize low carbon development, local governments should consider all these factors so that appropriate mitigation policies can be raised by considering the local realities.

DOI

[18]
Gregg Jay S, Andres Robert J, Marland Gregg, 2008. China: Emissions pattern of the world leader in CO2 emissions from fossil fuel consumption and cement production.Geophysical Research Letters, 35(8): L08806.Release of carbon dioxide (CO) from fossil fuel combustion and cement manufacture is the primary anthropogenic driver of climate change. Our best estimate is that China became the largest national source of COemissions during 2006. Previously, the United States (US) had occupied that position. However, the annual emission rate in the US has remained relatively stable between 2001-2006 while the emission rate in China has more than doubled, apparently eclipsing that of the US in late 2006. Here we present the seasonal and spatial pattern of COemissions in China, as well as the sectoral breakdown of emissions. Though our best point estimate places China in the lead position in terms of COemissions, we qualify this statement in a discussion of the uncertainty in the underlying data (3-5% for the US; 15-20% for China). Finally, we comment briefly on the implications of China's new position with respect to international agreements to mitigate climate change.

DOI

[19]
Guan Dabo, Hubacek Klaus, Weber Christopher L et al., 2008. The drivers of Chinese CO2 emissions from 1980 to 2030.Global Environmental Change, 18(4): 626-634.China's energy consumption doubled within the first 25 years of economic reforms initiated at the end of the 1970s, and doubled again in the past 5 years. It has resulted of a threefold CO 2 emissions increase since early of 1980s. China's heavy reliance on coal will make it the largest emitter of CO 2 in the world. By combining structural decomposition and input utput analysis we seek to assess the driving forces of China's CO 2 emissions from 1980 to 2030. In our reference scenario, production-related CO 2 emissions will increase another three times by 2030. Household consumption, capital investment and growth in exports will largely drive the increase in CO 2 emissions. Efficiency gains will be partially offset the projected increases in consumption, but our scenarios show that this will not be sufficient if China's consumption patterns converge to current US levels. Relying on efficiency improvements alone will not stabilize China's future emissions. Our scenarios show that even extremely optimistic assumptions of widespread installation of carbon dioxide capture and storage will only slow the increase in CO 2 emissions.

DOI

[20]
Guan Dabo, Peters Glen P, Weber Christopher L et al., 2009. Journey to world top emitter: An analysis of the driving forces of China’s recent CO2 emissions surge.Geophysical Research Letters, 36(4): L04709.China's economy has been growing at an accelerated rate from 2002 to 2005 and with it China's carbon emissions. It is easier to understand the growth in China's carbon emissions by considering which consumption activities - households and government, capital investments, and international trade - drive Chinese production and hence emissions. This paper adopts structural decomposition analysis, ...

DOI

[21]
Guan Dabo, Su Xin, Zhang Qiang et al., 2014. The socioeconomic drivers of China’s primary PM2.5 emissions.Environmental Research Letters, 9(2): 024010.Primary PMemissions contributed significantly to poor air quality in China. We present an interdisciplinary study to measure the magnitudes of socioeconomic factors in driving primary PM emission changes in China between 1997-2010, by using a regional emission inventory as input into an environmentally extended input-output framework and applying structural decomposition analysis. Our results show that China's significant efficiency gains fully offset emissions growth triggered by economic growth and other drivers. Capital formation is the largest final demand category in contributing annual PM emissions, but the associated emission level is steadily declining. Exports is the only final demand category that drives emission growth between 1997-2010. The production of exports led to emissions of 638 thousand tonnes of PM, half of the EU27 annual total, and six times that of Germany. Embodied emissions in Chinese exports are largely driven by consumption in OECD countries.

DOI

[22]
He Gang, Avrin Anne-Perrine, Nelson James H et al., 2016. SWITCH-China: A systems approach to decarbonizing China’s power system.Environmental Science & Technology, 50(11): 5467-5473.Abstract We present an integrated model, SWITCH-China, of the Chinese power sector to analyze the economic and technological implications of a medium to long-term decarbonization scenario while accounting for very short-term renewable variability. Based on the model and assumptions used, we find that the announced 2030 carbon peak can be achieved with a carbon price of ~$40/tCO2. Current trends in renewable energy price reductions alone are insufficient to replace coal, however, an 80% carbon emission reduction by 2050 is achievable in the IPCC Target Scenario with an optimal electricity mix in 2050 including nuclear (14%), wind (23%), solar (27%), hydro (6%), gas (1%), coal (3%), CCS coal (26%). The co-benefits of carbon-price strategy would offset 22% to 42% of the increased electricity costs if the true cost of coal and social cost of carbon are incorporated. In such a scenario, aggressive attention to research and both technological and financial innovation mechanisms are crucial to enable the transition at reasonable cost, along with strong carbon policies.

DOI PMID

[23]
Jiang Bing, Sun Zhenqing, Liu Meiqin, 2010. China’s energy development strategy under the low-carbon economy.Energy, 35(11): 4257-4264.The long-term goal of 50% mitigation of the green house gas till 2050 was determined by the participants of G8 summit in July 2008. As long as this goal was set, the emission from China economy and energy industry development has to be reduced significantly. In order to cope with the climate change and to promote China's economic growth and the energy security, low-carbon economy should be adopted. Clean energy, including the new energy and the renewable energy, should be developed and deployed; related laws, statutes, the management institutions and mechanisms should be established; and public awareness of energy saving and green house gas (GHG) mitigation has to be enhanced.

DOI

[24]
Le Quéré Corinne, Raupach Michael R, Canadell Josep G et al., 2009. Trends in the sources and sinks of carbon dioxide.Nature Geoscience, 2(12): 831-836.Efforts to control climate change require the stabilization of atmospheric CO2 concentrations. This can only be achieved through a drastic reduction of global CO2 emissions. Yet fossil fuel emissions increased by 29% between 2000 and 2008, in conjunction with increased contributions from emerging economies, from the production and international trade of goods and services, and from the use of coal as a fuel source. In contrast, emissions from land-use changes were nearly constant. Between 1959 and 2008, 43% of each year's CO2 emissions remained in the atmosphere on average; the rest was absorbed by carbon sinks on land and in the oceans. In the past 50 years, the fraction of CO2 emissions that remains in the atmosphere each year has likely increased, from about 40% to 45%, and models suggest that this trend was caused by a decrease in the uptake of CO2 by the carbon sinks in response to climate change and variability. Changes in the CO2 sinks are highly uncertain, but they could have a significant influence on future atmospheric CO2 levels. It is therefore crucial to reduce the uncertainties.

DOI

[25]
Li Fangyi, Liu Weidong, Tang Zhipeng, 2013. Study on inter-regional transfer of embodied pollution in China.Acta Geographica Sinica, 68(6): 791-801. (in Chinese)Embodied resources and pollution in international trade have been drawing attention in environmental policies research area in the context of increased level of world economy integration. However, transfer pattern of embodied pollution of China is lack of detailed research. In this study, firstly, phenomena and modes of embodied pollution transfer across regions were analyzed from the geographic perspective. It was suggested that the primary reasons for embodied pollution transfer were regional division of labor and separation of production and consumption locations. Secondly, based on a multi-regional input-output table of 30 provinces of China in 2007, an assessment model was built to assess embodied pollution of regions and that in the trade across regions. Then, four types of industrial pollutants, namely SO2, COD, solid waste and heavy metal were selected as typical pollutants and quantified according to the model, after which the spatial pattern of embodied pollution transfer of China was clarified. The results revealed that China's mainland was a net exporter of embodied pollution due to international trade. On the other hand, embodied pollution was transferred from central and western regions to eastern region within domestic trade, while eastern China was much more developed than other regions in economy and urbanization. Actually, the burden of pollution abatement of eastern region was transferred to central and western regions through inter-regional trade. Beijing, Shanghai, Guangdong, Jiangsu and Zhejiang were main regions of inputting embodied pollution, while Hebei, Shanxi, Inner Mongolia and Guangxi were main regions of outputting embodied pollution, where the development at the expense of environmental quality would be unsustainable. The spatial pattern of embodied pollution transfer of China, which goes against regional equity, will turn regional economic differences into regional environmental differences in the future. Finally, some suggestions on pollution abatement were made accordingly based on the analysis.

[26]
Li Huanan, Mu Hailin, Zhang Ming et al., 2011. Analysis on influence factors of China’s CO2 emissions based on Path-STIRPAT model.Energy Policy, 39(11): 6906-6911.With the intensification of global warming and continued growth in energy consumption, China is facing increasing pressure to cut its CO 2 (carbon dioxide) emissions down. This paper discusses the driving forces influencing China's CO 2 emissions based on Path–STIRPAT model—a method combining Path analysis with STIRPAT (stochastic impacts by regression on population, affluence and technology) model. The analysis shows that GDP per capita ( A ), industrial structure ( IS ), population ( P ), urbanization level ( R ) and technology level ( T ) are the main factors influencing China's CO 2 emissions, which exert an influence interactively and collaboratively. The sequence of the size of factors' direct influence on China's CO 2 emission is A > T > P > R > IS , while that of factors' total influence is A > R > P > T > IS . One percent increase in A , IS , P , R and T leads to 0.44, 1.58, 1.31, 1.12 and 611.09 percentage change in CO 2 emission totally, where their direct contribution is 0.45, 0.07, 0.63, 0.08, 0.92, respectively. Improving T is the most important way for CO 2 reduction in China.

DOI

[27]
Li Huanan, Mu Hailin, Zhang Ming et al., 2012. Analysis of regional difference on impact factors of China’s energy-related CO2 emissions.Energy, 39(1): 319-326.With the intensification of global warming, the issue of carbon emissions causes more and more attention in recent years. In this paper, China’s 30 provincial-level administrative units are divided into five emission regions according to the annual average value of provincial CO 2 emissions per capita during 1990 and 2010. The regional differences in impact factors on CO 2 emissions are discussed using STIRPAT (stochastic impacts by regression on population, affluence, and technology) model. The results indicate that although GDP (Gross domestic product) per capita, industrial structure, population, urbanization and technology level have different impacts on CO 2 emissions in different emission regions, they are almost always the main factors in all emission regions. In most emission regions, urbanization and GDP per capita has a bigger impact on CO 2 emissions than other factors. Improving technology level produces a small reduction in CO 2 emissions in most emission regions, but it is still a primary way for CO 2 reduction in China. It’s noteworthy that industrial structure isn’t the main factor and improving technology level increases CO 2 emissions in high emission region. Different measures should be adopted for CO 2 reductions according to local conditions in different regions.

DOI

[28]
Li J S, Chen G Q, 2013. Energy and greenhouse gas emissions review for Macao.Renewable and Sustainable Energy Reviews, 22: 23-32.Although Macao is one of the individual members of the Kyoto Protocol, a holistic picture to draw its energy consumption and GHG emissions has been lacking. A comprehensive review of energy consumption as well as GHG emissions is presented in this study for Macao since the handover of sovereignty to China. The results show that the Macao’s energy consumption and its related GHG emissions were 32,700 Terajoules (Tj) and 3.70E+0602t02CO 2 02e. in 2010, increased by 31.10% and 100.34% over those of 2000, respectively. The results also indicate that electricity is the biggest contributor to GHG emissions, and induced a large amount of GHG emissions in other places. Energy intensity and per capita GHG emission also witnessed growth from 2000 to 2010. In terms of sectors of the economy, the service industry, commerce, restaurants and hotels, transportation and households are the leading four energy users and GHG emission inducers. Our analysis also suggests that decision-makers should take indirect emissions from energy consumption into consideration to support Macao’s energy, climate and sustainability initiatives.

DOI

[29]
Liang Sai, Liu Zhu, Crawford-Brown Douglas et al., 2014. Decoupling analysis and socioeconomic drivers of environmental pressure in China.Environmental Science & Technology, 48(2): 1103-1113.China's unprecedented change offers a unique opportunity for uncovering relationships between economic growth and environmental pressure. Here we show the trajectories of China's environmental pressure and reveal underlying socioeconomic drivers during 1992-2010. Mining and manufacturing industries are the main contributors to increasing environmental pressure from the producer perspective. Changes in urban household consumption, fixed capital formation, and exports are the main drivers from the consumer perspective. While absolute decoupling is not realized, China has in general achieved relative decoupling between economic growth and environmental pressure. China's decoupling performance has four distinguishable periods, closely aligning with nation-wide major policy adjustments, which indicates significant impact of China's national socioeconomic policies on its environmental pressure. Material intensity change is the main contributor to the mitigation of environmental pressure, except for ammonia nitrogen, solid wastes, aquatic Cu, and aquatic Zn. Production structure change is the largest contributor to mitigate ammonia nitrogen emissions, and final demand structure change is the largest contributor to mitigate emissions of solid wastes, aquatic Cu, and aquatic Zn. We observe materialization trends for China's production structure and final demand structure during 2002-2007. Environmental sustainability can only be achieved by timely technology innovation and changes of production structure and consumption pattern.

DOI PMID

[30]
Liang Sai, Xu Ming, Liu Zhu et al., 2013. Socioeconomic drivers of mercury emissions in China from 1992 to 2007.Environmental Science & Technology, 47(7): 3234-3240.Abstract Mercury emissions in China have increased by 164% during 1992-2007. While major mercury producers were among energy combustion and nonferrous metal sectors, little is known for the socioeconomic factors driving the growth of emissions. In this paper we examine the underlying drivers and their contributions to the change of mercury emissions. Results show that changes in per capita GDP and GDP composition led to increased emissions which offset the reduction of emissions made possible by technology-induced decrease of mercury emissions intensity and changes in final demand mix. In particular, changes in final demand mix caused decreasing mercury emissions from 1992 to 2002 and increasing emissions from 2002 to 2007. Formation of fixed capital was the dominant driver behind the increase of mercury emissions, followed by the increasing urban population and net exports. This systems-based examination of socioeconomic drivers for China's mercury emission increase is critical for emission control by guiding policy-making and targets of technology development.

DOI PMID

[31]
Liang Sai, Zhang Tianzhu, 2011. What is driving CO2 emissions in a typical manufacturing center of South China? The case of Jiangsu Province.Energy Policy, 39(11): 7078-7083.Investigating CO 2 emissions of China's manufacturing centers contributes to local and global CO 2 mitigation targets. This study considers Jiangsu Province as a representation of manufacturing centers in South China. Effects of material efficiency improvements, technology development, consumption structure changes and consumption volume growth in Jiangsu Province on its CO 2 emissions during 1997鈥2007 are investigated using structural decomposition analysis based on environmental input鈥搊utput table. In order to reduce CO 2 emissions, Jiangsu Province should not only rely on material efficiency improvements and technology development, but also rely on consumption structure changes. For consumption structure changes in detail, Jiangsu Province should not only focus on fixed capital formation and urban residential consumption, but also focus on international and intranational imports and exports. For the implementation of material efficiency improvements and technology development, Jiangsu Province should focus on technology innovation and international technology transfer. For the implementation of consumption structure changes, Jiangsu Province should mainly focus on identified sectors for each separate final demand category: five sectors for urban residential consumption, three sectors for fixed capital formation, four sectors for international exports, five sectors for intranational exports, three sectors for international imports and four sectors for intranational imports.

DOI

[32]
Liu Hongguang, Liu Weidong, Fan Xiaomei et al., 2015a. Carbon emissions embodied in value added chains in China.Journal of Cleaner Production, 103: 362-370.The literature on carbon leakage and embodied carbon in regional trade is extensive. However, many studies are primarily concerned with emissions embodied in demand-supply chains and ignore the issue of carbon transfer behind the value-added chains. We promote a model to calculate value-based emissions (VBEs) and carbon emissions embodied in the value-added chain using the multi-regional input鈥搊utput model (MRIO). Taking China as an example, VBEs and carbon emissions embodied in value-added chains at the sub-national level based on MRIO tables for 1997 and 2007 in China were analyzed. Transferred carbon emissions embodied in regional value-added chains in China showed rapid growth between 1997 and 2007. However, the absolute values of inter-regional net transferred carbon emissions embodied in value added chains were small and showed a declining trend. Therefore, the regional inequality between economic growth and carbon emissions pollution reduced between 1997 and 2007, although the amount of emissions embodied in regional value-added chains increased as of the inter-regional economic link in China gained close proximity.

DOI

[33]
Liu Hongguang, Liu Weidong, Fan Xiaomei et al., 2015b. Carbon emissions embodied in demand-supply chains in China.Energy Economics, 50: 294-305.

[34]
Liu Weidong, Song Zhouying, Liu Zhigao, 2016. Progress of economic geography in China’s mainland since 2000.Journal of Geographical Sciences, 26(8): 1019-1040.Economic geography in China’s mainland has developed in a different way from that in many other countries. On the one hand, it has been increasingly active in participating in academic dialogues and knowledge development led by Anglophone countries; on the other hand, it takes practice-based and policy-oriented research, i.e. satisfying the demands from the Chinese government and society, as the linchpin of research. Since there has been a lot of literature reviewing the development of economic geography in the country before the new millennium, this paper will make a comprehensive analysis of the discipline in 2000–2015, based on a bibliometric survey and research projects done by Chinese economic geographers. The analysis indicates that (1) economic geography research in China’s mainland is unevenly distributed but concentrated in several leading institutions; (2) traditional research fields like human-nature system, regional disparity, industrial location and transportation geography remain dominant while new topics such as globalization, multinational corporations and foreign direct investments, information and communication technology, producer services, climate change and carbon emission emerge as important research areas; (3) Chinese economic geography is featured by policy-oriented research funded by government agencies, having considerable impacts on regional policy making in China, both national and regional. To conclude, the paper argues that the development of economic geography in China’s mainland needs to follow a dual track in the future, i.e. producing knowledge for the international academic community and undertaking policy-oriented research to enhance its role as a major consulting body for national, regional and local development.

DOI

[35]
Liu Weidong, Liu Hongguang, Fan Xiaomei et al., 2012. Sector-specific spatial statistic model for estimating inter-regional trade Flows: A case study of agricultural, chemical and electronic sectors in China.Acta Geographica Sinica, 67(2): 147-156. (in Chinese)Based on theories of regional interactions and competition and the gravity model,this paper first develops a sector-specific spatial statistic model to estimate inter-regionaltrade flows by employing a geographically weighted regression technique.The model takesinto consideration sector-specific input-output relationships.That is,in some sectors thereexists strong competition between regions while other sectors may need close inter-regionalcooperation in terms of supply linkages.The former case results in less inter-regional tradebut the latter witnesses more trade.The model also introduces the spatial lag factor of tradeflows between regions.Then,the paper applies the model to estimate inter-provincial tradeflows of three sample sectors,i.e.,agriculture,chemistry and electronics,with data from the2007 provincial input-output tables of China.The computing result shows that thesector-specific model can significantly increase the reliability of inter-regional trade flowestimation.It also reveals that the bandwidth of weighting function is a key factor in thesector-specific model;that is,the smaller the bandwidth,the more the trade flows.To acertain degree,the bandwidth reflects the degree of geographical concentration of economicactivities while the bandwidth itself is different from sector to sector.Different sectors displaydifferent features of inter-regional trade flows.For example,agricultural trade flows aremainly from the inland provinces to the coastal ones and show strong intra-sector competitionwhile trade flows of chemical and electronic sectors take place mainly inside the coastalregions and show an intra-sector cooperation relationship.

DOI

[36]
Liu Weidong, Liu Hongguang, Tang Zhipeng et al., 2010. The impacts of exports on regional economic development and industrial restructuring in China.Acta Geographica Sinica, 65(4): 407-415. (in Chinese)In the last two decades,especially since joining the World Trade Organization in 2002,China has witnessed a rapid growth in international trade of commodities,which is seen as a major driver to its economic growth.The rise of China as a major import export country,not only changes the world's economic geography,but also has significant impacts on its domestic economic geography.The European Union (EU),USA and Japan are the largest trade partners of China,accounting for about half of China's import export in 2008.Given the economic difficulties faced by both China and others as a result of the current world-wide financial crisis,it is meaningful to examine the impacts of Chinese exports to the EU,USA and Japan on the development of both sides.In this paper,we will focus on such impacts on regional development in China.We try to compute the contribution of Sino-EU,Sino-USA and Sino-Japan exports to provincial GDP growth and industrial restructuring in China in terms of value-added.We find the exports to the EU,USA and Japan have major contributions to economic growth and industrial upgrading in some coastal provinces,e.g.Shanghai,Jiangsu and Guangdong.

DOI

[37]
Liu Yansui, Yan Bin, Zhou Yang, 2016. Urbanization, economic growth, and carbon dioxide emissions in China: A panel cointegration and causality analysis.Journal of Geographical Sciences, 26(2): 131-152.Elucidating the complex mechanism between urbanization,economic growth,carbon dioxide emissions is fundamental necessary to inform effective strategies on energy saving and emission reduction in China. Based on a balanced panel data of 31 provinces in China over the period 1997鈥2010,this study empirically examines the relationships among urbanization,economic growth and carbon dioxide(CO2) emissions at the national and regional levels using panel cointegration and vector error correction model and Granger causality tests. Results showed that urbanization,economic growth and CO2 emissions are integrated of order one. Urbanization contributes to economic growth,both of which increase CO2 emissions in China and its eastern,central and western regions. The impact of urbanization on CO2 emissions in the western region was larger than that in the eastern and central regions. But economic growth had a larger impact on CO2 emissions in the eastern region than that in the central and western regions. Panel causality analysis revealed a bidirectional long-run causal relationship among urbanization,economic growth and CO2 emissions,indicating that in the long run,urbanization does have a causal effect on economic growth in China,both of which have causal effect on CO2 emissions. At the regional level,we also found a bidirectional long-run causality between land urbanization and economic growth in eastern and central China. These results demonstrated that it might be difficult for China to pursue carbon emissions reduction policy and to control urban expansion without impeding economic growth in the long run. In the short-run,we observed a unidirectional causation running from land urbanization to CO2 emissions and from economic growth to CO2 emissions in the eastern and central regions. Further investigations revealed an inverted N-shaped relationship between CO2 emissions and economic growth in China,not supporting the environmental Kuznets curve(EKC) hypothesis. Our empirical findings have an important reference value for policy-makers in formulating effective energy saving and emission reduction strategies for China.

DOI

[38]
Liu Zhu, Liang Sai, Geng Yong et al., 2012. Features, trajectories and driving forces for energy-related GHG emissions from Chinese mega cites: The case of Beijing, Tianjin, Shanghai and Chongqing.Energy, 37(1): 245-254.With China’s rapid economic development and urbanization process, cities are facing great challenges for tackling anthropogenic climate change. In this paper we present features, trajectories and driving forces for energy-related greenhouse gas (GHG) emissions from four Chinese mega-cities (Beijing, Tianjin, Shanghai and Chongqing) during 1995–2009. First, top-down GHG inventories of these four cities, including direct emissions (scope 1) and emissions from imported electricity (scope 2) are presented. Then, the driving forces for the GHG emission changes are uncovered by adopting a time serial LMDI decomposition analysis. Results indicate that annual GHG emission in these four cities exceeds more than 500 million tons and such an amount is still rapidly growing. GHG emissions are mainly generated from energy use in industrial sector and coal-burning thermal power plants. The growth of GHG emissions in four mega-cities during 1995–2009 is mainly due to economic activity effect, partially offset by improvements in carbon intensity. Besides, the proportion of indirect GHG emission from imported energy use (scope 2) keeps growing, implying that big cities are further dependent on energy/material supplies from neighboring regions. Therefore, a comprehensive consideration on various perspectives is needed so that different stakeholders can better understand their responsibilities on reducing total GHG emissions.

DOI

[39]
Ma Zhixiao, Xue Bing, Geng Yong et al., 2013. Co-benefits analysis on climate change and environmental effects of wind-power: A case study from Xinjiang, China.Renewable Energy, 57: 35-42.The combustion of fossil fuel contributes to not only global warming but also the emissions of air pollutants. In China, the rapid growth of energy consumption leads to a large quantity of greenhouse gas (GHG) and air pollutant emissions. Although many measures have been proposed by the local governments to mitigate the GHG emissions and improve air quality, limited economic resources slow the efforts of the local government to implement measures to control both types of emissions. The co-benefits approach can use resources efficiently to solve multiple environmental problems. In this study, we first calculated the CO 2 and air pollutants (SO 2 , NO x and PM 2.5 ) emissions in Xinjiang Uygur Autonomous Region. Then, the co-benefits of wind power, including mitigation of CO 2 and air pollutants (SO 2 , NO x and PM 2.5 ) emissions and water savings, were assessed and quantified in the Xinjiang Uygur Autonomous Region. The results demonstrate that, during the 11th five-year period (2006–2010), emissions mitigation by wind power accounted for 4.88% (1065×10 4 t) of CO 2 , 4.31% (4.38×10 4 t) of SO 2 , 8.23% (3.41×10 4 t) of NO x and 4.23% (0.32×10 4 t) of PM 2.5 emission by the thermal power sector. The total economic co-benefits of wind power accounted for 0.46% (1.38 billion 2009US$) of the GDP of Xinjiang during 2006–2010.

DOI

[40]
Malakoff David, 2014. China’s peak carbon pledge raises pointed questions.Science, 346(6212): 903.

[41]
Minx Jan C, Baiocchi Giovanni, Peters Glen P et al., 2011. A “Carbonizing Dragon”: China’s fast growing CO2 emissions revisited.Environmental Science & Technology, 45(21): 9144-9153.China's annual CO(2) emissions grew by around 4 billion tonnes between 1992 and 2007. More than 70% of this increase occurred between 2002 and 2007. While growing export demand contributed more than 50% to the CO(2) emission growth between 2002 and 2005, capital investments have been responsible for 61% of emission growth in China between 2005 and 2007. We use structural decomposition analysis to identify the drivers for China's emission growth between 1992 and 2007, with special focus on the period 2002 to 2007 when growth was most rapid. In contrast to previous analysis, we find that efficiency improvements have largely offset additional CO(2) emissions from increased final consumption between 2002 and 2007. The strong increases in emissions growth between 2002 and 2007 are instead explained by structural change in China's economy, which has newly emerged as the third major emission driver. This structural change is mainly the result of capital investments, in particular, the growing prominence of construction services and their carbon intensive supply chain. By closing the model for capital investment, we can now show that the majority of emissions embodied in capital investment are utilized for domestic household and government consumption (35-49% and 19-36%, respectively) with smaller amounts for the production of exports (21-31%). Urbanization and the associated changes in lifestyle are shown to be more important than other socio-demographic drivers like the decreasing household size or growing population. We argue that mitigation efforts will depend on the future development of these key drivers, particularly capital investments which dictate future mitigation costs.

DOI PMID

[42]
O'Neill Brian C, D Dalton Michael Fuchs Regina et al., 2010. Global demographic trends and future carbon emissions. Proceedings of the National Academy of Sciences, 107(41): 17521-17526.

[43]
Peters Glen P, Andrew Robbie M, Boden Tom et al., 2013. The challenge to keep global warming below 2 [deg]C.Nature Clim. Change, 3(1): 4-6.

[44]
Peters Glen P, Weber Christopher L, Guan Dabo et al., 2007. China’s growing CO2 emissions A race between increasing consumption and efficiency gains.Environmental Science & Technology, 41(17): 5939-5944.China's rapidly growing economy and energy consumption are creating serious environmental problems on both local and global scales. Understanding the key drivers behind China's growing energy consumption and the associated CO2 emissions is critical for the development of global climate policies and provides insight into how other emerging economies may develop a low emissions future. Using recently released Chinese economic input-output data and structural decomposition analysis we analyze how changes in China's technology, economic structure, urbanization, and lifestyles affect CO2 emissions. We find that infrastructure construction and urban household consumption, both in turn driven by urbanization and lifestyle changes, have outpaced efficiency improvements in the growth of CO2 emissions. Net trade had a small effect on total emissions due to equal, but significant, growth in emissions from the production of exports and emissions avoided by imports. Technology and efficiency improvements have only partially offset consumption growth, but there remains considerable untapped potential to reduce emissions by improving both production and consumption systems. As China continues to rapidly develop there is an opportunity to further implement and extend policies, such as the Circular Economy, that will help China avoid the high emissions path taken by today's developed countries.

DOI

[45]
Piao Shilong, Ciais Philippe, Huang Yao et al., 2010. The impacts of climate change on water resources and agriculture in China.Nature, 467(7311): 43-51.Abstract China is the world's most populous country and a major emitter of greenhouse gases. Consequently, much research has focused on China's influence on climate change but somewhat less has been written about the impact of climate change on China. China experienced explosive economic growth in recent decades, but with only 7% of the world's arable land available to feed 22% of the world's population, China's economy may be vulnerable to climate change itself. We find, however, that notwithstanding the clear warming that has occurred in China in recent decades, current understanding does not allow a clear assessment of the impact of anthropogenic climate change on China's water resources and agriculture and therefore China's ability to feed its people. To reach a more definitive conclusion, future work must improve regional climate simulations-especially of precipitation-and develop a better understanding of the managed and unmanaged responses of crops to changes in climate, diseases, pests and atmospheric constituents.

DOI PMID

[46]
Qiu Jane, 2008. China asks world to step up on climate.Nature, 456(7219): 151.Nature. 2008 Nov 13;456(7219):151. doi: 10.1038/456151a. News

DOI PMID

[47]
Qiu Jane, 2009. China’s climate target: Is it achievable?Nature, 462(7273): 550-551.Nature - the world's best science and medicine on your desktop

DOI PMID

[48]
Qiu Jane, 2011. China unveils green targets.Nature, 471(7337): 149.

[49]
Rose Adam, Casler Stephen, 1996. Input-output structural decomposition analysis: A critical appraisal.Economic Systems Research, 8(1): 33-62.

[50]
Shen Lei, Sun Yanzhi, 2016. Review on carbon emissions, energy consumption and low-carbon economy in China from a perspective of global climate change.Journal of Geographical Sciences, 26(7): 855-870.

DOI

[51]
Streets David G, Jiang Kejun, Hu Xiulian et al., 2001. Recent reductions in China’s greenhouse gas emissions.Science, 294(5548): 1835-1837.

[52]
Su Bin, Ang B W, 2012. Structural decomposition analysis applied to energy and emissions: Some methodological developments.Energy Economics, 34(1): 177-188.The only comprehensive study comparing structural decomposition analysis (SDA) and index decomposition analysis (IDA) was conducted around 2000. There have since been new developments in both techniques in energy and emission studies. These developments have been studied systematically for IDA but similar studies for SDA are lacking. In this paper, we fill the gap by examining the new methodological developments in SDA. A new development is a shift towards using decomposition methods that are ideal. We compare four such SDA methods analytically and empirically through decomposing changes in China's CO 2 emissions. We then provide guidelines on method selection. Finally, we discuss the similarities and differences between SDA and IDA based on the latest available information.

DOI

[53]
Su Bin, Ang B W, Low M, 2013. Input-output analysis of CO2 emissions embodied in trade and the driving forces: Processing and normal exports.Ecological Economics, 88: 119-125.78 We study the issue of exports assumptions in embodied emission studies and structural decomposition analysis. 78 The implications of the results obtained using two different exports assumptions are not the same. 78 Utilization of traditional I–O model results in an overestimation of emissions embodied in processing exports. 78 Utilization of traditional I–O model results in an underestimation of emissions embodied in normal exports. 78 The choice of exports assumption has more impact on the decomposition results for processing exports.

DOI

[54]
Tang Zhipeng, Liu Weidong, Gong Peiping, 2014. Measuring of Chinese regional carbon emission spatial effects induced by exports based on Chinese multi-regional input-output table during 1997-2007.Acta Geographica Sinica, 69(10): 1403-1413.Based on the multi- regional input- output theory, this paper improves four traditional input- output formulas about exports resulting in multi- regional carbon emissions spatial effects which include direct effect, indirect effect, spillover effect and feedback effect.And the latter two formulas are to measure the bidirectional influences of carbon emissions induced by regional exports between two regions. The results suggest that the direct effects of China's eight regions induced by national exports decreased from 1997 to 2007, and the indirect effects induced by national exports also decreased in most parts of China except the northern coastal and northwestern parts. During this period, most of China's coastal regions had strong spillover effects generated by their exports. The northern coastal and eastern coastal regions had stronger feedback effects, while the southern coastal region had weaker feedback effects and Beijing-Tianjin region had the weakest feedback effect brought by their exports respectively. All of the inland regions had strong feedback effects, especially for the northwest and central China due to their exports. More attention should be paid to interregional joint implementation so as to effectively achieve China's national carbon- reduction target.

DOI

[55]
Tollefson Jeff, 2015. The 2 degrees C dream.Nature, 527(7579): 436-438.

[56]
Wang Changjian, Wang Fei, Li Lianrong et al., 2013. Wake-up call for China to re-evaluate its shale-gas ambition.Environmental Science & Technology, 47(21): 11920-11921.中国科学院寒区旱区环境与工程研究所机构知识库(CASNW OpenIR)以发展机构知识能力和知识管理能力为目标,快速实现对本机构知识资产的收集、长期保存、合理传播利用,积极建设对知识内容进行捕获、转化、传播、利用和审计的能力,逐步建设包括知识内容分析、关系分析和能力审计在内的知识服务能力,开展综合知识管理。

DOI PMID

[57]
Wang Changjian, Wang Fei, Du Hongru et al., 2014a. Is China really ready for shale gas revolution: Re-evaluating shale gas challenges.Environmental Science & Policy, 39: 49-55.Tackling climate change and reducing reliance on energy imports justify the exploitation of unconventional energy around the word. Influenced by the U.S. shale gas massive development, Chinese government set an ambitious plan to produce 6.5billionm3 of shale gas by 2015, 60鈥100billionm3 by 2020, and then 13 provinces were given priorities for exploitation. China's shale gas production will go ahead. Local government's ambitious targets combined with technical bottlenecks, lack of drilling experience, poor extraction operations, lagging infrastructure construction, imperfect price mechanism, water shortages, water contamination, and other undesired environmental effects with significant levels of uncertainty, are major impediments for shale gas revolution in China. Exploitation of shale gas reserves offers opportunities for China to meet its growing energy demands and reduce the reliance on energy imports. But China's ongoing shale gas plans should be seriously re-evaluated with reference to eco-environmental and social impacts. This is a unique and great opportunity for China to be a demonstration model, especially for other countries wanting of shale gas.

DOI

[58]
Wang Changjian, Wang Fei, Zhang Hongou et al., 2014b. China’s carbon trading scheme is a priority.Environmental Science & Technology, 48(23): 13559.

[59]
Wang Changjian, Wang Fei, Zhang Hongou et al., 2014c. Carbon emissions decomposition and environmental mitigation policy recommendations for sustainable development in Shandong Province.Sustainability, 6(11): 8164-8179.Provincial carbon emissions research is necessary for China to realize emissions reduction targets. Two-level decomposition model based on the Kaya identity was applied to uncover the main driving forces for the energy related carbon emissions in Shandong province from 1995 to 2011, an important energy base in China. Coal consumption is still the biggest contributor to the increased carbon emissions in Shandong. Decomposition results show that the affluence effect is the most important contributors to the carbon emissions increments. The energy intensity effect is the dominant factor in curbing carbon emissions. The emission coefficient effect plays an important negative but relatively minor effect on carbon emissions. Based on the local realities, a series of environment-friendly mitigation policies are raised by fully considering all of these influencing factors. Sustainable mitigation policies will pay more attention to the low-carbon economic development along with the significant energy intensity reduction in Shangdong province.

DOI

[60]
Wang Changjian, Wang Fei, Zhang Hongou, 2016. The process of energy-related carbon emissions and influencing mechanism research in Xinjiang.Acta Ecologica Sinica, 36(8): 2151-2163. (in Chinese)Regional carbon emissions research is necessary and helpful for China to achieve the reduction targets. This research aims at analyzing the energy- related carbon emissions and finding out the most important contributors to the increased carbon emissions in Guangdong province. LMDI( Logarithmic Mean Divisia Index) technique has been conducted to uncover the main five driving forces for energy- related carbon emissions. Decomposition results show that affluence effect and population effect are the two most important contributors to the increased carbon emissions. Energy intensity effect played the dominant role in curbing carbon emissions. Energy structure effect and technical progress effect played different but relatively minor effects on carbon emissions during the five different development stages.

DOI

[61]
Wang Changjian, Wang Fei, Zhang Xinlin et al., 2017. Examining the driving factors of energy related carbon emissions using the extended STIRPAT model based on IPAT identity in Xinjiang.Renewable and Sustainable Energy Reviews, 67: 51-61.Analysis of driving factors of energy related carbon emissions from the regional perspective is necessary and helpful for China to achieve its reduction targets. An extended STIRPAT model based on the classical IPAT identity was used to determine the main driving factors for energy related carbon emissions in Xinjiang. In order to get the best understanding of driving factors on carbon emissions during 1952–2012, we divided the process into 3 stages, such as “Before Reform and Opening up” (1952–1978), “After Reform and Opening up” (1978–2000), and “Western Development” (2000–2012). Research results show that the impacts and influences of various factors on carbon emissions are different in the three different development stages. Before the Reform and Opening up (1952–1977), carbon intensity and population size are the two dominant contributors to the carbon emissions increments, while energy consumption structure is the important influencing factor in curbing carbon emissions. After the Reform and Opening up (1978–2000), economic growth and population size are the two dominant contributors to the carbon emissions increments, while carbon intensity plays the important negative effect on carbon emissions. During the Western Development (2001–2012), fixed assets investment and economic growth are the two dominant contributors to the carbon emissions increments, while carbon intensity plays the important negative effect on carbon emissions. Solving these problems effectively will be of great help for Xinjiang to harmonize economic growth and carbon emissions reduction, even environmental damage reduction.

DOI

[62]
Wang Changjian, Zhang Xiaolei, Wang Fei et al., 2015. Decomposition of energy-related carbon emissions in Xinjiang and relative mitigation policy recommendations.Frontiers of Earth Science, 9(1): 65-76.Regional carbon emissions research is necessary and helpful for China in realizing reduction targets. The LMDI I (Logarithmic Mean Divisia Index I) technique based on an extended Kaya identity was conducted to uncover the main five driving forces for energy-related carbon emissions in Xinjiang, an important energy base in China. Decomposition results show that the affluence effect and the population effect are the two most important contributors to increased carbon emissions. The energy intensity effect had a positive influence on carbon emissions during the pre-reform period, and then became the dominant factor in curbing carbon emissions after 1978. The renewable energy penetration effect and the emission coefficient effect showed important negative but relatively minor effects on carbon emissions. Based on the local realities, a comprehensive suite of mitigation policies are raised by considering all of these influencing factors. Mitigation policies will need to significantly reduce energy intensity and pay more attention to the regional economic development path. Fossil fuel substitution should be considered seriously. Renewable energy should be increased in the energy mix. All of these policy recommendations, if implemented by the central and local government, should make great contributions to energy saving and emission reduction in Xinjiang.

DOI

[63]
Wang Hongsheng, Wang Yunxia, Wang Haikun et al., 2014. Mitigating greenhouse gas emissions from China’s cities: Case study of Suzhou.Energy Policy, 68: 482-489.Knowledge of the factors driving greenhouse gas (GHG) emissions from cities is crucial to mitigating China's anthropogenic emissions. In this paper, the main drivers increasing GHG emissions from the Chinese city of Suzhou between 2005 and 2010 were identified and quantitatively analyzed using the Kaya identity and the log-mean Divisia index method. We found that economy and population were the major drivers of GHG emissions in Suzhou, having contributed 162.20% and 109.04%, respectively, to the increase in emissions. A decline in carbon intensity, which was caused by the declining energy intensity and an adjustment to the mixture of power and industrial structures, was the major determinant and accounted for a reduction of 171.24% in GHG emissions. Slowing and maintaining healthy growth rates of economy and population could be the primary and most effective means if Suzhou tries to curb the total emissions over the short term. It may be more realistic for Suzhou to control emissions by optimizing the economic structure for low-carbon industrial development because of the city's relative high energy requirements and low potential to mitigate GHGs by adjusting the energy mixture.

DOI

[64]
Wang Ping, Wu Wanshui, Zhu Bangzhu et al., 2013. Examining the impact factors of energy-related CO2 emissions using the STIRPAT model in Guangdong Province, China.Applied Energy, 106: 65-71.To find the key impact factors of CO 2 emissions to realize the carbon intensity target, this paper examined the impact factors of population, economic level, technology level, urbanization level, industrialization level, service level, energy consumption structure and foreign trade degree on the energy-related CO 2 emissions in Guangdong Province, China from 1980 to 2010 using an extended STIRPAT model. We employed ridge regression to fit the extended STIRPAT model. Empirical results indicate that factors such as population, urbanization level, GDP per capita, industrialization level and service level, can cause an increase in CO 2 emissions. However, technology level, energy consumption structure and foreign trade degree can lead to a decrease in CO 2 emissions. The estimated elastic coefficients suggest that population is the most important impact factor of CO 2 emissions. Industrialization level, urbanization level, energy consumption structure, service level and GDP per capita are also significant impact factors, but the other factors such as technology level and foreign trade degree are less important impact factors. Some policy recommendations are also given on how to mitigate the growth of CO 2 emissions.

DOI

[65]
Williams James H, DeBenedictis Andrew, Ghanadan Rebecca et al., 2012. The technology path to deep greenhouse gas emissions cuts by 2050: The pivotal role of electricity.Science, 335(6064): 53-59.Abstract Several states and countries have adopted targets for deep reductions in greenhouse gas emissions by 2050, but there has been little physically realistic modeling of the energy and economic transformations required. We analyzed the infrastructure and technology path required to meet California's goal of an 80% reduction below 1990 levels, using detailed modeling of infrastructure stocks, resource constraints, and electricity system operability. We found that technically feasible levels of energy efficiency and decarbonized energy supply alone are not sufficient; widespread electrification of transportation and other sectors is required. Decarbonized electricity would become the dominant form of energy supply, posing challenges and opportunities for economic growth and climate policy. This transformation demands technologies that are not yet commercialized, as well as coordination of investment, technology development, and infrastructure deployment.

DOI PMID

[66]
Wu F, Fan L W, Zhou P et al.Zhou P ., 2012. Industrial energy efficiency with CO2 emissions in China: A nonparametric analysis.Energy Policy, 49: 164-172.Global awareness on energy security and climate change has created much interest in assessing economy-wide energy efficiency performance. A number of previous studies have contributed to evaluate energy efficiency performance using different analytical techniques among which data envelopment analysis (DEA) has recently received increasing attention. Most of DEA-related energy efficiency studies do not consider undesirable outputs such as CO 2 emissions in their modeling framework, which may lead to biased energy efficiency values. Within a joint production framework of desirable and undesirable outputs, in this paper we construct both static and dynamic energy efficiency performance indexes for measuring industrial energy efficiency performance by using several environmental DEA models with CO 2 emissions. The dynamic energy efficiency performance indexes have further been decomposed into two contributing components. We finally apply the indexes proposed to assess the industrial energy efficiency performance of different provinces in China over time. Our empirical study shows that the energy efficiency improvement in China's industrial sector was mainly driven by technological improvement.

DOI

[67]
Xi Fengming, Geng Yong, Chen Xudong et al., 2011. Contributing to local policy making on GHG emission reduction through inventorying and attribution: A case study of Shenyang, China.Energy Policy, 39(10): 5999-6010.Cities consumed 84% of commercial energy in China, which indicates cities should be the main areas for GHG emissions reduction. Our case study of Shenyang in this paper shows how a clear inventory analysis on GHG emissions at city level can help to identify the major industries and societal sectors for reduction efforts so as to facilitate low-carbon policy-making. The results showed total carbon emission in 2007 was 57 Mt CO 2 equivalents (CO 2 e), of which 41 Mt CO 2 e was in-boundary emissions and 16聽Mt CO 2 e was out-of-boundary emissions. The energy sector was dominant in the emission inventory, accounting for 93.1% of total emissions. Within energy sector, emissions from energy production industry, manufacturing and construction industry accounted for 88.4% of this sector. Our analysis showed that comparing with geographical boundary, setting system boundary based on single process standard could provide better information to decision makers for carbon emission reduction. After attributing electricity and heating consumption to final users, the resident and commercial sector became the largest emitter, accounting for 28.5% of total emissions. Spatial analysis of emissions showed that industrial districts such as Shenbei and Tiexi had the large potential to reduce their carbon emissions. Implications of results are finally discussed.

DOI

[68]
Xiao Renjun, 2013. On the role of Xinjiang in guranteeing China’s energy security.Xinjiang Finance and Economics, (1): 52-56. (in Chinese)With the growth of foreign dependence on oil and natural gas in China,energy security has become the focus of energy strategy and even national security strategy in China.This paper,based on the occurrence characteristics and unique geographical advantages of energy resources in Xinjiang,makes an analysis of the potential role of Xinjiang to guarantee China's energy security from such aspect as promoting China's oil and gas yield,developing strategic coal oil and gas projects,enriching oil and gas import sources and modes,and find its great potential.Therefore,this paper suggests such measures should be taken as strengthening the development of oil and gas resources exploration in Xinjiang,appropriately speeding up the Xinjiang coal development and advancing layout of coal oil and gas projects,will eventually build Xinjiang into Central Asia and the economic and trade cooperation window,and deepen regional economic integration,strengthen the energy infrastructure security protection.

[69]
Zeng Ning, Ding Yihui, Pan Jiahua et al., 2008. Climate change: The Chinese challenge.Science, 319(5864): 730-731.Controlling CO60 emissions without hindering economic development is a major challenge for China and the world.

DOI

[70]
Zhang Bo, Chen G Q, 2014. Methane emissions in China 2007.Renewable and Sustainable Energy Reviews, 30: 886-902.In contrast to the ever-increasing focus on China's CO 2 emissions, little attention has been given to its CH 4 emissions, the second largest greenhouse gas. Presented in this paper is a comprehensive assessment of the CH 4 emissions in Mainland China by source and region based on the latest statistical data and research literatures available. The total CH 4 emission in China 2007 is estimated as 38.6聽Tg, one and a half times of that in USA. Even by the lower IPCC global warming potential (GWP) factor of 25, it corresponds to 964.1 Mt CO 2 -eq, in magnitude up to one seventh of China's CO 2 emission and greater than the nationwide gross CO 2 emissions in Australia, Canada, and Germany in 2007. As the leading emission source, energy activities are responsible for 45.3% of the total emission, agricultural activities contribute a comparable share of 40.9%, followed by waste management of 13.8%. Among all the 11 major emission sources, coal mining (38.3% of the total), enteric fermentation (21.4%) and rice cultivation (14.4%) essentially shape the CH 4 emission profile for China, quite different from that for USA which is characterized by prominent emissions from enteric fermentation, municipal solid waste landfill and natural gas leakage. The Western and Central areas contribute 70.9% of the total nationwide emission and Shanxi is the largest regional CH 4 emitter with an amount of 4.6 Tg. The five regions of Xizang (Tibet), Shanxi, Qinghai, Ningxia, and Guizhou are identified with the largest emissions per-capita and emission intensities. In contrast to the focused areas of CO 2 emission reduction mainly in the energy-intensive eastern regions, the mitigation potential of CH 4 emissions in the western and central regions is huge by integrating emission quantity and structure with emission per-capita and emission intensity at the regional level. Corresponding policy-making implications for CH 4 emission mitigation in China are addressed.

DOI

[71]
Zhang Bo, Chen G Q, Li J S et al., 2014. Methane emissions of energy activities in China 1980-2007.Renewable and Sustainable Energy Reviews, 29: 11-21.As the largest CH 4 emitter, China produces CH 4 at an increasing rate, especially from its energy activities. Presented in this paper is a detailed inventory and analysis of CH 4 emissions from energy activities in China from 1980 to 2007 covering all the significant sources. The total energy-related CH 4 emissions in China tripled during the period with an average annual increase rate of 4.7% and reached 21,943.102Gg in 2007, 2.4 times of that in USA. As the largest emission source, coal mining increased its share from 69.2% (4559.502Gg) in 1980 to 85.8% (18,825.502Gg) in 2007; The second biggest source was fuel combustion, mainly bio-fuel combustion (2370.302Gg in 2007); Oil and natural gas system leakage was a minor source but at a rapidly increasing rate. This transient emission structure is quite different from the steady structure of USA, which is dominated by the fugitive emissions from natural gas and oil systems. According to the lower IPCC Global Warming Potential, the annual energy-related CH 4 emissions were equivalent to 9.1%–11.7% of China′s energy-related CO 2 emissions, amounting to 548.602Mt CO 2 -eq in 2007 which is greater than the nationwide gross CO 2 emissions in many developed countries.

DOI

[72]
Zhang Lei, 2003. Economic developmen and its bearing on CO2 emissions.Acta Geographica Sinica, 58(4): 629-637. (in Chinese)Greenhouse-gas (GHG) emissions in China have aroused much interest, and not least in recent evidence of their reduction although the country is not subject to any emissions reduction target under the Kyoto Protocol's first emission control period. Our intent is to place that reduction in a larger context, that of the process of industrialization. A lengthy time perspective is combined with a cross-sectional approach--China plus five other countries--and addressed through two general models. The findings are salutary. First, they suggest that a diversified economic structure is consistent with diminished intensity in energy use. Secondly, and the obverse of the first, they imply that a diversified energy structure promotes reductions in CO 2 emissions. Finally, one is led inevitably to the conclusion that, together, the findings point to a path for countries to transform their economies while at the same time undertaking to drastically moderate their energy use, switching from a pattern of heavy carbon emissions to one in which lighter carbon emissions prevail. The implications of such findings for environmental management are enormous.

[73]
Zhang Lei, 2006. A changing pattern of regional CO2 emissions in China.Geographical Research, 25(1): 1-9. (in Chinese)Greenhouse-gas(GHG) emissions in China have aroused much interest,and not least in recent evidence of their reduction.Our intent is to place that regional pattern of CO_(2) emissions and its change in context.A lengthy time perspective is combined with a cross-provincial approach and addressed through two general models,namely the industrial-energy interconnection model and the energy-CO_(2) emissions interconnection model.The findings are salutary.First,they suggest that a diversified economic structure is the determined factor in not only the regional economic development but also the changing pattern of regional CO_(2) emissions.For instance,the numbers of over-heavy CO_(2) emissions at provincial level increased from none to two during the period between 1980 and 2000 as the local economic development dominated by industrial processes in the coastal zones gone rapidly. Secondly,they imply that the more diversified economic structure a region is,the slower increasing in energy use it has.The total energy consumption of East China between 1990 and 2000,for example,had 4% increase,when its ESD values rose from 10.5 to 23,or achieving 36% increase.Finally,together,the findings argued that the stiff structural change of energy use in China makes it very difficult for any region to reduce its CO_(2) emissions.It implies that China could have a long way to go in the reduction of its CO_(2) emissions if the country still resists in the traditional energy consumption pattern.

DOI

[74]
Zhang Lei, Todd Daniel, Xie Hui et al., 2005. CO2 emissions and their bearing on China’s economic development: The long view.Journal of Geographical Sciences, 15(1): 61-70.Greenhouse-gas (GHG) emissions in China have aroused much interest, and not least in recent evidence of their reduction. Our intent is to place that reduction in a larger context, that of the process of industrialization. A lengthy time perspective is combined with a cross-sectional approach-China plus five other countries-and addressed through two general models. The findings are salutary. First, they suggest that a diversified economic structure is consistent with diminished intensity in energy use. Secondly, and the obverse of the first, they imply that a diversified energy structure promotes reductions in CO 2 emissions. Finally, one is led inevitably to the conclusion that, together, the findings point to a path for countries to transform their economies while at the same time undertaking to drastically moderate their energy use, switching from a pattern of heavy carbon emissions to one in which lighter carbon emissions prevail. The implications of such findings for environmental management are enormous.

DOI

[75]
Zhang Qiang, 2008. Developmental approach and strategy of large-scale grid and off-grid wind power industries in Xinjiang.Resources Science, 30(11): 1677-1683. (in Chinese)Xinjiang is one of the areas with the most abundant wind energy resources in China and has vast potential for the use and development of wind energy.From 1986 to 2005,the wind power industry in Xinjiang developed very quickly.In 1989,the first wind power station in the country was established in Xinjiang,and by the end of 2005,the installed capacity of wind power in Xinjiang reached 180 thousand kW,the highest in the country.Recently,however,the development of the wind power industry in this area is slowing down and faces many problems such as low economic development,lack of policy support,high cost of wind power and technical bottlenecks with on-grid wind power.This paper proposes a new approach to wind power industry development in Xinjiang,of promoting coordinated development of large-scale off-grid wind power industry and local highly energy-intensive industries.The large-scale off-grid wind power directly supplied to the highly energy-intensive industries will provide them with low-cost clean power.In addition,it can increase the competitiveness of their products and make it possible to reach the 11th Five Year Plan goal of 20% energy conservation and emissions reduction per GDP unit.Furthermore,the impact on the on-grid wind power network will be avoided and the technical bottleneck constraining wind power industry development will also be eliminated.There are nine areas in Xinjiang which provide abundant resources for the establishment of large-scale off-grid wind power bases and lay a good foundation for coordinated development of off-grid wind power and highly energy-intensive industries.Based on the new approach,the goal of large-scale off-grid wind power development and the goal of energy conservation and emissions reduction for highly energy-intensive industries can both be achieved.Moreover,the paper proposes three strategies for the development of wind power industry in Xinjiang:(1) give priority to the development of large-scale off-grid wind power and fully exploit local wind energy resources in order to make "floating resources" serve local industries;(2) establish several off-grid wind power bases over ten million kW in the northern part of Xinjiang,as well as corresponding highly energy-intensive industry bases,and transmit local wind power to the eastern areas when the technical bottleneck of power transmission through power networks can be solved;(3) adopt advanced technology for the wind power industry,and optimize the structure of the wind power industry of Xinjiang in order to implement strategic transfer to the east.

[76]
Zhu Qin, Peng Xizhe, Wu Kaiya, 2012. Calculation and decomposition of indirect carbon emissions from residential consumption in China based on the input-output model.Energy Policy, 48: 618-626.78 We build the input–output model of indirect carbon emissions from residential consumption. 78 We calculate the indirect emissions using the comparable price input–output tables. 78 We examine the impacts on the indirect emissions using the structural decomposition method. 78 The change in the consumption structure showed a weak positive effect on the emissions. 78 China's population size is no longer the main reason for the growth of the emissions.

DOI

Outlines

/