Orginal Article

Investigating changes in lake systems in the south-central Tibetan Plateau with multi-source remote sensing

  • WU Yanhong , 1 ,
  • ZHANG Xin 2 ,
  • ZHENG Hongxing 3 ,
  • *LI Junsheng , 1 ,
  • WANG Zhiying 1, 4
Expand
  • 1. Key Laboratory of Digital Earth Science, Institute of Remote Sensing and Digital Earth, CAS, Beijing 100101, China
  • 2. College of Global Change and Earth System Sciences, Beijing Normal University, Beijing 100875, China
  • 3. CSIRO Land and Water, Canberra, Australian Capital Territory, Australia
  • 4. College of Geography and Environment, Shandong Normal University, Jinan 250014, China
*Corresponding author: Li Junsheng (1979-), Associate Professor, E-mail:

Received date: 2015-12-30

  Accepted date: 2016-07-15

  Online published: 2017-03-30

Supported by

The “Strategic Priority Research Program (B)” of the Chinese Academy of Sciences, No.XDB03030406

National Natural Science Foundation of China, No.41371218, No.41165011

Copyright

本文是开放获取期刊文献,在以下情况下可以自由使用:学术研究、学术交流、科研教学等,但不允许用于商业目的.

Abstract

Lakes in the Tibetan Plateau are considered sensitive responders to global warming. Variations in physical features of lake systems such as surface area and water level are very helpful in understanding regional responses to global warming in recent decades. In this study, multi-source remote sensing data were used to retrieve the surface area and water level time series of five inland lakes in the south-central part of the Tibetan Plateau over the past decades. Changes in water level and surface area of the lakes were investigated. The results showed that the water level of three lakes (Puma Yumco, Taro Co, Zhari Namco) increased, with expanding surface area, while the water levels of the other two lakes (Paiku Co, Mapam Yumco) fell, with shrinking area. The water levels of the lakes experienced remarkable changes in 2000-2012 as compared with 1976-1999. Spatially, lakes located at the southern fringe of the Tibetan Plateau showed consistency in water level changes, which was different from lakes in the central Tibetan Plateau.

Cite this article

WU Yanhong , ZHANG Xin , ZHENG Hongxing , *LI Junsheng , WANG Zhiying . Investigating changes in lake systems in the south-central Tibetan Plateau with multi-source remote sensing[J]. Journal of Geographical Sciences, 2017 , 27(3) : 337 -347 . DOI: 10.1007/s11442-017-1380-x

1 Introduction

The Tibetan Plateau is known as the “Third Pole of the Earth” (Qiu, 2008), with an area of approximately 250,000 km2 and an average elevation of above 4000 m. The plateau is also considered as the Asia Water Tower (Lu et al., 2005), where the total lake area accounts for approximately 51.4% of that of all lakes in China (Yao and Zhu, 2006). It is believed that changes in the surface area and water level of lakes in the plateau are closely linked to climate change and the accompanying glacier retreat (Zhu et al., 2010), which in turn have shown adverse impacts on the regional ecosystem and environment (Solomon et al., 2007). Several studies have been conducted to investigate changes in the lake system of the plateau (e.g., Ye et al., 2007; Wu and Zhu, 2008; Liu et al., 2009; Meng et al., 2012; Lei et al., 2013), as well as to identify the main drivers of the changes (Yang et al., 2011; Zhang et al., 2011a). However, in the vast area of the Tibetan Plateau, ground observations of lake properties are rarely available, which makes it a challenge to detect long-term changes in the lake systems as a consequence of global climate change.
Remote sensing (RS) has been widely accepted as an important technique in earth observation for its outstanding capacity for large-scale dynamic tracking. The remotely sensed data is extremely valuable for data-sparse regions like the Tibetan Plateau by providing information never observed on the ground. Some RS products have enabled researchers to extract essential and valuable information on lake properties such as surface area, water level and water temperature. With the rapid development of RS, more RS data at different resolutions and covering different periods are becoming available. Data from a specific single RS source may offer advantages such as high consistency, but may suffer from limitations of temporo-spatial resolution or observation period covered. For instance, the ICESat (Ice, Cloud and Land Elevation Satellite) is considered to be particularly meaningful in detecting dynamic changes of inland lake levels, owing to its relatively high precision and accuracy (Zhang et al., 2011b, 2013). However, it is not applicable for reflecting long-term changes of the lake system or for assessing the impact of climate change, owing to its limited observation period (2003-2009). To take advantage of the enriching RS data, a multi-source RS technique has been developed to enhance the capacity of observation (Markham and Helder, 2012). In general, multi-source RS can provide more useful observations than single source RS, by combining and integrating the available information from different RS platforms.
This study aimed to investigate the long-term changes in surface area and water level for lake systems in the Tibetan Plateau by integrating images from different RS data sources. First, the relationships between the remotely sensed data were characterized; then, on this basis, a time series of surface area and water level was developed for the period 1972-2012. The long-term changes of the lake system were then investigated, and the potential impacts of climate change are discussed.

2 Study area and data

2.1 Selected lakes

Five lakes (Table 1) in the southern Lake District of the Tibetan Plateau were selected for investigation in this study. The district is located to the west of 94°E and south of 32°N (Figure 1). The Zhari Namco (ZNC) and Taro Co (TRC) lakes at the south of the Tibetan Plateau belong to the semi-arid zone of Qiangtang alpine grassland, where precipitation and glacier/snow melt flow are the main water sources of the lake systems. Then Mapam Yumco (MYC), Paiku Co (PKC), and Puma Yumco (PYC) lakes are all located along the fringe of the southern part of the Tibetan Plateau. PKC and PMC are recharged by precipitation and melting glacier flow, whereas MYC is supplied by precipitation and stream flow.
Table 1 Geographical characteristics of the selected lakes
Lakes Location Area (km2) Temperature (°C) Precipitation(mm) Glacier meltwater supply
Puma Yumco 28°30′-28°38′N
90°13′-90°33′E
287.55 -1.13 287 Yes
Zhari Namco 30°44′-31°05′N
85°20′-85°54′E
971.88 -1.04 174 No
Mapam Yumco 30°34′-30°47′N
81°22′-81°27′E
409.09 5.60 154 No
Paiku Co 28°46′-29°02′N
85°30′-85°42′E
272.35 -1.20 654 Yes
Taro Co 31°03′-31°13′N
83°55′-84°20′E
483.45 -0.74 174 No
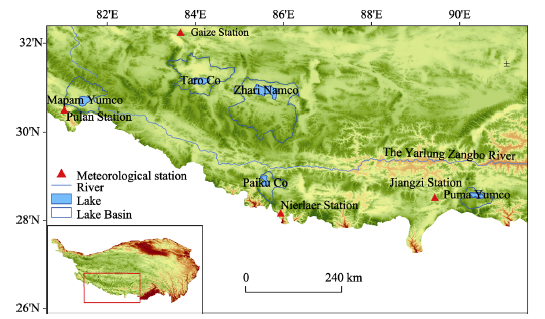
Figure.1 Locations of the five selected lakes in the Tibetan Plateau

2.2 Data

The multi-source RS data used in this study included Landsat MSS/TM/ETM, MODIS (Moderate-Resolution Imaging Spectroradiometer) surface reflectance outputs, and ICESat GLAS (Geoscience Laser Altimeter System) laser altimeter data (Table 2), among which the Landsat satellite series provides the longest continuous record of observations. The spatial resolution of the MSS (Multispectral Scanner) sensor is approximately 79 m, with four bands ranging from the visible blue to the near-infrared (NIR) wavelengths. The TM sensor has a spatial resolution of 30 m for the six reflective bands and 120 m for the thermal band (Chander et al., 2009). The MODIS instrument is carried by two polar orbiting satellites (Terra and Aqua). The system is able to acquire data of the entire earth’s surface every 1 to 2 days in 36 spectral bands from the Terra satellite in the morning and the Aqua satellite in the afternoon (Kropáčk et al., 2013). The ICESat was the first laser altimeter satellite, launched in 2003, equipped with a GLAS (laser altimeter) that had a vertical ground resolution of up to 10 cm and a horizontal resolution of 170 m (Zhang et al., 2011c).
Table 2 Multi-source remotely sensed data used for extraction of lake area and level
Lake Surface area Water level ICESat
Landsat MODIS
Puma Yumco (PYC) 1972-2011 (35 images) 2001-2012 (552 images) 2003-2009 (14 periods)
Zhari Namco (ZNC) 1976-2012 (48 images) 2001-2012 (552 images) 2003-2009 (19 periods)
Mapam Yumco (MYC) 1972-2012 (39 images) 2001-2012 (552 images) 2003-2009 (19 periods)
Paiku Co (PKC) 1976-2012 (27 images) 2001-2012 (552 images) 2003-2009 (18 periods)
Taro Co (TRC) 1976-2012 (40 images) 2001-2012 (552 images) 2003-2009 (12 periods)
In this study, Landsat MSS images (14 scenes) were used to extract the water level before 1980, while TM/ETM+ images were used for the period since 1980 (92 scenes in TM and 117 scenes in ETM). The Landsat images were selected from the same months, mainly between November and March, to eliminate seasonal influences on water level. MOD09A1 surface reflectance products for the period 2001-2012 were selected for use, which were 8-day synthetic images with a spatial resolution of 500 m. There were 46 scenes for each year, and 552 scenes in total were used here. Water levels of all five lakes could be obtained from the GLA14 product over the period from February 2003 to October 2009, where observations on 82 specific days were available.

3 Methods

3.1 Estimating lake surface area

To estimate the surface area of the lakes, an automated threshold method was adopted to segment the land and water pixels (Li et al., 2011) in Landsat and MODIS satellite images. The most commonly used indices for water object identification include the Normalized Difference Water Index (NDWI) (McFeeters, 1996), the Modified Normalized Difference Water Index (MNDWI) (Xu, 2005), the Enhanced Water Index (EWI) (Yan et al., 2007), and the Normalized Water Index (NWI) (Ding, 2009). In this study, the NDWI was used, which is capable of effectively strengthening water-related information while simultaneously weakening information pertaining to land, mountain, and soil. The NDWI was calculated as:
where ρGREEN and ρNIR are green band and near-infrared band, respectively, which correspond to bands 2 and 4 in the Landsat TM/ETM+ sensor, to bands 4 and 7 in Landsat MSS, and to bands 4 and 2 in MODIS.
The “Global-local” segmentation scheme used herein was based on the distribution mode of the NDWI histogram, in which areas of mixed water and land are of bimodal distribution whereas the non-water-object area is of unimodal distribution (Li et al., 2011). A minimum threshold value was first used as the initial value to roughly identify the boundary of the water object. For each water object, a more precise boundary was further delineated according to the threshold value calculated by Equation 2:
where T represents the threshold value; μwater and μland are the average values of the water body and land pixels, respectively; while σwater and σland are the corresponding variance. The detailed process is shown in Figure 2. The boundaries of the lakes in the Tibetan Plateau were then extracted automatically using scripts in the IDL (Interface Description Language) platform.
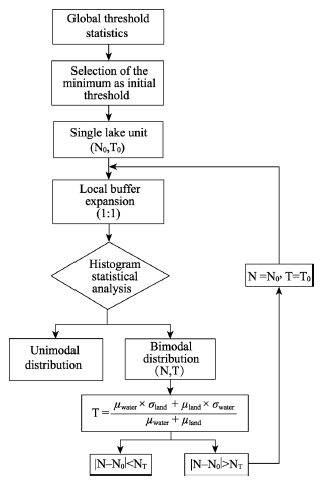
Figure.2 Flowchart of surface area estimation for lakes

3.2 Extending water level observations

As mentioned, the water level data from ICESat is of high quality but only available for the period 2003-2009. To investigate the changes in the lake system over a longer period (1972-2012), a method was developed to extend the water level series based on the relationships between the available data from different RS platforms. Among the three RS data sources, Landsat has the longest observation records, which can be traced back to 1972, providing the possibility to extend the water level sequence. However, there are relatively few concurrent observations between Landsat and ICESat in terms of surface area or water level, which makes it difficult if not impossible to derive directly the relationship between Landsat and ICESat. Fortunately, lake surface area data are available in MODIS for the period 2001-2012, which includes simultaneous observations with both Landsat and ICESat but for different periods. Therefore, the MODIS data can be used as a bridge to link together Landsat and ICESat data. Taking into consideration the availability of data from the three RS platforms, we could then extend the lake level sequence according to the following expression:
where AMODIS and ALandsat are the lake area observed by MODIS and Landsat, respectively. and are the estimated lake level using MODIS and Landsat observations, respectively. As shown in expression (3), firstly, the relationship function f(x) between water level from ICESat and surface area from MODIS was established for the period 2003-2009. As a close relationship was maintained between them, the water level could then be estimated according to lake surface area from MODIS. To extend the water level sequence to a longer period, the function g(x) representing the relationship between the surface area data of MODIS and Landsat was derived given observations from MODIS and Landsat for the period 2001-2012.

4 Results and discussion

4.1 Relationships between multi-source remotely sensed data

As shown in Table 3, regression models were built for each lake considering the relationship between water level from ICESat and surface area from MODIS. Meanwhile, the relationships between surface area data from MODIS and Landsat are shown in Table 4. It was found that all the regression models were statistically significant, with rather high coefficients of determination (R2). The results indicated that the methods described above were applicable to extend the time series of lake level data, although some bias may exist.
Table 3 Regressive functions between ICESat water level and MODIS surface area data
Name of lake Regression equationa R2 Significance level
Puma Yumco (PYC) Y = ln(x)*661.509 - 3468.351 0.721 α = 0.05
Mapam Yumco (MYC) Y = ln(x)*242,184 - 1051.499 0.765 α = 0.05
Taro Co (TRC) Y = ln(x)*1429.233 - 8369.144 0.762 α = 0.01
Paiku Co (PKC) Y = ln(x)*411.402 - 2035.593 0.670 α = 0.05
Zhari Namco (ZNC) Y = ln(x)*678.377 - 3682.608 0.492 α = 0.05

aNote: x denotes the surface area obtained from MODIS data, and Y denotes the water level obtained from ICESat data.

Table 4 Regressive functions between MODIS and Landsat surface areas
Name of lake Regression equationa R2 Significance level
Puma Yumco (PYC) Y = ln(x)*16.289 - 4918.349 0.433 α = 0.05
Mapam Yumco (MYC) Y = ln(x)*19.660 - 4468.897 0.632 α = 0.01
Taro Co (TRC) Y = ln(x)*30.442 - 4380.375 0.575 α = 0.01
Paiku Co (PKC) Y = ln(x)*32.735 - 4396.264 0.481 α = 0.01
Zhari Namco (ZNC) Y = ln(x)*15.181 - 4508.691 0.656 α = 0.01

aNote: x and y denote the surface area obtained from Landsat and MODIS, respectively.

4.2 Changes of lake area and level

Figure 3 shows the changes of both surface area and water level of the five selected lakes. There was good agreement between variations of water level and surface area, which means that rising/falling lake level is correspondent to expanding/shrinking lake area. It can be seen that at PYC, TRC and ZNC there were overall upward trends in water level and surface area of the lake system during the past decades. On the contrary, water level and surface area of MYC and PYC exhibited a consistent downward trend.
During the period 2000-2012, water levels of PYC, TRC and ZNC were almost always above the long-term average, whereas those of MYC and PYC were below the long-term average. As presented in Table 5, compared with that before the year 2000, mean water levels of PYC, TRC and ZNC in the period 2000-2012 were 0.66 m, 0.62 m and 0.12 m higher, accompanying the expansion in surface area by 5.1 km2, 3.14 km2 and 16.28 km2, respectively. For lakes MYC and PKC, however, water level fell at a rate of 0.09 m and 1.10 m, respectively, and the area of the lakes shrunk by 3.05 km2 and 6.08 km2, respectively.
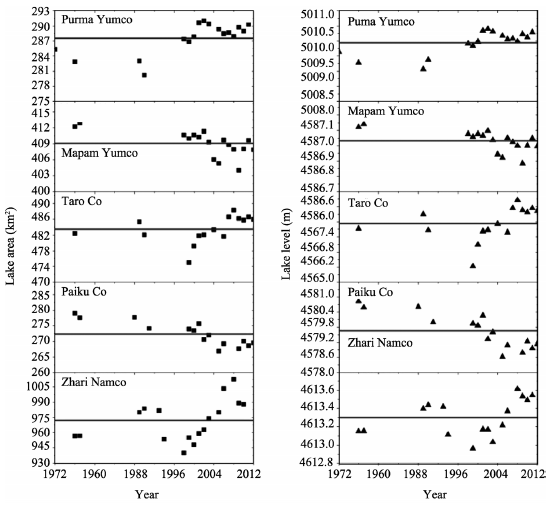
Figure.3 Changes of area and level for lakes in the Tibetan Plateau during the past decades
Table 5 Changes of lake area (km2) and lake level (m) of the five lakes
Lake 1972-1999 2000-2012 Change
Area Lake level Area Lake level Area Lake level
PYC 284.25 5009.52 289.35 5010.18 5.10 0.66
TRC 481.15 4566.88 484.29 4567.50 3.14 0.62
ZNC 963.26 4613.23 979.54 4613.35 16.28 0.12
MYC 411.42 4587.00 408.37 4586.91 -3.05 -0.09
PKC 276.41 4580.39 270.33 4579.29 -6.08 -1.10

4.3 Spatial coherence of changes in the lake systems

As presented in Figure 3, there was no general agreement in the variation of surface area and water level among the five lakes selected in this study, which could be attributed to differences in lake system characteristics and the corresponding driving forces. The correlation of water level between any two lakes shows the spatial coherence of a lake system (Table 6).
It was found that there was a significant positive correlation between ZNC and TRC in terms of water level change over the past decades, where the correlation coefficient reached 0.83. It is worth noting that the two lakes (ZNC and TRC) experiencing water level increases are located in the southern Qiangtang alpine grasslands, which belongs to the semi-arid climate zone. A significant positive correlation of lake level variation was detected between MYC and PKC, located at the fringe of the Tibetan Plateau, with a correlation coefficient of 0.75, suggesting that the coherence of water level change may be the result of similar environmental drivers. In contrast to the observations at ZNC and TRC, MYC and PKC were seen to be shrinking, with lowering water levels. Fluctuations in the level of PYC were inconsistent with those of the other four lake systems, and the water levels of PYC showed a significant negative correlation with those of PKC. The different changes among the lake systems may indicate the diverse impacts of climate change.
Table 6 Lake level correlation matrix of the selected lakes
Lake PYC TRC ZNC MYC PKC
PYC 1.0
TRC 0.11 1.0
ZNC -0.11 0.83* 1.0
MYC -0.33 -0.38 -0.26 1.0
PKC -0.68* -0.37 -0.22 0.75* 1.0

*Correlation coefficient is significant at the level of 0.01.

4.4 Climate change impacts on lake systems

Changes in water level and surface area of the lakes could be the consequence of regional climate change. Figure 4 shows the variations in precipitation and temperature for the five lakes over the past decades, which is based on the observation records from the nearest meteorological stations (He et al., 2011; Chen et al., 2007). It can be seen that there was no significant trend in the long-term change in precipitation at all five lakes. Compared with the period before 2000, however, the mean annual precipitation for the period 2000-2012 at TRC and ZNC was 37 mm higher, which could have resulted in the expansion and rising of the lake systems. In contrast, mean annual precipitation at MYC and PKC for the period 2000-2012 was 9.6 mm and 60.7 mm lower, respectively, than that of the period before 2000, leading to shrinking and falling water levels of the lake systems. For the same period, no significant change of mean annual precipitation was found in PYC.
As shown in Figure 4, there was general agreement regarding a warming climate at all five lakes. The rates of temperature increase at PYC, TRC, ZNC, MYC and PKC were 0.28 °C/10 years, 0.51 °C/10 years, 0.51 °C/10 years, 0.43 °C/10 years, and 0.27 °C/10 years, respectively. The higher temperature, on the one hand, could result in less runoff into the lakes and higher evaporation loss from the lakes. Yang et al. (2011) reported that evaporation in the central region of the Tibetan Plateau increased steadily between 1980 and 2000, which resulted in a slight decrease in runoff. As a consequence, lake water storage could be reduced and would be reflected by a decreasing water level and shrinking surface area. As in the cases of ZNC and TRC, on the other hand, a warmer climate may accelerate glacier retreatment (Shangguan et al., 2008; Yao et al., 2007; Li et al., 2007) accompanied by more glacier-melt flow into the lake system to increase the water level (Xie et al., 2010; Kang et al., 2007; Liu et al., 2000; Wu et al., 2005).
It is worth pointing out that the changes in water level and surface area are reflections of water storage changes in the lake system, which depend on the balance between water gained and water loss. For lakes (e.g., PKC and MYC) in the fringe area along the southern Tibetan Plateau, the water gained mainly relies on precipitation (Dai et al., 2013). Hence, a significant decrease in precipitation could be the dominant driver of falling water levels in the lake systems.
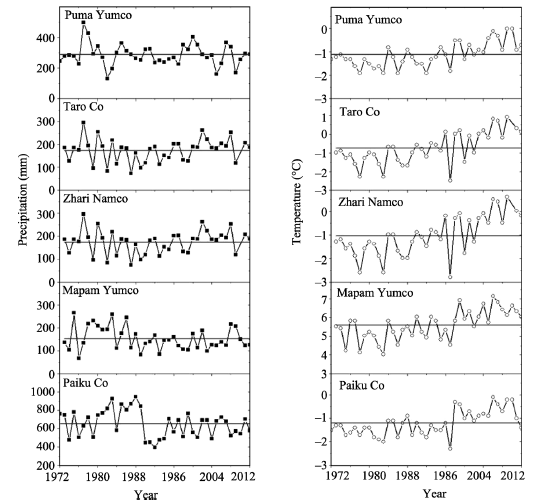
Figure.4 Changes in annual precipitation and temperature of the five lakes during 1972-2012

5 Conclusions

The lake system in the Tibetan Plateau has shown sensitive responses to global warming as indicated by changes in parameters such as water level and surface area. In this study, to investigate long-term changes in the lake system under the impacts of climate change, a multi-source RS dataset was used to retrieve water level and surface area data for the period 1972-2012. Five lakes in the south-central Tibetan Plateau were selected for the study, including Puma Yumco (PYC), Taro Co (TRC), Zhari Namco (ZNC), Mapam Yumco (MYC), and Paiku Co (PKC).
The results showed an increase in water level of PYC, TRC, and ZNC accompanied by significant expansion of lake surface areas for the period 1972-2012. Meanwhile, the water levels of PKC and MYC dropped, accompanied by a shrinking surface area. The different changes in the lake systems suggest the diversified impacts of climate change in the Tibetan Plateau. Spatially, lakes in the central plateau (e.g., ZNC and TRC) showed a consistent upward trend in water level, while lakes at the southern fringe of the plateau (e.g., PKC and MYC) showed similar downward trends. The results also suggested that the water balance of the lake system in the Tibetan Plateau has been experiencing greater changes in the most recent decade. To further explore the impacts of climate change on the lake system, investigation of the dynamics of lake water balance is an urgent priority.

The authors have declared that no competing interests exist.

[1]
Chander G, Markhamb B L, Helder D L, 2009. Summary of current radiometric calibration coefficients for Landsat MSS, TM, ETM+, and EO-1 ALI sensors.Remote Sensing of Environment, 113(5): 893-90.This paper provides a summary of the current equations and rescaling factors for converting calibrated Digital Numbers (DNs) to absolute units of at-sensor spectral radiance, Top-Of-Atmosphere (TOA) reflectance, and at-sensor brightness temperature. It tabulates the necessary constants for the Multispectral Scanner (MSS), Thematic Mapper (TM), Enhanced Thematic Mapper Plus (ETM+), and Advanced Land Imager (ALI) sensors. These conversions provide a basis for standardized comparison of data in a single scene or between images acquired on different dates or by different sensors. This paper forms a needed guide for Landsat data users who now have access to the entire Landsat archive at no cost.

DOI

[2]
Chen X, Cui P, Li Y et al., 2007. Changes in glacial lakes and glaciers of post-1986 in the Poiqu River basin, Nyalam, Xizang (Tibet).Geomorphology, 88(3): 298-311.Glacial lakes and glaciers are sensitive indicators of recent climate change. In the Poiqu River basin of southern Tibet, 60–10002km NW of Mt. Everest, Landsat imagery defines post-1986 changes in the size and distribution of both glacial lakes and glaciers. Total area of glaciers in the 229-km 2 drainage area has decreased by 20%. The number of glacial lakes with areas in excess of 0.02002km 2 has increased by 11%, and the total area of glacial lakes has increased by 47%. The areas of typical large glacial lakes of the area (Galongco, Gangxico, and Cirenmaco) have increased by 104, 118, and 156%, respectively, and these increases are confirmed by field investigations. Comparing the 1986 data, the area of glaciers in the basin headwaters has decreased by 46.1802km 2 to a present total area of 183.1202km 2, an annual rate of change of 3.3002km 2/year. Trends indicate that the total area of glaciers will continue to decrease and that both the numbers and areas of glacial lakes will continue to increase. Accompanying these trends will be an increased risk of debris flows, formed by entrainment of sediment in glacial-outburst floods and in surges from both failure and avalanche- and landslide-induced overtopping of moraine dams. Based on both the local and world-wide history of catastrophes from flows of these origins, disaster mitigation must be planned and appropriate engineering countermeasures put in place as soon as possible.

DOI

[3]
Dai Y, Gao Y, Zhang G et al., 2013. Water volume change of the Peiku Co in the southern Tibetan Plateau and its response to climate change in 2003-2011.Journal of Glaciology and Geocryology, 35(3): 723-732. (in Chinese)

[4]
Ding F, 2009. A new method for fast information extraction of water bodies using remotely sensed data.Remote Sensing Technology and Application, 24(2): 167-171. (in Chinese)Increasingly irrational reclamation activities are causing irreversible damage to the coastal environment.With the launch of Landsat8,we need a method to monitor the activities of using the sea quickly and effectively.According to the spectral characteristics of the objects which represent the various stages of the changing from sea to land in reclamation activities,we use a new method based on its bands which is called NWI8 to research the ability to distinguish water,bench and artificial reclamation features.Finally we find this new method can complete the task well.At the end,this new method based on the bands of Landsat8 can do the job which monitor the sea using.

[5]
He J, Yang K, (in Chinese)

[6]
Kang S, Chen F, Ye Q et al.Ye Q ., 2007. Glacier retreating dramatically on the Mt. Nyainqentanglha during the last 40 years.Journal of Glaciology and Geocryology, 29(6): 869-873. (in Chinese)During the expeditions to Mt.Nyainqêntanglha in the summer of 1999 and 2007,glacier termini had been surveyed using GPS technology for five glaciers around the mount.Comparing the terminus positions surveyed by the two GPS with those surveyed in 1970 reveal that five glaciers have retreated since 1970.The retreat rate of glacier termini is around 10.0 m·a-1 for the Lanong and Zhadang Glaciers in the northern slopes of the mount and the Panu Glacier in the southern slope during 1970-2007.However,retreat of the Xibu Glacier is dramatic with a rate of 38.9 m·a-1,while a small high-elevation glacier(5O270C0049) in the Panu basin has a low retreat rate of 4.8 m·a-1.A stream was observed in the 1970′s firn basin of the Panu Glacier,indicating that not only the glacier termini are retreating dramatically but also the ablation areas are expanding around the mount.

[7]
Kropáčk J, Maussion F, Chen F, 2013. Analysis of ice phenology of lakes on the Tibetan Plateau from MODIS data.The Cryosphere, 7(1): 287-301.The Tibetan Plateau includes a large system of endorheic (closed basin) lakes. Lake ice phenology, i.e. the timing of freeze-up and break-up and the duration of the ice cover may provide valuable information about climate variations in this region. The ice phenology of 59 large lakes on the Tibetan Plateau was derived from Moderate Resolution Imaging Spectroradiometer (MODIS) 8-day composite data for the period from 2001 to 2010. Ice cover duration appears to have a high variability in the studied region due to both climatic and local factors. Mean values for the duration of ice cover were calculated for three groups of lakes defined by clustering, resulting in relatively compact geographic regions. In each group several lakes showed anomalies in ice cover duration in the studied period. Possible reasons for such anomalous behaviour are discussed. Furthermore, many lakes do not freeze up completely during some seasons. This was confirmed by inspection of high resolution optical data. Mild winter seasons, large water volume and/or high salinity are the most likely explanations. Trends in the ice cover duration derived by linear regression for all the studied lakes show a high variation in space. A correlation of ice phenology variables with parameters describing climatic and local conditions showed a high thermal dependency of the ice regime. It appears that the freeze-up tends to be more thermally determined than break-up for the studied lakes.

DOI

[8]
Lei Y, Yao T, Bird B W et al., 2013. Coherent lake growth on the central Tibetan Plateau since the 1970s: Characterization and attribution.Journal of Hydrology, 483: 61-67.Although lakes on the central Tibetan Plateau (TP) expanded significantly in recent decades, causes for the lake growth still have not been well addressed. Based on remote sensing and GIS techniques together with bathymetric survey and water balance analysis, we show how climatic changes and glacier mass loss have influenced the inland lake dynamics on the central TP. Our results show that six closed lakes (Siling Co, Nam Co, Bam Co, Pung Co, Darab Co and Zige Tangco) expanded by 20.2% in area, by 8.7m in water depth, and by 37.7Gt in the total storage between 1976 and 2010, with a remarkable acceleration after 1999. The growth rate of lake area, water level and storage between 1999 and 2010 was 5.0, 3.6 and 4.8 times, respectively, than that between 1976 and 1999, corresponding well with the significant climatic changes in the late 1990s. Water balance analysis shows that increased precipitation and runoff, and decreased lake evaporation were the main causes for the coherent lake growth and could contribute by about 70% of total increase in lake storage. Based on modern mass balance results , glacier mass loss between 1999 and 2010 was estimated to contribute to the lake level rise of the three glacial-fed lakes, Siling Co, Nam Co and Pung Co, by 651.0m, 650.7m and 651.1m, respectively, accounting for 11.7%, 28.7% and 11.4% of the total lake level rise.

DOI

[9]
Li J, Sheng Y, Luo J, 2011. Automatic extraction of Himalayan glacial lakes with remote sensing.Journal of Remote Sensing, 15(1): 29-43. (in Chinese)The paper develops an automatic lake delineation algorithm based on"global-local"iterative scheme.The author uses NDWI(Normalized Difference Water Index) as the water identification index for the threshold segmentation process,and the slope maps and the shaded relief maps are applied in the algorithm to differentiate the shadow features from water features. Based on these methods,an automatic lakes delineation scheme is proposed to map the glacial lakes with Landsat Imagery in Himalayas mountains area.The results show that the proposed algorithm has good performance on lake mapping over the mountain areas,and lakes can be extracted automatically,accurately and efficiently,while most of melting glaciers and hill shadow features are eliminated from the segmentation processing.

DOI

[10]
Li X, Xu H, Sun Y et al., 2007. Lake-level change and water balance analysis at Lake Qinghai, west China during recent decades.Water Resources Management, 21(9): 1505-1516.

[11]
Liu J, Wang S, Yu S et al., 2009. Climate warming and growth of high-elevation inland lakes on the Tibetan Plateau.Global and Planetary Change, 67(3): 209-217.The growth of two high-elevation inland lakes (at 4600m) was analyzed using satellite imagery (2000–2005) and data were collected over the last decade (1997–2006) at a plateau meteorological station (at 4820m) and stream gauging data from a station (at 4250m) in central Tibet. We examined the lake water balance responses to meteorological and hydrological variables. The results show that the lake areas greatly expanded by a maximum of 27.1% (or 43.7km 2 ) between 1998 and 2005. This expansion appears to be associated with an increase in annual precipitation of 51.0mm (12.6%), mean annual and winter mean temperature increases of 0.41°C and 0.71°C, and an annual runoff increase of 20% during the last decade. The changes point to an abrupt increase in the annual precipitation, mean temperature and runoff occurring in 1996, 1998 and 1997, respectively, and a decrease in the annual pan evaporation that happened in 1996. The timing of lake growth corresponds closely with abrupt increases in the annual precipitation and runoff and with the decrease in the annual evaporation since the mid-1990s. This study indicates a strong positive water balance in these permafrost highland lakes, and provides further evidence of lake growth as a proxy indicator of climate variability and change.

DOI

[12]
Liu X, Chen B, 2000. Climatic warming in the Tibetan Plateau during recent decades.International Journal of Climatology, 20(14): 1729-1742.

[13]
Lu C, Yu G, Xie G, 2005. Tibetan Plateau serves as a water tower. Geoscience and Remote Sensing Symposium, 2005, IGARSS'05. Proceedings. IEEE International. 3120-3123.

[14]
Markham B L, Helder D L, 2012. Forty-year calibrated record of earth-reflected radiance from Landsat: A review.Remote Sensing of Environment, 122: 30-40.78 A summary of recent updates to the 40-year history of Landsat sensor calibration. 78 A consistent radiometric calibration record with estimated uncertainties. 78 Landsat 1–5 MSS, Landsat 4–5 TM, Landsat-7 ETM+.

DOI

[15]
McFeeters S K, 1996. The use of the Normalized Difference Water Index (NDWI) in the delineation of open water features.International Journal of Remote Sensing, 17(7): 1425-1432.The Normalized Difference Water Index (NDWI) is a new method that has been developed to delineate open water features and enhance their presence in remotely-sensed digital imagery. The NDWI makes use of reflected near-infrared radiation and visible green light to enhance the presence of such features while eliminating the presence of soil and terrestrial vegetation features. It is suggested that the NDWI may also provide researchers with turbidity estimations of water bodies using remotely-sensed digital data.

DOI

[16]
Meng K, Shi X, Wang E et al., 2012. High-altitude salt lake elevation changes and glacial ablation in Central Tibet, 2000-2010.Chinese Science Bulletin, 57(7): 571-579. (in Chinese)

[17]
Qiu J, 2008. China: The Third Pole.Nature News, 454(7203): 393-396.

[18]
Shangguan D, Liu S, Ding Y et al.Ding Y ., 2008. Thinning and retreat of Xiao Dongkemadi glacier, Tibetan Plateau, since 1993.Journal of Glaciology, 54: 949-951.Not Available

DOI

[19]
Solomon S, Qin D, Manning M et al. (editors), 2007. Contribution of Working Group I to the Fourth Assessment Report of the Intergovernmental Panel on Climate Change,2007:The Physical Science Basis: Summary for Policymakers . Cambridge, UK: Cambridge University Press.

[20]
Wu S, Yin Y, Zheng D et al.Zheng D ., 2005. Climate changes in the Tibetan Plateau during the last three decades.Acta Geographica Sinica, 60(1): 3-11. (in Chinese)The Tibetan Plateau is one of the best places to study global climate change. Aridity or humidity status of land surface is an important outcome that has close relations with a set of climatic factors such as precipitation, temperature, solar radiation, relative humidity and wind, but the relationship between them is complicated. This paper calculated potential evapotranspiration by applying Penman-Monteith model which was recommended by FAO in 1998, and aridity index by Vyshotskii model to indicate aridity or humidity status of the Tibetan Plateau during the period 1971-2000. Then it analyzed the changing trends of observed climatic factors (temperature and precipitation) and calculated factors (potential evapotranspiration and aridity index), and showed the spatial distribution of aridity/humidity status over the Tibetan Plateau during the period 1971-2000. Trends calculated by linear regression were tested through Mann-Kendall test. Results of 77 meteorological stations on the Tibetan Plateau showed that the main trends of climate change are temperature rise and precipitation increase; potential evapotranspiration decrease and most of the areas was ascending to more humid status. Results suggested that aridity or humidity status cannot be presented only with precipitation.

[21]
Wu Y, Zhu L, 2008. The response of lake-glacier variations to climate change in Nam Co Catchment, central Tibetan Plateau, during 1970-2000.Journal of Geographical Sciences, 18(2): 177-189.

[22]
Xie H, Ye J, Liu X et al., 2010. Warming and drying trends on the Tibetan Plateau (1971-2005).Theoretical and Applied Climatology, 101(3/4): 241-253.Annual and seasonal trends in maximum and minimum temperatures, precipitation and vapour pressure deficit (VPD) were examined with the goal of understanding trends in temperature and moisture across the Tibetan Plateau, using meteorological data (1971–2005) collected at 63 stations. Trends in pan evaporation (PE; 1971–2001, 68 stations) and runoff (1971–2002) in the headwater of the Yellow River were also analysed. Positive trends in maximum and minimum temperatures were observed across the Tibetan Plateau. The highest increases were observed during winter, with results from the majority of stations statistically significant at the 95% level. A decrease trend in diurnal temperature range (DTR) was also observed. Trends in annual and seasonal precipitation and VPD were positive, while the trend in PE was negative. However, the increase in precipitation was not as pronounced as the increase in temperature. Although PE decreased during the time series, actual evaporation probably increased because of the warming across the Tibetan Plateau, where the annual potential water loss measured as PE is three to four times the annual water supply by precipitation. Warming was expected to increase evapotranspiration, causing more water vapour to escape into the atmosphere, thus counteracting or even exceeding the slight increase in precipitation. The increases in annual and seasonal VPD trends indicated a drying tendency and were further substantiated by the observed decrease in runoff in the headwater catchment of the Yellow River. The results provided insight into recent climatic changes across the Tibetan Plateau.

DOI

[23]
Xu H, 2005. A study on information extraction of water body with the Modified Normalized Difference Water Index (MNDWI).Journal of Remote Sensing, 9(5): 589-595. (in Chinese)A modified normalized difference water index(MNDWI) has been proposed in this paper based on the normalized difference water index(NDWI) of Mcfeeters (1966), which uses MIR(TM5) instead of NIR(TM4) to construct the MNDWI. The MNDWI has been tested in the ocean, lake and river areas with the background of built-up lands and/or vegetated lands, and with both clean and polluted water bodies using Landsat TM/ETM+ imagery. This reveals that the MNDWI can significantly enhance the water information, especially in the area mainly with built-up land as background. The MNDWI can depress the built-up land information effectively while highlighting water information, and accurately extract the water body information from the study areas. While the enhanced water information using the NDWI always has been mixed with built-up land noise and the area of a water body extracted based on the index is thus overestimated. Therefore, the NDWI is not suitable for enhancing and extracting water information in built-up land-dominated areas. Furthermore, the MNDWI can reveal subtle features of water more efficiently than the NDWI or other visible spectral bands do due largely to its wider dynamic data range. The application of the MNDWI in the Xiamen image has achieved an excellent result. The MNDWI image successfully reveals significant non-point pollution of the water surrounding the Xiamen Island due to agricultural activities. In addition, taking the advantage of the ratio computation, the MNDWI can remove shadow noise from water information without using sophisticated procedures, which is otherwise difficult to be removed.

[24]
Yan P, Zhang Y, Zhang Y, 2007. A study on information extraction of water system in semi-arid regions with the Enhanced Water Index (EWI) and GIS based noise remove techniques.Remote Sensing Information, 62-67. (in Chinese)Information extraction of water system in basin is the first step of the development of water resources.NDWI and MNDWI can not distinguish the semidry watercourse from the noise in semi-arid regions.An enhanced water index(EWI) has been proposed in this paper based on the spectral signatures of water system and background noise.The EWI can significantly distinguish the semidry watercourse from the noise.GIS techniques of removing noise improved the traditional method with shape index and efficiently removed the noise.EWI and GIS techniques can extract the water system in semi-arid regions faster,accurately and simply.

[25]
Yang K, Ye B, Zhou D et al.Zhou D ., 2011. Response of hydrological cycle to recent climate changes in the Tibetan Plateau.Climatic Change, 109(3/4): 517-534.The Tibetan Plateau (TP) surfaces have been experiencing an overall rapid warming and wetting while wind speed and solar radiation have been declining in the last three decades. This study investigated how climate changes influenced the hydrological cycle on the TP during 1984鈭2006. To facilitate the analysis, a land surface model was used to simulate surface water budget at all CMA (China Meteorological Administration) stations on the TP. The simulated results were first validated against observed ground temperature and observation-derived heat flux on the western TP and observed discharge trends on the eastern TP. The response of evaporation and runoff to the climate changes was then analyzed. Major finding are as follows. (1) Surface water balance has been changed in recent decades. Observed precipitation shows insignificant increasing trends in central TP and decreasing trends along the TP periphery while evaporation shows overall increasing trends, leading to decreased discharge at major TP water resource areas (semi-humid and humid zones in the eastern and southern TP). (2) At the annual scale, evaporation is water-limited in dry areas and energy-limited (radiation and air temperature) in wet areas; these constraints can be interpreted by the Budyko-curve. Evaporation in autumns and winters was strongly controlled by soil water storage in summers, weakening the dependence of evaporation on precipitation at seasonal scales. (3) There is a complementary effect between the simulated actual evaporation and potential evaporation, but this complementary relationship may deviate from Bouchet hypothesis when vapor pressure deficit (or air temperature) is too low, which suppresses the power of vapor transfer.

DOI

[26]
Yao T, Pu J, Lu A et al. 2007. Recent glacial retreat and its impact on hydrological processes on the Tibetan Plateau, China, and surrounding regions.Arctic, Antarctic, and Alpine Research, 39(4): 642-650.Glacial retreat on the Tibetan Plateau and surrounding regions is characteristic since the 1960s and has intensified in the past 10 yr. The magnitude of glacial retreat is relatively small in the interior of the Tibetan Plateau and increases to the margins of the plateau, with the greatest retreat around the edges. Glacial retreat in this region is impacting the hydrological processes in the Tibetan Plateau and surrounding regions. The glacial retreat has caused an increase of more than 5.5% in river runoff from the plateau. In some areas, such as the Tarim River basin, the increase in river runoff is greater. Glacial retreat has also caused rising lake levels in the areas with large coverage of glaciers, such as the Nam Co Lake and Selin Co Lake areas. Rising lake levels are devastating grasslands and villages near the lakes.

DOI

[27]
Yao T, Zhu L, 2006. The response of environmental changes on Tibetan Plateau to global changes an adaptation strategy.Advances in Earth Science, 21(5): 459-464.The environmental changes of Tibetan Plateau possess sensitive response and strong effect to global changes.The interaction between modern environment and land surface processes on the plateau induces a series of variations in the cryosphere,water resources and ecological system,which produce important influence on the human living circumstance and economic-society development on the plateau itself and periphery regions.As a region focused by international scientific research,the plateau experienced three developing stages.The first is focusing the systemic studies of the key problems in the key areas, the second is focusing the monitoring studies centered with surface processes,and the third is focusing the interactions among different spheres influenced by global changes.This project possesses very important significance to the study of environmental changes on Tibetan Plateau and the contribution for international scientific frontier as well as local economics-society development.In this project,a series of objectives are planned to be achieved: discovering key tectonic and environmental events from the plateau's formation to its present landform structures;reconstructing climatic and environmental sequences with different time scales in different areas and clarifying their space-time features;elucidating the variation characteristics of cryosphere,lakes,dominant ecosystems and land covers under different climatic conditions on the plateau;revealing the responses of the environmental changes and land surface processes of the plateau to global changes,and the effects of the plateau's thermo and dynamical processes to different climatic systems.Some methods and contents are performed in this project: By using geomorphologic and sedimentary methods,we study the formation processes of present landform and environment frames.By collecting lake cores,ice cores and tree rings,we study key events during the past environment changes and their linkages to global changes.By analyzing the space-time variations of glaciers,permafrost and snow accumulations together with observation of boundary layers,we study the variations of cryosphere and cycling processes of energy and water.By monitoring the glaciers,lakes and atmosphere together with using climatic models,we study the potential mechanism of environmental changes.By detecting the variations of carbon sources and sinks in the dominant ecosystems,we study the response of the main ecosystem to environmental changes. By a series of integrated analyses,we study the effects of the environmental changes and water sources changes on the Tibetan Plateau and adaptation strategies under global changes.

DOI

[28]
Ye Q, Zhu L, Zheng H et al., 2007. Glacier and lake variations in the Yamzhog Yumco basin, southern Tibetan Plateau, from 1980 to 2000 using remote-sensing and GIS technologies.Journal of Glaciology, 53(183): 673-676.

[29]
Zhang B, Wu Y, Zhu L et al., 2011a. Estimation and trend detection of water storage at Nam Co Lake, central Tibetan Plateau.Journal of Hydrology, 405(1): 161-170.Nam Co Lake is the highest lake in the central Tibetan Plateau, and existing research on water storage and water level variations are lacking. This paper provides a method for estimating the lake water storage based on historical meteorological records from 1976 to 2009, remote sensing images scattered in this period, in situ bathymetric survey, and GIS techniques, and presents a comprehensive 34-year analysis of intra-annual and inter-annual variations of Nam Co Lake water storage. The multi-year mean water storage of Nam Co Lake is 842.3602×0210 8 02m 3 , with the maximum water depth of about 9802m. During 1976–2009, the lake water storage increased from 786.0602×0210 8 02m 3 to 870.3002×0210 8 02m 3 , with a tendency value of 2.6702×0210 8 02m 3 /a; the lake area enlarged from 1927.4802km 2 to 2015.1202km 2 , with a tendency value of 2.7102km 2 /a. The lake area fluctuations annually, increasing from April of each year until late September and early October, then decreasing until March of the next year. Climate change has a significant impact on the water storage variation of the lake. A general pattern of warming temperature is evident with the regional annual mean air temperature increasing significantly by 0.40402°C/1002a. Preliminary analysis indicates that the enlarging status of Nam Co Lake water storage is closely related to increasing of precipitation and stream runoff especially coming from the input of glacial meltwater. By combining this data with other research, it can be presented that under the trend of global warming, on Tibetan Plateau, the inland lakes which depend on the rainfall and river supply in the basin are shrinking, while the lakes which depend on glacial meltwater supply are enlarging. Climate change is an important factor promoting the lake variation.

DOI

[30]
Zhang G, Xie H,Duan S et al., 2011b.Water level variation of Lake Qinghai from satellite and in situ measurements under climate change. Journal of Applied Remote Sensing, 5(1): 053532-053532-15.Lake level elevation and variation are important indicators of regional and global climate and environmental change. Lake Qinghai, the largest saline lake in China, located in the joint area of the East Asian monsoon, Indian summer monsoon, and Westerly jet stream, is particularly sensitive to climate change. This study examines the lake's water level and temporal change using the ice, cloud, and land elevation satellite (ICESat) altimetry data and gauge measurements. Results show that the mean water level from ICESat rose 0.67 m from 2003 to 2009 with an increase rate of 0.11 m/yr and that the ICESat data correlates well (r= 0.90, root mean square difference 0.08 m) with gauge measurements. Envisat altimetry data show a similar change rate of 0.10 m/yr, but with ~0.52 m higher, primarily due to different referencing systems. Detailed examination of three sets of crossover ICESat tracks reveals that the lake level increase from 2004 to 2006 was 3 times that from 2006 to 2008, with the largest water level increase of 0.58 m from Feb. 2005 to Feb. 2006. Combined analyses with in situ precipitation, evaporation, and runoff measurements from 1956 to 2009 show that an overall decreasing trend of lake level (-0.07 m/yr) correlated with an overall increasing trend (+0.03 C/yr) of temperature, with three major interannual peaks of lake level increases. The longest period of lake level increase from 2004 to 2009 could partly be due to accelerated glacier/perennial snow cover melt in the region during recent decades. Future missions of ICESat type, with possible increased repeatability, would be an invaluable asset for continuously monitoring lake level and change worldwide, besides its primary applications to polar regions.

DOI

[31]
Zhang G, Xie H, Kang S et al., 2011c. Monitoring lake level changes on the Tibetan Plateau using ICESat altimetry data (2003-2009).Remote Sensing of Environment, 115(7): 1733-1742.In this study, ICESat altimetry data are used to provide precise lake elevations of the Tibetan Plateau (TP) during the period of 2003–2009. Among the 261 lakes examined ICESat data are available on 111 lakes: 74 lakes with ICESat footprints for 4–702years and 37 lakes with footprints for 1–302years. This is the first time that precise lake elevation data are provided for the 111 lakes. Those ICESat elevation data can be used as baselines for future changes in lake levels as well as for changes during the 2003–2009 period. It is found that in the 74 lakes (56 salt lakes) examined, 62 (i.e. 84%) of all lakes and 50 (i.e. 89%) of the salt lakes show tendency of lake level increase. The mean lake water level increase rate is 0.2302m/year for the 56 salt lakes and 0.2702m/year for the 50 salt lakes of water level increase. The largest lake level increase rate (0.8002m/year) found in this study is the lake Cedo Caka. The 74 lakes are grouped into four subareas based on geographical locations and change tendencies in lake levels. Three of the four subareas show increased lake levels. The mean lake level change rates for subareas I, II, III, IV, and the entire TP are 0.12, 0.26, 0.19, 610.11, and 0.202m/year, respectively. These recent increases in lake level, particularly for a high percentage of salt lakes, supports accelerated glacier melting due to global warming as the most likely cause.

DOI

[32]
Zhang G, Xie H, Yao T et al., 2013. Water balance estimates of ten greatest lakes in China using ICESat and Landsat data.Chinese Science Bulletin, 58(26): 2664-2678.Lake level and area variations are sensitive to regional climate changes and can be used to indirectly estimate water balances of lakes.In this study,10 of the largest lakes in China,~1000 km2or larger,are examined to determine changes in lake level and area derived respectively from ICESat and Landsat data recorded between 2003 and 2009.The time series of lake level and area of Selin Co,Nam Co,and Qinghai Lake in the Tibetan Plateau(TP)and Xingkai Lake in northeastern China exhibit an increasing trend,with Selin Co showing the fastest rise in lake level(0.69 m/a),area(32.59 km2/a),and volume(1.25 km3/a)among the 10examined lakes.Bosten and Hulun lakes in the arid and semiarid region of northern China show a decline in both lake level and area,with Bosten Lake showing the largest decrease in lake level(0.43 m/a)and Hulun Lake showing the largest area shrinkage(35.56 km2/a).However,Dongting,Poyang,Taihu,and Hongze lakes in the mid鈥搇ower reaches of the Yangtze River basin present seasonal variability without any apparent tendencies.The lake level and area show strong correlations for Selin Co,Nam Co,Qinghai,Poyang,Hulun,and Bosten lakes(R20.80)and for Taihu,Hongze,and Xingkai lakes(~0.70)and weak correlation for East Dongting Lake(0.37).The lake level changes and water volume changes are in very good agreement for all lakes(R20.98).Water balances of the 10 lakes are derived on the basis of both lake level and area changes,with Selin Co,Nam Co,Qinghai,and Xingkai lakes showing positive water budgets of 9.08,4.07,2.88,and 1.09 km3,respectively.Bosten and Hulun lakes show negative budgets of 3.01 and 4.73 km3,respectively,and the four lakes along the Yangtze River show no obvious variations.Possible explanations for the lake level and area changes in these four lakes are also discussed.This study suggests that satellite remote sensing could serve as a fast and effective tool for estimating lake water balance.

DOI

[33]
Zhu L, Xie M, Wu Y, 2010. Quantitative analysis of lake area variations and the influence factors from 1971 to 2004 in the Nam Co basin of the Tibetan Plateau.Chinese Science Bulletin, 55(13): 1294-1303.By using remote sensing and GIS technologies, spatial analysis and statistic analysis, we calculated the water area and volume variations of the Nam Co Lake from 1971-2004, and discussed their influence factors from the viewpoints of climatic change and water balance. Data source in this study includes bathymetric data of the lake, aerial surveyed topographic maps of 1970, remote sensing images of 1991 and 2004 in the lake catchment, meteorological data from 17 stations within 1971-2004 in the adjacent area of the lake catchment. The results showed that the lake area expanded from 1920 km2 to 2015 km2 during 1971 to 2004 with the mean annual increasing rate (MAIR) of 2.81 km2 a-1, and the lake volume augmented from 783.23 108 m3 to 863.77 108 m3 with the MAIR of 2.37 108 m3. Moreover, the MAIR of the lake area and volume are both higher during 1992 to 2004 (4.01 km2 a-1 and 3.61 108 m3 a-1) than those during 1971 to 1991 (2.06 km2 a-1 and 1.60 108 m3 a-1). Analyses of meteorological data indicated that the continue rising of air temperature conduced more glacier melting water. This part of water supply, together with the increasing precipitation and the descending evaporation, contributed to the enlargement of Nam Co Lake. The roughly water balance analyses of lake water volume implied that, in two study periods (1971-1991 and 1992-2004), the precipitation supplies (direct precipitations on the lake area and stream flow derived from precipitations) accounted for 63% and 61.92% of the whole supplies, while the glacier melting water supplies occupied only 8.55% and 11.48%, respectively. This showed that precipitations were main water supplies of the Nam Co Lake. However, for the reason of lake water increasing, the increased amount from precipitations accounted for 46.67% of total increased water supplies, while the increased amount from glacier melting water reached 52.86% of total increased water supplies. The ratio of lake evaporation and lake volume augment showed that 95.71% of total increased water supplies contributed to the augment of lake volume. Therefore, the increased glacier melting water accounted for about 50.6% of augment of the lake volume, which suggested that the increased glacier melting water was the main reason for the quickly enlargement of the Nam Co lake under the continuous temperature rising.

DOI

Outlines

/