Orginal Article

Construction of the homogenized temperature series during 1910-2014 and its changes in Hunan Province

  • PENG Jiadong , 1, 2 ,
  • LIAO Yufang 1 ,
  • JIANG Yuanhua 1 ,
  • ZHANG Jianming 1 ,
  • DUAN Lijie 1
Expand
  • 1. Hunan Climate Center, Key Laboratory of Preventing-Diminishing Meteorological Disasters in Hunan Province, Changsha 410118, China
  • 2. Lanshan Meteorological Bureau, Lanshan 425800, Hunan, China

Received date: 2015-12-01

  Accepted date: 2016-05-27

  Online published: 2017-03-30

Supported by

China Meteorological Administration Special Public Welfare Research Fund, GYHY201406016

Copyright

本文是开放获取期刊文献,在以下情况下可以自由使用:学术研究、学术交流、科研教学等,但不允许用于商业目的.

Abstract

Based on the statistical method and the historical evolution of meteorological stations, the temperature time series for each station in Hunan Province during 1910-2014 are tested for their homogeneity and then corrected. The missing data caused by war and other reasons at the 8 meteorological stations which had records before 1950 is filled by interpolation using adjacent observations, and complete temperature time series since the establishment of stations are constructed. After that, according to the representative analysis of each station in different time periods, the temperature series of Hunan Province during 1910-2014 are built and their changes are analyzed. The results indicate that the annual mean temperature has a significant warming trend during 1910-2014 and the seasonal mean temperature has the largest rising amplitude in winter and spring, followed by autumn, but no significant change in summer. Temperature variation over Hunan Province has several significant warm-cold alternations and more frequent than that in whole China. Annual and seasonal mean temperatures except summer and autumn have abrupt warming changes in the recent 100 years. The wavelet analysis suggests that the annual and four seasonal mean temperatures in recent 100 years have experienced two climatic shifts from cold to warm.

Cite this article

PENG Jiadong , LIAO Yufang , JIANG Yuanhua , ZHANG Jianming , DUAN Lijie . Construction of the homogenized temperature series during 1910-2014 and its changes in Hunan Province[J]. Journal of Geographical Sciences, 2017 , 27(3) : 297 -310 . DOI: 10.1007/s11442-017-1377-5

1 Introduction

The studies on climate change have paid more and more attention to the long-term trends of surface air temperature (SAT). Both long-term and homogeneous instrumental temperature data have been essential for assessing global warming and regional climate change over past decades (Jones et al., 1999). Significant progress has been made in the use of homogeneous SAT datasets to estimate global warming, and several SAT datasets have been compiled (Peterson and Vose, 1997; Hansen et al., 2010; Lawrimore et al., 2011; Jones et al., 2012). Based on these datasets, The Fifth Assessment Report of Intergovernmental Panel on Climate Change (IPCC) pointed out that global mean SAT rose 0.85℃ during 1880-2012 (Qin et al., 2014).
In recent years, the compilation and construction of long-term and homogeneous instrumental SAT series have been on-going processes over China (Tang and Ren, 2005; Li et al., 2010; Cao et al., 2013). But in regional scale, long-term and homogeneous instrumental SAT data is still lacking. Taking South Central China as an example, Duan (1989) utilized tree-ring data to construct temperature series in the past 200 years over Hunan Province, and later, based on local chronicles and other historical materials, Duan (1992) analyzed the changes of winter temperature in the past 600 years over Dongting Lake Region. Using temperatures records and related descriptions of cold/warm events recorded in historical documents for South Central China, Wang et al. (1998) reconstructed the mean annual temperature series from 1880 to 1996 in this region. Utilizing monthly SAT instrumental records at 33 stations of South Central China, Ren et al. (2010) constructed a regional mean SAT series during 1905-2005. Afterward, Zheng et al. (2015) reconstructed annual temperature anomalies in South Central China from 1850 to 2008 derived from phenological and natural evidence. Here also has published a number of tree-ring series which instructed the temperature changes in South Central China (Fang et al., 2005; Cao et al., 2012; Zheng et al., 2012; Cai and Liu, 2013), but most of the above series were not constructed by instrumental records and the rest of instrumental series were developed without considering homogeneity due to inconsistent observational schedules in different years, relocations of stations, and missed observations.
Therefore, it is necessary to further reconstruct the homogeneous instrumental SAT series in Hunan over the past 100 years, particularly given that the temperature data before 1950 is incomplete due to war and other reasons in this region and the inhomogeneity problems of the temperature data in China (Liu and Li, 2003; Li et al., 2003; Li et al., 2004; Li et al., 2009; Cao and Yan, 2011).
In this paper, we systematically adjust the homogeneity of the historic temperature observations, and fill the missing data of each station with regression model based on the adjacent stations’ data. After that, the complete series of each station since establishment are built up. Then a representative analysis of temperature series of each station is carried out in order to choose appropriate representative stations for different time periods. Based on the above steps, Hunan’s regional temperature series of the recent 100 years are constructed and the change characteristics are analyzed.

2 Data

The raw data used in this paper is comprised of three parts.
The first is the monthly temperature data of 8 meteorological stations before 1950 from Hunan Provincial Meteorological Archives (The geographical distribution shown in Figure 1a). The temperature observation of Changsha and Yueyang stations began in 1909 and other 6 stations began during 1932-1942, due to war and other reasons, each station had several missing records at some stages (shown in Table 1). The second is the monthly temperature data of 96 meteorological stations in Hunan Province since 1951 (The geographical distribution shown in Figure 1b). The third is the monthly temperature data of Wuhan, Nanjing, Hangzhou, Chongqing and Guangzhou from the GHCN dataset (Global Historical
Climatology Network, monthly version3 (Lawrimore et al., 2011) through systematical quality-control and homogeneity-adjusted) and it is treated and selected as reference data for homogeneity test of the long time station temperature series (mainly for Changsha and Yueyang) in Hunan Province.
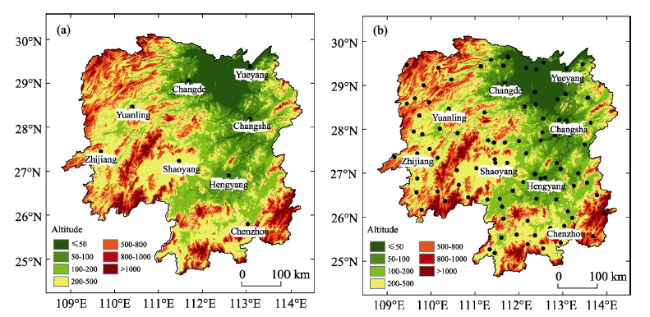
Figure.1 Geographical distribution of the observation stations (a. stations with data before 1950; b. all the
stations after 1951)
Table 1 Information of 8 meteorological stations with data before 1950 in Hunan Province
Station No. Station name Starting time (month/year) Missing periods in record (month/year) Missing months
57584 Yueyang 12/1909 12/1916-01/1917 180
12/1917-01/1918
03/1920-07/1921
12/1921-05/1922
12/1924
05/1938-12/1950
57655 Yuanling 07/1942 02/1949-09/1949 22
11/1949-12/1950
57662 Changde 08/1932 12/1934 97
11/1938-03/1946
06/1949-12/1949
57679 Changsha 06/1909 04/1910-09/1910 49
01/1923
10/1924
11/1938-03/1939
09/1939-10/1939
10/1941
12/1941-03/1942
07/1943
05/1944-03/1946
02/1947
05/1949-08/1949
Station No. Station name Starting time (month/year) Missing periods in record (month/year) Missing months
57745 Zhijiang 01/1937 03/1938-05/1938 12
09/1949-05/1950
57766 Shaoyang 09/1936 06/1944-09/1950 76
57872 Hengyang 01/1933 01/1939-12/1939 67
10/1941
01/1944-06/1946
01/1948-12/1949
57972 Chenzhou 12/1936 11/1941 45
06/1944-07/1946
07/1949-12/1950

3 Construction of temperature series

3.1 Homogeneity test and correction

The reliability and accuracy of climate data is the basis of climate change research. Change of observation instrument, station relocation and other reasons would affect the homogeneity of observation data (Li et al., 2003). Therefore, the homogeneity test and correction to the temperature series of each station is the prerequisite of analyzing the temperature change characteristics.
To carry out the homogeneity test in temperature series of a station, it is very important to construct a reasonable reference series by using the data of the adjacent stations, because the reference series is an important indicator of local climate and any significant difference from the local climate signal would be assumed to be discontinuity (Li et al., 2003). The meteorological stations in Hunan were relatively few before 1950 and increased significantly since 1951. In order to ensure the nearest station to be chosen to construct the reference series, the homogeneity test and correction in this paper are divided into two parts. Firstly, the temperature series of all 96 stations during 1951-2014 will be carried out of homogeneity test and correction by using the adjacent stations in Hunan as the reference, and secondly, 8 stations’ series during 1910-1950 will be carried out by using both the adjacent stations in Hunan and other stations in the surrounding provinces as reference.
3.1.1 Homogenization of temperature series after 1951
The homogeneity of the annual mean temperature, annual mean maximum temperature and annual mean minimum temperature series of all 96 stations during 1951-2014 in Hunan has been tested with the two-phase regression model (Lund and Reeves, 2002) and the preliminary discontinuities in these time series are obtained. Likewise, the time series of the three types of temperature above at monthly scale have also been tested with the same method and the potential discontinuities are also obtained. Then the common inhomogeneous points are found out by comparison of preliminary and potential discontinuities. Based on the above two steps, the manual analysis of the different images between each station’s series and those of the surrounding stations is carried out, taking the stations’ historical evolution into consideration. Finally, it is confirmed that, among the 96 stations, the average temperature series at 33 stations are inhomogeneous with a total of 36 break points; as for maximum temperature, there are 37 break points in 34 stations; and for minimum temperature, 26 break points in 23 stations (shown in Table 2). According to the above test results, all of the inhomogeneous series are corrected.
Figure 2 shows the difference of the linear trend between the original annual mean temperature and that of the adjusted version. It is noticeable that the linear tendency rates in several stations are much higher or lower than adjacent stations before being homogenized, and after being homogenized, the difference becomes smaller. It indicates that the linear tendency rate of homogenized temperature can reflect the local climate change of the station area accurately.
3.1.2 Homogenization of temperature series before 1950
The method of homogeneity test for maximum temperature and minimum temperature series of 8 stations in Hunan Province during 1910-1950 is basically the same with the above method, and the only difference is that which stations are selected as the reference series. In view of the fact that there are only 2 stations (Changsha and Yueyang) have over 100 years series in Hunan, no adjacent station in Hunan can be chosen to treat as reference station for homogeneity test of the above 2 stations, so several stations in the surrounding provinces like Wuhan, Guangzhou, etc. from GHCN are selected to construct the reference series of Changsha and Yueyang, but for the other 6 stations which started records during 1932-1942, adjacent stations in Hunan are selected as reference stations for homogeneity test. Finally, the result shows that 3 of 8 stations’ maximum temperature series have been confirmed inhomogeneity and there are a total of 3 break points, for minimum temperature there are 2 break points in one station (shown in Table 3).
Taking the correction of annual mean minimum temperature series of Changsha as an example, Figure 3 shows the differences of Changsha station’s original and reference series. Before 1932 the original series are significant higher than the reference, and the average difference value is 3.5℃; then the value becomes as low as 2.4℃ during 1933-1950, and becomes much lower to 1.9℃ since 1951. Obviously, the annual mean minimum temperature series in Changsha have two significant break points. Figure 4 shows the different series before and after adjustment, the linear trend of the original and corrected series exhibits great differences. Before adjustment the temperature shows a descending trend with a rate of -0.05℃/decade, while after adjustment it becomes a significant ascending trend by 0.17℃/decade. Obviously, the adjusted annual mean minimum temperature series demonstrates a higher long-term trend, which is more reasonable than those of the adjacent stations. Similar methods are also applied to the rest station series for the purpose of homogenization.

3.2 Interpolation for filling missing data before 1950

Eight meteorological stations have temperature records before 1950 in Hunan Province, but some of the data in a few years were missing or incomplete due to war and other reasons.
Table 2 Break points of temperature series during 1951-2014 at meteorological stations in Hunan Province (“—” denotes no break points)
Station No. Station name Break points of average temperature series Break points of maximum temperature series Break points of minimum temperature series
57554 Sangzhi 1972 1972 1972
57565 Lixian 1974 1962, 1974
57657 Luxi 1996
57662 Changde 1953 1953
57663 Hanshou 1963, 1971, 1980 1971, 1980 1963, 1971, 1980
57666 Taojiang 1980 1980 1967, 1980
57671 Yuanjiang 1968 1968
57674 Yiyang 1961
57679 Changsha 1963 1963
57682 Pingjiang 1987 1987 1987
57687 Wangchengpo 1974 1974
57688 Liuyang 2000 1960, 2000 2000
57740 Fenghuang 1970 1970
57752 Xupu 1958, 1966 1966
57760 Lengshuijiang 1981 1981 1981
57761 Xinhua 1959 1959 1959
57768 Xinshao 1964
57771 Shaoshan 1974 1974 1974
57772 Xiangxiang 1965
57773 Xiangtan 1982 1982 1982
57777 Hengshan 1965
57779 Youxian 1976
57780 Zhuzhou 1975 1975 1975
57781 Liling 1963 1963 1963
57846 Suining 1963 1963 1963
57860 Shaoyangxian 2000 2000 2000
57866 Yongzhou 1953 1953 1953
57867 Dong’an 1963
57871 Hengyangxian 1962
57872 Hengyangshi 1960 1960 1960
57874 Changning 1974 1974 1974
57881 Anren 1967 1967 1967
57889 Guidong 1970 1970
57965 Daoxian 1964
57966 Ningyuan 1965 1965
57971 Xintian 1972
57975 Lanshan 1960 1960
57978 Linwu 1978 1978 1978
57981 Zixing 1992 1992 1992
59063 Jianghua 1989 1989 1989
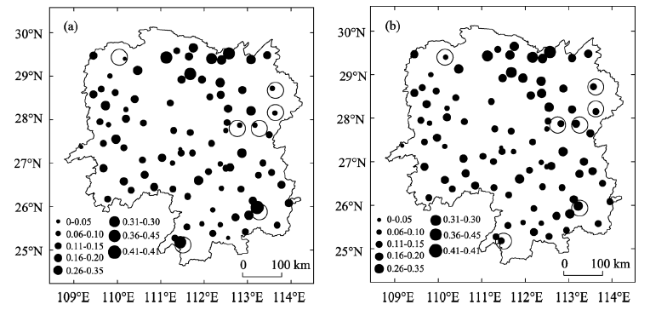
Figure.2 Distribution of the linear tendency of annual mean temperature during 1961-2014 in Hunan Province (℃/10a) (“○” denotes the stations in which linear tendency rates are significantly higher or lower than the adjacent stations before homogenized) (a. before homogenized; b. after homogenized)
Table 3 Break points of temperature series during 1910-1950 at meteorological stations in Hunan Province (“—” denotes no break points)
Station No. Station name Break points of maximum
temperature series
Break points of minimum
temperature series
57584 Yueyang 1937
57679 Changsha 1950 1932,1950
57872 Hengyang 1947
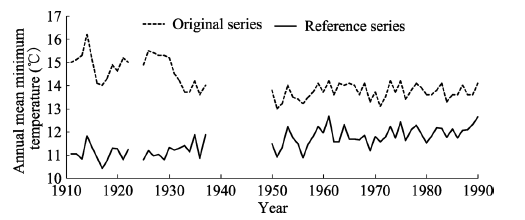
Figure.3 The original and reference annual mean minimum temperature series in Changsha during 1910–1990(For war and other reasons, part of data are missing)
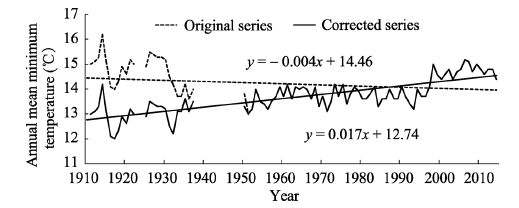
Figure.4 he original and adjusted annual mean minimum temperature series in Changsha during 1910-2014
For this reason, the following method is used to carry out the interpolation to fill the missing data. A adjacent station in Hunan which has the best correlation with the target station is selected as a reference station and a regression equation for reference and target stations is built using each month’s average maximum and minimum temperature series after being homogenized, thus the missing data of all 8 stations are filled with interpolation month by month. Due to the significant warming since 1990 in Hunan and the difference of temperature ascending rates caused by different urbanization process, the above equations only use the temperature data before 1990. All the equations are based on monthly data and significant at the 0.01 level. Annual and seasonal values and were computed by the interpolated value of each month.
Taking the annual mean minimum temperature series of Changsha as an example for the assessment of interpolation, Figure 5 shows the differences of Changsha station’s original and interpolated series. The two series are highly correlated and correlation coefficient gets to 0.857, linear trend analysis shows a significant upward trend and a slightly difference of ascending rate in the two series, T-test and F-test shows there is no significant difference between the mean and the variance of the two series.
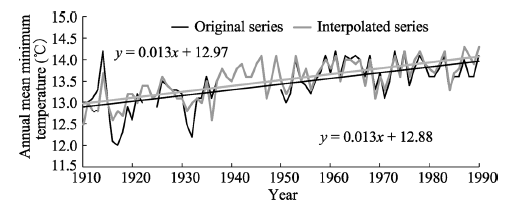
Figure.5 The original and interpolated annual mean minimum temperature series in Changsha during 1910-1990

3.3 Construction of temperature series during 1910-2014

The number of meteorological stations in Hunan changes from time to time. Only 2 stations (Changsha and Yueyang) had temperature records during 1910-1931, other 6 stations began to have meteorological observation one after another during 1932-1942 (shown in Table 1). The number of stations was maintained at 8 during 1943-1950, then increased rapidly from 1951 to 1960 and remained stable since 1961. Under this situation, the correlation analysis is used to find out the best representative stations (That is, the higher the correlation coefficient with the average of all 96 stations, the better the representation), and based on the above analysis and taking geographical distribution into account, representative stations are selected as many as possible to construct temperature series of Hunan Province during 1910-2014.
Result of correlation analysis shows that the correlation coefficient with the average of all 96 stations in Changsha is higher than Yueyang and the average of the above 2 stations. That means representation of Changsha’s temperature series is better than Yueyang and the average (shown in Table 4). Therefore, the temperature series of Hunan Province during 1910-1936 is constructed based on the Changsha’s series (hereinafter referred to as Changsha). Due to the uniform geographical distribution of 8 stations which had temperature records before 1950 and their good representation, the temperature series of Hunan Province during 1937-1960 are constructed based on the average of the above 8 stations (hereinafter referred to as 8 stations), and temperature series during 1961-2014 are calculated by the average of all 96 stations (hereinafter referred to as 96 stations). Based on the above steps, the regression models for Changsha with 96 stations and 8 stations with 96 stations are established to extend series of 96 stations to 1910 month by month, and the monthly temperature series of Hunan Province during 1910-2014 are constructed.
Table 4 Correlation coefficient of monthly mean temperature in Changsha, Yueyang and their mean values with the average of 96 stations from 1961 to 1990
1 2 3 4 5 6 7 8 9 10 11 12
Changsha 0.977 0.982 0.981 0.959 0.973 0.970 0.958 0.926 0.957 0.962 0.982 0.974
Yueyang 0.955 0.966 0.963 0.908 0.905 0.888 0.872 0.902 0.906 0.894 0.956 0.919
Average of
2 stations
0.971 0.977 0.978 0.944 0.956 0.948 0.938 0.938 0.945 0.943 0.975 0.955
Figure 6 shows annual mean temperature series of Changsha, 8 stations and 96 stations. Due to the absence of the average temperature data before 1950, the average temperature series of Changsha and 8 stations are replaced by the mean value of the maximum and minimum temperature. The mean temperature of Changsha and 8 stations are highly correlated with 96 stations and the correlation coefficients are 0.955 and 0.981 respectively. Obviously, the 105 years series of 96 stations extended by Changsha and 8 stations is reasonable and reliable.
Figure.6 The annual mean temperature series of Changsha, 8 stations and 96 stations during 1910-2014

4 Analysis on temperature changes in Hunan during 1910-2014

4.1 Annual mean temperature

The annual mean temperature shows a significant warming trend in Hunan Province with an ascending rate of 0.08℃/decade during 1910-2014 (shown in Figure 7a, exceeded the 0.01 significance level), which is lower than that of the whole China in the same period (CCC, CMA, 2015). The warming rate is 0.16℃/decade during 1961-2014, which is 2 times that of 1910-2014, and 2013 is the hottest year since 1910 in Hunan province. In the latest 18 years (1997-2014), 17 years’ mean temperature anomalies are positive among which 13 years are in the warmest 18 years since 1910. In the past 100 years, there are 3 obvious warming periods: the first is from the mid-1930s to the end of the 1940s, the second from the end of the 1950s to the mid-1960s, and the last from the early 1990s to present.
Figure.7 Annual mean temperature anomalies during 1910-2014 in Hunan Province and comparison with other series (a. annual temperature reconstruction; b. annual temperature anomalies derived from phenological and natural evidence during 1910-2008 in South Central China (Zheng et al., 2015); c. South Central China annual temperature anomalies during 1910-1996 (Wang et al., 1998); d. regional mean temperature anomalies from CRU gridded data during 1910-2014 in Hunan Province)
Comparison of the reconstructed series with others (Figures 7b-7d) demonstrated that the reconstruction matched well with the data derived from phenological and natural evidence in South Central China (Figure 7b), especially in the decadal variations and most of the interannual variations. The reconstructed and derived data both revealed a warm interval of greater than 10 years during the 1930s-1940s, an evident cold decade around 1950, an evident warm decade around 1960, and unprecedented warming beginning in the 1990s. The reconstruction here also matched well with the regional mean (Figure 7d) from the Climatic Research Unit (CRU) gridded temperature data from 1910 in most of the interannual and decadal variations, except for a slightly lower difference before the late 1940s. This might be caused by the different procedures of homogenization and the spatial interpolation using observed temperatures outside of Hunan Province in the CRU gridded data, because very few observations were available from the early 1910s to mid-1930s as well as the late 1930s to late 1940s in this area due to social unrest and war. But the different multi-decadal variations and trend are significant between our reconstruction and the observed temperature in South Central China from 1910 to 1950 (Figure 7c), that might be due to the fact that the homogenization was not carried out when the temperature series was constructed in South Central China.
The Mann-Kendall method (Wei, 1999) is applied to test the annual mean temperature series of Hunan Province during 1910-2014, showing that there is a significant abrupt warming point at 1998 (Figure omitted). The result of Morlet wavelet transformation (Wei, 1999) indicates that the short period oscillation is not obvious and a 20-year period oscillation maintained until 1980. In addition, there is a long periodic oscillation of 50 years maintained during 1910-2014. It means that the annual mean temperature in Hunan Province during 1910-2014 has experienced two climatic shifts from cold to warm, with a cold stage before 1930, warm from 1930 to 1960, cold during 1960-1990 and warm again after 1990 (Figure omitted).

4.2 Seasonal mean temperature

The mean temperature series of winter, spring and autumn show a significant warming trend during 1910-2014 and the ascending rate of winter is the largest, but not obvious in summer. The mean temperature series of winter, spring and autumn also show a significant warming during 1961-2014, but the biggest is in spring, and also not obvious in summer (shown in Table 5). In the past 100 years, there are two obvious warming periods in winter: the first is in the early and mid-1960s, and the second is from the early of 1990s to present (shown in Figure 8a). Abrupt change test shows that there is a significant abrupt warming point in the year of 1987 (Figure omitted). In spring, there are three obvious warming periods: the first is from the late 1920s to the late 1940s, the second from the end of the 1950s to the mid-1970s, and the last from the early 1990s to present (shown in Figure 8b). There is a significant abrupt warming point with the year of 1997 (Figure omitted). In summer, the temperature anomalies are mainly positive from the mid-1920s to the late 1960s and display a descending trend until the 2000s (shown in Figure 8c). There are two significant abrupt warming points in 1933 and 2009 and an abrupt descending point in 1957. In autumn, the mid- and late 1920s and from the mid-1930s to the mid-1940s are the two obvious warm periods. Since then the temperature shows a fluctuation until the mid-1990s, followed by another warm period till today (shown in Figure 8d), and there are also two significant abrupt warming points with the year of 1926 and 2004 and an abrupt descending point in 1947 (Figure omitted).
Table 5 Seasonal temperature linear tendency rates for 1910-2014 and 1961-2014 in Hunan Province (** and * denote 0.01 and 0.05 level of significant trends, respectively)
Winter Spring Summer Autumn
Ascending rate during 1910-2014 0.13 ** 0.11** 0.03 0.05 *
Ascending rate during 1961-2014 0.19** 0.22** 0.07 0.17 **
The Morlet wavelet transformation is also carried out on each seasonal temperature series during the past 100 years and the results show that there is one long periodic oscillation of 50 years and one intermediate frequency oscillation of 20-30 years and several high frequency oscillations in each season. The 50-year long period oscillation displays that the mean temperature of four seasons has all experienced two climatic shifts from cold to warm during 1910-2014.

5 Conclusions

(1) Construction of long-term homogeneous time series is essential for research on climate change. Based on the technique of two-phase regression and the historical evolution of meteorological stations, the temperature time series for each station in Hunan Province during 1910-2014 are tested for their homogeneity and the temperature series over one third of the total are corrected for inhomogeneity. And after using interpolation and representative analysis in this study, we objectively establish a set of homogenized monthly mean SAT series in Hunan Province back to the early of the 19th century.
(2) The annual mean temperature of Hunan Province shows a significant warming trend during 1910-2014 but its ascending rate is lower than the whole country in the same period. In the background of global warming, the temperature is also alternating between warm and cold in Hunan Province during the past 100 years and more frequently than that in China.
(3) The warming of Hunan Province has a seasonal difference. The mean temperature series of winter, spring and autumn show a significant warming trend during 1910-2014 and the ascending rate of winter is the largest, but not obvious in summer. During 1961-2014, the mean temperature series of winter, spring and autumn also show a significant warming trend but the ascending rate of spring is the largest, and not obvious in summer too.
(4) Abrupt change test show that the annual mean temperature and average temperature in winter and spring all have a significant abrupt warming point during the past 100 years, and the abrupt year of winter temperature is the earliest, then in spring, and the annual mean temperature is the latest. The temperature fluctuations are relatively frequent in summer and autumn, and these two seasons all have two abrupt warming points and one abrupt descending point.
(5) The results of Morlet wavelet transformation show that the annual and seasonal mean temperature series of Hunan Province all have one long periodic oscillation of 50 years and one intermediate frequency oscillation of 20-30 years and several high frequency oscillations. The 50 years long periodic oscillation signal displays that the annual mean temperature occurs two climatic shifts from cold to warm during 1910-2014, also in the four seasons.
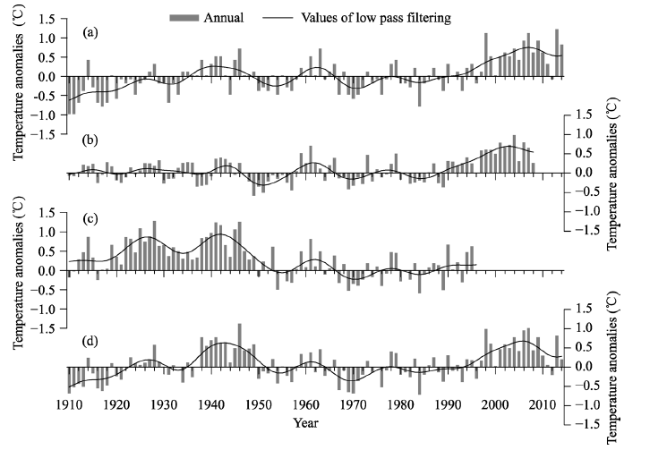
Figure.8 The mean temperature anomalies in winter (a), spring (b), summer (c) and autumn (d) during 1910-2014 over Hunan Province (to average level of 1971-2000)

The authors have declared that no competing interests exist.

[1]
Cai Qiufang, Liu Yu, 2013. The June-September maximum mean temperature reconstruction from Masson pine (Pinus massoniana Lamb.) tree rings in Macheng, southeast China since 1879 AD. Chinese Science Bulletin, 58(S1): 169-177. (in Chinese)High-resolution and accurately dated tree-ring material is one of the major tools for studying past climate change during the last millennia. However,to date,dendroclimatological studies in southeast China are scarce because of the complicated relationship between tree rings and climatic factors,as well as the paucity of old trees and difficulties in dating. In the present paper,two Masson pine tree-ring chronologies(HTG0 and HTG2) were developed in Macheng,a junction area of three provinces(Hubei,Anhui and Henan) in southeast China. Strongly negative relationships were detected between the ring width and the seasonal mean and maximum temperatures from September to October,current March to April and June to September. The strongest correlation was identified between HTG0 and the maximum mean temperature from June to September(Tmax6–9,r=-0.61,P0.001). A simple regression model was designed to reconstruct Tmax6–9 from 1879 to 2011. The reconstruction accounts for 37.2% of the explained variance of instrumentally observed Tmax6–9 over the period 1959–2008. The reconstructed temperature displayed an asymmetric "W" type. A long,gradually decreasing trend from 1879 to 1951,and an increasing trend since 1983 were observed. Moreover,two cold(1940–1957; 1971–1998) and two warm(1959–1970; 1999–2011) intervals were identified during the past 133 years. In addition,spatial correlation analysis revealed that the Tmax6–9 reconstruction was regionally representative for a large area of southeast China,especially extending to the west of the sample site. This was also verified by other tree-ring based temperature series around this region. This study is expected to clarify the climatic conditions in southeast China beyond the instrumental record,as well as the possible response of Masson pine to future global warming for forest management purposes.

[2]
Cao Lijuan, Zhao Ping,Yan Zhongwei et al, 2013. Instrumental temperature series in eastern and central China back to the nineteenth century.J. Geophys. Res.-Atmos., 118: 1-11. doi: 10.1002/jgrd.50615In this study, we bring together different source data sets and use quality control, interpolation, and homogeneity methods to construct a set of homogenized monthly mean surface air temperature (SAT) series for 18 stations in eastern and central China from the late nineteenth century. Missing values are statistically interpolated, and cross validation is used to assess the accuracy of the interpolation approaches. Results show that the errors of interpolation are small, and the interpolated values are statistically acceptable. Multiple homogeneity methods and all available metadata are used to assess the consistency of the time series and then to develop adjustments when necessary. Thirty-three homogeneity breakpoints are detected in the 18 stations, and the time series is adjusted to the latest segment of the data series. The adjusted annual mean SAT generally shows a range of trends of 1.0 degrees to 4.2 degrees C/100years in northeastern and southeastern China and a range of trends of -0.3 degrees to 1.0 degrees C/100years in central China near 30 degrees N. Compared to the adjusted time series, the unadjusted time series underestimates the warming trend during the past 100years. The regional and annual mean SAT over eastern and central China agrees well with estimates from a much denser station network over this region of China since 1951 and shows a warming trend of 1.52 degrees C/100years during 1909-2010.

DOI

[3]
Cao Lijuan, Yan Zhongwei, 2011. Progresses in research of homogenization of climate data.Adv. Clim. Change Res., 7(2): 129-135. (in Chinese)The observation data from ground surface meteorological stations is an important foundation on which climate change research is carried out,while the homogenization of the data has the most significance and value for improving the quality and homogeneity of the data series.This paper reviews recent advances in the techniques of identifying and adjusting inhomogeneity in climate series.After briefly introducing the results of applying two commonly accepted and well-developed methods RHtest and MASH to surface climate observations such as temperature and wind speed in China,the authors summarize current progresses and problems in this field,and propose ideas for foreseeable future studies in China.Along with collecting more detail metadata,more research work should be done in future on homogenization technology.On the basis of comparing and evaluating advantages and disadvantages of different homogenizing methods,the homogenized climate data series of the last hundred years should be rebuilt.

DOI

[4]
Cao Shoujin, Cao Fuxiang, Xiang Wenhua, 2012. Tree-ring-based reconstruction of temperature variations from May to July since 1840 in Yanling county of Hunan province, China.Journal of Central South University of Forestry & Technology, 32(4): 10-14. (in Chinese)By using the method of dendrochronology,a tree-ring width chronology from 1840 to 2010 has been built based on the data of Abies ziyuanensis tree-ring in Yanling county of Hunan province.The calculation results show that the data of the standardization(STD) chronology are significantly correlated with the mean air temperature from May to July in 2010.The mean temperatures of May to July at the sampling site were reconstructed by using the regression method.The reconstructed results indicate that four cold periods(1840~1866,1879~1902,1914~1924,1932~1940) and three warm periods(1869~1877,1905~1913,1925~1930) may be occurred.The mean temperature in the area may increased quickly after 1999.

DOI

[5]
Center on Climate Change, China Meteorological dministration (CCC,CMA), 2015. China Climate Change Bulletin 2014.Beijing: 1-10. (in Chinese)

[6]
Duan Deyin, 1989. Climatic variation and extra long-range forecast of Hunan Province: Climatology analysis of tree-ring.Journal of Changsha Normal University of Water Resources and Electric Power, 4(4): 81-87. (in Chinese)According to the dendro analysis, this paper makes a study of the trend and features of climatic variation of Hunan province in the last two hundred years, then shows that it is the fourth cold stage in Chinese history, including three cold periods and three warm periods on a less scale, and obtains the climatological data of the last two hundred years. Finally the paper discusses the relation between the climatic periods and the solar activity, general atmospheric circulation, and tells the extra long-range forecast of the future climate in more than 10 years. The author considers that the weather will be drier and warmer and that the El-Nino will be likely to appear between 1991 and 1993, 1996 and 1998, in 2000.

[7]
Duan Deyin, 1992. Study on the climate change in the last six hundred years in Dongting Lake Region of Hunan. Meteorological Science and Technology, 20(2): 52-56. (in Chinese)

[8]
Fang Xiuqi, Xiao Lingbo,Ge Quansheng et al 2005. Changes of plants phenophases and temperature in spring during 1888-1916 around Changsha and Hengyang in Hunan province.Quaternary Sciences, 25(1): 74-79. (in Chinese)Historical recordation is one of the highlighted proxy data for reconstruction of past environment changes, in which China has a great advantage for abundant historical literature. Among the sources of historical records on environment change, ancient dairies are important and contain plenty of climatic information undiscovered. In this paper, a diary named “Xiangqilou Diary”, which was written by Wang Kaiyun in the late Qing Dynasty, has been discovered. Wang Kaiyun had written his diary between 1869 to 1916. In the dairy, there are a lot of valuable recordation on phenology and weather. The records are especially valuable during the years from 1887 to 1916 when Wang Kaiyun lived in the area around Changsha and Hengyang in Hunan Province, which may provide continuous proxy data for reconstructing the environment change of the area. Based on the phenological records on typical plant species (peach, plum, apricot, peony, cherry, crab apple and redbud) collected from the “Xiangqilou Diary”, a series of annual plants phenophases anomaly in spring during 1888~1916 around Changsha and Hengyang in Hunan Province has been reconstructed. To compare with the present phonological date around Changsha and Hengyang, the average phenophase in spring during 1988~1916 was 3.22d later than the present day. According to the 5-year running mean of the phonological anomaly series, the phenophases during 1888~1916 can be divided into three phases. That is the phenophases was 3.42d later than present during 1888~1900, 5.33d earlier in average during the three years with records in 1901~1904, and 5.17d later during 1905~1916. The decadal mean phenophases were later than the mean of the present day, in which 4.89d later in the 1890s(1890~1899), 2.22d later in 1900s(1900~1909), and 4.29d later in the first 7 years of the 1910s(1900~1916). As a natural record of the climate change, phenopheses can objectively reflect temperature changes. Because the phenophases during 1888~1916 was generally later than nowadays, it can be inferred that the climate during 1888~1916 was colder than the present day. The average spring temperature during 1888~1916 was about 0.37℃ lower than now, in which it was 0.58℃ lower in the 1890s, 0.23℃ lower in the 1900s, and 0.51℃ lower in the 1910s. The result analyzed in this paper is helpful for extending the history of spring temperature change in Changsha back to the 1890s.

DOI

[9]
Hansen J, Ruedy R, Sato M et al., 2010. Global surface temperature change. Rev. Geophys., 48: RG4004. doi: 10.1029/2010RG000345.

[10]
Lawrimore J H, Menne M J,Gleason B E et al.B E , 2011. An overview of the Global Historical Climatology Network monthly mean temperature data set, version 3.J. Geophys. Res., 116: D19121. doi: 10.1029/2011JD016187.Since the early 1990s the Global Historical Climatology Network-Monthly (GHCN-M) data set has been an internationally recognized source of data for the study of observed variability and change in land surface temperature. It provides monthly mean temperature data for 7280 stations from 226 countries and territories, ongoing monthly updates of more than 2000 stations to support monitoring of current and evolving climate conditions, and homogeneity adjustments to remove non-climatic influences that can bias the observed temperature record. The release of version 3 monthly mean temperature data marks the first major revision to this data set in over ten years. It introduces a number of improvements and changes that include consolidating "duplicate" series, updating records from recent decades, and the use of new approaches to homogenization and quality assurance. Although the underlying structure of the data set is significantly different than version 2, conclusions regarding the rate of warming in global land surface temperature are largely unchanged.

DOI

[11]
Li Q, Zhang H, Chen J et al., 2009. A mainland China homogenized historical temperature dataset of 1951-2004.Bull. Amer. Meteor. Soc., 90(8): 1062-1065. doi: 10.1175/2009BAMS2736.1.The China Homogenized Historical Temperature (CHHT) dataset (1951-2004) version 1.0 consists of monthly and daily surface observations from all national stations in mainland China. The primary objective of CHHT 1.0 is to build a set of homogenized observational climatic datasets to reduce uncertainty in the detection of observed climatic change and variability. CHHT version 1.0 covers the years 1951-2004 in two formats that are stations and grids with 2.5 2.5 spatial resolution and dataset is developed by using observations of daily mean, minimum and maximum temperatures from a total of 731 national weather stations distributed throughout mainland China. CHHT 1.0 quality control starts with fundamental checks that include the checking of range and limiting values, checking the internal consistency and, checking the measurements against each other. The CHHT 1.0 temperature data include two different datasets that are the original data and a homogeneity-adjusted version.

DOI

[12]
Li Q X, Dong W J, Li W et al.Li W ., 2010. Assessment of the uncertainties in temperature change in China during the last century.Chinese Sci Bull, 55(17): 1974-1982. doi: 10.1007/s11434-010-3209-1.

[13]
Li Q X, Liu X N, Zhang H Z etal., 2004. Detecting and adjusting temporal inhomogeneity in Chinese mean surface air temperature data.Adv Atmos Sci., 21(2): 260-268.Adopting the Easterling-Peterson (EP) techniques and considering the reality of Chinese meteorological observations, this paper designed several tests and tested for inhomogeneities in all Chinese historical surface air temperature series from 1951 to 2001. The result shows that the time series have been widely impacted by inhomogeneities resulting from the relocation of stations and changes in local environment such as urbanization or some other factors. Among these factors, station relocations caused the largest magnitude of abrupt changes in the time series, and other factors also resulted in inhomogeneities to some extent. According to the amplitude of change of the difference series and the monthly distribution features of surface air temperatures, discontinuities identified by applying both the E-P technique and supported by China station history records, or by comparison with other approaches, have been adjusted. Based on the above processing, the most significant temporal inhomogeneities were eliminated, and China most homogeneous surface air temperature series has thus been created. Results show that the inhomogeneity testing captured well the most important change of the stations, and the adjusted dataset is more reliable than ever. This suggests that the adjusted temperature dataset has great value of decreasing the uncertaities in the study of observed climate change in China.

DOI

[14]
Li Qingxiang, Liu Xiaoning, Zhang Hongzheng, 2003. Homogeneity study of in situ observational climate series.Meteorological Science and Technology, 31(1): 3-10. (in Chinese)The factors causing inhomogeneities and the techniques of identifying inhomogeneities and adjusting climate series developed by the native and foreign climatologists are discussed. The progress of the homogeneity study of the national or regional climate data in respective countries are summarized. A summary of the relocations of the stations and the changes of the instruments in China during 1951-2001 is given.The conclusions on the homogeneity study of Chinese climate data are reviewed, and some discussions and suggestions on homogeneity study of meteorological data are presented.

[15]
Liu X N, Li Q X, 2003. The research of the inhomogeneity test on China climate data series.Acta Meteorologica Sinica, 17(4): 492-502.

[16]
Lund R, Reeves J, 2002. Detection of undocumented Change points: A revision of the two-phase regression model.Journal of Climate, 15(17): 2547-2554.Changepoints (inhomogeneities) are present in many climatic time series. Changepoints are physically plausible whenever a station location is moved, a recording instrument is changed, a new method of data collection is employed, an observer changes, etc. If the time of the changepoint is known, it is usually a straightforward task to adjust the series for the inhomogeneity. However, an undocumented changepoint time greatly complicates the analysis. This paper examines detection and adjustment of climatic series for undocumented changepoint times, primarily from single site data. The two-phase regression model techniques currently used are demonstrated to be biased toward the conclusion of an excessive number of unobserved changepoint times. A simple and easily applicable revision of this statistical method is introduced.

DOI

[17]
Jones P D, Lister D H,Osborn T J etal., 2012. Hemispheric and large-scale land surface air temperature variations: An extensive revision and an update to 2010.J. Geophys. Res.-Atmos., 117: D05127. doi: 10.1029/2011JD017139.This study is an extensive revision of the Climatic Research Unit (CRU) land station temperature database that has been used to produce a grid-box data set of 5° latitude × 5° longitude temperature anomalies. The new database (CRUTEM4) comprises 5583 station records of which 4842 have enough data for the 1961-1990 period to calculate or estimate the average temperatures for this period. Many station records have had their data replaced by newly homogenized series that have been produced by a number of studies, particularly from National Meteorological Services (NMSs). Hemispheric temperature averages for land areas developed with the new CRUTEM4 data set differ slightly from their CRUTEM3 equivalent. The inclusion of much additional data from the Arctic (particularly the Russian Arctic) has led to estimates for the Northern Hemisphere (NH) being warmer by about 0.1°C for the years since 2001. The NH/Southern Hemisphere (SH) warms by 1.12°C/0.84°C over the period 1901-2010. The robustness of the hemispheric averages is assessed by producing five different analyses, each including a different subset of 20% of the station time series and by omitting some large countries. CRUTEM4 is also compared with hemispheric averages produced by reanalyses undertaken by the European Centre for Medium-Range Weather Forecasts (ECMWF): ERA-40 (1958-2001) and ERA-Interim (1979-2010) data sets. For the NH, agreement is good back to 1958 and excellent from 1979 at monthly, annual, and decadal time scales. For the SH, agreement is poorer, but if the area is restricted to the SH north of 60°S, the agreement is dramatically improved from the mid-1970s.

DOI

[18]
Jones P D, New M,Parker D E etal., 1999. Surface air temperature and its changes over the past 150 years.Geophys. Rev., 37: 173-199. doi: 10.1029/1999RG900002.We review the surface air temperature record of the past 150 years, considering the homogeneity of the basic data and the standard errors of estimation of the average hemispheric and global estimates. We present global fields of surface temperature change over the two 20-year periods of greatest warming this century, 1925–1944 and 1978–1997. Over these periods, global temperatures rose by 0.37° and 0.32°C, respectively. The twentieth-century warming has been accompanied by a decrease in those areas of the world affected by exceptionally cool temperatures and to a lesser extent by increases in areas affected by exceptionally warm temperatures. In recent decades there have been much greater increases in night minimum temperatures than in day maximum temperatures, so that over 1950–1993 the diurnal temperature range has decreased by 0.08°C per decade. We discuss the recent divergence of surface and satellite temperature measurements of the lower troposphere and consider the last 150 years in the context of the last millennium. We then provide a globally complete absolute surface air temperature climatology on a 1° × 1° grid. This is primarily based on data for 1961–1990. Extensive interpolation had to be undertaken over both polar regions and in a few other regions where basic data are scarce, but we believe the climatology is the most consistent and reliable of absolute surface air temperature conditions over the world. The climatology indicates that the annual average surface temperature of the world is 14.0°C (14.6°C in the Northern Hemisphere (NH) and 13.4°C for the Southern Hemisphere). The annual cycle of global mean temperatures follows that of the land-dominated NH, with a maximum in July of 15.9°C and a minimum in January of 12.2°C.

DOI

[19]
Peterson T C, Vose R S, 1997. An overview of the global historical climatology network temperature data base.Bulletin of the American Meteorological Society, 78(12): 2837-2849.

[20]
Qin Dahe, Thomas Stocker, 259 Authors et al.259 Authors ., 2014. Highlights of the IPCC Working Group I Fifth Assessment Report.Advances in Climate Change Research, 10(1): 1-6. (in Chinese)Highlights of the IPCC Working Group I(WGI) Fifth Assessment Report(AR5) are the essence refined from the researches in the field of climate change physical science in the past seven years.More than half of the observed increase in global average surface temperature since the 1950s was caused by the human influence.Nightythree percent of the energy resulting from the anthropogenic CO_2 emissions since 1971 is stored in the ocean.Besides,ocean has absorbed about 30%of the emitted anthropogenic CO_2,causing the decrease in pH of ocean surface by 0.1,etc.Based on the CMIP5 models,it is projected that global warming will continue.Relative to 1986 2005,the global mean surface temperature by the end of the 21 st century will increase by 0.3~4.8 ℃.Limiting climate change will require substantial and sustained reductions of greenhouse gas emissions.Controlling the warming caused by anthropogenic CO_2 emissions alone with a probability of 66%to less than 2℃ since the period 1861 1880,will require cumulative CO_2 emissions from all anthropogenic sources to stay between 0 and about 1000 Gt C since that period.

[21]
Ren Yongjian, Chen Zhenghong, Xiao Yinget al., 2010. Surface air temperature change of last 100 years over Wuhan region.Scientia Geographica Sinica, 30(2): 278-282. (in Chinese)Taking into account the non-uniformity of the temperature sequence, the annual and seasonal temperature series over Wuhan region during 1905-2005 were established through a reasonable interpolation. The results showed that annual mean temperature and annual mean minimum temperature had showed an upward trend with rates of 0.014℃/10a and 0.026℃/10a since 1905, whereas the annual mean maximum temperature was a weak downward trend with a rate of -0.003℃/10a.All these indicated that a warming trend over Wuhan region was more visible at night, yet little during daytime, and that the annual mean maximum temperature and mean minimum temperature had showed an asymmetric trend. The annual mean temperature and the annual mean maximum temperature had two warm times, which were 1920s-1940s and 1990s up to the present. The summer and autumn temperature were higher during the first warm period, but the winter and spring were not obvious, moreover high temperature occurred in daytime. The four-season temperature was higher during the second period, the winter and spring were most obvious, but the summer was weak, moreover warm at night.

DOI

[22]
Tang Guoli, Ren Guoyu, 2005. Reanalysis of surface air temperature change of the last 100 years over China.Climatic and Environmental Research, 10(4): 791-798. (in Chinese)The present paper gives a new country-averaged surface air temperature anomaly series for China for 1905—2001 period. We used monthly mean temperature dada obtained by averaging monthly mean maximum and minimum temperatures to avoid the in-homogeneity problems with data induced by differential observation times and statistic methods between early and late 20th century. The widely accepted procedures for creating area-averaged climatic time series and for calculating linear trend have been used. The new air temperature time series has been analyzed and its rationality also has been explained. The result shows that annual mean surface air temperature of the country for the past 97 years experienced a warming of 0.79 ℃, with a warming rate of 0.08 ℃/10 a which is slightly larger than global or northern hemispheric average as given by IPCC TAR. Two warm periods, which occurred respectively in the 1930s—1940s and the 1980s—1990s, are evident, with 1946 and 1998 as the warmest ones within the record period. It is interesting to note that the temperature anomalies of the 1990s are no higher than those of the 1940s, implying the larger contribution from warming of the cold periods to the long-term positive trend. Seasonal features of temperature changes for the last 97 years are characterized by the more rapid warming of wintertime and springtime, with summer showing an insignificant cooling trend during the 97-year period. However, the reanalysis did not take account for urbanization effect on temperature record. It is essential to pay more attention to the problem in the further study if we intend to better detect the regional change in climate.

DOI

[23]
Wang Shaowu, Ye Jinlin, Gong Daoyi et al.Gong Daoyi ., 1998. Construction of mean annual temperature series for the last one hundred years in China.Journal of Applied Meteorological Sciences, 9(4): 392-401. (in Chinese)Mean annual temperature series from 1880 to 1996 were constructed for ten regions:Northeast,North,East,South,Taiwan,Southcentral,Southwest,Northwest,Xinjiang and Tibet on the basis of temperature observations,documentary data,ice core data and tree ring data. A series of temperature in China was obtained by average of the ten regional series in considering area size of the region. The temperature series shows more significant warming trend in the last one hundred years (0.44℃/100a),which is much greater than that obtained in 1990(0.09℃/100a). This is because the new series includes Xinjiang and Tibet regions,where the temperature was quite low in the later of last century and early of this century. Furthermore,the trend was also increased by the rapid warming in 1990s.

[24]
Wei Fengying, 1999. Modern Technology of Statistical Diagnosis and Prediction in Climate. Beijing: China Meteorological Press, 37-40, 99-104. (in Chinese)

[25]
Zheng J, Hua Z, Liu Y etal., 2015. Temperature changes derived from phenological and natural evidence in South Central China from 1850 to 2008. Clim. Past, 11:1553-1561. doi: 10.5194/cp-11-1553-2015Annual temperature anomalies in South Central China from 1850 to 2008 are reconstructed by synthesizing three types of proxies: spring phenodates of plants recorded in historical personal diaries and observations, snowfall days extracted from historical archives and observed at meteorological stations, and five tree-ring width chronologies. Instrumental observation data and the leave-one-out method are used for calibration and validation. The results show that the temperature series in South Central China exhibits interannual and decadal fluctuations since 1850. The first three cold decades were the 1860s, 1890s, and 1950s, while 1893 was very likely the coldest year. Except for the three warm decades that occurred around 1850, 1870, and 1960, along with the 1920s to the 1940s, the recent warm decades of the 1990s and 2000s represent unprecedented warming since 1850.

DOI

[26]
Zheng Yonghong, Zhang Yong,Shao Xuemei etal., 2012. Climate significance of tree ring width of Huangshan pine and Chinese pine in the Dabie Mountains.Progress in Geography, 31(1): 72-77. (in Chinese)Two well-replicated tree-ring width chronologies more than 100 years were developed by using the tree ring cores of Huangshan Pine(Pinus Taiwanese Hayata) and Chinese Pine(Pinus tabulaeformis Carr.) sampled in 2010 for the Dabie Mountains.The Huangshan Pine chronology covers the period 1869-2009 and the Chinese Pine chronology from 1883 to 2009.To explore the climate significance of tree ring width of Huangshan Pine and Chinese Pine in the study of dendroclimate,correlation analyses were conducted between the two chronologies and four climate variables at Macheng meteorological station.These climate variables include monthly mean maximum temperature,monthly mean temperature,monthly mean minimum temperature and monthly precipitation,all of which cover the period from 1959 to 2009.The results showed that the Huangshan Pine chronology was characterized by a higher mean sensitivity,standard deviation and signal to noise ratio than the Chinese Pine chronology,which might means that Huangshan Pine has more climate signals and higher value than Chinese Pine in the study of dendroclimate.The results of correlation analysis showed that the radial growth of Huangshan Pine was closely related to the February-July mean temperature,while there was no significant correlation with precipitation in any month or season.In contrast,the radial growth of Chinese Pine was mainly influenced by the total precipitation in the period from May to June,while there was no significant correlation with temperature in any month or season.The radial growth of Huangshan Pine and Chinese Pine shows different responses to climate variables.One reason may be that they are different species,and the other reason may be that they were sampled at different altitudes.Different from the earlier concept,this study showed that the inter-annual changes of climate variables also have a strong restrictive effect on the radial growth of some tree species in warm and humid areas in subtropical China,which showed that the change of tree ring width can be a well indicator for climate change in these areas.The results not only can further supplement the study of tree-ring width chronologies,but also can provide reference for the study of dendroclimate reconstruction in warm and humid areas in subtropical China.

DOI

Outlines

/