
Journal of Geographical Sciences >
Multi-object approach and its application to adaptive water management under climate change
Received date: 2016-01-27
Accepted date: 2016-04-11
Online published: 2017-03-30
Supported by
Major National Scientific Research Projects, No.2012CB956204
National Basic Research Program of China, No.2015CB452701, No.2010CB428406
National Natural Science Foundation of China, No.51279140
Copyright
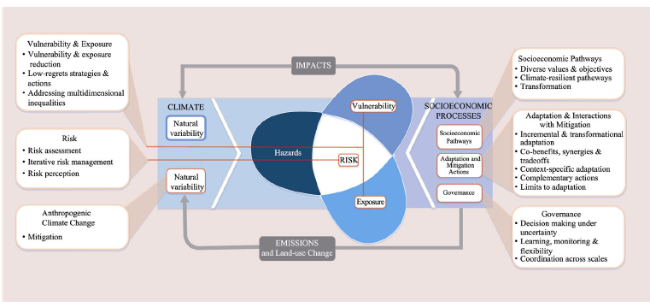
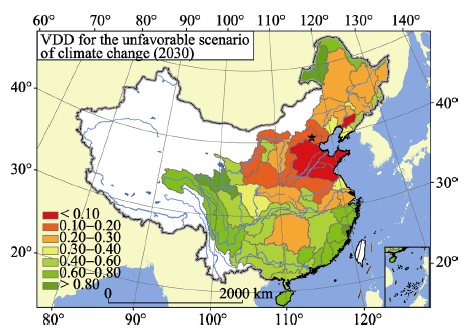
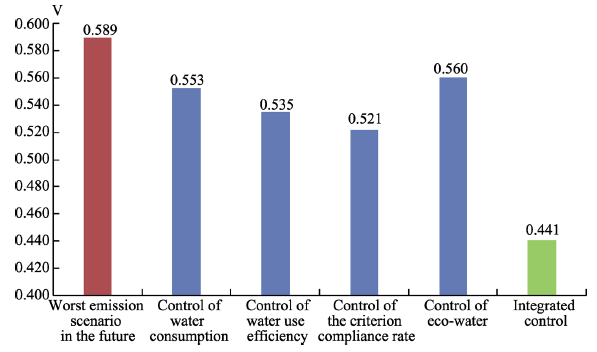
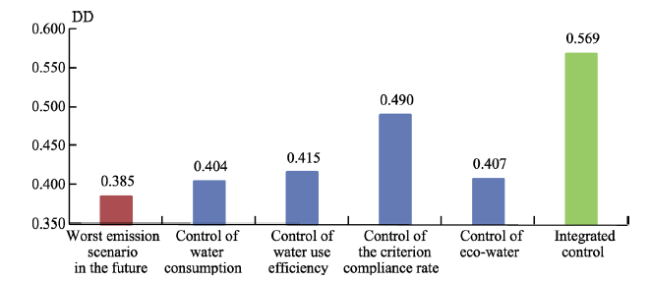
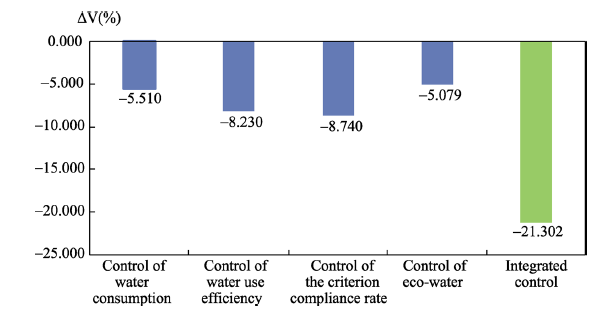
This paper addresses issues on adaptive water management under the impact of climate change. Based on a set of comprehensive indicators of water system, a decision making approach of multi-objects is developed and applied to quantify water adaptive management for the demands of water sustainable use, water environmental protection and eco-water requirement under the climate change. For this study in China, two key indicators are proposed, namely (1) the water resources vulnerability (V) that was represented by integrated sensitivity (S) and resilience (C) of climate change impact on water resources, and (2) the sustainability of socio-economy and water environment, marked by DD, that is integrated scaler of socio-economic development (EG) based on the amount of GDP and the water environment and relative eco-system quality (LI). To find a reasonable solution for adaptive water management, a multi-objective decision making model of adaptive water management is further developed and the multi-objective model was transformed into an integrated single optimization model through developing an integrated measure function, called as VDD=DD/V. This approach has been applied to adaptive water resources planning and management for case study of China with new policy, called as the strict management of water resources based on three red line controls, i.e., the control of total water use by the total water resources allocation, the control of lower water use efficiency by the water demand management and the control of the total waste water load by water quality management in the Eastern China Monsoon Region that covers major eight big river basins including Yangtze River, Yellow River, Haihe River and Huaihe River. It is shown that the synthetic representation of water resource vulnerability and socio-economic sustainability by the integrated objective function (VDD) and integrated decision making model are workable and practicable. Adaptive management effect of the criterion compliance rate and water use efficiency are more appreciable through new water policy of the three red line controls, which can reduce 21.3% of the water resources vulnerability (V) and increase 18.4% of the sustainability of socio- economy and water environment (DD) for the unfavorable scenario of climate change in 2030.
Key words: adaptive water management; climate change; multi-object; vulnerability; sustainability; VDD
HONG Si , XIA Jun , CHEN Junxu , WAN Long , NING Like , SHI Wei . Multi-object approach and its application to adaptive water management under climate change[J]. Journal of Geographical Sciences, 2017 , 27(3) : 259 -274 . DOI: 10.1007/s11442-017-1375-7
Figure 1 Framework diagram of risks associated with the interaction of hazard, exposure and vulnerability related to climate |
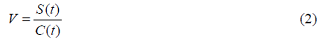
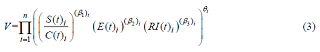

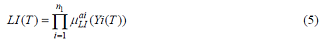
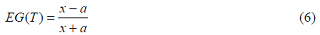
Figure 2 Key index of water resource vulnerability and adaptation |

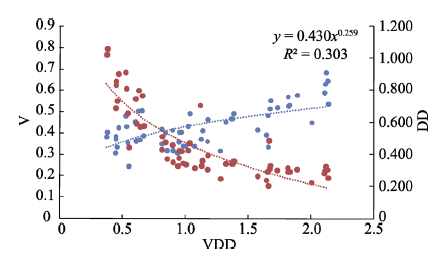
Figure 3 Tendency correlation analysis of VDD, V and DD |
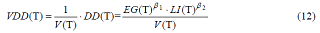
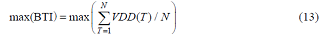
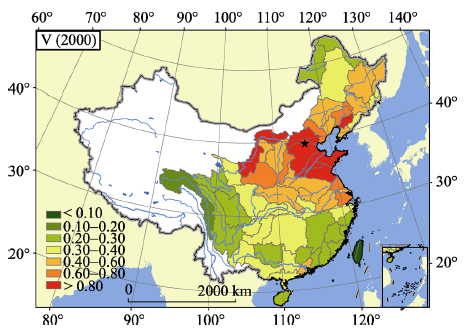
Figure 4 V: water resource vulnerability (2000) |
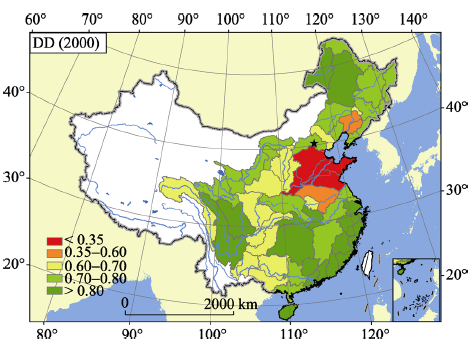
Figure 5 DD: degree of sustainable development (2000) |
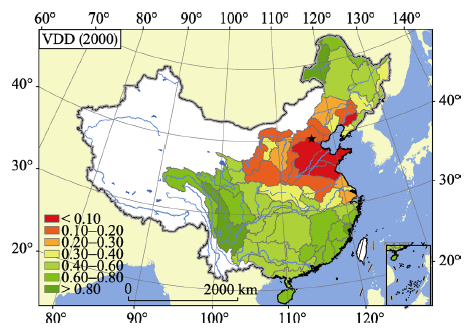
Figure 6 VDD: development and comprehensive benefits (2000) |
Figure 7 VDD for the unfavorable scenario of climate change in 2030 |
Table 1 Combination of regulatory decisions |
| Scheme | Control variables (Decision variables) | |||
|---|---|---|---|---|
| Water consumption | Water use efficiency | Criterion compliance rate | Eco-water | |
| 1 | • | |||
| 2 | • | |||
| 3 | • | |||
| 4 | • | |||
| 5 | • | • | ||
| 6 | • | • | ||
| 7 | • | • | ||
| 8 | • | • | ||
| 9 | • | • | ||
| 10 | • | • | ||
| 11 | • | • | • | |
| 12 | • | • | • | |
| 13 | • | • | • | |
| 14 | • | • | • | |
| 15 | • | • | • | • |
Figure 8 Result analysis of V after control |
Figure 9 Result analysis of DD after control |
Figure 10 Result analysis of V (%) after control |
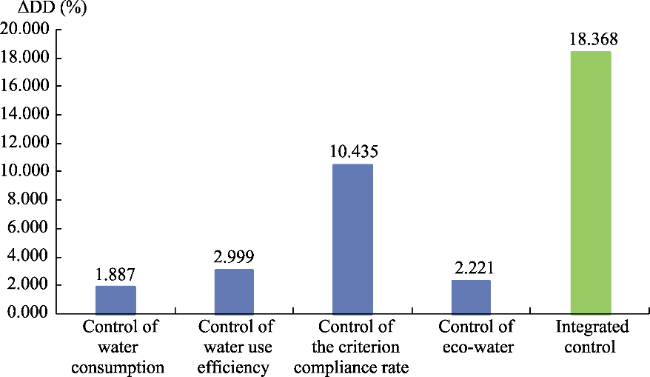
Figure 11 Result analysis of ΔDD (%) after control |
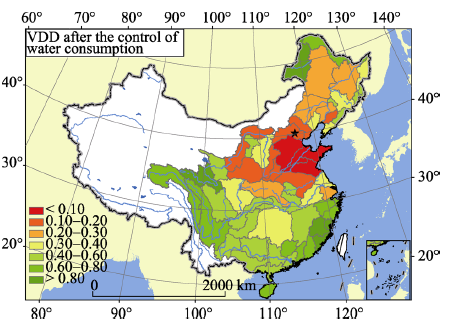
Figure 12 VDD after the control of water consumption (scheme 1) |
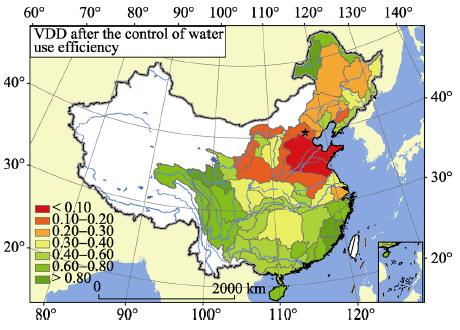
Figure 13 VDD after the control of water use efficiency (scheme 2) |
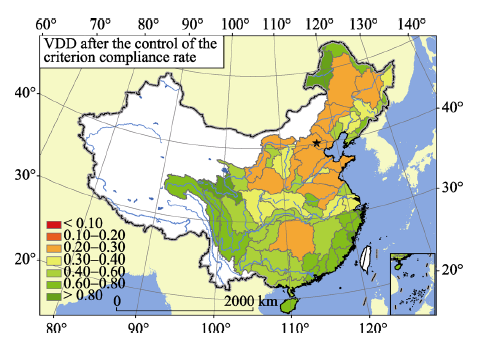
Figure 14 VDD after the control of the criterion compliance rate (scheme 3) |
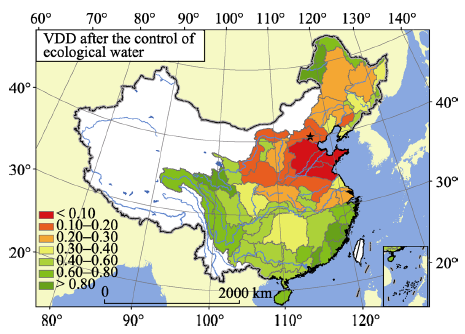
Figure 15 VDD after the control of eco-water (scheme 4) |
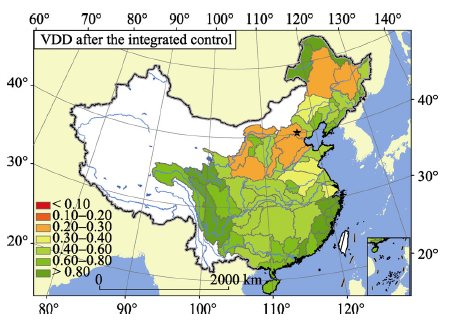
Figure 16 VDD after the integrated control (scheme 15) |
The authors have declared that no competing interests exist.
| [1] |
|
| [2] |
|
| [3] |
|
| [4] |
|
| [5] |
|
| [6] |
|
| [7] |
|
| [8] |
|
| [9] |
|
| [10] |
|
| [11] |
|
| [12] |
|
| [13] |
|
| [14] |
IPCC, 2013. Climate Change 2013: The Physical Science Basis. Work Group I Contribution to the IPCC Fifth Assessment Report (AR5). Stockholm, Sweden: IPCC.
|
| [15] |
|
| [16] |
|
| [17] |
|
| [18] |
|
| [19] |
|
| [20] |
|
| [21] |
|
| [22] |
Statistic Bulletin on China Water Activities, 2000-2011. Beijing: China Water & Power Press. (in Chinese)
|
| [23] |
|
| [24] |
|
| [25] |
|
| [26] |
|
| [27] |
|
/
| 〈 |
|
〉 |