Research Articles

Influence of climate variability and human activities on stream flow variation in the past 50 years in Taoer River, Northeast China

  • ZHANG Kai , 1, 2 ,
  • LI Lijuan 1, * ,
  • BAI Peng 1 ,
  • LI Jiuyi , 3 ,
  • LIU Yumei 4
Expand
  • 1.Key Laboratory of Water Cycle & Related Land Surface Processes, Institute of Geographic Sciences and Natural Resources Research, CAS, Beijing 100101, China
  • 2.University of Chinese Academy of Sciences, Beijing 100049, China
  • 3.Institute of Geographic Sciences and Natural Resources Research, CAS, Beijing 100101, China
  • 4. Suzhou University of Science and Technology, Suzhou 215009, Jiangsu, China
*Corresponding author: Li Lijuan (1961-), PhD and Professor, specialized in hydrology and water resources. E-mail:

Author: Zhang Kai (1987-), PhD Candidate, specialized in hydrology and water resources. E-mail:

Received date: 2016-01-29

  Accepted date: 2016-09-30

  Online published: 2017-04-20

Supported by

National Natural Science Foundation of China, No.91547114, No.41201568, No.41201572

Copyright

Journal of Geographical Sciences, All Rights Reserved

Abstract

Taoer River Basin, which is located in the west of Northeast China, is an agro- pastoral ecotone. In recent years, the hydrological cycle and water resources have changed significantly with the deterioration of the environment. Many water problems such as river blanking, wetland shrinking and salinization have occurred in this region. All of these phenomena were directly caused by changes in stream flow under climate variability and human activities. In light of the situation, the impact of climate variability and human activities on stream flow should be identified immediately to identify the primary driving factors of basin hydrological processes. To achieve this, statistical tests were applied to identify trends in variation and catastrophe points in mean annual stream flow from 1961 to 2011. A runoff sensitive coefficients method and a SIMHYD model were applied to assess the impacts of stream flow variation. The following conclusions were found: 1) The years 1985 and 2000 were confirmed to be catastrophe points in the stream flow series. Thus, the study period could be divided into three periods, from 1961 to 1985 (Period I), 1986 to 2000 (Period II) and 2001 to 2011 (Period III). 2) Mean annual observed stream flow was 31.54 mm in Period I, then increased to 65.60 mm in Period II and decreased to 2.92 mm in Period III. 3) Using runoff sensitive coefficients, the contribution of climate variability was 41.93% and 43.14% of the increase in stream flow during Periods II and III, suggesting that the contribution of human activities to the increase was 58.07% and 56.86%, respectively. 4) Climate variability accounted for 42.57% and 44.30% of the decrease in stream flow, while human activities accounted for 57.43% and 55.70% of the decrease, according to the SIMHYD model. 5) In comparison of these two methods, the primary driving factors of stream flow variation could be considered to be human activities, which contributed about 15% more than climate variability. It is hoped that these conclusions will benefit future regional planning and sustainable development.

Cite this article

ZHANG Kai , LI Lijuan , BAI Peng , LI Jiuyi , LIU Yumei . Influence of climate variability and human activities on stream flow variation in the past 50 years in Taoer River, Northeast China[J]. Journal of Geographical Sciences, 2017 , 27(4) : 481 -496 . DOI: 10.1007/s11442-017-1388-2

1 Introduction

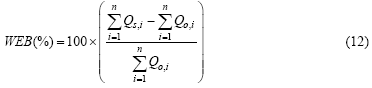
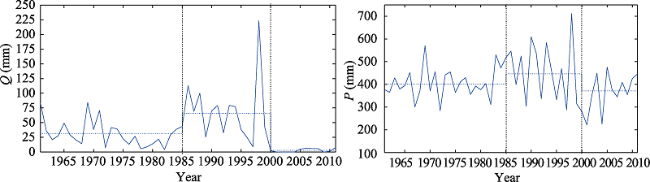
The changing environment due to climate variability and human activities could influence hydrological processes, which are complex (Marengo et al., 1998; Schulze, 2000; Tomer and Schilling, 2009; Zhang et al., 2010). With the deterioration of water resources and increasing consumption of global water resources, the study of the impact of climate variability and human activities on hydrology has been of great interest in hydrological science (Vorosmarty et al., 2000; Kang et al., 2004; Scanlon et al., 2007). Many studies have pointed out that global warming could intensify global hydrological processes (Brutsaert and Parlange, 1998; Zhang et al., 2003; Batisani, 2011). Specific to the regional scale, the impact of climate variability on steam flow variation needs to be investigated under each local climate scenario. Land use changes due to human activities and agricultural development can also affect stream flow (Calder, 1993). Climate variability, such as changes in precipitation and evapotranspiration, and increasing temperatures, could cause great variations in regional hydrological processes (Arnell and Reynard, 1996; Li et al., 2010; Wang and Hejazi, 2011; Ma et al., 2015). The effects of climate variability on stream flow in basins across Australia that were simulated by a hydrological model using long term climate data and future climate variability scenarios showed that changes in precipitation could result in enormous variations in stream flow, including both decrease and increase (Chiew et al., 1995; Chiew and McMahon, 2002). A study in North America found that changes in precipitation resulted in up to double the percentage variations in stream flow. Compared with precipitation, temperature changes were only mildly correlated with stream flow variations (Najjar, 1999). Human activities, such as land use/change, water intake, and water transfer projections play vital roles in the temporal and spatial changes of the hydrologic cycle, especially in stream flow variation. (Costa et al., 2003; Li et al., 2007a; Elfert and Bormann, 2010). For example, afforestation could lead to decreases in stream flow, and irrigation can also influence stream flow (Bosch and Hewlett, 1982; Huang and Zhang, 2004; Mu et al., 2007). These activities can not only alter landscape patterns, which affect stream flow processes, but also directly affect the quantity of stream flow. Generally speaking, human activities could affect stream flow in two ways. Some activities (i.e. water intake and water transfer projections) could directly affect stream flow and water resources variation. A study of the Middle Yellow River found that the contribution of direct human activities was about 3% to 5% during the past 50 years (Liang et al., 2013). However, stream flow variation influenced by direct activities could show different results in different regions. Changes in landscape patterns could affect stream flows through flow regime processes, such as flood frequency, base flow and mean annual stream flow discharge (Costa et al., 2003; Brath et al., 2006; Wang et al., 2006). Many empirical methods have been used to identify the impacts of those variations that were caused by climate variability and human activities (Zhan and Yu, 1994). But general conclusions could not be applied to all basins based on these empirical studies. Statistical methods (i.e. Mann-Kendall test, Yamamoto test and moving t-test) have been proposed to identify variation trends and distinguish between the contributions of climate variability and human activities in a catchment stream flow (Li et al., 2009; Zhang and Lu, 2009). Due to the limited temporal scale and lack of physical mechanisms, hydrological models have been applied to analyze the responses of stream flow processes. However, the results of model simulations have many uncertainties that are caused by model structures, parameters and spatial scales (Li et al., 2007b). In order to improve the accuracy of these studies, two methods in particular have been used to quantify and compare the impacts of climate variability and human activities on stream flow (Xu and Vandewiele, 1995; Yates, 1996; Jothityangkoon, 2001; Hu et al., 2012).
The Taoer River flows through Xing’an League and Baicheng City before flowing into the Nenjiang River. The Taoer River Basin, which is the largest watershed on the right bank of the Nenjiang River, has played a very important role in grain production of Northeast China. Due to its semi-arid and semi-humid climatic characteristics, the basin is very sensitive to climate variability and human activities. Between 1961 and 2011, human activities changed this region significantly. The total population of the two municipalities increased from 1.5 million to 3.9 million. The GDP of the region, where agricultural production is the dominant industry, reached 868 billion yuan in 2011. Since the 1960s, the underlying surface of this region has been dramatically altered by extensive development for agriculture and population growth. Especially after the 1980s, large areas of forestland, grassland and wetland have been reclaimed to increase grain yield. In order to achieve the goals of the food production plan of Jilin Province, upland areas were transformed to paddies in suitable irrigation districts. By 2011, the area of cultivated land was 35% of the whole basin, with grassland decreases by 34% and forestland decreases by 21% over the basin. More and more cultivated land has become artificially irrigated. Many water conservation projects were also created to ensure continued grain production, such as the Chaersen reservoir project completed in 1989 and the water diversion project from Nenjiang River to Baicheng City that was completed in 2011. In addition, in the wake of urban sprawl and population expansion, water consumption has been increasingly intensified in the region. Under these conditions, many eco-environmental problems such as river blanking, wetland shrinking, desertification and salinization have developed (Liang, 2008). Secondary salinization of the land has increased more than tenfold from the 1950s, and river blanking has already been reported over a 10-year period since the 1990s (Jiang, 2007). All of these phenomena revealed that the study area was environmentally vulnerable (Zhao, 1999). In light of this situation, the impacts of climate variability and human activities on stream flow should be identified immediately. Many studies have described the influence of changing environments on stream flow variations in the Nenjiang River basin of Northeast China. The results found slight decreasing trends in precipitation and remarkable temperature increases over the last 50 years (Ren et al., 2000; Luan et al., 2007). Therefore, those variations caused a decrease in stream flow in the Nenjiang River basin (Tang et al., 2009). With respect to the Taoer River, there have been fewer studies in recent decades. Liang and Li studied the changing trends in temperature, evaporation, precipitation, and stream flow. They found that from 1960 to 2000, temperature increased by 0.305℃ per decade and potential evaporation increased by 4.127 mm per decade (Liang, 2008; Liang et al., 2010). The contribution of climate variability and human activities were about 45% and 55%, respectively, between 1960 and 2000 (Li et al., 2010). However, studies rarely mentioned the variation of stream flow after 2000, so new features and stream flow variation patterns since then should be researched and discussed.
The goal of this study was to continue to inspect the variation and annual stream flow trends, and to verify the contributions of climate variability and human activities to stream flow variation in the Taoer River Basin based on the new data series. It is hoped that the results of this study will provide scientific evidence for sustainable development strategies for basins in this region, and benefit future regional exploitation.

2 Study area

The Taoer River Basin, which covers an area of about 41,600 km2, is located in the western part of the Song-Nen Plain in Northeast China at 45°6′-47°12′N and 117°18′-124°6′E. The river begins southeast of the Da Xing’an Mountains and flows into the Yueliangpao Reservoir, which eventually empties into the Nenjiang River (Figure 1). The length of the main channel is 563 km with an average slope of 1.52%. The west of the basin is the upper reach of the river, with a semi-humid continental monsoon climate and a topography made up of mountains and hills, while the eastern part of the river is the lower range with a semi-arid continental monsoon climate and plains topography. Precipitation increases from east to west, while the evaporation decreases from east to west.
Figure 1 Map of the whole basin and the study area
The mean annual precipitation of the study area is about 379 mm, typically occurring during the summer months. Precipitation from June to September accounts for 83% of the total annual precipitation. About 72% of the total annual stream flow is generated during the same period. The mean pan evaporation was about 1200 to 1500 mm, which is four times higher than the precipitation from 1961 to 2011.
Because the lower reaches of the basin are comprised of plains and wetlands, stream flow is very low with a low average velocity (Li et al., 2010), and return flow could even occur during the dry season. Furthermore, there is no continuous historical data for Yueliangpao, which is the last control station for the basin. Because of those limitations, the lower reach of the river was not included in our study, and only the upper and middle reaches were selected, which cover an area of 27200 km2.

3 Data description and processing

3.1 Data description

Daily stream flow, precipitation and meteorological data were used in this study. The daily stream flow data were obtained from the Taonan hydrological station. Daily precipitation data were obtained from the Song-Liao Water Resources Commission (SLWRC). Daily meteorological data were obtained from the National Meteorological Information Center (NMIC). 20 rainfall stations and 6 meteorological stations were chosen for the study for the timeframe between January 1, 1961 and December 31, 2011. The daily meteorological data included longitude, latitude, mean daily temperatures (T), maximum and minimum temperatures (Tmax and Tmin), daily precipitation (P), mean wind speed (V), daily vapor pressure (H) and daily sunshine hours (N). All stations are listed in Table 1.
Table 1 Summary of rainfall and meteorological gauging stations
ID Station Attribute ID Station Attribute ID Station Attribute
140 Bailang rainfall 149 Shuangcheng rainfall 158 Wuben rainfall
141 Wuchagou rainfall 150 Liuhu rainfall 159 Xinlitun rainfall
142 Suolun rainfall 151 Xieli rainfall / Arshaan meteorological
143 Minzhu rainfall 152 Gaojiatun rainfall / Suolun meteorological
144 Cha’ershen rainfall 153 Hulitu rainfall / Ulan Hot meteorological
145 Fuxingtun rainfall 154 Yongde rainfall / Baicheng meteorological
146 Alide’er rainfall 155 Nongye rainfall / Tongyu meteorological
147 Dashizhai rainfall 156 Wanbao rainfall / Qian’an meteorological
148 Zhenxi rainfall 157 Najin rainfall / Taonan hydrological

3.2 Data processing

A total of 18627 data values for each station, which were obtained from the rainfall stations, were used to calculate mean daily precipitation within the selected regions. Using a Thiessen Polygon Method, the regional mean daily precipitation could be obtained. Meanwhile, a total of 18627 data values for each station that were obtained from the meteorological stations were used to calculate daily potential evapotranspiration (E0) based on the Penman-Monteith method recommended by FAO (Liang et al., 2010). The equation can be written as:
${{E}_{0}}=\frac{0.408\Delta {{R}_{n}}+\gamma \frac{900}{T+273}V({{e}_{s}}-{{e}_{a}})}{\Delta +\gamma (1+0.34V)}$ (1)
where E0 is daily potential evapotranspiration (mm/d); Rn is net radiation (MJ/(m2·d)); T is mean daily temperature (℃); V is the wind speed (m/s); es-ea is the saturation vapor pressure deficit (kPa); is the slope of vapor pressure curve (kPa/℃); and γ is the psychrometric
constant (kPa/℃). All the variables in the equation above can be found in Chapter 3 of FAO Paper 56 (Allen et al., 1998). Similarly, the daily potential evapotranspiration from the 6 meteorological stations can be spatially averaged using the Thiessen Polygon Method to get the regional mean daily potential evapotranspiration.

4 Methodology

4.1 Catastrophe point detection with statistical analysis

(1) Mann-Kendall statistical test
To estimate the temporal trend of mean annual stream flow and detect catastrophe points in the Taoer River, the non-parametric Mann-Kendall (Mann, 1945; Kendall, 1948) test was applied. The M-K test has many robust advantages for dealing with non-normally distributed data, and has been extensively applied to identify eminence change trends in a hydro-climatic time series (Mitchell et al., 1966; Yue and Wang, 2002; Liu et al., 2008; Liang et al., 2010). In this study, we used the ordinal rank statistic from the M-K test that was proposed by Sneyers (Sneyers, 1975). A random data sequence was generated that was composed of x1, x2, …, xn, and every term in the rank was independent with same probability. For the elements whose values exceeded xi in the sequence, they were calculated as mi. The M-K rank statistic dk could be defined under the null hypothesis of no trend as
${{d}_{k}}=\sum\limits_{i=1}^{k}{{{m}_{i}}}\ \ (2\le k\le n)$ (2)
And the sequence is assumed to be normally distributed with random independence. The mean value and variance can be computed as:
${{d}_{k}}=E({{d}_{k}})=k(k-1)/4$
$\bar{\sigma }d_{k}^{2}=VAR({{d}_{k}})=k(k-1)(2k+5)/72$ (3)
The positive sequence of this test statistic can be normalized as Uk, which could be defined as:
${{U}_{k}}=\frac{{{d}_{k}}-E({{d}_{k}})}{\sqrt{VAR({{d}_{k}})}}\ \ \ (2\le k\le n)$ (4)
If the standard normal probability Prob(|z|>|Uk|) (k=1, 2, …, n) has a significance level of α, the null hypothesis of no trend would be eliminated (Serrano et al., 1999). In a graphical curve of the sequence as UF, the positive sequence trend would increase when Uk >0 and decrease when Uk <0.
The reversed data sequence could be calculated as Uk* by the same method. Setting another sequence Ukʹ=-Uk* as the backward sequence of the reversed sequence, the graphical curve could be indicated in the same graph as UB. The intersection points of UF and UB located between their confidence intervals could be considered to be the occurrence time of mutations.
(2) Moving t-test
The moving t-test is widely used to distinguish the difference between the means of two random data series. Setting an ith sample series as the target sequence, it can be divided into subsets by given constants n1 and n2. The values of the statistic ith can be calculated as:
$t=\frac{{{{\bar{x}}}_{1}}-{{{\bar{x}}}_{2}}}{\sqrt{\frac{{{n}_{1}}s_{1}^{2}-{{n}_{2}}s_{2}^{2}}{{{n}_{1}}+{{n}_{2}}-2}\times \left( \frac{1}{{{n}_{1}}}+\frac{1}{{{n}_{2}}} \right)}}$ (5)
where i, Si2 and ni are the average, variance and length of the sequence, respectively. Given a significance level of α, if the inequality |t| > tα/2 holds, the null hypothesis of there being no difference between the series could be eliminated. Thus, extreme values in the sequence curve, plotted based on values of t, indicate an abrupt change in the data series. Further details about this method can be found in the relevant literatures (Fu et al., 1992; Wei, 1999). In this study, n1=n2=10 was set to distinguish the different stream flow periods.
By combining these two methods, change points of stream flow can be confirmed and the time series of this study can be divided into different sub-periods. The first period is considered to be the benchmark period, which means that climate variability and human activities are in an initial stage and changes of the environment are small. The following periods are regarded as variety periods in which climate characteristics and human activities uniquely and significantly influence stream flow.

4.2 Method of estimating climate variability impacts on stream flow

For a given catchment, it is assumed that the changing environment that affects stream flow can only be divided into two parts; climate variability and human activities. Thus, the total change in observed mean annual stream flow (ΔQT) can be calculated as:
ΔQT=ΔQC+ΔQH (6)
where ΔQC is the variation in stream flow due to climate variability effects and ΔQH represents the effect of human activities.
Because it has been observed for a long time in the Taoer River Basin, changes in basin water storage can be reasonably assumed to be 0. The water energy balance equation can be expressed as:
P=E+Q(7)
where P refers to total precipitation, E is total evapotranspiration and Q is total stream flow. Budyko (1974) argued that by using the mean potential evapotranspiration and mean precipitation of the basin, mean annual actual evapotranspiration could be calculated. Following this hypothesis, Zhang et al. (2001, 2008) proposed an experiential equation over 250 basins for which the long term mean evapotranspiration can be estimated as:
$F(\Phi )=\frac{E}{P}=\frac{1+\omega \Phi }{1+\omega \Phi +{{(\Phi )}^{-1}}}$ (8)
where Φ is the aridity index (Φ=E0/P), E0 is potential evapotranspiration, and ω is a fitting coefficient related to any underlying surface such as vegetation and soil types. Based on previous research, the coefficient can be set to 1.14 (Li et al., 2010).
Climate variability could influence precipitation and potential evapotranspiration of the basin, which are considered to be important factors related to stream flow formation (Dooge et al., 1999). The effects on stream flow can be evaluated (Milly and Dunne, 2002) as:
$\Delta {{Q}_{c}}=\frac{\partial Q}{\partial P}\Delta P+\frac{\partial Q}{\partial {{E}_{0}}}\Delta {{E}_{0}}$ (9)
where ΔQc is stream flow variation, ΔP and ΔE0 are precipitation variation and potential evapotranspiration variation, respectively. ∂Q/∂P and ∂Q/∂E0 are runoff sensitive coefficients for precipitation and potential evapotranspiration, which can be calculated as:
$\frac{\partial Q}{\partial P}=1-F(\Phi )+F(\Phi )\times {F}'(\Phi )$
$\frac{\partial Q}{\partial {{E}_{0}}}=-{F}'(\Phi )$ (10)

4.3 SIMHYD Model simulation

The SIMHYD model has been successfully applied in over 300 semi-arid and semi-humid catchments in Australia and America, and also been shown to be an effective method for simulating hydrological processes in China (Wang et al., 2008; Vaze and Teng, 2011; Liang et al., 2013). It is a lumped conceptual hydrological model with daily scale, which requires daily rainfall (P) and regional mean potential evapotranspiration (E0) data to estimate stream flow.
In the SIMHYD model, rainfall fills the interception store first and then becomes excess runoff after the infiltration process. Excess rainfall could be converted into saturation excess runoff, groundwater stores and soil moisture stores. Thus, stream flow would be composed of infiltration excess runoff, saturation excess runoff and base flow (generated by groundwater stores). More information about the model structure and algorithms can be found in Chiew et al.’s studies (Chiew et al., 2002, 2009).
For the observed data in the study, the Nash-Sutcliffe Efficiency Coefficient (NSE) of stream flow can be applied to evaluate the SIMHYD model (Nash and Sutcliffe, 1970). Another fitting test index can be used to calculate the Water Balance Error (WBE) (Liang et al., 2013). NSE and WBE can be expressed mathematically as:
$NSE=1-\frac{\sum\limits_{i=1}^{n}{{{\left( {{Q}_{o,i}}-{{Q}_{s,i}} \right)}^{2}}}}{\sum\limits_{i=1}^{n}{{{\left( {{Q}_{o,i}}-\overline{{{Q}_{o}}} \right)}^{2}}}}$ (11)
where Qo,i is the observed stream flow and Qs,i is the simulated stream flow. $\overline{{{Q}_{o}}}$ is the mean observed stream flow. Then the model can be optimized while maximizing the NSE and minimizing the WEB as much as possible.

5 Results

5.1 Catastrophe point determination

The moving t-test was applied to identify catastrophe points and changing stream flow trends in this study. Figure 2 shows that by setting given constants n1=n2=10, two catastrophe points for the observed mean annual stream flow can be estimated for the years 1985 and 2000, with a level of significance of 0.01 (P<0.01). But when the constants were set to be n1=n2=5 in the test, there was no change point during the 1961 to 2011 time period at the same level of significance (P <0.01).
Figure 2 Moving t-test of mean annual observed stream flow from 1961 to 2011 (n1=n2=10)
Because there was no significant result when n1=n2=5 was set, another method was applied to identify catastrophe points in the stream flow trend. Prior studies suggested that the Mann-Kendall method could complement the results from the moving t-test (Fu and Wang, 1992; Liang, 2008). First, the year 2000, identified by the moving t-test, was accepted as the stage divide point. The time series in this study was divided into two periods (i.e. 1961-2000 and 2001-2011). During the period 1961-2000, the M-K test showed that the catastrophe point was the year 1985 at a typical significance level of 0.05 (P<0.05); a significant upward trend was also confirmed (Figure 3a). Therefore, it is clear that the year 1985 could be considered as a catastrophe point in the stream flow trend between 1961 and 2000 in the Taoer River Basin.
Figure 3 Mann-Kendall test of mean annual observed stream flow from 1961 to 2000 (a) and from 1986 to 2011 (b)
The year 1985, identified by the moving t-test, was accepted as a breakpoint in the study time series. The time series was divided into two periods (i.e. 1961-1985 and 1986-2011). During the period 1986-2011, the M-K test showed that the catastrophe point was 1996 (P<0.05) with a significant downward trend (Figure 3b). But the observed stream flows from 1997 to 2000 were much higher than the following years. The features of stream flow were obviously different after the year 2000. If the change point had been chosen to be 1996, the features of the observed stream flow during the last period would have been confused. Compared with the results from the moving t-test, it is more reasonable to confirm the second catastrophe point as the year 2000.
According to the results of above analysis, the study time series can be divided into three sub-periods: Period I (1961-1985) (i.e. the natural benchmark period), Period II (1986-2000) (i.e. the first variation period), and Period III (2001-2011) (i.e. the second variation period).

5.2 Changes in stream flow and precipitation

The annual observed stream flow and variation trend from 1961 to 2011 is shown in Figure 4. The driest period took place between 2002 and 2004, during which time the observed stream flow could not be measured and the river had zero flow. The most humid year was 1998, when a severe flood occurred in the entire Songhua River Basin and the annual stream flow soared to a high level of 223.38 mm.
Figure 4 Variation of mean annual observed stream flow (Q) and variation of annual precipitation (P) in Taoer River Basin from 1961 to 2011 (The mean values of each period are represented by horizontal dotted lines.)
According to Figure 4, the mean annual stream flow in Period I was 31.54 mm, increasing to 65.60 mm from in Period II and then decreasing to 2.92 mm in Period III. Compared with Period I, the mean annual stream flow increased about 34.06 mm in Period II and then decreased about 28.62 mm in Period III. The relative variation between Periods I and II was about 107.99% and -90.74% between Periods I and III. Variations in mean annual precipitation were also noted, with the mean annual precipitation in Period I at 398.42 mm, increasing to 446.55 mm in the second period and then decreasing to 370.97 mm in the last period. Compared with Period I, the relative variation was about 12.08% in Period II and -6.89%, in Period III.

5.3 Effects of climate variability and human activities

(1) Evaluation of stream flow variation using the runoff sensitive coefficients
Calculated by Equations (8) and (10), the result of the runoff sensitive coefficients ∂Q/∂P and ∂Q/∂E0 were 0.313 and -0.221, respectively. According to Equation (9), it indicated that every 100 mm increase in precipitation (P) would result in a 31.3 mm increase in stream flow, while every 100 mm increase in potential evapotranspiration (E0) would result in a 22.1 mm decrease in stream flow. Table 2 shows that an increase of 48.13 mm in P during Period II (1986-2000) could lead to a 15.06 mm increase in stream flow, while a 3.53 mm increase in E0 could lead to a 0.78 mm decrease in stream flow. Therefore, the effects of climatic variation resulted in an increase of 14.28 mm for annual stream flow (i.e. ΔQC), accounting for 41.93% of the total increase. The other 58.07% of increase in mean annual observed stream flow should be attributed to human activities. Similarly, in Period III (2001-2011), a decrease of 27.45 mm in P could lead to a 8.59 mm decrease in stream flow, while a 16.99 mm increase in E0 could lead to a decrease of 3.76 mm in stream flow, accounting for a total decrease of 43.15% in annual observed stream flow. Human activities contributed to a decrease of 56.85% in stream flow during that period. Therefore, the effects of human activities on stream flow contributed about 15% more than climate variability. Human activities and climate variability could both be considered as primary factors in the variation in stream flow.
Table 2 Effects of climate variability and human activities on stream flow in the Taoer River estimated by runoff sensitive coefficients*
Period Q (mm) ΔQ (mm) ΔP (mm) ΔE0 (mm) ΔQC ΔQH
(mm) % (mm) %
I 31.54 - - - - - -
II 65.60 34.06 48.13 3.53 14.28 41.93 19.78 58.07
III 2.92 -28.62 -27.45 16.99 -12.35 -43.14 -16.27 -56.86

* Periods I, II and III refer to the sub-periods of 1961-1985, 1986-2000, and 2001-2011, respectively. Q is the mean annual observed stream flow, ΔQ is the variation in annual stream flow between Periods II/III and Period I. ΔP and ΔE0 indicate variations of mean annual precipitation and mean annual potential evapotranspiration, respectively. ΔQC and ΔQH are the variations of stream flow affected by climate variability and human activities, respectively.

(2) Evaluation of stream flow variation using the SIMHYD Model
The steps for modelling daily hydrological processes with the SIMHYD Model can be divided into the calibration stage and the simulation stage. First, the model was calibrated and validated for the natural benchmark period, which was divided into a warm-up period, a calibration period and a validation period. Second, the calibrated SIMHYD model with same model parameters as the natural benchmark period was applied to simulate stream flow for the variation periods. The results for each period represented the effects of indirect human activities.
For this study, the model was applied for Period I as the “natural benchmark period”, in which the years of 1961-1963, 1964-1970, and 1971-1985 were used to represent the warm-up period, calibration period and validation period, respectively. Figure 5 shows the simulated and observed stream flows for Period I. After adjusting the model several times, the optimum stage of the model finally emerged. The NSE and WBE for the model were calculated as 0.736 and -2.36% during the validation period, respectively, while the results were 0.796 and 6.89% during the validation period, respectively. Then the data in Periods II and III were simulated in the calibrated SIMHYD model to calculate the stream flow for each period. Figure 6 shows the simulated and observed stream flows from 1961 to 2011.
Figure 5 Simulated and observed stream flow during 1961-1985 in the Taoer River (at the monthly time scale)
Figure 6 Simulated and observed mean annual stream flows during 1961-2011 in the Taoer River
The simulated stream flows were 32.48 mm, 46.48 mm and 19.80 mm for Periods I, II, and III, respectively (Table 3). Compared with Period I, the effects of climate variability on stream flow (ΔQC) and the effects of human activities in stream flow (ΔQH) were 16.44 mm and 17.62 mm in Period II. The contribution of ΔQC and ΔQH were 42.57% and 57.43%,respectively. In Period III, ΔQC and ΔQH were -12.68 mm and -15.94 mm, which meant climate variability resulted in a decrease of 44.30% in stream flow, while human activities contributed to a decrease of 55.70% in stream flow.
Table 3 Effects of climate variability and human activities on stream flow in the Taoer River estimated using the SIMHYD model*
Period Q (mm) ΔQ (mm) QS (mm) ΔQC ΔQH
(mm) % (mm) %
I 31.54 - 32.48 - - - -
II 65.60 34.06 46.98 14.50 42.57 20.06 57.43
III 2.92 -28.62 19.80 -12.68 -44.30 -15.94 -55.70

* Periods I, II and III refer to sub-periods of 1961-1985, 1986-2000, and 2001-2011, respectively. Q is the mean annual observed stream flow, Qs is the mean simulated annual stream flow and ΔQ is the variation of annual stream flow in Periods II and III compared with Period I. ΔQC and ΔQH are the stream flow variations influenced by climate variability and human activities, respectively.

6 Discussion

6.1 Comparative analysis of the two methods for evaluating stream flow

In this study, the effects of climate variability and human activities on stream flow were distinguished by two different methods. The runoff sensitive coefficient method was a statistical method that should be executed at yearly timescales only. The SIMHYD model was a physical model method in which the hydrological processes could be simulated using daily or monthly scale data. However, the results of the two methods for estimating the effects of climate variability and human activities on stream flow variation were quite similar. The effect of climate variability was 14.28 mm using the runoff sensitive coefficient method for Period II (1986-2000), and it was 16.44 mm when simulated by the SIMHYD model. In Period III (2001-2011), using the runoff sensitive coefficient method, the effect of climate variability on stream flow was -12.35 mm. When simulated by the SIMHYD model, the result was -11.74 mm. The two methods above had similar results, suggesting that the estimation techniques used in this study are credible.

6.2 Human activities

Human activities can refer to land use change, water conservation measures and other human activities. In the 20th century, land use and land cover has changed significantly, and the effects of land salinization and desertification are severe. Wetland degradation and deterioration of the regional water environment have become increasingly prominent (Liang, 2008). One of the worst salinization areas in China is distributed throughout the eastern part of the Taoer River Basin, which accounts for about 40% of the whole basin (Zhang and Lin, 1999; Liang et al., 2010). Therefore, in the most recent decade under national policy interventions, many alkali-saline areas and upland fields have been converted into paddy fields. The paddy fields that had accounted for 0.7% of the total basin in the 1970s and 2.7% in 2000, increased to about 6% of the total basin.
In addition, water conservation measures, water intake and other water consumption activities could directly affect basin stream flow characteristics. Establishing an effective and reliable method to identify the direct and indirect effects of human activities should be the next step in our studies.

6.3 Uncertainties

There are many uncertainties that are derived from using these two different methods in this study. Firstly, in estimating the stream flow effects of climate variability with the runoff sensitive coefficient method, the timescale was yearly and could not be analyzed at a shorter timescales (i.e. daily or monthly). However, the relationship between precipitation and runoff is very intricate and cannot be considered to be the same process even during different months of one year. In this case, it could cause some uncertainties in the estimation results. Secondly, when estimating the effects of climate variability by the hydrological model method (SIMHYD), the result was also influenced by parameter uncertainties within the model. The WBE of the model in simulating the variations of stream flow for the calibration and validation periods was about -2.36% and 6.89%, respectively, a conscious error in the study. But when compared with the variations due to climate variability and human activities, it is a much smaller factor for the total variability. The estimated results of the two methods were also similar to each other. Therefore, these conclusions should not be disregarded because of uncertainties in the simulation. Lastly, climate variability and human activities were expected to evolve independently of the two methods in this study. However, they were not totally independent. In fact, many human activities at large scales, such as land use/cover change, would have had large changes on the underlying surface of the basin. Those activities could affect the impact of the study area’s local climate on evaporation and runoff processes. The contribution of the underlying surface variation on evaporation and runoff processes should be further studied to distinguish between the effects of climate variability and human activities more clearly.

7 Conclusions

This study examined stream flow variation of the Taoer River from 1961 to 2011. A summary of the results is as follows: 1) Statistical tests showed that the years 1985 and 2000 could be two typical catastrophe points in the study period for mean observed stream flow. Thus the study period can be identified into three sub-periods between 1961 and 2011. 2) Mean annual observed stream flow was 31.54 mm in Period I (1961-1985), which increased to 65.60 mm in Period II (1986-2000) and decreased to 2.92 mm in Period III (2001-2011). 3) The results of the runoff sensitive coefficients method indicated that climate variability contributed 41.93% of the increase in stream flow during Period II and 43.14% of the decrease in Period III, while human activities contributed 58.07% and 56.86% of the increase during Period II and decrease in Period III, respectively. 4) When simulated using the SIMHYD model, climate variability accounted for 42.57% of the decrease in stream flow in Period II and 44.30% in Period III, while human activities were responsible for 57.43% and 55.70% of decreases during Periods II and III, respectively. 5) Compared with the results from the runoff sensitive coefficients method and the SIMHYD model method, the contribution of human activities was about 15% higher than that of climate variability in both methods. This suggests that human activities could be considered to be primary factors when it comes to stream flow variation.

The authors have declared that no competing interests exist.

[1]
Allen R G, Pereira L S, Raes D et al., 1998. Crop Evapotranspiration-Guidelines for computing crop water requirements-FAO Irrigation and Drainage Paper 56. FAO, Rome 300(9): D05109.Page 1. AB.W 1 Crop evapotranspiration - Guidelines for computing crop water requirements -FAO Irrigation and drainage paper 56 By Richard G. Allen Utah State University Logan, Utah,USA Luis S. Pereira Instituto Superior de Agronomia Lisbon, Portugal

[2]
Arnell N W, Reynard N S, 1996. The effects of climate change due to global warming on river flows in Great Britain.Journal of Hydrology, 183(3/4): 397-424.Global warming due to an increasing concentration of greenhouse gases in the atmosphere will affect temperature and rainfall, and hence river flows and water resources. This paper presents results from an investigation into potential changes in river flows in 21 catchments in Great Britain, using a daily rainfall-runoff model and both equilibrium and transient climate change scenarios. Annual runoff was simulated to increase by 2050 by over 20% in the wettest scenarios and decline by over 20% in the driest scenarios - and different catchments respond differently to the same change scenario. Monthly flows change by a greater percentage than annual flows, and under all the scenarios considered there would be a greater concentration of flow in winter. Snowfall, and hence snowmelt, would be almost entirely eliminated. Progressive changes in river flows over the next few decades would be small compared with year-to-year variability, but would be noticeable on a decade-to-decade basis.

DOI

[3]
Batisani N, 2011. Spatio-temporal ephemeral streamflow as influenced by climate variability in Botswana.Journal of Geographical Sciences, 21(3): 417-428.The fourth assessment report of the IPCC highlights that the global average surface temperature is projected to increase by 1.8 to 4.0 C by the year 2100 compared to current climate. Given that climate is the most important driver of the hydrological cycle, the rise in temperature could cause changes in occurrence patterns of extreme hydrologic events like streamflow droughts. An increase in frequency and severity of these events could pose serious challenges for sustainable management of water resources particular in arid regions. However, the understanding of water resources dynamics and the possible impacts of climate change on these dynamics is hindered by uncertainties in climate change models and complex hydrological responses of streams and catchments to climatic changes. Therefore observational evidence of streamflow dynamics at the local scale could play a crucial role in addressing these uncertainties and achieving a fuller reconciliation between model-based scenarios and ground truth. This paper determines spatial and temporal changes in streamflow volumes and their association with climatic factors based on the non-parametric Mann-Kendall test and ANOVA to determine possible changes in streamflow over the years and their relation to climatic factors. Streamflow is generally stochastic highlighting the importance of factoring in temporal flow variability in water resources planning. There is no clear evidence that changes in climatic variables are related to streamflow behaviour.

DOI

[4]
Birsan M V, Molnar P, Burlando P et al., 2005. Streamflow trends in Switzerland.Journal of Hydrology, 314(1): 312-329.Mean daily streamflow records from 48 watersheds in Switzerland with an undisturbed runoff regime are analysed for trends with the Mann–Kendall nonparametric test in three study periods (1931–2000, 1961–2000, 1971–2000). The statistical significance of trends is tested for each station on an annual and seasonal basis and for different streamflow quantiles. The field significance of trends is tested by a bootstrap procedure. Identified trends in streamflow are examined together with changes in precipitation and air temperature, and correlated with watershed attributes. Complex changes in the streamflow regime in Switzerland especially in the more recent periods are demonstrated. The main identified trends are an increase in annual runoff due to increases in the winter, spring and autumn season runoff, an increase in winter maximum streamflow (at more than 60% of the stations) and an increase in spring and autumn moderate and low flows. The behaviour in the summer period is different, with both upward and downward trends present in moderate and low flow quantiles. Many of the trends are field significant. Changes in precipitation are not sufficient to explain the observed trends in streamflow. Air temperature, most notably a substantial increase in the number of days with minimum daily temperature above 002°C, may explain some of the observed increases in winter and spring season runoff. Correlation analyses reveal a strong relationship between streamflow trends and mean basin elevation, glacier and rock coverage (positive), and basin mean soil depth (negative). These relationships suggest that the most vulnerable environments from the point of view of streamflow change are mountain basins.

DOI

[5]
Brath A, Montanari A, Moretti G, 2006. Assessing the effect on flood frequency of land use change via hydrological simulation (with uncertainty).Journal of Hydrology, 324(1): 141-153.The present work aims to assess the effects that land use change, which have affected a wide portion of Italy in the second part of the last century, have induced on the flood frequency regime. The analysis has been carried out by applying a spatially distributed rainfall unoff model to generate synthetic river flow series. Reference is made to different historical land use scenarios of the Samoggia River basin (178 km 2 in area), located in the Apennines mountains (Italy). The man induced extensive land use changes, which have affected the drainage basin during the last decades, have been assessed by using land use maps which refer to the years 1955, 1980 and 1992. By simulating the Samoggia River flood flows for the different land use scenarios, the variations of the peak flow regime, due to the increasing human activity, have been investigated. Finally, these variations have been compared with the magnitude of the simulation uncertainty. The results indicate that the sensitivity of the floods regime to land use change decreases for increasing return period of the simulated peak flow. By considering peak flows with return period ranging from 10 to 200 years, the effects of human activity seem to be noteworthy. However, these results are to be interpreted cautiously, in light of the uncertainty that affects hydrological simulation studies.

DOI

[6]
Bosch J M, Hewlett J D, 1982. A review of catchment experiments to determine the effect of vegetation changes on water yield and evapotranspiration.Journal of Hydrology, 55(1): 3-23.This summary and review of 94 catchment experiments shows that accumulated information on the effect of vegetation changes on water yield can be used for practical purposes. The direction of change in water yield following forest operations can be predicted with fair accuracy since no experiments, with the exception of perhaps one, have resulted in reductions in water yield with reductions in cover, or increases in yield, with increases in cover. The approximate magnitude of changes can also be estimated. Pine and eucalypt forest types cause on average 40-mm change in water yield per 10% change in cover and deciduous hardwood and scrub 25 and 10 mm, respectively. Maximum changes of 660 mm were experienced at Coweeta, North Carolina. An assimilation of the collective experimental results shows that more careful design and expansion of experiments to certain rainfall regions would augment statistical inference.

DOI

[7]
Brutsaert W, Parlange M B, 1998. Hydrologic cycle explains the evaporation paradox.Nature 396(6706): 30.The evaporation of water, measured using evaporation pans, has been decreasing in the past few decades over large areas with different climates. The common interpretation is that the trend is related to increasing cloudiness, and that it provides an indication of decreasing potential evaporation and a decreasing terrestrial evaporation component in the hydrologic cycle. Here we show that, although these studies are valuable, pan evaporation has not been used correctly as an indicator of climate change.

DOI

[8]
Budyko M I, 1974. Climate and Life. San Diego, CA: Academic.

[9]
Calder I R, 1993. Hydrologic effects of land-use change. In: Maidment (ed.), Handbook of Hydrology. New York: McCraw-Hill Inc.

[10]
Chiew F, McMahon T A, 2002. Modelling the impacts of climate change on Australian stream flow.Hydrological Processes, 16(6): 1235-1245.Abstract This paper presents the likely impacts of climate change on runoff, evapotranspiration and soil moisture in the more populated and important agricultural regions of Australia. The impacts are estimated by comparing the water fluxes simulated by a hydrologic model using present climate data and greenhouse-enhanced climate scenarios predicted by general circulation models. The results indicate that changes in rainfall are amplified in runoff. In wet and temperate catchments the percentage change in runoff is about twice the percentage change in rainfall, whereas in ephemeral catchments with low runoff coefficients the percentage change in runoff can be more than four times the percentage change in rainfall. The modelling study estimates that the annual runoffs in catchments on the northeast coast and east coast of Australia could change by 615 to +15% and ±15% respectively by the year 2030. The annual runoff in southeast Australia could decrease by up to 20%, and in Tasmania a ±10% change in runoff by 2030 is possible. The model simulates a decrease in the annual runoff in catchments in the South Australian Gulf of up to 25% by 2030, and a change of 6125% to +10% in the runoff on the southwest coast of Australia. Although there are large uncertainties in these estimates, the results show the potential for climate change to bring about runoff modifications that may require a significant planning response. Copyright 08 2002 John Wiley & Sons, Ltd.

DOI

[11]
Chiew F, Peel M, Western A et al., 2002. Application and testing of the simple rainfall-runoff model SIMHYD. In: Sign V P, Frevert D K (ed.). Mathematical Models of Small Watershed Hydrology and Applications. Littleton: Water Resources Publications, 335-367.This chapter describes the application and testing of the simple conceptual daily rainfall-runoff model SIMHYD on over 300 catchments across Australia with a wide range of climatic and physical characteristics. SIMHYD has seven parameters and estimates stream flow from daily rainfall and areal potential evapotranspiration data. Model calibration and cross-validation studies were carried out to ...

[12]
Chiew F, Teng J, Vaze J et al., 2009. Estimating climate change impact on runoff across southeast Australia: Method, results, and implications of the modeling method. Water Resources Research, 45(10). doi: 10.1029/ 2008WR007338.This paper describes the modeling of climate change impact on runoff across southeast Australia using a conceptual rainfall-runoff model SIMHYD and presents the results and assesses the robustness of the modeling approach. The future climate series is obtained by scaling the historical series, informed by 15 global climate models (GCMs), to reflect a 0.9 C increase in global average surface air temperature, using a daily scaling method that considers changes in the future mean seasonal rainfall and potential evapotranspiration as well as in the daily rainfall distribution. The majority of the modeling results indicate that there will be less runoff in southeast Australia in the future. However, there is considerable uncertainty, with the results ranging from a 17% decrease to a 7% increase in the mean annual runoff averaged across the study area for the 0.9 C global warming. The model assessments indicate that the modeling approach is generally robust and can be used to estimate the climate impact on runoff. The modeled mean annual runoff is generally within 10-20% of the observed runoff. The modeling results for an independent test period are only slightly poorer than the calibration period, indicating that a satisfactorily calibrated rainfall-runoff model can be used to estimate runoff for another climate period. The modeled impact on various runoff characteristics as estimated by two rainfall-runoff models investigated here differ by less than 10%, which is relatively small compared to the range of modeled runoff results using rainfall projections from different GCMs.

DOI

[13]
Chiew F, Whetton P H, McMahon T A et al., 1995. Simulation of the impacts of climate change on runoff and soil moisture in Australian catchments.Journal of Hydrology, 167(1): 121-147.The impacts of climate change on runoff and soil moisture in 28 Australian catchments are simulated using a hydrologic daily rainfall-runoff model. Two methods are used to provide the climate change scenarios. First, a range of arbitrary changes in temperature and precipitation are applied to the calibrated rainfall-runoff model to study the sensitivity of runoff and soil moisture to potential changes in the climate. Second, results from five global climate model (GCM) enhanced greenhouse experiments are analysed to provide regional climate change scenarios to estimate the range of plausible changes in runoff and soil moisture by the years 2030 and 2070. The sensitivity analyses indicate that changes in rainfall are always amplified in runoff with the amplification factor for runoff being higher in drier catchments. The change in rainfall has little effect on the soil moisture in wet catchments but in drier catchments, the percentage change in soil moisture levels can be greater than the percentage change in rainfall. Compared to precipitation, temperature increases alone have negligible impacts on the runoff and soil moisture. The simulations using the GCM scenarios indicate increases in annual runoff of up to 25% by the year 2030 in the wet tropical catchments near the north-east coast of Australia. The GCMs do not agree in the direction of rainfall change in south-east Australia, and the simulations show runoff changes of up to 卤20% by 2030. For Tasmanian catchments, up to 10% increase in runoff is simulated whereas for catchments in the South Australian Gulf, up to 35% decrease in annual runoff is simulated for 2030. Near the western coast of Australia, the simulations show runoff changes of up to 50%. These results show the potential for climate change to bring about runoff modifications that may require a significant planning response. They are also indicative of the fact that hydrological impacts affecting water supply and flood studies may be important in considering the cost and benefits of potential climate change.

DOI

[14]
Costa M H, Botta A, Cardille J A, 2003. Effects of large-scale changes in land cover on the discharge of the Tocantins River, Southeastern Amazonia.Journal of Hydrology, 283(1): 206-217.Studies that relate changes in land cover with changes in river discharge at the small scale (100 km 2 ) usually have not found similar relationships. Here we analyse a 50-year long time series of discharge of a tropical river, the Tocantins River at Porto Nacional (175,360 km 2 ), as well as precipitation over this drainage area, during a period where substantial changes in land cover occurred in the basin (1949–1998). Based on agricultural census data, we estimate that, in 1960, about 30% of the basin was used for agriculture. Previous work indicates that by 1995, agriculture had increased substantially, with about 49% of the basin land used as cropland and pastures. Initially, we compare one period with little changes in land cover (period 1-1949–1968) with another with more intense changes in land cover (period 2-1979–1998). Our analysis indicates that, while precipitation over the basin is not statistically different between period 1 and period 2 ( α =0.05), annual mean discharge in period 2 is 24% greater than in period 1 ( P <0.02), and the high-flow season discharge is greater by 28% ( P <0.01). Further analyses present additional evidence that the change in vegetation cover altered the hydrological response of this region. As the pressure for changes in land cover in that region continue to increase, one can expect important further changes in the hydrological regime of the Tocantins River.

DOI

[15]
Dooge J C, Bruen M, Parmentier B, 1999. A simple model for estimating the sensitivity of runoff to long-term changes in precipitation without a change in vegetation.Advances in Water Resources, 23(2): 153-163.Forecasts of changes in precipitation (P) and potential evaporation (PE) can be applied to hydrologic models calibrated on existing conditions to obtain predictions of changes in runoff. This study describes an alternative approach, which uses a simple soil-moisture accounting model with a small number of independent and physically based parameters to explore the sensitivity of runoff to climate change for three simplified climates. The climate types chosen initially are those for which a piecewise analytical solution can be obtained so that computer programmes involving numerical solutions can be verified before being applied to field data. Sensitivity factors are calculated for the various cases and their relationships with climatic conditions and soil conditions are explored. Breakpoint values were determined for each type of climate studied. These correspond to situations in which the soil becomes momentarily saturated once during the seasonal cycle but does not remain saturated for any finite duration. For humidity ratios greater than the breakpoint, the sensitivity of runoff to precipitation increases abruptly. For the climates studied, the sensitivity factor approaches the value of the soil parameter c as the humidity index approaches zero. The other climates studied exhibit the same sensitivity at this limit. A particular feature of the model is that analytical solutions can be determined in many cases to check and confirn the results of the numerical simulations.

DOI

[16]
Elfert S, Bormann H, 2010. Simulated impact of past and possible future land use changes on the hydrological response of the Northern German lowland ‘Hunte’ catchment.Journal of Hydrology, 383(3): 245-255.Land use is a key factor controlling the hydrological behaviour of catchments. Changing land use therefore can have an important influence on the local hydrological cycle. Validated and process-based hydrological models are suitable tools to quantify the impact of a change in land use on the hydrological processes. In this study, the physically based catchment model WaSiM-ETH (Water Balance Simulation Model) was applied to a mesoscale lowland catchment in northern Germany (Hunte river, 2141 km 2 at gauge Oldenburg). Model calibration and validation showed that WaSiM-ETH well represented the discharge of the main Hunte river while the discharge dynamics of a few lowland tributaries whose catchments are characterised by peaty soils and intense artificial drainage could not be represented. The purpose of this study was twofold; on the one hand to analyse the sensitivity of WaSiM-ETH to changes in land use observed in the decade 1990 2000, and on the other hand to quantify the impact of land use change projected for the future in terms of land use scenarios available to the public. The results showed that WaSiM-ETH is hardly sensitive to the slight changes observed in the last decade of the 20th century. By contrast, water flows simulated by WaSiM-ETH are clearly impacted by agricultural land use scenarios which were developed based on IPCC scenarios. However, the results also show that it is not sufficient to focus on agricultural land use, only. The proposed reduction of agricultural land leaves open the final land cover after land use change, e.g., forest or urban areas. This study demonstrated that WaSiM-ETH was more sensitive to the choice of the final land cover than to the difference in the scenarios (e.g., A1F1 versus B1). Therefore, we recommend to precisely define change in agricultural land use as well as the final land cover in order to estimate the realistic impact of land use change on hydrological behaviour.

DOI

[17]
Fu C B, Wang Q, 1992. The definition and detection of the abrupt climate change.Scientia Atmospherica Sinica, 16(4): 482-493. (in Chinese)This is part of the review on study of abrupt climatic change, addressing mainly the definition of catastrophe and abrupt change of climate, the detecting methods of abrupt changes of various types, such as changes in mean, changes in variability, transit jump and seesaw jump.Finally the Mann-Kendall rank statistical test is applied to detect the abrupt change in 1920's on global scale.

[18]
Hu S, Liu C M, Zheng H X et al., 2012. Assessing the impacts of climate variability and human activities on streamflow in the water source area of Baiyangdian Lake.Journal of Geographical Sciences, 22(5): 895-905.As the largest wetland in the North China Plain, Baiyangdian Lake plays an important role in maintaining water balance and ecological health of NCP. In the past few decades, the decreasing streamflow in Baiyangdian Basin associated with climate variability and human activities has caused a series of water and eco-environmental problems. In this study, we quantified the impacts of climate variability and human activities on streamflow in the water source area of Baiyangdian Lake, based on analyses of hydrologic changes of upper Tanghe catchment from 1960 to 2008. Climate elasticity method and hydrological modeling method were used to distinguish the effects of climate variability and human activities. The results showed that the annual streamflow decreased significantly (P 0.05) by 1.7 mm/a and an abrupt change was identified around the year 1980. The quantification results indicated that climate variations accounted for 38%-40% of decrease in streamflow, while human activities accounted for 60%-62%. Therefore, human activities played a dominant influence in the decline of the streamflow in the water source area of Baiyangdian Lake. To keep the ecosystem health of Baiyangdian Lake, we suggest that minimum eco-water demand and integrated watershed management should be guaranteed in the future.

DOI

[19]
Jiang D J, 2007. Influence of climate change and land use/land cover change on runoff in the middle and upper reaches of Taoerhe River Basin [D]. Beijing: Graduate University of Chinese Academy of Sciences. (in Chinese)

[20]
Jothityangkoon C, Sivapalan M, Farmer D L, 2001. Process controls of water balance variability in a large semi-arid catchment: Downward approach to hydrological model development.Journal of Hydrology, 254(1): 174-198.The process controls on water balance are examined at the annual, monthly and daily scales. A systematic ‘downward’ approach for the formulation of models of appropriate complexity is presented based on an investigation of the climate, soil and vegetation controls on water balance. Starting with a simple model, complexity is added in steps, with the models tested progressively against signatures of runoff variability at each time scale. The inter-annual variability of runoff is the first signature considered, followed by the intra-annual (mean monthly) variation of runoff. The flow duration curve is the third key signature and is used to test predictions of the daily water balance model. These analyses are carried out using observed data from the Collie River Basin in Western Australia. At the annual time scale, a simple water balance model including saturation excess overland flow and evaporation is found adequate, provided spatial variability of soil depths and rainfall are introduced through multiple buckets. At the monthly time scale, additional processes are required—the key process is subsurface runoff, but in our case we also separated total evapotranspiration into bare soil evaporation and transpiration to represent the heterogeneous vegetation cover. At the daily time scale, inclusion of non-linearity in the storage–discharge relationship for subsurface runoff generation was important, and more crucially, the inclusion of a deeper groundwater store to capture prolonged low flows was important. Model predictions were very sensitive to the assumed distribution of soil depths, both within each subcatchment, and between subcatchments on a regional basis. Streamflow routing was important for large catchments to capture high flows. The overall conclusion is that in this semi-arid catchment, spatial variability of soil depths appear to be the most important control on runoff variability at all time and space scales, followed by the spatial variability of climate and vegetation cover.

DOI

[21]
Kang S Z, Su X L, Tong L et al., 2004. The impacts of human activities on the water-land environment of the Shiyang River basin, an arid region in Northwest China.Hydrological Sciences Journal, 49(3): 413-427.

[22]
Kendall M, 1948. Rank Correlation Methods. New York: Hafner Publishing Company.

[23]
Li D F, Tian Y, Liu C M, 2004. Distributed hydrological simulation of the source regions of the Yellow River under environmental changes.Acta Geographica Sinica, 59(4): 565-573. (in Chinese)After dividing the source regions of the Yellow River into 38 sub-basins, the paper made use of the distributed hydrologic model--SWAT model to simulate discharge with validation of the measured yearly and monthly runoff data from the Tangnag Hydrologic Station, and simulation results are satisfactory. Five land-cover scenario models and 24 sets of temperature and precipitation combinations were established to simulate annual runoff and runoff depth under different scenarios. The simulation shows that with the increase of vegetation coverage annual runoff increases and evapotranspiration decreases in the basin. When temperature decreases by 2oC and precipitation increases by 2%, basin runoff increases by 39.69%, which is the largest among all scenarios.

DOI

[24]
Li H B, Luo L F, Wood E F, 2008. Seasonal hydrologic predictions of low-flow conditions over eastern USA during the 2007 drought.Atmospheric Science Letters, 9(2): 61-66.Abstract Top of page Abstract 1.Introduction 2.DMAPS he Princeton hydrologic nowcast and forecast system 3.Analyses of the 2007 hydrologic drought forecasts for Eastern USA 4.Summary Acknowledgements References A seasonal streamflow monitoring and forecasting component is implemented into the Drought Monitoring and Prediction System (Luo and Wood, 2007a ), which supplements the existing soil-moisture-based analysis framework by providing real-time streamflow monitoring and forecasting up to 6 months lead time. Evaluations were conducted over four basins in eastern USA to understand the forecast skill of the system for the extensive hydrologic droughts in 2007. Consistent with the agricultural drought forecasts reported by Luo and Wood ( 2007a ), the streamflow subsystem can forecast low-flow conditions for up to three months in advance, with Brier scores ranging from 0.10 to 0.49. Copyright 2008 Royal Meteorological Society

DOI

[25]
Li L J, Li B, Liang L Q et al., 2010. Effect of climate change and land use on stream flow in the upper and middle reaches of the Taoer River, northeastern China.Forestry Studies in China, 12(3): 107-115. (in Chinese)The upper and middle reaches of the Taoer River,a representative ecologically sensitive area,has experienced great climate change and rapid agricultural and industrial development since 1961.There is therefore an urgent need to evaluate the impact of climate change and human activities on stream flows to serve better the water resource management in this region.The nonparametric Mann-Kendall test and moving t-test were used to identify trends and change points in stream flow,precipitation and potential evapotranspiration data series.A significant upward trend has been found in annual stream flow,with an abrupt change identified in 1985 at the Taonan station which is the station that controls the entire study area.The stream flow data was divided into a baseline period and a period of change.Both Fu and Zhang's functions were employed to evaluate the impacts of variation in climate and human activities on mean annual stream flow,based on precipitation and potential evaporation.Analysis of the increase in mean annual stream flow between the baseline and the period of change indicated that climate change accounted for about 45% of the total increase and human activities were responsible for about 55%.

DOI

[26]
Li L J, Zhang L, Wang H et al., 2007a. Assessing the impact of climate variability and human activities on streamflow from the Wuding River basin in China.Hydrological Process, 21(25): 3485-3491.Abstract Located in the Loess Plateau of China, the Wuding River basin (30 261 km 2 ) contributes significantly to the total sediment yield in the Yellow River. To reduce sediment yield from the catchment, large-scale soil conservation measures have been implemented in the last four decades. These included building terraces and sediment-trapping dams and changing land cover by planting trees and improving pastures. It is important to assess the impact of these measures on the hydrology of the catchment and to provide a scientific basis for future soil conservation planning. The non-parametric Mann–Kendall–Sneyers rank test was employed to detect trends and changes in annual streamflow for the period of 1961 to 1997. Two methods were used to assess the impact of climate variability on mean annual streamflow. The first is based on a framework describing the sensitivity of annual streamflow to precipitation and potential evaporation, and the second relies on relationships between annual streamflow and precipitation. The two methods produced consistent results. A significant downward trend was found for annual streamflow, and an abrupt change occurred in 1972. The reduction in annual streamflow between 1972 and 1997 was 42% compared with the baseline period (1961–1971). Flood-season streamflow showed an even greater reduction of 49%. The streamflow regime of the catchment showed a relative reduction of 31% for most percentile flows, except for low flows, which showed a 57% reduction. The soil conservation measures reduced streamflow variability, leading to more uniform streamflow. It was estimated that the soil conservation measures account for 87% of the total reduction in mean annual streamflow in the period of 1972 to 1997, and the reduction due to changes in precipitation and potential evaporation was 13%. Copyright 08 2007 John Wiley & Sons, Ltd.

DOI

[27]
Li K Y, Coe M T, Ramankutty N et al., 2007b. Modeling the hydrological impact of land-use change in West Africa.Journal of Hydrology, 337(3): 258-268.Numerical simulations of idealized deforestation and overgrazing are performed for the Niger and Lake Chad basins of West Africa with a terrestrial ecosystem model IBIS (integrated biosphere simulator) and an aquatic transport model THMB (terrestrial hydrology model with biogeochemistry). The study reveals how land use changes affect hydrological regimes at the watershed scale. The results show that tropical forests, due to being situated in the regions of highest rainfall and exerting strong influence on evapotranspiration, have a disproportionately large impact on the water balance of the entire basin. Total deforestation (clearcutting) increases the simulated runoff ratio from 0.15 to 0.44, and the annual streamflow by 35鈥65%, depending on location in the basin, although forests occupy only a small portion (<5%) of the total basin area. Complete removal of grassland and savanna, which occupy much greater areas of the basins, result in an increase in simulated annual streamflow by 33 91%. The numerical simulations indicate that the hydrological response to progressive land cover change is non-linear and exhibits a threshold effect. There is no significant impact on the water yield and river discharge when the deforestation (thinning) percentage is below 50% or the overgrazing percentage below 70% for savanna and 80% for grassland areas; however, the water yield is increased dramatically when land cover change exceeds these thresholds. This threshold effect is a combined result of the non-linearity of the separate response of transpiration and soil and canopy evaporation to the imposed land cover changes.

DOI

[28]
Li Z, Liu W Z, Zhang X C et al., 2009. Impacts of land use change and climate variability on hydrology in an agricultural catchment on the Loess Plateau of China.Journal of Hydrology, 377(1): 35-42.Land use and climate are two main factors directly influencing catchment hydrology, and separation of their effects is of great importance for land use planning and water resources management. Using the SWAT (Soil and Water Assessment Tools) model, we assessed the impacts of land use change and climate variability on surface hydrology (runoff, soil water and evapotranspiration) in an agricultural catchment on the Loess Plateau of China. Results indicated that SWAT proved to be a powerful tool to simulate the effect of environmental change on surface hydrology. The Nash–Sutcliffe model efficiency (Ens), Percent bias (PBIAS) and ratio of root mean square error to measured standard deviation (RSR) for annual flow was 0.87, 4.0%, 0.36 during calibration period and 0.87, 2.5%, 0.36 during validation periods, respectively. During 1981–2000, about 4.5% of the catchment area was changed mainly from shrubland and sparse woodland to medium and high grassland, and climate changed to warmer and drier. The integrated effects of the land use change and climate variability decreased runoff, soil water contents and evapotranspiration. Both land use change and climate variability decreased runoff by 9.6% and 95.8%, respectively, and decreased soil water contents by 18.8% and 77.1%. Land use change increased evapotranspiration by 8.0% while climate variability decreased it by 103.0%. The climate variability influenced the surface hydrology more significantly than the land use change in the Heihe catchment during 1981–2000; therefore, the influence of climate variability should be considered and assessed separately when quantifying the hydrological effect of vegetation restoration in the Loess Plateau.

DOI

[29]
Liang K, Liu C M, Liu X M et al., 2013. Impacts of climate variability and human activity on streamflow decrease in a sediment concentrated region in the Middle Yellow River.Stochastic environmental research and risk assessment, 27(7): 1741-1749.The Kuye River is the primary tributary located in the sediment concentrated regions in the Middle Yellow River in China. Significant decrease in streamflow has been observed in the Kuye River. The non-parametric Mann–Kendall test was applied to detect the change in annual streamflow for the period of 1960 to 2006. Mean annual streamflow in the Kuye River was 84.902mm from 1960 to 1979 (period I), while it decreased to 58.202mm from 1980 to 1998 (period II) and 20.502mm from 1999 to 2006 (period III), respectively. The climate elasticity method and the hydrological modeling method were individually employed to assess the impact of climate variability and human activities on the decrease in streamflow. The results showed that climate variability was responsible for 29.6 and 27.102% of the streamflow decrease from the climate elasticity method and the hydrological modeling method, respectively; while human activities accounted for 70.4 and 72.902% of the streamflow decrease in period II. In period III, climate variability contributed 40.9 and 39.302% of the streamflow decrease from the climate elasticity method and the hydrological modeling method, respectively; while human activities accounted for 59.1 and 60.702% of the streamflow decrease. Therefore, human activities were the main reason of the streamflow decrease. Soil conservation measures (planting trees, improving pastures, building terraces and sediment-trapping dams) and coal mining led to the streamflow reduction in the Kuye River.

DOI

[30]
Liang L Q, 2008. Spatial-temporal pattern and evolution mechanism of evapotranspiration in the Taoer River basin [D]. Beijing: Graduate University of Chinese Academy of Sciences. (in Chinese)

[31]
Liang L Q, Li L J, Liu Q, 2010. Temporal variation of reference evapotranspiration during 1961-2005 in the Taoer River basin of Northeast China.Agricultural and Forest Meteorology, 150(2): 298-306.Evapotranspiration is an important flux term in the water cycle that integrates atmospheric demands and surface conditions. Thus, analysis of the temporal variation of reference evapotranspiration (ET 0 ) will help us to understand climate change and its effect on hydrology. In this paper, we present an analysis of the monthly ET 0 at 15 stations during 1961鈥2005 in the Taoer River basin in China, calculated by the FAO Penman onteith method. We derived the growing season and annual total ET 0 time series and using the Mann endall method, moving t test and Morlet wavelet conducted comprehensive time series analysis to characterize significance test, abrupt change and period in the ET 0 data sets. The results present that: (i) in terms of the seasonal cycle, monthly ET 0 reaches its peak in May and growing season ET 0 accounts for 60.7% of annual total. Long term growing season ET 0 fluctuates in accordance with annual ET 0 , both having turning points in 1982 and 1993; (ii) with respect to the long term persistence, the trends for growing season and annual ET 0 show the same spatial patterns: high positive values in the west study area in the upper reach and negative values in the Southeast study area in the lower reach. The spatial distribution of annual tendencies suggests an influence from the altitude and latitude; (iii) for individual station, abrupt changes in annual ET 0 are more pronounced than those in growing season ET 0 . The timings for the abrupt changes in ET 0 series at individual stations are consistent with those in regional ET 0 . Abrupt changes detected in the early 1980s are all increasing changes, while those in earlier 1990 are all decreasing changes; and (iv) based on the Morlet wavelet analysis, there exist significant periods of 1, 3 and 7.3 years in annual ET 0 series and significant 1 year period and 7.3 years period in growing season ET 0 series. Maximum air temperature, mean air temperature, relative humidity and bright sunshine hours are main climate variables responsible for the periodicity in ET 0 .

DOI

[32]
Liu Q, Yang Z, Cui B, 2008. Spatial and temporal variability of annual precipitation during 1961-2006 in Yellow River Basin, China.Journal of Hydrology, 361(3): 330-338.The Shannon Entropy method, Mann–Kendall method (M–K method) and linear fitted model were applied in this study to investigate the spatial and temporal patterns of trends of the precipitation in the Yellow River Basin (YRB) during 1960–2006. Results indicated that the precipitation possessed longitude zonality and had no clearly linear relationship with the latitude, it showed a decreasing trend in most of the precipitation stations, only two meteorological stations displayed upward trend in the YRB. The abrupt changes revealed by the M–K method mainly occurred to the south of 3802°N in the middle-lower reaches of the YRB. Furthermore, the abrupt changes occurred in the period ranged from 1963 to 1998 and the abrupt changes in the lower reaches appeared earlier than those in the middle and upper reaches of the YRB.

DOI

[33]
Luan Z Q, Zhang G X, Deng W et al., 2007. Studies on changes of air temperature and precipitation for last 50 years in Songnen Plain.Chinese Journal of Agrometeorology, 28(4): 355-358. (in Chinese)Based on the monthly data of air temperature and precipitation in the last 50 years from meteorological stations in the Songnen Plain, the climate variations and tendencies of the Songnen Plain were analysed by calculating climate trend coefficient and climate tendency ratio. The results showed that the annual mean air temperature increased by 0.3487℃ each ten year in the Songnen Plain in the last 50 years. The monthly air temperature showed an increased trend. The strong increase of air temperature in the winter and spring was observed by 0.5754℃ each ten year, while the air temperature in summer and autumn increased by 0.1868℃ each ten year as well. As the increase of the air temperature in the cold season was higher than that in the hot season, the year air temperature differences decreased. The temperature increase showed a regional difference. The tendency ratio of air temperature was highest with0.45℃ each ten year in the Northwest of the Plain, while it was the lowest with0.2℃ each ten year in the East of the Plain. The changes of the precipitation in the Songnen Plain were not significant, but with a weak decreased tendency. The tendency ratio of the yearly mean precipitation was -0.0783 mm each ten year. The decrease of precipitation in autumn was more obvious than that in other seasons.

DOI

[34]
Ma C K, Sun L, Liu S Y et al., 2015. Impact of climate change on the streamflow in the glacierized Chu River Basin, Central Asia.Journal of Arid Land, 7(4): 501-513.

DOI

[35]
Mann H B, 1945. Nonparametric tests against trend. Econometrica:Journal of the Econometric Society, 13: 245-259.

DOI

[36]
Marengo J A, Tomasella J, Uvo C R, 1998. Trends in streamflow and rainfall in tropical South America: Amazonia, eastern Brazil, and northwestern Peru.Journal of Geophysical Research, 103(D2): 1775-1783.Long hydrological records, from the Amazon Basin, northeastern Brazil, and northwestern Peru spanning most of this century, are examined for trends in rainfall (three wettest months) and runoff (three months of highest flow) or stage, where no rating curves exist. Trends are tested for significance using the Mann-Kendall statistic. In basins where large soil, aquifer, or man-made reservoirs give rise to appreciable over-year storage, flows and water levels may be serially correlated. Where serial correlation exists, the usual statistical tests (linear regression, t-test, and Mann-Kendall) will overestimate the significance of trends, showing significance where none exists. Analysis for trend therefore requires particular care when data are serially correlated, and to avoid misleading results, additional supportive evidence must be sought. For example, rainfall records within the same river basin can be checked for trends; serial correlation in rainfall records, in particular, is less likely to be present, so the validity of any trends in rainfall is less open to question. Strong negative trends were found in flow data from the coast of northern Peru and the S o Francisco River, while positive significant trends were detected in the Parna ba River basin. No significant trends were found in the discharge or stage records from Amazonia, while rainfall in northeastern Brazil shows a slow increase over long periods. In the Parna ba and in some rivers of northern Peru unusually large discharges at the beginning or end of the records seem to account for the direction and significance of trends.

DOI

[37]
Milly P C, Dunne K A, 2002. Macroscale water fluxes 2. Water and energy supply control of their inter-annual variability.Water Resource Research, 38(10): 241-249.Controls on interannual variations in water and energy balances of large river basins (10,000 kmand greater) are evaluated in the framework of the semiempirical relation ?/? = [1 + (?/?)]in which and E, P, and R are basin mean values of annual evaporation, precipitation, and surface net radiation, respectively, expressed as equivalent evaporative water flux, overbars denote long-term means, and is a parameter. Precipitation is interpolated from gauges; evaporation is taken as the difference between precipitation and runoff, with the latter determined from basin discharge measurements and a simple storage-delay model; and radiation is based on a recent analysis in which 8 years of satellite observations were assimilated into radiative transfer models. Objective estimates of precipitation errors are considered; results suggest that past estimates of may have been biased by systematic errors in estimates of precipitation. Under the assumption that the semiempirical relation applies also to annual values, long-term mean observations are sufficient to predict the sensitivity of annual runoff to fluctuations in precipitation or net radiation. Additionally, an apparent sensitivity of runoff to precipitation can be inferred from the observations by linear regression. This apparent sensitivity is generally in good agreement with the predicted sensitivity. In particular, the apparent sensitivity increases with decreasing basin ?/?; however, slightly excessive apparent sensitivity (relative to the prediction) is found in humid basins of the middle latitudes. This finding suggests a negative correlation between precipitation and net radiation: the increase in runoff caused by a positive precipitation anomaly is amplified by an accompanying decrease in surface net radiation, possibly induced by increased cloud cover. The inferred sensitivity of radiation (water flux equivalent) to precipitation is on the order of -0.1. Such a value is supported by independent direct analysis of annual precipitation and radiation data. The fraction of interannual variance in runoff explained by the annual precipitation anomaly (including any correlative influence of net radiation) varies systematically with climatic aridity, approaching unity in humid basins and falling to 40-80% in very arid basins. We conclude that the influence of seasonality of the precipitation anomaly on annual runoff is negligible under humid conditions, though it may be significant under arid conditions.

DOI

[38]
Mitchell J M, Dzerdzeevskii B, Flohn H et al., 1966. Climatic Change, WMO Technical Note, 79. World Meteorological Organization, Geneva.

[39]
Najjar R G, 1999. The water balance of the Susquehanna River Basin and its response to climate change.Journal of Hydrology, 219(1): 7-19.Historical precipitation, temperature and streamflow data for the Susquehanna River Basin (SRB) are analyzed with the objective of developing simple statistical and water balance models of streamflow at the watershed's outlet. Annual streamflow is highly correlated with annual precipitation (r=0.895) and, on a percent basis, changes in annual streamflow (Q04) are about two times greater than changes in annual precipitation (P04). Variations in P04-Q04, interpreted as annual evapotranspiration, are much smaller than variations in P04 and Q04, and are weakly positively correlated with annual mean temperature in accordance with potential evapotranspiration formulae. Streamflow is monotonically related to diagnosed storage of water in the SRB from April through November. Deviations from this trend during winter are interpreted as changes in snowpack, and are in general agreement with climatological snow water equivalent estimates for the basin. A simple, spatially-lumped water balance model of the SRB is developed and shown to capture 99% of the mean annual cycle and 75% of the monthly streamflow from 1900 to 1987. Two "downscaled" predictions of precipitation and one of temperature for a doubling of atmospheric COare used as inputs to the statistical and water balance models of the SRB. The result is an annual streamflow increase of 24±13% (11.8±6.7 cm).

DOI

[40]
Nash JE, Sutcliffe J, 1970. River flow forecasting through conceptual models (Part I): A discussion of principles.Journal of Hydrology, 10(3): 282-290.The principles governing the application of the conceptual model technique to river flow forecasting are discussed. The necessity for a systematic approach to the development and testing of the model is explained and some preliminary ideas suggested.

DOI

[41]
Ren G Y, Wu H, Chen Z H, 2000. Spatial patterns of change trend in rainfall of China.Quarterly Journal of Applied Meteorology, 11(3): 322-330. (in Chinese)WT5BZ]By using surface data from 1951 to 1996, the long term change trend index of annual and seasonal precipitation of China is calculated. The results show that total annual and summer precipitation over the middle and lower reaches of the Yangtze River increased during the 46 years, and a detectable decline trend in precipitation is found over the Yellow River basin, especially for Shandong and Liaoning provinces.In the high latitude areas such as Xinjiang, Inner Mongolia and North China,however, the change trend in rainfall is not obvious. It is also found that seasonal drift in precipitation occurred in some regions in the period. Rainfall during spring and autumn has significantly decreased over the upper and middle reaches of the Yellow River and the middle reach of the Yangtze River, and increased relatively in spring in eastern Hebei Province, western Liaoning Province and the Horqin Sand Land.[WT5BZ] [WT5HZ]

[42]
Scanlon B R, Jolly I, Sophocleous M et al., 2007. Global impacts of conversion from natural to agricultural ecosystem on water resources: Quantity versus quality. Water Resources Research, 43(3). doi: 10.1029/2006WR005486.Past land use changes have greatly impacted global water resources, with often opposing effects on water quantity and quality. Increases in rain-fed cropland (460%) and pastureland (560%) during the past 300 years from forest and grasslands decreased evapotranspiration and increased recharge (two orders of magnitude) and streamflow (one order of magnitude). However, increased water quantity degraded water quality by mobilization of salts, salinization caused by shallow water tables, and fertilizer leaching into underlying aquifers that discharge to streams. Since the 1950s, irrigated agriculture has expanded globally by 174%, accounting for 90% of global freshwater consumption. Irrigation based on surface water reduced streamflow and raised water tables resulting in waterlogging in many areas (China, India, and United States). Marked increases in groundwater-fed irrigation in the last few decades in these areas has lowered water tables ( 1 m/yr) and reduced streamflow. Degradation of water quality in irrigated areas has resulted from processes similar to those in rain-fed agriculture: salt mobilization, salinization in waterlogged areas, and fertilizer leaching. Strategies for remediating water resource problems related to agriculture often have opposing effects on water quantity and quality. Long time lags (decades to centuries) between land use changes and system response (e.g., recharge, streamflow, and water quality), particularly in semiarid regions, mean that the full impact of land use changes has not been realized in many areas and remediation to reverse impacts will also take a long time. Future land use changes should consider potential impacts on water resources, particularly trade-offs between water, salt, and nutrient balances, to develop sustainable water resources to meet human and ecosystem needs.

DOI

[43]
Schulze R E, 2000. Hydrological responses to land use and climate change: A southern African perspective. AMBIO:A Journal of the Human Environment, 29(1): 12-22.Nine hydrological issues relating to land use and climate change are identified from a southern Africa perspective, each illustrated by an example based on field observations or simulation modelling. The nine issues are that (i) southern Africa's hydrological regime is already so variable that climate change will be difficult to detect; (ii) fluctuations in the hydrological regime are amplified by fluctuations in climate; (iii) hydrological responses are highly sensitive to land use changes; (iv) local scale abrupt land use changes may be hydrologically more significant than regional scale gradual changes; (v) land use change frequently exacerbates already variable flow regimes; (vi) detailed spatial information is vital in assessing impacts of critical land uses; (vii) major components of the hydrological system respond very differently to climate change; (viii) in developing countries inter-seasonal climate change may be more important than that at decadal time scale; and (ix) there is need to identify the hydrologically sensitive areas of a region.

DOI

[44]
Serrano A, Mateos V L, Garcia J A, 1999. Trend analysis of monthly precipitation over the Iberian Peninsula for the period 1921-1995. Physics and Chemistry of the Earth, Part B: Hydrology, Oceans and Atmosphere, 24(1): 85-90.No significant global trend was found in the annual total precipitation series. The only trend observed was a downward trend in twenty-one of the forty series of monthly total precipitation only for the month of March.

DOI

[45]
Sneyers R.1975. Sur l’analyse statistique des s’eries d’observations.WMO Tech Note.

[46]
Tang Y, Wang H, Yan D H et al., 2009. Evolutionary regularity of runoff of Nenjiang River Basin in period 1956-2000.Scientia Geographica Sinica, 29(6): 1-12. (in Chinese)This paper analyzed evolutionary features of annual runoff of the Nenjiang River Basin during the 45 years between 1956 and 2000,by applying random hydrologic method.The research indicated that hydrologic cycle of runoff in the basin was 32 years.On the whole,there existed no apparent runoff trend within the 45 years.Furthermore,the paper also studied consumable water usage of the basin,and it showed that the general impact extent of mankind water consumption to basin water cycle was 5%,but it varied greatly within the basin,such as the case of the Tao'er River Basin,rising to as high as 16%,showing greater mankind water consumption there.In terms of annual runoff analysis,impact factor during the 1970s in the whole basin was higher than any other decades,reflecting the fact that mankind water consumption exerted greater impact on water cycle during low flow period.

DOI

[47]
Tomer M D, Schilling K E, 2009. A simple approach to distinguish land-use and climate-change effects on watershed hydrology.Journal of Hydrology, 376(1): 24-33.Impacts of climate change on watershed hydrology are subtle compared to cycles of drought and surplus precipitation (PPT), and difficult to separate from effects of land-use change. In the US Midwest, increasing baseflow has been more attributed to increased annual cropping than climate change. The agricultural changes have led to increased fertilizer use and nutrient losses, contributing to Gulf of Mexico hypoxia. In a 25-yr, small-watershed experiment in Iowa, when annual hydrologic budgets were accrued between droughts, a coupled water-energy budget (ecohydrologic) analysis showed effects of tillage and climate on hydrology could be distinguished. The fraction of PPT discharged increased with conservation tillage and time. However, unsatisfied evaporative demand (PET Hargreaves method) increased under conservation tillage, but decreased with time. A conceptual model was developed and a similar analysis conducted on long-term (>1920s) records from four large, agricultural Midwest watersheds underlain by fine-grained tills. At least three of four watersheds showed decreases in PET, and increases in PPT, discharge, baseflow and PPT:PET ratios ( p < 0.10). An analysis of covariance showed the fraction of precipitation discharged increased, while unsatisfied evaporative demand decreased with time among the four watersheds ( p < 0.001). Within watersheds, agricultural changes were associated with ecohydrologic shifts that affected timing and significance, but not direction, of these trends. Thus, an ecohydrologic concept derived from small-watershed research, when regionally applied, suggests climate change has increased discharge from Midwest watersheds, especially since the 1970s. By inference, climate change has increased susceptibility of nutrients to water transport, exacerbating Gulf of Mexico hypoxia.

DOI

[48]
Vaze J, Teng J, 2011. Future climate and runoff projections across New South Wales, Australia: Results and practical applications.Hydrological Processes, 25(1): 18-35.This paper describes the rainfall–runoff modelling for New South Wales (NSW) and Australian Capital Territory (ACT) under historical climate and the likely changes to runoff around the year 2030 for the Intergovernmental Panel on Climate Change (IPCC) SRES A1B global warming scenario. Results show that the mean annual historical rainfall and runoff, averaged over the entire region, are 516 and 55 mm, respectively. There is considerable uncertainty in the global climate modelling (GCM) of rainfall response in the region to global warming. The majority of GCMs show a decrease in the mean annual rainfall and the median estimate indicates that future mean annual runoff in the region in 652030 relative to 651990 will be lower by 0–20% in the southern parts, no change to a slight reduction in the eastern parts and higher by 0–20% in the northwest corner. Averaged across the entire region, the median estimate is a 5% decrease in the mean annual runoff and the extreme estimates range from a 14% decrease to a 10% increase in mean annual runoff. This is the first comprehensive study on the hydrological impacts of climate change done in NSW that covers the entire state. Outputs from this study are being used to underpin the hydrology for a number of major climate change impact studies that are presently underway across NSW. The results and output datasets from this study will be available through a web interface and they can be used by all state government agencies and industries in NSW to plan for and adapt to the impacts of climate change. Copyright 08 2010 John Wiley & Sons, Ltd.

DOI

[49]
Vorosmarty C J, Green P, Salisbury J et al., 2000. Global water resources: Vulnerability from climate change and population growth.Science, 289(5477): 284-288.

DOI

[50]
Wang D B, Hejazi M, 2011. Quantifying the relative contribution of the climate and direct human impacts on mean annual stream-flow in the contiguous United States. Water Resources Research, 47(10). doi: 10.1029/ 2010wr010283.

[51]
Wang G Q, Zhang J Y, He R M et al., 2008. Runoff reduction due to environmental changes in the Sanchuanhe river basin.International Journal of Sediment Research, 23(2): 174-180.

DOI

[52]
Wang G X, Zhang Y, Liu G M et al., 2006. Impact of land-use change on hydrological processes in the Maying River basin, China. Science in China Series D: Earth Sciences, 49(10): 1098-1110.Since the 1960s, dramatic changes have taken place in land-use patterns characterized by the persistent expansion of cultivated land and a continuous decrease in natural woodland and grassland in the arid inland river basins of China. It is very important to assess the effects of such land-use changes on the hydrological processes so vital for water resource management and sustainable development on the catchment scale. The Maying River catchment, a typical arid inland watershed located in the middle of the Hexi Corridor in northwest China, was the site chosen to investigate the hydrological responses to land-use changes. The annual runoff, base flow, maximum peak flow, and typical seasonal runoff in both spring and autumn flood periods were selected as the variables in the hydrological processes. Statistical-trend analysis and curvilinear regression were utilized to detect the trends in hydrological variables while eliminating the climatic influence. The relationship between cultivated land-use and hydrological variables was analyzed based on four periods of land-use variation data collected since 1965. A runoff model was established composed of two factors, i.e., cultivated land use and precipitation. The impact of land use changes, especially in the large areas of upstream woodland and grassland turned into cultivated lands since 1967, has resulted in a mean annual runoff decrease of 28.12%, a base flow decline of 35.32%, a drop in the maximum peak discharge of 35.77%, and mean discharge decreases in spring and autumn of 36.05% and 24.87% respectively, of which the contribution of cultivated land expansion to the influence of annual runoff amounts to 77% 80%, with the contribution to the influence of spring discharge being 73% 81%, and that to the influence of base flow reaching 62% 65%. Thus, a rational regulation policy of land use patterns is vitally important to the sustainable use of water resources and the proper development of the entire catchment.

DOI

[53]
Wei F Y, 1999. Statistical Techniques of Modern Climatic Diagnosis and Forecasting. Beijing: China Meteorological Press, 63-65. (in Chinese)

[54]
Yates D N, 1996. WatBal: An integrated water balance model for climate impact assessment of river basin runoff.International Journal of Water Resources Development, 12(2): 121-140.ABSTRACT A water balance model combined with the Priestley-Taylor m ethod for computing potential evapotranspiration has been developed as an integrated tool for modelling the response of river basins to potential climate change. The system was designed in the EXCEL 5.0 spreadsheet environment making use of the Visual Basic programming language. The model is sim ple to use and takes advantage of IIASA's mean monthly hydrologic data base (Leemans & Cramer, 1991). The model environment and two case studies are described.

DOI

[55]
Yue S, Wang C Y, 2002. Applicability of prewhitening to eliminate the influence of serial correlation on the Mann-Kendall test. Water Resources Research, 38(6). doi: 10.1029/2001wr000861

[56]
Zhan S L, Yu Y M, 1994. Methods of Calculating Effect of Soil and Water Conservation Measures. Beijing: China Environmental Science Press. (in Chinese)

[57]
Zhang D F, Lin F N, 1999. Study on agricultural eco-geological environment in the Tao’er River Basin.Soil and Environment Sciences, 8(3): 179-183. (in Chinese)This article analyzes the character of agricultural eco-geological environment in Tao'er River basin of Jilin west district; discloses five serious eco-geologicaI environment problems which influence agricultural sustainable development in the river basin; regionalizes eco-geological environment areas according to geology,physiognomy, natural resources, eco-environmental disaster, environment quality and other synthetical factors.In the end, the paper discusses the evolving process and influence factors of agricultural eco-geological environment in the river basin.

[58]
Zhang L, Dawes W R, Walker G R, 2001. The response of mean annual evapotranspiration to vegetation changes at catchment scale.Water Resources Research, 37(3): 701-708.It is now well established that forested catchments have higher evapotranspiration than grassed catchments. Thus land use management and rehabilitation strategies will have an impact on catchment water balance and hence water yield and groundwater recharge. The key controls on evapotranspiration are rainfall interception, net radiation, advection, turbulent transport, leaf area, and plant-available water capacity. The relative importance of these factors depends on climate, soil, and vegetation conditions. Results from over 250 catchments worldwide show that for a given forest cover, there is a good relationship between long-term average evapotranspiration and rainfall. From these observations and on the basis of previous theoretical work a simple two-parameter model was developed that relates mean annual evapotranspiration to rainfall, potential evapotranspiration, and plant-available water capacity. The mean absolute error between modeled and measured evapotranspiration was 42 mm or 6.0%; the least squares line through the origin had as lope of 1.00 and a correlation coefficient of 0.96. The model showed potential for a variety of applications including water yield modeling and recharge estimation. The model is a practical tool that can be readily used for assessing the long-term average effect of vegetation changes on catchment evapotranspiration and is scientifically justifiable.

DOI

[59]
Zhang L, Hickel K, Dawes W R, 2004. A rational function approach for estimating mean annual evapotranspiration.Water Resources Research, 40. doi: 10.1029/2003WR002710.Mean annual evapotranspiration from a catchment is determined largely by precipitation and potential evapotranspiration; characteristics of the catchment (e.g., soil, topography, etc.) play only a secondary role. It has been shown that the ratio of mean annual potential evapotranspiration to precipitation (referred as the index of dryness) can be used to estimate mean annual evapotranspiration by using one additional parameter. This study evaluates the effects of climatic and catchment characteristics on the partitioning of mean annual precipitation into evapotranspiration using a rational function approach, which was developed based on phenomenological considerations. Over 470 catchments worldwide with long-term records of precipitation, potential evapotranspiration, and runoff were considered, and results show that model estimates of mean annual evapotranspiration agree well with observed evapotranspiration taken as the difference between precipitation and runoff. The mean absolute error between modeled and observed evapotranspiration was 54 mm, and the model was able to explain 89% of the variance with a slope of 1.00 through the origin. This indicates that the index of dryness is the most significant variable in determining mean annual evapotranspiration. Results also suggest that forested catchments tend to show higher evapotranspiration than grassed catchments and their evapotranspiration ratio (evapotranspiration divided by precipitation) is most sensitive to changes in catchment characteristics for regions with the index of dryness around 1.0. Additionally, a stepwise regression analysis was performed for over 270 Australian catchments where detailed information of vegetation cover, precipitation characteristics, catchment slopes, and plant available water capacity was available. It is shown that apart from the index of dryness, average storm depth, plant available water capacity, and storm arrival rate are also significant.

DOI

[60]
Zhang J S, Kang E, Lan Y C et al., 2003. Impact of climate change and variability on water resources in Heihe River Basin.Journal of Geographical Sciences, 13(3): 286-292.Studies indicate that the climate has experienced a dramatic change in the Heihe River Basin with scope of temperature rise reaching 0.5–l.l°C in the 1990s compared to the mean value of the period 1960–1990, precipitation increased 18.5 mm in the 1990s compared to the 1950s, and 6.5 mm in the 1990s compared to the mean value of the period 1960–1990, water resources decreased 2.6 × 10 8 m 3 in the 1990s compared to the 1950s, and 0.4 × 10 8 m 3 in the 1990s compared to the mean value of the period 1960–1990. These changes have exerted a greater effect on the local environment and socio-economy, and also made the condition worsening in water resources utilizations in the Heihe Rver Basin.

DOI

[61]
Zhang Q, Xu CY, Tao H, Jiang T et al., 2010. Climate changes and their impacts on water resources in the arid regions: A case study of the Tarim River basin, China.Stochastic Environmental Research and Risk Assessment, 24(3): 349-358.Streamflow series of five hydrological stations were analyzed with aim to indicate variability of water resources in the Tarim River basin. Besides, impacts of climate changes on water resources were investigated by analyzing daily precipitation and temperature data of 23 meteorological stations covering 1960-2005. Some interesting and important results were obtained: (1) the study region is characterized by increasing temperature, however, only temperature in autumn is in significant increasing trend; (2) precipitation changes present different properties. Generally, increasing precipitation can be detected. However, only the precipitation in the Tienshan mountain area is in significant increasing trend. Annual streamflow of major rivers of the Tarim River basin are not in significant trends, except that of the Akesu River which is in significantly increasing trend. Due to the geomorphologic properties of the Tienshan mountain area, precipitation in this area demonstrates significant increasing trend and which in turn leads to increasing streamflow of the Akesu River. Due to the fact that the sources of streamflow of the rivers in the Tarim River basin are precipitation and melting glacial, both increasing precipitation and accelerating melting ice has the potential to cause increasing streamflow. These results are of practical and scientific merits in basin-scale water resource management in the arid regions in China under the changing environment.

DOI

[62]
Zhang S R, Lu X X, 2009. Hydrological responses to precipitation variation and diverse human activities in a mountainous tributary of the lower Xijiang, China.Catena, 77(2): 130-142.Hydrological regimes of river systems have been changing under the impacts of both climate variation and human activities in the global context. The Luodingjiang River, a mountainous tributary of the lower Xijiang in South China, was chosen to investigate the hydrological responses to the precipitation variation and diverse human activities (land use change, water diversion, reservoir construction, and in-channel damming) in this study. Two non-parametric statistical methods, Mann–Kendall and Pettitt test, were employed to detect the long-term changes in the time series of water discharge and sediment load (1959–2002) at the annual, monthly and seasonal scales. Significant increasing changes were detected in the water discharge time series in the dry season. To the contrary, significant decreasing changes were detected in the annual sediment load and sediment load time series in the wet-season. The impacts of precipitation variation and human activities on water discharge and sediment load were discerned and quantified using double mass curve and linear regression methods. By taking the period 1959–1968 as the reference period, the contribution of human activities to the increasing trend of dry-season water discharge in the period 1969–2002 was estimated to be 80%. Because the change of sediment load during the period 1969–2002 was not monotonic with an abrupt change around 1986, the contribution estimations were made for the two periods before and after 1986 respectively. For the period 1969–1985, human activities, particularly deforestation during the period 1981–1985, contributed 43% to the increasing change of sediment load and for the period 1986–2002, the impact of human activities dominated the decreasing change of sediment load with the contribution slightly higher than 100% because of the opposite role of precipitation variation. The operation of reservoirs and hydropower stations is considered to be responsible for the observed increasing trends of water discharge in the dry-season and decreasing trends of sediment load after 1986, and for the latter, reforestation program in the catchment is another contributing factor. The distinct seasonal changing patterns of both water discharge and sediment load in this study highlight the importance of involving monthly or seasonal time series in the change detection in hydrological data.

DOI

[63]
Zhao Y L, 1999. Distribution of Fragile Types of Eco-environment and Their Comprehensive Management in China. Beijing: China Environmental Science Press. (in Chinese)

Outlines

/