
Journal of Geographical Sciences >
Comparative evaluation of geological disaster susceptibility using multi-regression methods and spatial accuracy validation
Author: Jiang Weiguo, PhD, E-mail: jiangweiguo@bnu.edu.cn; caoran_1990@163.com
Received date: 2016-09-08
Accepted date: 2016-10-20
Online published: 2017-04-20
Supported by
National Natural Science Foundation of China, No.41571077, No.41171318
The Fundamental Research Funds for the Central Universities
Copyright
Geological disasters not only cause economic losses and ecological destruction, but also seriously threaten human survival. Selecting an appropriate method to evaluate susceptibility to geological disasters is an important part of geological disaster research. The aims of this study are to explore the accuracy and reliability of multi-regression methods for geological disaster susceptibility evaluation, including Logistic Regression (LR), Spatial Autoregression (SAR), Geographical Weighted Regression (GWR), and Support Vector Regression (SVR), all of which have been widely discussed in the literature. In this study, we selected Yunnan Province of China as the research site and collected data on typical geological disaster events and the associated hazards that occurred within the study area to construct a corresponding index system for geological disaster assessment. Four methods were used to model and evaluate geological disaster susceptibility. The predictive capabilities of the methods were verified using the receiver operating characteristic (ROC) curve and the success rate curve. Lastly, spatial accuracy validation was introduced to improve the results of the evaluation, which was demonstrated by the spatial receiver operating characteristic (SROC) curve and the spatial success rate (SSR) curve. The results suggest that: 1) these methods are all valid with respect to the SROC and SSR curves, and the spatial accuracy validation method improved their modelling results and accuracy, such that the area under the curve (AUC) values of the ROC curves increased by about 3%-13% and the AUC of the success rate curve values increased by 15%-20%; 2) the evaluation accuracies of LR, SAR, GWR, and SVR were 0.8325, 0.8393, 0.8370 and 0.8539, which proved the four statistical regression methods all have good evaluation capability for geological disaster susceptibility evaluation and the evaluation results of SVR are more reasonable than others; 3) according to the evaluation results of SVR, the central-southern Yunnan Province are the highest susceptibility areas and the lowest susceptibility is mainly located in the central and northern parts of the study area.
JIANG Weiguo , RAO Pingzeng , CAO Ran , TANG Zhenghong , CHEN Kun . Comparative evaluation of geological disaster susceptibility using multi-regression methods and spatial accuracy validation[J]. Journal of Geographical Sciences, 2017 , 27(4) : 439 -462 . DOI: 10.1007/s11442-017-1386-4
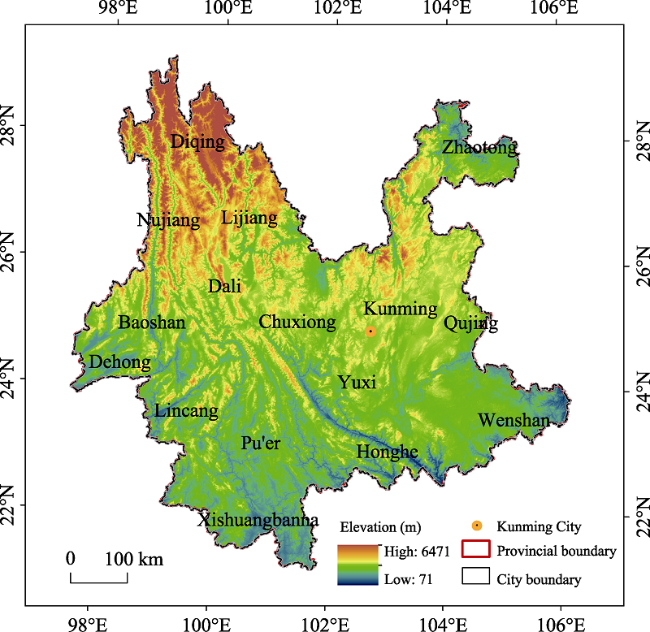
Figure 1 The location of Yunnan Province |
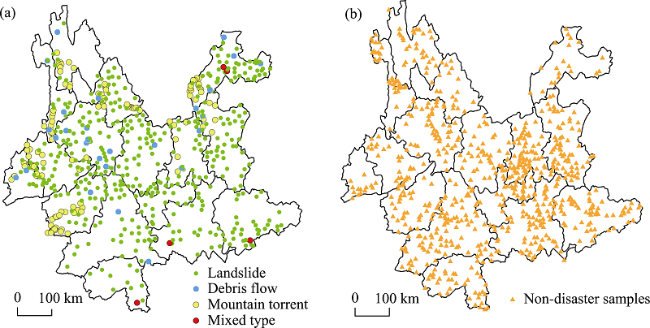
Figure 2 Distribution and types for geological disaster and non-disaster samples |
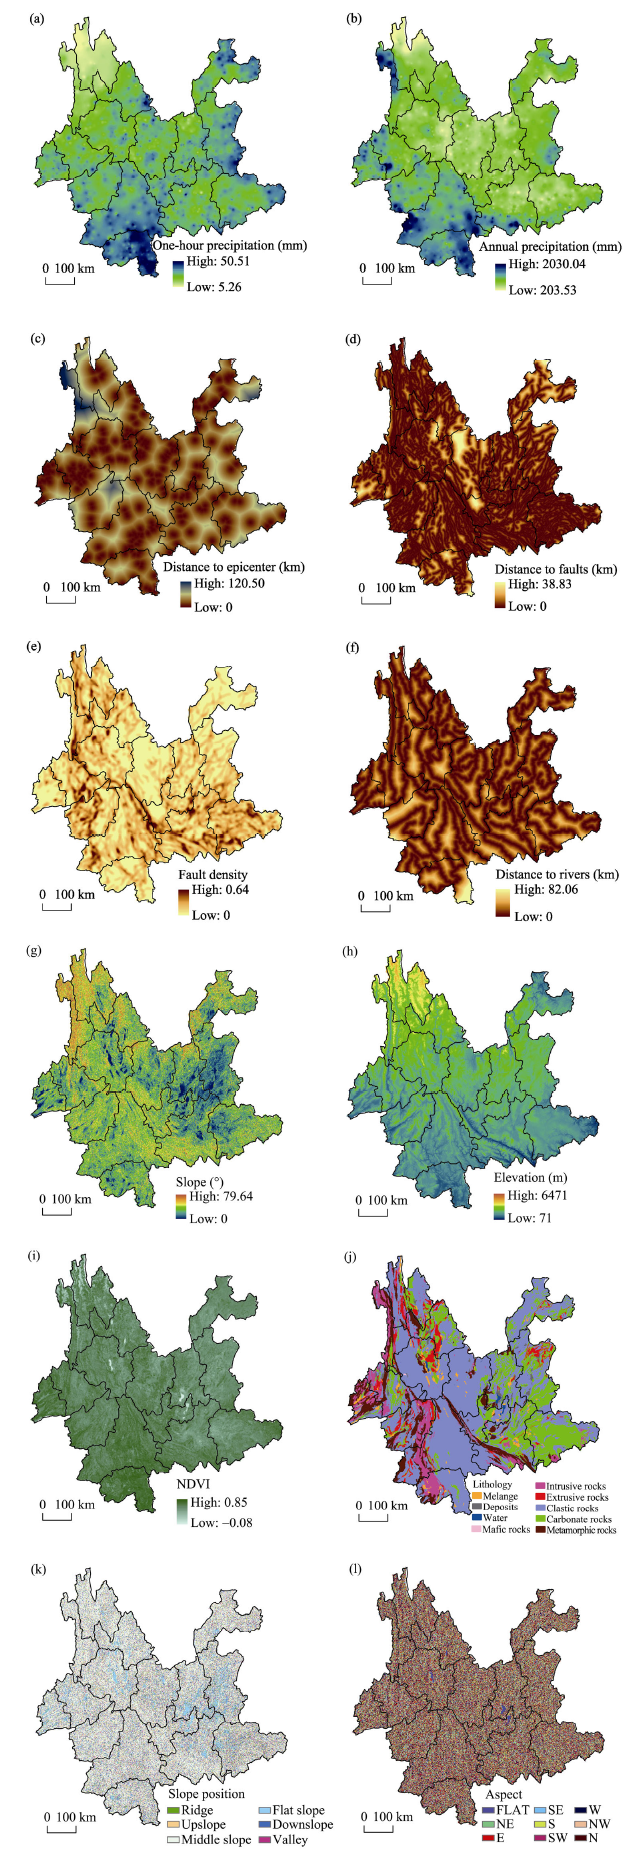
Figure 3 Predisposing factors and formation conditions of geological disaster susceptibility: (a) One-hour precipitation; (b) Annual precipitation; (c) Distance to epicenter; (d) Distance to faults; (e) Fault density; (f) Distance to rivers; (g) Slope; (h) Elevation; (i) NDVI; (j) Lithology; (k) Slope position; (l) Aspect |
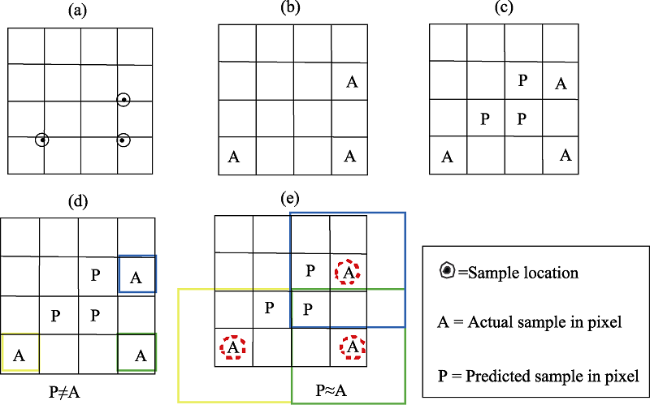
Figure 4 Classification accuracy and spatial accuracy (Shekhar, 2002) |
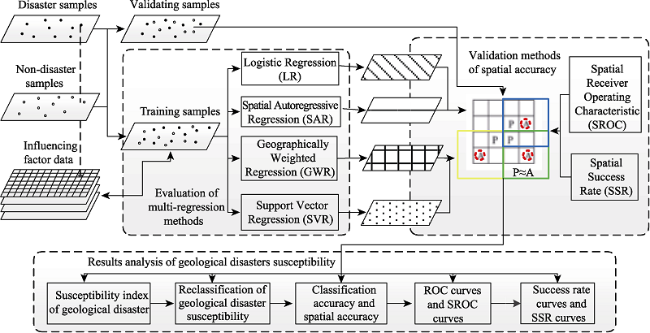
Figure 5 The flowchart of geological disasters susceptibility evaluation |
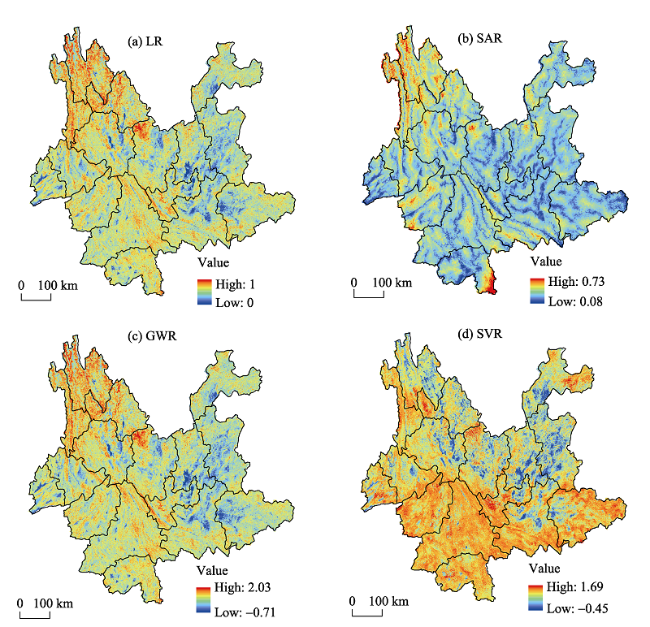
Figure 6 Geological disaster susceptibility index map produced by the multi-regression methods |
Table 1 Characteristics of GDSI for multi-regression methods |
| LR | SAR | GWR | SVR | |
|---|---|---|---|---|
| Minimum | 0 | 0.077 | -0.71 | -0.45 |
| Maximum | 1 | 0.73 | 2.05 | 1.69 |
| Mean | 0.52 | 0.31 | 0.79 | 0.8 |
| Standard deviation | 0.1 | 0.06 | 0.28 | 0.3 |
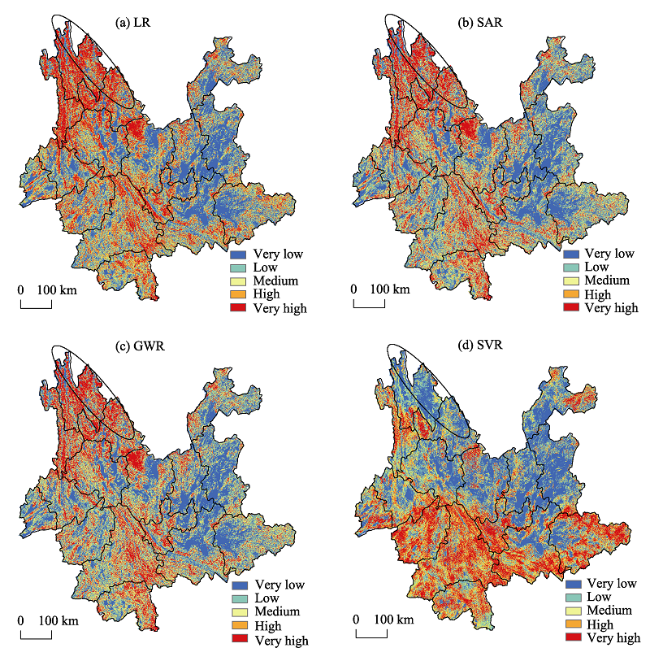
Figure 7 Reclassification of geological disaster susceptibility by the multi-regression methods |
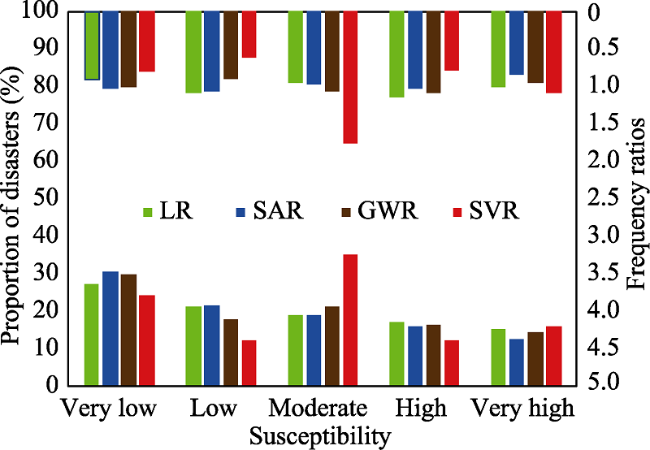
Figure 8 The proportion of disasters and frequency ratios used for validating samples |
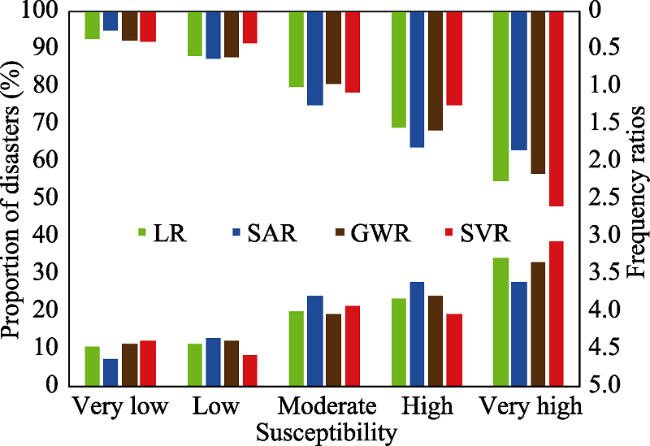
Figure 9 The proportion of disaster samples and frequency ratios introducing spatial a ccuracy validation |
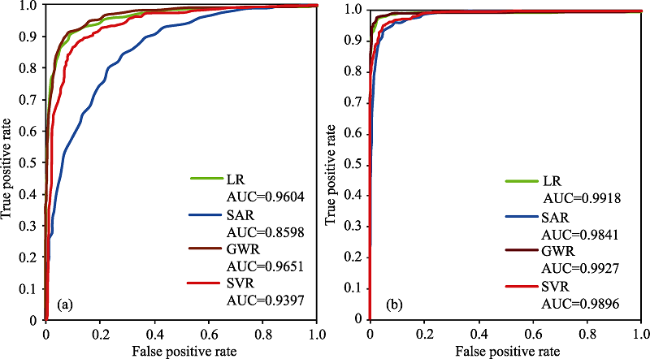
Figure 10 ROC curves of the multi-regression methods: (a) Classification accuracy; (b) Spatial accuracy |
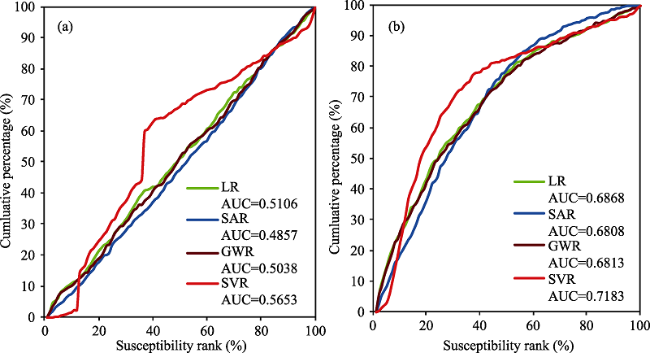
Figure 11 Success rate curves of the multi-regression methods: (a) Classification accuracy; (b) Spatial accuracy |
The authors have declared that no competing interests exist.
| [1] |
|
| [2] |
|
| [3] |
|
| [4] |
|
| [5] |
|
| [6] |
|
| [7] |
|
| [8] |
|
| [9] |
|
| [10] |
|
| [11] |
|
| [12] |
|
| [13] |
|
| [14] |
|
| [15] |
|
| [16] |
|
| [17] |
|
| [18] |
|
| [19] |
|
| [20] |
|
| [21] |
|
| [22] |
|
| [23] |
|
| [24] |
|
| [25] |
|
| [26] |
|
| [27] |
|
| [28] |
|
| [29] |
|
| [30] |
|
| [31] |
|
| [32] |
|
| [33] |
|
| [34] |
|
| [35] |
|
| [36] |
|
| [37] |
|
| [38] |
|
| [39] |
|
| [40] |
|
| [41] |
|
| [42] |
|
| [43] |
|
| [44] |
|
| [45] |
|
| [46] |
|
| [47] |
|
| [48] |
|
| [49] |
|
| [50] |
|
| [51] |
|
| [52] |
|
| [53] |
|
| [54] |
|
| [55] |
|
| [56] |
|
| [57] |
|
| [58] |
|
| [59] |
|
| [60] |
|
| [61] |
|
| [62] |
|
| [63] |
|
| [64] |
|
| [65] |
|
| [66] |
|
| [67] |
|
| [68] |
|
| [69] |
|
| [70] |
|
| [71] |
|
| [72] |
|
| [73] |
|
| [74] |
|
| [75] |
|
/
| 〈 |
|
〉 |