
Journal of Geographical Sciences >
Assessing the progress of desertification of the southern edge of Chihuahuan Desert:A case study of San Luis Potosi Plateau
Author: Cristina Noyola-Medrano (1970-), specialized in natural resource and environmental remote sensing. E-mail: cristina.noyola@uaslp.mx
Received date: 2016-03-18
Accepted date: 2016-05-17
Online published: 2017-04-20
Supported by
Program for Professional Development of Professors (PRODEP) through the convention PROMEP/103.5/ 13/6575
Copyright
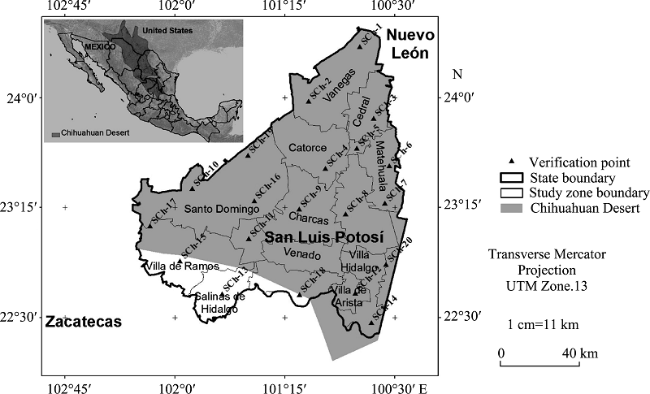
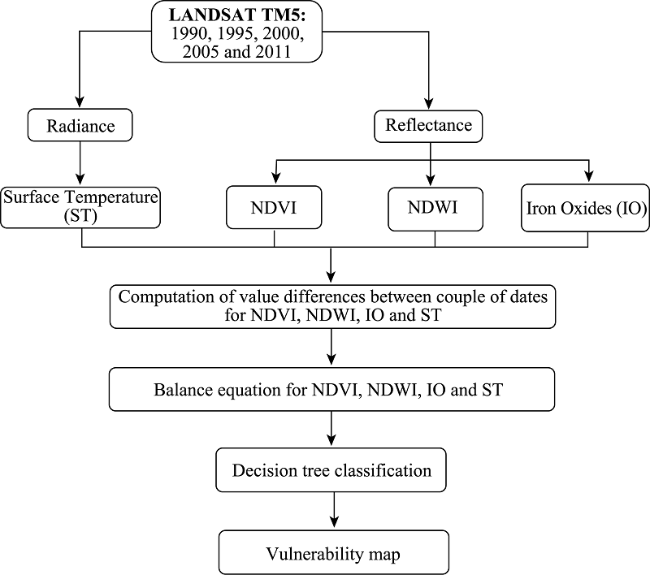
The aim of this study is to establish if the San Luis Potosi Plateau (SLPP), which is part of the southern edge of the Chihuahuan Desert, is generating desertification processes, indicating a progression of the desert toward the central part of Mexico. Therefore, we analyzed the temporal evolution of four environmental indicators of desertification: Normalized Difference Vegetation Index (NDVI), Normalized Difference Water Index (NDWI), Iron Oxides Index (IO) and Surface Temperature (ST). Landsat TM images are used to cover a period from 1990 to 2011. A new equation of total balance is proposed to generate an image of the overall evolution of each factor which is applied to get a probability map of desertification. The evolution of NDVI, NDWI and IO shows a behavior almost stable over the time. In contrast, the ST shows a slight increase. The outcomes of this study confirm periods of vegetation re-greening and 8.80% of the SLPP has the highest probability to develop desertification. The most affected area is the portion west of the region, and the east and south are the least affected areas. The results suggest a slight advance of the desert, although most of the area doesn’t have the necessary conditions to develop desertification.
Key words: Landsat; NDVI-NDWI; ST-IO; desertification; re-greening vegetation
NOYOLA-MEDRANO Cristina , MARTÍNEZ-SÍAS Valeria Abigaíl . Assessing the progress of desertification of the southern edge of Chihuahuan Desert:A case study of San Luis Potosi Plateau[J]. Journal of Geographical Sciences, 2017 , 27(4) : 420 -438 . DOI: 10.1007/s11442-017-1385-5
Figure 1 Location map of the region surveyed |
Figure 2 Methodology implemented in this work |
Table 1 List of images used in this study |
| IMAGE | DATE | IMAGE | DATE | IMAGE | DATE |
|---|---|---|---|---|---|
| LT5028043 | 03-16-1990 | LT5028044 | 03-16-1990 | LT5029044 | 03-07-1990 |
| LT5028043 | 04-15-1995 | LT5028044 | 04-15-1995 | LT5029044 | 04-22-1995 |
| LT5028043 | 03-11-2000 | LT5028044 | 03-11-2000 | LT5029044 | 04-19-2000 |
| LT5028043 | 03-09-2005 | LT5028044 | 03-09-2005 | LT5029044 | 02-28-2005 |
| LT5028043 | 04-27-2011 | LT5028044 | 04-27-2011 | LT5029044 | 04-02-2011 |
Table 2 Thresholds considered establishing the map of probability to desertification |
| Factor | Threshold |
|---|---|
| NDVI | > 0.3 |
| NDWI | > 0.3 |
| ST | <-3°C |
| IO | >0.5 |
Table 3 Parameters used to perform field verification |
| Green vegetation (%) | Moisture (%) | Surface temperature (°C) | Desert varnish (%) | Desiccation cracks (%) | Desertification probability |
|---|---|---|---|---|---|
| >80 | >40 | <20 | >50 | 0 | Very low |
| 60-80 | 30-40 | 20-22.5 | 40-50 | 0 | Low |
| 40-60 | 20-30 | 22.5-25 | 30-40 | 0-10 | Moderate |
| 20-40 | 10-20 | 25-27.5 | 20-30 | 10-20 | High |
| <20 | <10 | >27.5 | <20 | >20 | Very high |
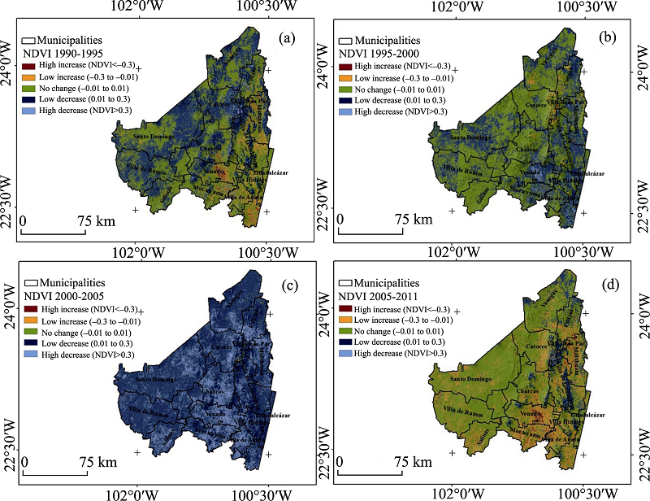
Figure 3 Maps showing changes in NDVI for a couple of dates: a) 1990-1995; b) 1995-2000; c) 2000-2005; d) 2005-2011 |
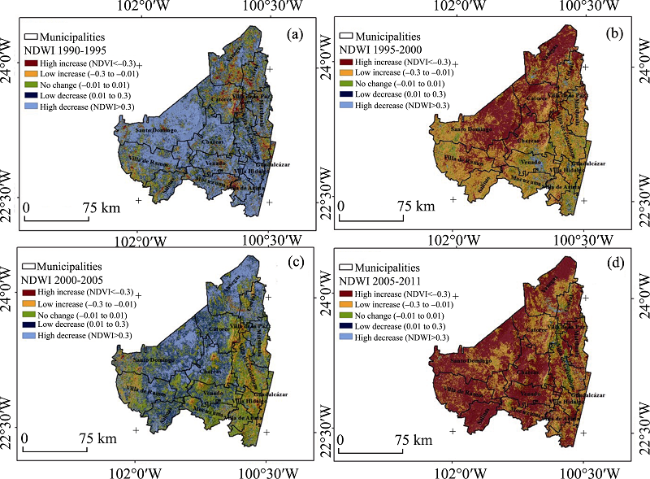
Figure 4 Maps showing the changes of NDWI for a couple of years: a) 1990-1995; b) 1995-2000; c) 2000- 2005; d) 2005-2011 |
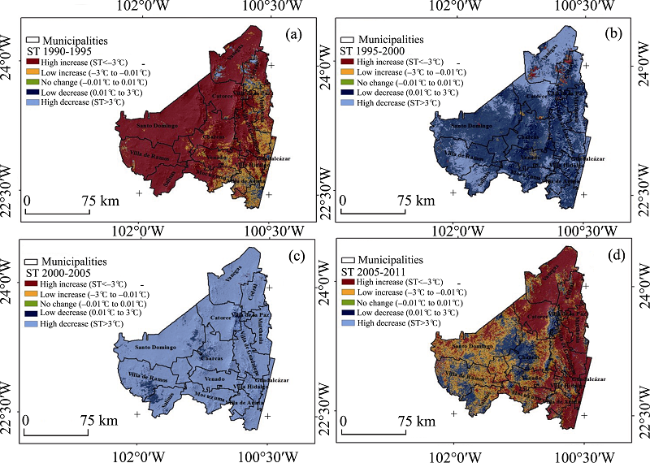
Figure 5 Maps showing changes of ST for a couple of dates: a) 1990-1995; b) 1995-2000; c) 2000-2005; d) 2005-2011 |
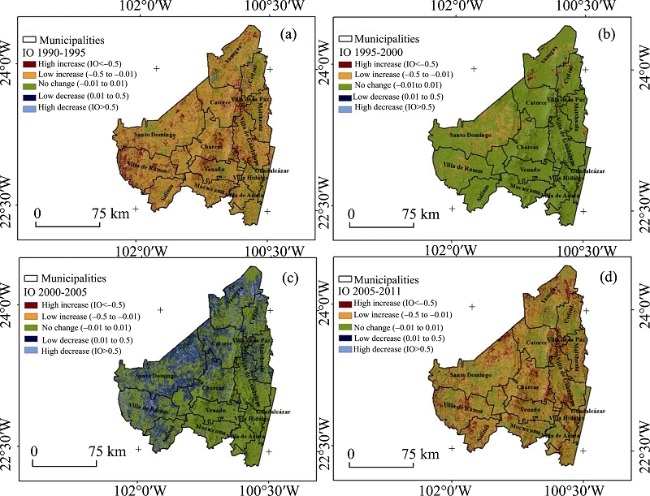
Figure 6 Maps showing the change of IO for a couple of years: a) 1990-1995; b) 1995-2000; c) 2000-2005; d) 2005-2011 |
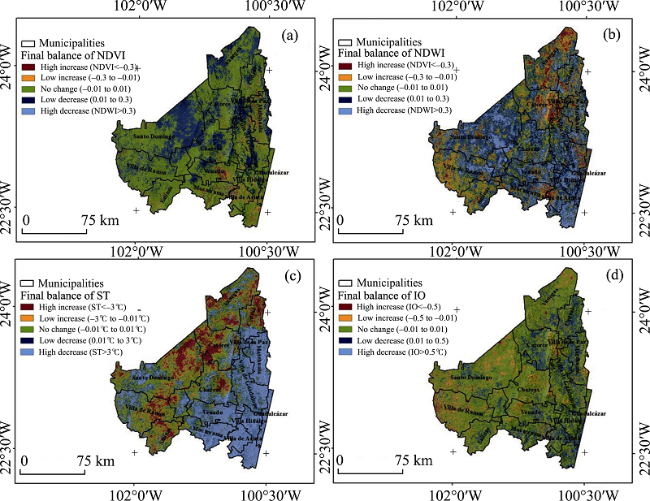
Figure 7 Maps of total balance for a) NDVI; b) NDWI; c) ST; d) IO |
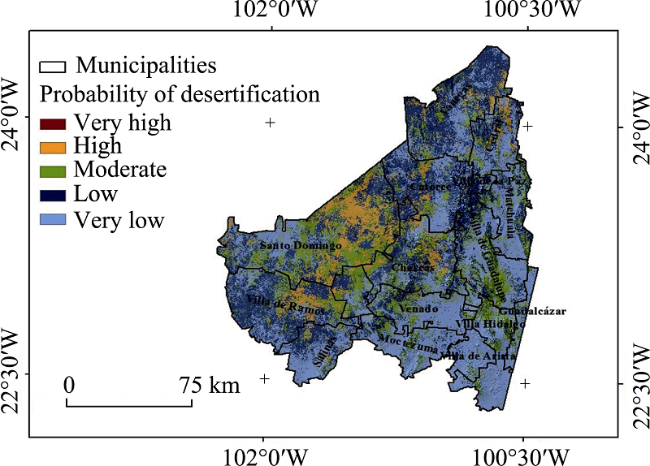
Figure 8 Map showing the areas with the highest probability of developing processes of desertification in the SLPP. |
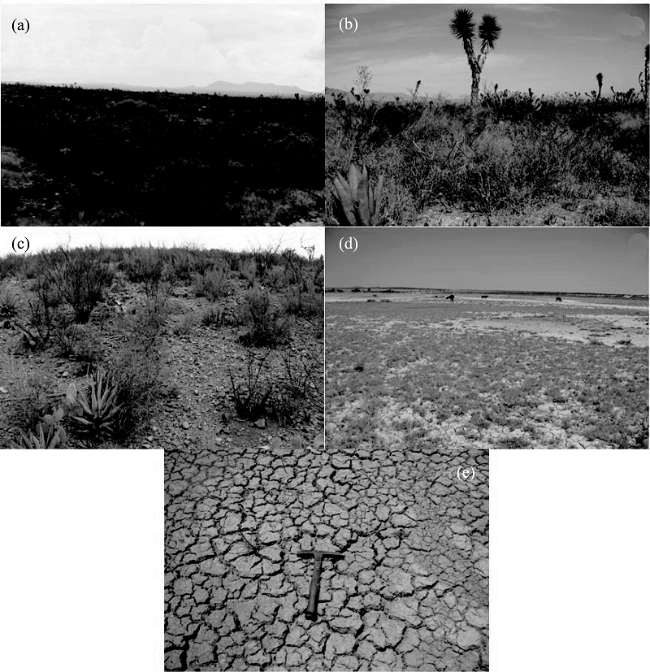
Figure 9 Landscapes related to different stages of desertification probability: a) Very low (point SCh-3), b) Low (point Sch-12), c) Moderate (point Sch-9), d) High (point Sch-19) and e) Very high (point Sch-16). The pictures were acquired during the field verification. |
Table 4 Surface affected by the level of probability of developing desertification |
| Probability of desertification | Surface (km2) | Surface (%) |
|---|---|---|
| Very high | 1.20 | 0.02 |
| High | 2154.39 | 8.78 |
| Moderate | 4568.39 | 18.63 |
| Low | 8637.56 | 35.23 |
| Very low | 9154.67 | 37.34 |
| Total | 24516.21 | 100.00 |
Table 5 Confusion matrix showing the agreement between field observations (columns) and the estimated data (rows) |
| Very high | High | Moderate | Low | Very low | Total | User accuracy | Error of commission | |
|---|---|---|---|---|---|---|---|---|
| Very high | 1 | 0 | 0 | 0 | 0 | 1 | 1.0 | 0.0 |
| High | 0 | 1 | 0 | 0 | 0 | 1 | 1.0 | 0.0 |
| Moderate | 0 | 0 | 3 | 0 | 0 | 3 | 1.0 | 0.0 |
| Low | 0 | 0 | 0 | 5 | 0 | 5 | 1.0 | 0.0 |
| Very Low | 0 | 0 | 1 | 2 | 7 | 10 | 0.7 | 0.3 |
| Total | 1 | 1 | 4 | 7 | 7 | 20 | ||
| Producer accuracy | 1.0 | 1.0 | 0.8 | 0.7 | 1 | |||
| Error of omission | 0.0 | 0.0 | 0.2 | 0.3 | 0.0 |
Global accuracy 85.0 |
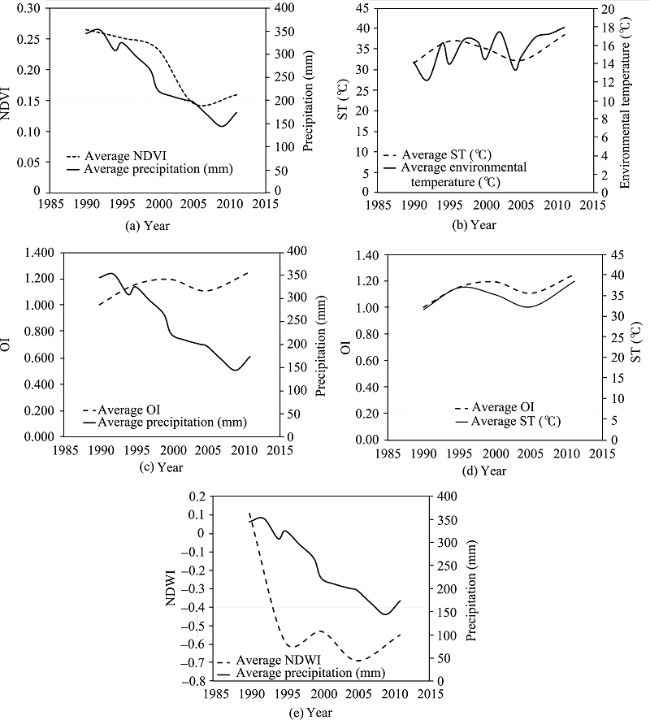
Figure 10 Comparison of the behavior of a) NDVI, b) ST, c) IO, and d) NDWI with precipitation or temperature obtained from the National Weather Service. The data of temperature and precipitation are the average of 15 days before the dates analyzed in this work. The standards were obtained based on information from 50 climatological stations. |
Table 6 Average values obtained during each period analyzed for a) NDVI, b) ST, c) IO and d) NDWI. Subsection e) corresponds to the average value of the total balance for each factor |
| a) Years | Minimum | Maximum | Average |
|---|---|---|---|
| 1990-1995 | -0.59 | 0.63 | 0.01 |
| 1995-2000 | -0.61 | 0.58 | 0.02 |
| 2000-2005 | -0.47 | 0.67 | 0.11 |
| 2005-2011 | -0.62 | 0.52 | -0.01 |
| b) Years | Minimum | Maximum | Average |
| 1990-1995 | -14.63 | 14.34 | -1.93 |
| 1995-2000 | -18.19 | 9.01 | -0.85 |
| 2000-2005 | -13.26 | 18.7 | 8.90 |
| 2005-2011 | -28.01 | -7.89 | -5.86 |
| c) Years | Minimum | Maximum | Average |
| 1990-1995 | -3.37 | 1.50 | -0.15 |
| 1995-2000 | -1.63 | 2.75 | -0.04 |
| 2000-2005 | -0.65 | 0.70 | 0.08 |
| 2005-2011 | -1.5 | 0.63 | -0.1 |
| d)Years | Minimum | Maximum | Average |
| 1990-1995 | -1.03 | 1.94 | 0.51 |
| 1995-2000 | -1.38 | 1.16 | -0.06 |
| 2000-2005 | -1.27 | 1.36 | 0.16 |
| 2005-2011 | -1.28 | 1.08 | -0.14 |
| e) Variable | Average | ||
| NDVI | 0.03 | ||
| ST | -3.77 | ||
| NDWI | 0.26 | ||
| IO | -0.07 |
The authors have declared that no competing interests exist.
| [1] |
|
| [2] |
|
| [3] |
|
| [4] |
|
| [5] |
|
| [6] |
|
| [7] |
|
| [8] |
|
| [9] |
|
| [10] |
|
| [11] |
|
| [12] |
|
| [13] |
|
| [14] |
|
| [15] |
|
| [16] |
|
| [17] |
|
| [18] |
|
| [19] |
|
| [20] |
INEGI, 2012. Anuario de estadísticas por entidad federativa. Aguascalientes, México. Available at: Accessed 15 August 2013.
|
| [21] |
|
| [22] |
|
| [23] |
|
| [24] |
|
| [25] |
|
| [26] |
|
| [27] |
|
| [28] |
|
| [29] |
|
| [30] |
|
| [31] |
|
| [32] |
|
| [33] |
|
| [34] |
|
| [35] |
|
| [36] |
|
| [37] |
|
| [38] |
USDA-NRCS, 1998. Estimating soil moisture by feel and appearance. Program Aid No.1619. USDA-NRCS, Washington, DC.
|
| [39] |
|
| [40] |
|
/
| 〈 |
|
〉 |