Research Articles

Vertical distribution of snow cover and its relation
to temperature over the Manasi River Basin of Tianshan Mountains, Northwest China

  • ZHENG Wenlong , 1, 2 ,
  • DU Jinkang , 1, 2, * ,
  • ZHOU Xiaobing 3 ,
  • SONG Mingming 1, 2 ,
  • BIAN Guodong 1, 2 ,
  • XIE Shunping 1, 2 ,
  • FENG Xuezhi 1, 2
Expand
  • 1. Department of Geographic Information Science, Nanjing University, Nanjing 210023, China
  • 2. Jiangsu Center for Collaborative Innovation in Geographical Information Resource Development and Application, Nanjing 210023, China
  • 3. Department of Geophysical Engineering, Montana Tech of the University of Montana, Butte, MT 59701, USA
*Corresponding author: Du Jinkang, PhD, E-mail:

Author: Zheng Wenlong, Master, specialized in snow cover change of remote sensing. E-mail:

Received date: 2016-03-17

  Accepted date: 2016-06-29

  Online published: 2017-04-20

Supported by

National Natural Science Foundation of China, No.41271353

Copyright

Journal of Geographical Sciences, All Rights Reserved

Abstract

How snow cover changes in response to climate change at different elevations within a mountainous basin is a less investigated question. In this study we focused on the vertical distribution of snow cover and its relation to elevation and temperature within different elevation zones of distinct climatology, taking the mountainous Manasi River Basin of Xinjiang, Northwest China as a case study. Data sources include MODIS 8-day snow product, MODIS land surface temperature (LST) data from 2001 to 2014, and in situ temperature data observed at three hydrological stations from 2001 to 2012. The results show that: (1) the vertical distribution of snow areal extent (SAE) is sensitive to elevation in low (<2100 m) and high altitude (>3200 m) regions and shows four different seasonal patterns, each pattern is well correspondent to the variation of temperature. (2) The correlation between vertical changes of the SAE and temperature is significant in all seasons except for winter. (3) The correlation between annual changes of the SAE and temperature decreases with increasing elevation, the negative correlation is significant in area below 4000 m. (4) The snow cover days (SCDs) and its long-term change show visible differences in different altitude range. (5) The long-term increasing trend of SCDs and decreasing trend of winter temperature have a strong vertical relation with elevation below 3600 m. The decreasing trend of SCDs is attributed to the increasing trend of summer temperature in the area above 3600 m.

Cite this article

ZHENG Wenlong , DU Jinkang , ZHOU Xiaobing , SONG Mingming , BIAN Guodong , XIE Shunping , FENG Xuezhi . Vertical distribution of snow cover and its relation
to temperature over the Manasi River Basin of Tianshan Mountains, Northwest China[J]. Journal of Geographical Sciences, 2017
, 27(4) : 403 -419 . DOI: 10.1007/s11442-017-1384-6

1 Introduction

Snow covers an enormous portion of the earth’s surface and is very dynamic. Understanding its change and characteristics is imperative to climate change, weather forecasting, and water resource variation and redistribution (Barnett et al., 1989; Brown and Robinson, 2011). In the Northern Hemisphere the average monthly snow area extent accounts for 7% to 40% during an annual cycle, making snow cover the most variable surface feature of the earth (Hall, 1988). The remote arid alpine regions within Tianshan mountain range in Northwest China are characterized by large elevation gradients, resulting in significant variability of precipitation in different elevation zones. For many watersheds in that region, meltwater is an important source for the various water consuming sectors, especially agricultural irrigation (Feng et al., 2000). Snowpack plays a special role in the water resource storage and regulation within the arid region. Detailed snow cover information is an important input to most snowmelt runoff simulation and forecasting modeling. Precise monitoring of snow cover recession in spring can provide important information for the local water department to efficiently manage water resources and floods. However, meteorological stations for snow cover monitoring are scarce and unevenly distributed because of inaccessibility, and snow process is poorly understood in these remote areas.
Optical remote sensing technology provides an alternative approach for acquiring long- term snow cover information over a large area. Since the Moderate Resolution Imaging Spectroradiometer (MODIS) sensor carried on Terra and Aqua satellites was put into service, the MODIS snow products have been used in snow monitoring and climatic and hydrologic studies over a wide range of locations and periods (She et al., 2015; Spiess et al., 2015; Tahir et al., 2015; Yang et al., 2012). Dietz et al. (2015) have developed global snowpack products for studying status and dynamics of the planetary snow cover extent using snow cover daily products of MODIS/Terra (MOD10A1) and MODIS/Aqua (MYD10A1). Jin et al. (2015) used the 8-day composite MODIS snow data to analyze the spatio-temporal variations of snow cover on the Loess Plateau and found that the monthly snow cover was strongly teleconnected to the Siberian High Central Intensity (SHCI) but not so to the El Niño Southern Oscillation (ENSO). Marchane et al. (2015) applied the MODIS daily snow data to characterize the inter-annual variability of the snow cover area in the Atlas Mountains (Morocco) during 2000-2013 after assessing its accuracy over seven catchments. Tang et al. (2013) analyzed the characteristics of spatio-temporal variations of snow cover and their association with in situ air temperature in the Tibetan Plateau and found that snow cover accumulation and ablation varied in different elevation zones and snow cover mainly exists within mountainous area. Wang et al. (2014) developed a new multiday retrospective cloud-removal approach for MODIS daily snow data to reduce cloud contamination and then analyzed the spatio-temporal variations of snow cover in the Xiao Hinggan Mountains in Northeast China. Their results showed that the snow cover in the watershed increased in recent years, showing a minimum in 2002 and a maximum in 2010.
Snow cover variation has strong connections with climate factors such as land surface temperature and precipitation (Liu et al., 2014; Mishra et al., 2013; Szczypta et al., 2015). Wang et al. (2015) examined the response of snow cover to changes in temperature and precipitation over the Tibetan Plateau from 2003 to 2010 using the observation data at meteorological stations, they found that the increase of temperature (0.09°C/year) and precipitation (0.26 mm/year) has a considerable influence on the increasing trend of maximum snow cover area and decreasing trend of persistent snow cover area. Bavay et al. (2013) studied the climate change impact on snow cover and runoff in the high alpine catchments of eastern Switzerland based on model simulations. Their results indicated that the impact of climate change on snow cover and runoff is closely related to elevation and size of catchments. Liu et al. (2007) investigated the impact of air temperature and precipitation on snow cover change in different seasons from 2005 to 2006 over the Dongkemadi River Basin in the source regions of the Yangtze River. They concluded that snowfall during October and November contributes significantly to snow cover variation, while temperature is the principal impact factor during the warm season (May to September) and there is no significant correlation between snow cover and precipitation. However, most of the previous studies on the correlation between snow cover variation and climate factors are based mainly on a linear temporal analysis using in situ point data. The MODIS land surface temperature (LST) product can provide a long-term series of temperature distribution with the accuracy better than 1K (Wan, 2008). Its accuracy validation has been carried out over a widely distributed locations and time periods (Bosilovich, 2006; Coll et al., 2009; Hulley and Hook, 2009; Wan, 2008). But few studies have used the MODIS LST data to explore the spatio-temporal correlation between snow cover and temperature change (Bi et al., 2015).
Vertical variation of snow cover is important in understanding snow accumulation and decay, especially in topographically complex montane terrains. Vertical variation of snow cover has to be considered in snowmelt runoff modeling and assessment of climate change impact on snow cover. However, few spatial analyses of snow cover have included the vertical dimension, analyzing snow cover change within different elevation zones is the most frequently adopted way to explore the vertical variation of snow cover (Tang et al., 2013; Bi et al., 2015)
In this study we focused on the vertical distribution of snow cover and its relation to elevation and temperature for the mountainous Manasi River Basin of Xinjiang. A refined zonation analysis was adopted to divide the whole elevation range into a series of belts to explore how snow cover and temperature change in those refined belts of different elevations. The other purpose of this study is to evaluate the validity of the MODIS 8-day snow data and MODIS LST data.

2 Study area

The Manasi River Basin (43°05′N-44°10′N and 85°00′E-86°20′E) is located in the hinterland of the Eurasian continent, with a total area of 5156 km2. It is the fourth biggest irrigation district in Northwest China. The river originates in the northern slope of the Tianshan Mountains, and it is the longest (about 400 km) inland river in the Junggar Basin. The climate of the watershed is temperate continental arid. The topography of the basin is complex, resulting in various vertical zones with distinct climatology. The annual precipitation in the stream source area is 600-700 mm. It decreases to 100-200 mm in the piedmont plain. The upstream with elevation above 3600 m is covered with a contemporary glacier of 608.25 km2. Ice melt water is an important water resource, accounting for 34.6% of the total runoff (Feng et al., 2000). Precipitation is abundant within the elevation zone between 1500 m and 3600 m, which is the main flow-generation zone and the main recharge source of the river. From the elevation of 1500 m down to the basin exit at the Hongshanzui (HSZ) hydrological station is the runoff transport area. The area outside the mountain is the runoff dissipation zone. In this study, we focus on the recharge and streamflow transportation area. The study area is thus the portion above the Hongshanzui (HSZ) hydrological station, as is shown in Figure 1. The background is elevation distribution. The four hydrological stations at the lower part of the basin are also shown: Meiyao (MY), Kensiwate (KSWT), Qingshuihezi (QSHZ), and Hongshanzui (HSZ).
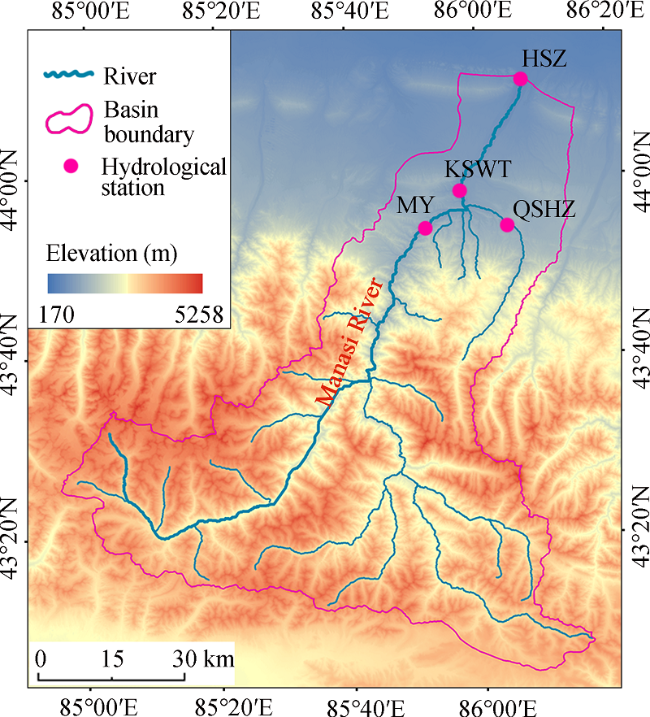
Figure 1 The boundary, river network, hydrological stations and elevation distribution of the study area

3 Data and methods

3.1 Data

(1) MODIS snow cover product
The 8-day composite snow product MOD10A2 ranging from 2001 to 2014 was used for this study. They are available from the National Snow and Ice Data Center (NSIDC, http:// nsidc.org/NASA/MODIS). The spatial resolution of MOD10A2 is 500 m, and a sinusoidal grid tiling system is used. The MOD10A2 8-day product is synthesized by the daily snow data MOD10A1 using a maximum time synthesis algorithm, which means that a pixel of a MOD10A2 image is determined as snow if the pixel is snow in any of the 8 daily MOD10A1 images. The MODIS 8-day snow product used in this study ranges from January 2001 to December 2014, 46 scenes each year, 640 scenes in total (4 scenes are missing: 2001. 06.17, 2001.06.25, 2002.03.21, 2008.04.22).
Lots of previous studies have been carried out to validate the accuracy of MODIS snow products in different areas (Ault et al., 2006; Liang et al., 2008; Marchane et al., 2015; Raleigh et al., 2013; Wang et al., 2008). In northern Xinjiang, China, Huang et al. (2007) has evaluated the snow cover identification accuracy of MOD10A1 and MOD10A2 by combining with measured data of local stations, and the results showed that MOD10A1 has the best identification accuracy of 58.2% under clear sky conditions, while MOD10A2 can effectively eliminate the influence of clouds and improve the snow classification accuracy, with a mean snow identification accuracy of 87.5%. Klein and Barnett (2003) compared MODIS daily (MOD10A1) with operational snow cover maps produced by the National Operational Hydrologic Remote Sensing Center (NOHRSC) and against in situ Snowpack Telemetry (SNOTEL) measurements for the 2000-2001 snow season and found the agreement between the MODIS and NOHRSC snow maps was high with an overall agreement of 86%. An evaluation of MODIS daily (MOD10A1) and 8-day (MOD10A2) snow product by Zhou et al. (2005) in the Upper Rio Grande River Basin of United States using stream flow and SNOTEL measurements as a ground truth has indicated that MOD10A1 is susceptible to cloud interference and has higher omission errors of misclassifying snow as clouds, while the MODIS 8-day product has higher snow classification accuracy, improvement in suppressing clouds is apparent, and MOD10A2 can be more useful in evaluating the streamflow response to snow cover area changes considering its lower temporal resolutions and higher snow identification accuracy.
(2) Digital elevation models
The digital elevation model (DEM) used in this study is the Shuttle Radar Topography Mission (SRTM) data, with a resolution of 90 m. The SRTM data is freely available from: http://srtm.csi.cgiar.org/SELECTION/inputCoord.asp. The DEM is resampled at a 500-m resolution to match the MODIS snow data.
(3) In situ data
In this study, the daily average temperature from 2001 to 2012 recorded at three hydrological stations was used to verify the applicability of the MODIS land surface temperature data (MOD11A2) for the study area. Table 1 shows the information of the stations.
Table 1 The information of the three hydrological stations
Station Full name Longitude/Latitude Elevation (m)
KSWT Kensiwate 85°57′19″E/43°58′14″N 860
MY Meiyao 85°51′49″E/43°54′34″N 1046
QSHZ Qingshuihezi 86°3′42″E/43°54′53″N 1256
(4) MODIS LST product
We also used the MODIS 8-day global land surface temperature data (MOD11A2) to analyze spatial correlation between snow cover variability and temperature change. The MOD11A2 is composed from the MODIS daily LST data MOD11A1, and stored on a 1-km sinusoidal grid as the average values of clear-sky LSTs during an 8-day period. In order to verify if the MODIS product MOD11A2 is applicable to our study area, we conducted a regression analysis of the MOD11A2 data with in situ temperature observed at the stations (a total of 1656 pairs of data). Figure 2 shows the results of the MODIS 8-day temperature versus point measurement at the KSWT, MY and QSHZ stations and we found that the correlation coefficient is as high as 0.99 and R2 = 0.98, which means the MOD11A2 LST data can fully meet the needs of this study.
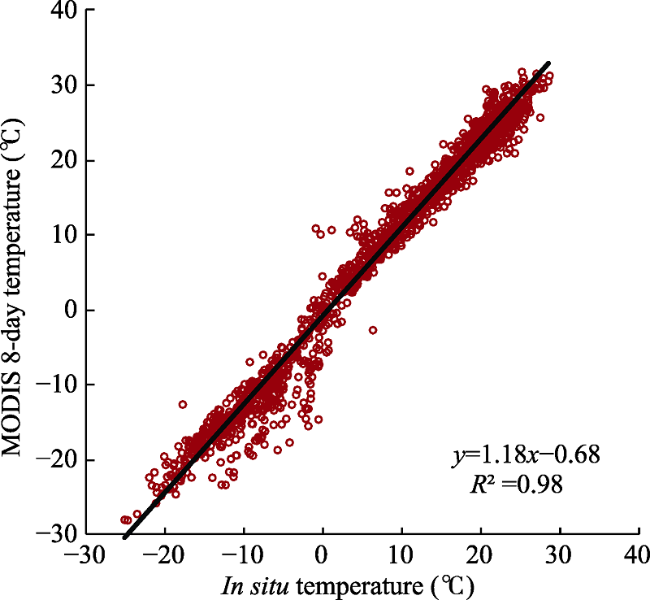
Figure 2 The relation between MOD11A2 LST data and in situ temperature of KSWT, MY and QSHZ

3.2 Methods

The study focuses on the vertical distribution of snow cover and its relation with temperature, including vertical distribution of SAE during different months, annual change of SAE in different altitude zones, vertical distribution of annual snow cover days (SCDs), vertical distribution of long-term change of SCDs, and their relations with temperature. To accomplish the tasks, a zonation analysis was adopted, e.g. a series of altitude belts were created, some snow cover indices such as SAE and SCDs in each belt were calculated. The snow cover indices were estimated using the following formulas.
(1) Calculation of SAE and SCDs
The SAE is calculated by dividing the number of snow pixels within a specific range by the total number of pixels within the study area. The SCDs of a certain pixel are the total days that the pixel is covered by snow within a year. The SCDs reflect the snow cover duration of each pixel in a certain time interval and the SCDs of each pixel are calculated by using the following equation:
$\text{SCDs}=8\times \sum\limits_{i=1}^{46}{is\_snow(i)}$ (1)
where is_snow (i) =1 indicates that the pixel is covered by snow and is_snow (i) = 0 indicates the pixel is not covered by snow; 46 is the total number of the MODIS 8-day images that cover the pixel within a year.
(2) Calculation of long-term change of SCDs
When calculating SCDs for a given year, there are two ways to define a year: a calendar year from January to December or a snow year from August of a calendar year to July of the next calendar year. The second one is a complete snow accumulation and ablation period. In order to make comparisons between the long-term trend of SCDs and winter temperature (from December to February of the next year), we adopted the second definition. The long- term change of SCDs from 2002 to 2014 for each pixel is calculated with the least-square linear fitting method. The formula is as follows (Wang et al., 2015):
$c=\frac{13\times \sum\limits_{i=1}^{13}{i\times SC{{D}_{i,jk}}-\sum\limits_{i=1}^{13}{i\times \sum\limits_{i=1}^{13}{SC{{D}_{i,jk}}}}}}{13\times {{\sum\limits_{i=1}^{13}{{{i}^{2}}-\left( \sum\limits_{i=1}^{13}{i} \right)}}^{2}}}\times 12$ (2)
where c is the specific number of days that has changed for each pixel from 2002 to 2014; i is the serial number from 1 to 13 representing the years from 2002 to 2014; SCDi, jk is the snow cover days of the pixel (jth row and kth column) in the ith year; the multiplier 12 is the number of years spanned. c > 0 indicates the SCDs for the pixel has increased for the past 13 years and c < 0 indicates SCDs has decreased and c = 0 indicates no change in SCDs.

4 Results and discussion

4.1 Vertical distribution of snow cover

The vertical distribution of SAE of each year was analyzed. Figure 3 shows the average SAE variation with the increase of elevation in each month. The SAE in each altitudinal range (every 100 m) of every month is the average value derived from the 8-day MODIS snow data in each month of all the 14 years (2001-2014), the weight was determined by the number of spanning days of the MODIS snow data in each of the same month. From features of each monthly SAE versus elevation, we divided the whole basin into five elevation zones (Zone A: <1100 m, Zone B: 1100-2100 m, Zone C: 2100-3200 m, Zone D: 3200-4000 m, and Zone E: > 4000 m), each zone has its own characteristics (see below). We also found that the variations of SAE with elevation have four different seasonal patterns, and each pattern shows common key characteristics of snow accumulation and ablation. Meanwhile, for each pattern, the vertical distribution curves show different characteristics at different elevation zones.
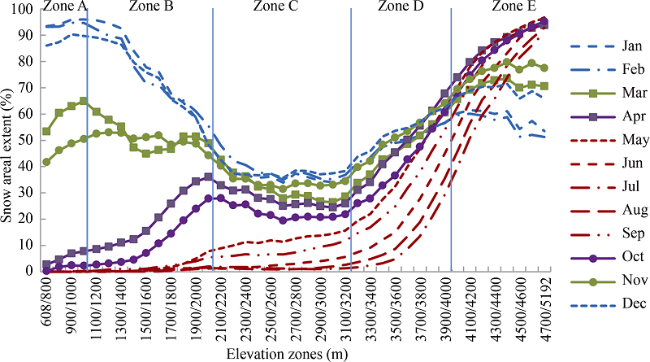
Figure 3 Vertical distribution of zone-averaged SAE in different months
Pattern I, represented by curves in blue from December to February of the next year (winter months), has the following characteristics: (1) the SAE percentages of these months had no significant variation in Zone A, and snow covered 80%-95% of the zone. (2) The SAE percentages dropped rapidly from about 95% to below 40% in Zone B, but remained almost constant in Zone C and then increased with elevation in Zone D. (3) In Zone E, the increasing trends of SAE percentages with elevation had disappeared, and to the contrary there were downward trends in areas above 4400 m. Overall, the SAE percentages during December to February were much larger than other months (April to November) below 3200 m, but smaller in the higher altitude area (> 4500 m).
Pattern II, represented by the curves in red from May to September (summer months), has the following characteristics: (1) over the whole range of elevation, the SAE percentage showed a general increase with increasing elevation. (2) Zone A was snow free during these months. However, the SAE percentages started to increase in Zone B with elevation and the increasing rates in Zones B and C were insignificant, but the SAE percentages increased rapidly in Zones D and E, close to 100% above 4700 m. (3) In Zones B-E, the SAE decreased from May to July and increased again from July to September.
Pattern III is represented by the green dotted curves of March and November. Both curves are similar to those of the winter months especially in Zones C-E, but there are also some differences: (1) these two months were characterized by large changes in SAE due to accumulation (November) and ablation (March) in lower areas (Zones A and B). (2) Within Zone E, the SAE percentages were higher than the winter months. SAE decreased all the way from November to February of the next year and it increased rapidly from February to May, indicating the snowfall in Zone E mainly occurred in March and April. Overall, the SAE percentage showed an increase with elevation in Zone A, a decrease in Zones B and C, an increase in Zone D, and a rapid increase in Zone E.
Pattern IV is represented by the purple dotted curves of April and October. Both curves are similar to those of the summer months especially in Zones D and E, but there are also some characteristics: (1) the SAE percentages increased slowly in Zone A but faster in Zone B with elevation. (2) In Zone C, the curve patterns of these two months were similar to March and November and the winter months, but SAE was lower than those months. (3) Within Zones D and E, the SAE curve patterns of both months were similar to the summer months. The SAE of the two months increased rapidly with elevation probably because of enhanced snowfall at higher mountainous areas.
The effects of altitude (elevation) on monthly snow cover can also be observed in Figure 3: (1) the monthly SAE in any month from October to April of the next year was sensitive to elevation in areas <2100 m (Zones A and B) and of elevation >3200 m (Zones D and E); (2) the monthly SAE in any month of May to September was very sensitive to elevation in area >3200 m (Zones D and E); and (3) area with elevation between 2100 m and 3200 m (Zone C) had the least variation in SAE with elevation change compared to the other zones.

4.2 The annual change of snow cover in five elevation zones

The annual change of SAE in the five elevation zones is shown in Figure 4. The SAE value is the average value from 2001 to 2014. It can be seen from Figure 4 that the SAE changes in the five zones show a common feature: accumulation in autumn and winter, and ablation in spring and summer. But each zone shows its own characteristics.
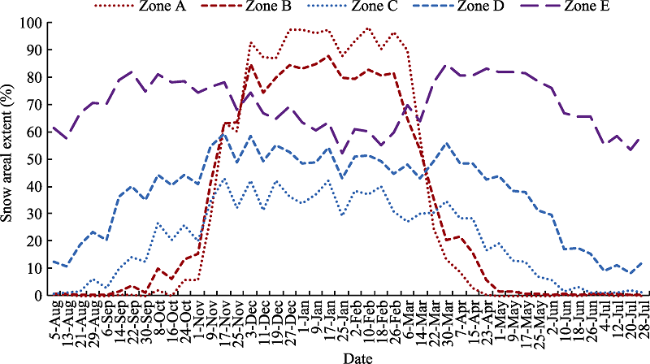
Figure 4 Annual change of SAE percentage in different elevation zones
(1) The changes of SAE within Zones A and B were significant during the year. From December to February of the next year, the values of SAE were around 90% in Zone A and 80% in Zone B, which were much larger than the other three zones of higher elevations. March to May was the rapid snow ablation phase for both zones. From late May to October, the values of SAE were almost zero. In November there was a period of rapid increase in snow cover with the occurrence of seasonal snowfall within both zones.
(2) The SAE for Zone C was lower than 43% throughout the year and close to zero from July to mid-August. From mid-November to mid-March, the SAE varied between 29% and 43% and was the lowest among all the five zones. From mid-August to mid-November was a period of slow snow-accumulation and from mid-March to June was a period of slow snow-ablation.
(3) The variation of SAE in Zone D is similar to that in Zone C. Since the snowline elevation of the basin is within Zone D, the minimum SAE of this zone was around 10% and occurred in July. The snow accumulation and ablation periods of this zone were from mid-August to mid-November and April to June, respectively.
(4) In Zone E, the SAE was higher than 50% through the whole year. There were two periods with lower SAE in this zone: one was from July to August and the other was from December to February. The first one was because that the temperature from July to August in this zone was above 0 °C and snow ablation occurred during this period. The reasons for the second one can be twofold: the temperature inversion layer which appeared in winter months had an inhibiting effect for the snowfall in high elevation area; the wind blowing effect at high elevation zones may have contributed to snow cover decrease in winter.

4.3 Distribution of snow cover days

The distribution of the average SCDs from 2001 to 2014 is shown in Figure 5a. The basin can be cataloged into stable snow cover area and unstable snow cover area according to snow cover days. The threshold of SCDs used for separating stable from unstable snow cover areas is 60 days (2 months). The unstable snow cover area (< 60 days) is further divided into two subareas: the annual periodic unstable snow cover area in which snow appears every year and the SCDs is between 10-60 days and the non-cyclical unstable snow cover area in which snow appears only in some of the years and the SCDs is below 10 days. As shown in Figure 5a, the non-cyclical unstable snow cover area was mainly distributed alone the Manasi River in the south central basin with an average elevation of 2717 m. It only accounted for about 2.7% of the whole basin. The annual periodic unstable snow cover area was located in the valleys of the upper reaches of the river. It accounted for about 13.7% of the basin area. While in the downstream region of the basin, the SCDs was generally 60-240 days, and the average elevation was relatively lower than the unstable snow cover area. The area with SCDs longer than 8 months occurred mainly in the mountainous regions of high elevation in the southwest, south, and central east of the basin, which accounted for about 34.4% of the area of the entire basin.
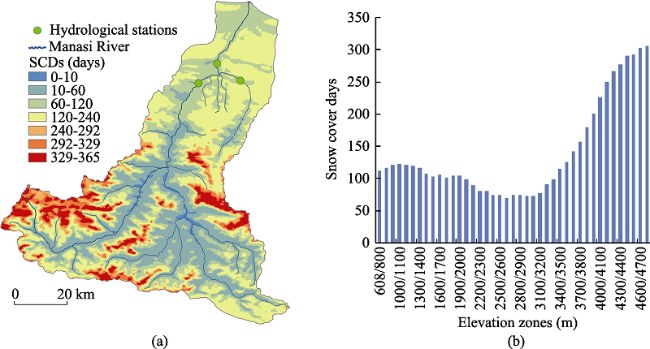
Figure 5 Horizontal (a) and vertical (b) distributions of average SCDs (from 2001 to 2014)
The vertical distribution of the average SCDs is shown in Figure 5b. We can see that the SCDs did not always increase with elevation. In the area above 3000 m, the SCDs increased with elevation. While in the area between the elevations of 1000 m and 3000 m, the SCDs showed a decrease with increasing elevation, which may be attributed to the temperature inversion in winter (see details in the next section) and different vertical distributions of SAE in all seasons.

4.4 Distribution of long-term change of snow cover days

The long-term change of SCDs from 2002 to 2014 for each pixel was calculated using Equation (2). The horizontal distribution of the SCDs changes displayed in Figure 6a indicates that 40.3% of the area showed negative changes in SCDs, and 12.1% of the area manifested a decrease of more than 18 days. The area with decreasing SCDs was mainly located in the southern mountainous region above 3600 m and that below 650 m in elevation. The SCDs for the remaining 59.7% of the pixels had positive changes and 11.4% of those showed an increase of more than 24 days in the past 13 years. The area with increased SCDs mainly occurred below 3600 m.
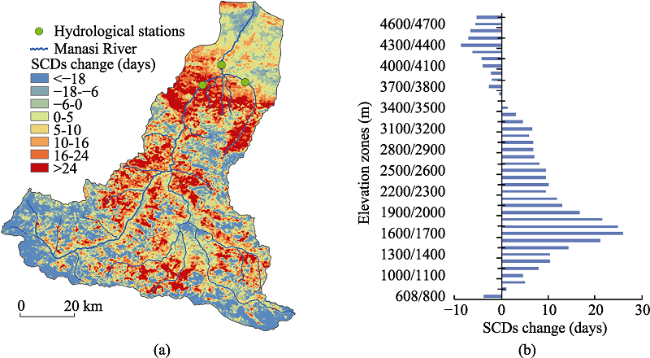
Figure 6 Horizontal (a) and vertical (b) distributions of long-term change in SCDs
The vertical distribution of the SCDs changes is shown in Figure 6b. We can see that the change in SCDs showed a decreasing trend above 3600 m, while it showed an increasing trend below the elevation. The maximum increase happened in the area with elevations between 1600-1700 m.

4.5 The vertical relations between snow cover and temperature

The vertical distribution of the average MODIS 8-day temperature in different months from 2001 to 2014 was calculated and shown in Figure 7. The temperature is the average value of the daytime and nighttime temperature. It can be observed clearly from Figure 7 that a temperature inversion has occurred in winter (December to February) within Zone B, which is the most significant characteristic. In the northern side of the Tianshan Mountains, there was a temperature inversion layer at the altitude around 1500 m in winter. In the low-lying areas, cold air flowed along the slope into the low-lying valley, warm air was lifted and the movement of cold air was blocked by the terrain, a “cold air lake” formed at the bottom (Hu, 2004). The vertical distribution of the monthly averaged temperature can also be described in four patterns that are well correspondent to the SAE patterns, indicating a strong relationship between SAE and temperature (see Figure 3). The relations can be described as follows.
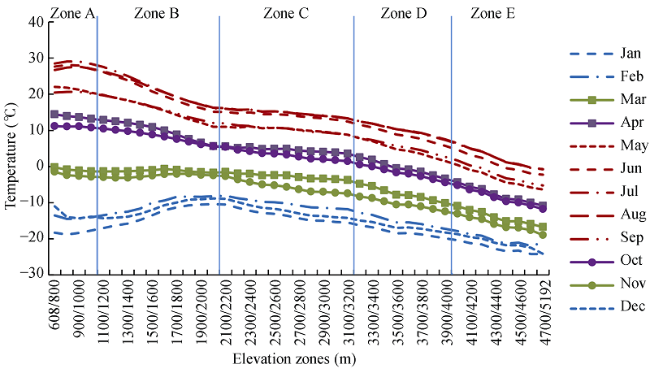
Figure 7 Vertical distribution of zone-averaged temperature in different months
(1) During the winter months, the temperature inversion phenomenon played an important role in the distribution of snow cover in different zones. The average temperature in Zone A was about 5°C lower than that in Zone B, and it was much easier to form snowfall in Zone A. Therefore, the SAE percentage in the zone was much higher than the other zones. But in Zone B, SAE decreased rapidly with increasing temperature and elevation. This coincidence indicates that the temperature inversion may have reduced SAE possibly due to less snowfall from the inversion layer, since the temperature was still negative. Also, little snowfall in Zones C and D led to a slow increase in SAE with increasing elevation. The SAE even showed a decrease probably due to wind blowing effect in Zone E (Hu, 2004). While during summer months (from May to September), the situation was much simpler. The temperature decreased with increasing elevation in all zones, and SAE increased within the whole elevation range correspondingly.
(2) February to April and October to December were two transitional periods. For February to April, land surface temperature rose rapidly from below -10°C to above +10°C in Zones A and B. Although the average temperature of March was near the melting point, March experienced a large reduction in SAE; from October to December, land surface temperature dropped rapidly from above 5°C to below -9°C. The average temperature of November was below or near the freezing point, but November experienced the large increase in SAE due to snow accumulation. However, in Zones C and E, the temperature in March and November was below 0°C, and the pattern of the SAE curve with increasing elevation is similar to the winter months.
(3) Judging from the regression analysis between the SAE percentage and temperature in vertical distribution for each month (Table 2), the correlations were all correspondent to the SAE and temperature patterns: the correlation between SAE and temperature from April to October was the most significant and that from December to February was the least. During the ablation period from April to July, the correlation in April was the most significant while from April to July, the significance decreased month-by-month. When snow accumulation began, the significance increased month-by-month from August to October. The poor correlation between snow cover and temperature in November to February was mainly caused by more snowfall in lower altitude area, wind blowing effect at high elevation zones and temperature inversion phenomenon. During a transitional period, the correlation in March and November improved considerably.
Table 2 Correlation coefficients between SAE and temperature on vertical distribution
Jan Feb Mar Apr May Jun Jul Aug Sep Oct Nov Dec
-0.19 -0.10 -0.60 -0.97 -0.94 -0.85 -0.79 -0.82 -0.91 -0.96 -0.74 -0.24

4.6 The annual relations between SAE and temperature in five elevation zones

Figure 8 shows the annual changes of the 8-day average temperature of the past 14 years in the five different elevation zones. The 8-day average temperature derived from the MODIS 8-day temperature data product is the average value of all pixels in each zone. The change of temperature in different elevation zones showed a certain correspondence to that of the SAE presented in Figure 4.
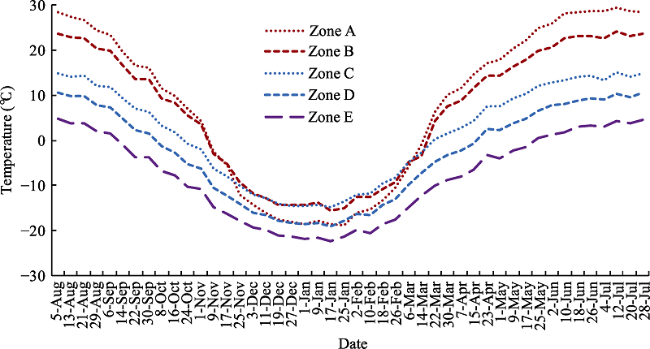
Figure 8 Annual change of temperature in the five elevation zones
In order to explore the relationship between the snow cover and land surface temperature, we performed a regression analysis between the 8-day SAE and temperature from 2001 to 2014 in the five elevation zones. The correlation coefficients are listed in Table 3. The correlation between the SAE and temperature decreased with increasing elevation. The correlation coefficient in the area below 2100 m (Zones A and B) was -0.82 to -0.93, it decreased to 0.05 in the area above 4000 m (Zone E). The negative correlation between the SAE and temperature was significant in Zones A-D, but not significant in Zone E, which indicated that below a certain altitude, temperature was a key factor controlling the distribution of SAE. This result is consistent with those obtained by Beniston (2012), Morán-Tejeda et al. (2013), and Bi et al. (2015). Beniston (2012) found a threshold altitude at approximately 1500-2000 m in the European Alps. Morán-Tejeda et al. (2013) reported a threshold altitude of ~1400 m in Switzerland, and Bi et al. (2015) identified a threshold altitude of 3650 ± 150 m in the Heihe River Basin, an arid area of Western China. Those studies found that temperature is the primary controlling factor on SAE below the threshold altitude, while precipitation is the primary controlling factor on SAE above the threshold altitude.
Table 3 Correlation coefficients between SAE and temperature over annual variation
Year Zone A Zone B Zone C Zone D Zone E
2001 -0.90 -0.92 -0.68 -0.54 0.23
2002 -0.90 -0.89 -0.71 -0.60 0.05
2003 -0.86 -0.90 -0.59 -0.52 0.24
2004 -0.89 -0.84 -0.77 -0.72 0.03
2005 -0.90 -0.90 -0.77 -0.74 -0.11
2006 -0.89 -0.90 -0.88 -0.84 -0.22
2007 -0.90 -0.90 -0.71 -0.71 -0.19
2008 -0.86 -0.86 -0.67 -0.64 0.07
2009 -0.91 -0.91 -0.40 -0.32 0.27
2010 -0.88 -0.88 -0.67 -0.67 -0.15
2011 -0.85 -0.88 -0.62 -0.67 0.04
2012 -0.90 -0.93 -0.69 -0.53 0.26
2013 -0.89 -0.92 -0.71 -0.69 -0.14
2014 -0.82 -0.92 -0.66 -0.56 0.26
Average -0.88 -0.89 -0.68 -0.63 0.05

4.7 The vertical relations between long-term changes of SCDs and temperature

The long-term changes of temperatures of both winter and summer from 2002 to 2014 in each elevation zone are shown in Figure 9, the elevation range of each zone is 100 m. The value of temperature change in each zone is the average of all pixels of the zone. From this figure it can be seen that the summer temperature increased, while on the contrary the winter temperature showed a decreasing trend. This resulted in warmer summer and colder winter, suggesting an enlarged extent of temperature variation within a year. The vertical distribution curve of long-term changes of SCDs shown in Figure 6b and winter temperature had inverse shapes for the area below 3600 m, with correlation coefficient of -0.84. The maximum amplitudes of SCDs and winter temperature changes were well correspondent to each other. The change in snow cover in the area below 3600 m was seasonal, which appeared mostly in winter, so it was affected mainly by winter temperature. While in the area above 3600 m, the correlation between SCDs and winter temperature change was poor. The change of SCDs above 3600 m was negative, probably because that the summer temperature increased over the whole basin, which might lead to the decrease in SCDs in the area.
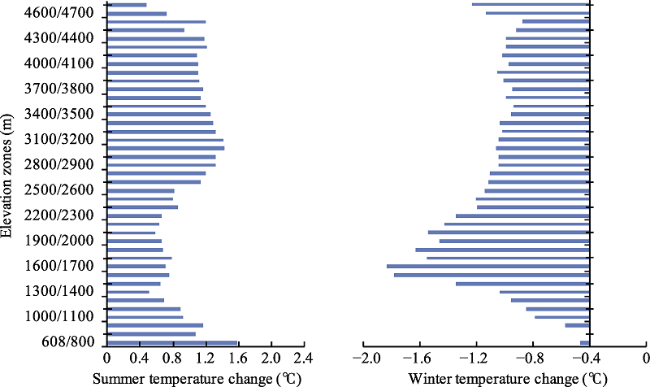
Figure 9 Vertical distributions of long-term changes of summer and winter temperatures

4.8 Other factors affecting snow cover change

It is well known that SAE is affected by both temperature and precipitation, snowfall contributes significantly to snow cover variation, while temperature rise (and subsequent melting) is the principal impact factor during warm season (Bavay et al., 2013; Wang et al., 2015; Liu et al., 2007). This study mainly investigated the vertical change of snow cover and its relation with elevation and temperature. The results show that the most significant negetive corrrelation between SAE and temperature occurred during April to October and in Zones A-D, and the least corrrelation occurred during December to February and in Zone E. The poor correlation between SAE and temperature during winter and in Zone E may indicate that other factors such as precitipation, wind blowing, sublimation, etc. might have played important roles. Precipitation is the principal factor affecting SAE in high altitude area (Beniston, 2012; Morán-Tejeda et al., 2013), high-speed wind can also blow the snow away and change the distribution of snow cover in the local area (Li et al., 2014), sublimation recognized as an important hydrological process in high altitude regions would be another reason for the SAE decrease in winter season (Li et al., 2009; Bi et al., 2015). Unfortunately, there was no observed sublimation and wind data in the basin, and precipition data obtained from the three hydrological stations located at low elevation areas may not represent the precipitation at high altitude regions. The TRMM (Tropical Rainfall Measuring Mission) rainfall data maybe a promising soures of precipation data for further study after correction and being down scaled. All these demonstrate that identification of the main factors that control snow cover in high elevation areas is still challenging due to lack of observation data and thus deserves further investigation.

5 Conclusions

Based on refined zonation analysis of the MODIS 8-day composite snow data products MOD10A2, MODIS land surface temperature data, and in situ daily temperature, the spatio-temporal variation of snow cover and its relation with temperature in Manasi River Basin were investigated at various characteristic elevation zones in this study. We concluded that:
(1) The vertical distribution of SAE indicates four different patterns in a year, each pattern has different features at different altitudes and is well correspondent to patterns of temperature variation. The SAE and temperature have a good vertical relationship in all seasons except for winter. The poor relationship in winter is possibly attributed to the more snowfall in lower altitude region, wind blowing effect at high elevation zones and temperature inversion phenomenon.
(2) The monthly SAE in any month from October to April of the next year is sensitive to elevation in regions of elevation < 2100 m and of elevation > 3200 m, the monthly SAE in any month of May to September is very sensitive to elevation in area of elevation > 3200 m, area of elevation between 2100-3200 m has the least variation in SAE with elevation change compared to the other regions.
(3) The annual changes in SAE in each altitudinal zone show distinct seasonal characteristics. The correlation between SAE and temperature decreases with increasing elevation. The negative correlation is significant in area below 4000 m, but not significant in area above 4000 m.
(4) The average distribution of SCDs during the period 2001-2014 shows distinct vertical variations. The average SCDs increase with increasing elevation except for the area between 1000 m and 3000 m in elevation, where the SCDs decrease with increasing altitude, which may be attributed to the temperature inversion in winter and different vertical distributions of SAE in all seasons.
(5) The long-term changes in winter temperature are negative, while changes in summer temperature are positive during 2002-2014. The increasing trend of SCDs has a strong correlation with the decreasing trend of winter temperature in the area below 3600 m, and the decreasing trend of SCDs is attributed to the increasing trend of summer temperature in the area above 3600 m.

The authors have declared that no competing interests exist.

[1]
Ault T W, Czajkowski K P, Benko T et al., 2006. Validation of the MODIS snow product and cloud mask using student and NWS cooperative station observations in the Lower Great Lakes Region.Remote Sensing of Environment, 105: 341-353.NASA's Moderate Resolution Imaging Spectroradiometer (MODIS) snow product (MOD10) creates automated daily, 8-day composite and monthly regional and global snow cover maps. In this study, the MOD10 daily swath imagery (MOD10_L2) and the MODIS cloud mask (MOD35) were validated in the Lower Great Lakes Region, specifically the area to the east of Lake Michigan. Validation of the MOD10_L2 snow product, MOD35 cloud mask and the MOD10_L2 Liberal Cloud Mask was performed using field observations from K-12 student GLOBE (Global Learning and Observations to Benefit the Environment) and SATELLITES (Students And Teachers Evaluating Local Landscapes to Interpret The Earth from Space) programs. Student data consisted of field observations of snow depth, snow water equivalency, cloud type, and total cloud cover. In addition, observations from the National Weather Service (NWS) Cooperative Observing Stations were used. Student observations were taken during field campaigns in the winter of 2001 2002, a winter with very little snow in the Great Lakes region, and the winters of 2000 2001 and 2002 2003, which had significant snow cover. Validation of the MOD10_L2 version 4 snow product with student observations produced an accuracy of 92% while comparison with the NWS stations produced an accuracy of 86%. The higher NWS error appears to come from forested areas. Twenty-five and fifty percent of the errors observed by the students and NWS stations, respectively, occurred when there was only a trace of snow. In addition, 82% of the MODIS cloud masked pixels were identified as either overcast or broken by the student observers while 74% of the pixels the MODIS cloud mask identified as cloudless were identified as clear, isolated or scattered cloud cover by the student observers. The experimental Liberal Cloud Mask eliminated some common errors associated with the MOD35 cloud mask, however, it was found to omit significant cloud cover.

DOI

[2]
Barnett T P, Dumenil L, Schlese U et al., 1989. The effect of Eurasian snow cover on regional and global climate variations.Journal of the Atmospheric Sciences, 46: 661-685.The sensitivity of the global climate system to interannual variability of he Eurasian snow cover has been investigated with numerical models. It was found that heavier than normal Eurasian snow cover in spring leads to a oor monsoon over Southeast Asia thereby verifying an idea over 100 years old. The poor monsoon was characterized by reduced rainfall over India and Burma, reduced wind stress over the Indian Ocean, lower than normal temperatures on the Asian land mass and in the overlying atmospheric column, reduced tropical jet, increased soil moisture, and other features associated with poor monsoons. Lighter than normal snow cover led to a ood monsoon with atmospheric anomalies like those described above but of opposite sign. Remote responses from the snow field perturbation include readjustment of the Northern Hemispheric mass field in midlatitude, an equatorially symmetric response of the tropical geopotential height and temperature field and weak, but significant, perturbations in the surface wind stress and heat flux in the tropical Pacific.The physics responsible for the regional response involves all elements of both the surface heat budget and heat budget of the full atmospheric column. In essence, the snow, soil and atmospheric moisture all act to keep the land and overlying atmospheric column colder than normal during a heavy snow simulation thus reducing the land cean temperature contrast needed to initiate the monsoon. The remote responses are driven by heating anomalies associated with both large scale air-sea interactions and precipitation events.The model winds from the heavy snow experiment were used to drive an ocean model. The SST field in that model developed a weak El Ni o in the equatorial Pacific. A coupled ocean-atmosphere model simulation perturbed only by anomalous Eurasian snow cover was also run and it developed a much stranger El Ni o in the Pacific. The coupled system clearly amplified the wind stress anomaly associated with the poor monsoon. These results show the important role of an evolving (not specified) sea surface temperature in numerical experiments and the real climate system. Our general results also demonstrate the importance of land processes in global climate dynamics and their possible role as one of the factors that could trigger ENSO events.

DOI

[3]
Bavay M, Grünewald T, Lehning M, 2013. Response of snow cover and runoff to climate change in high alpine catchments of eastern Switzerland.Advances in Water Resources, 55: 4-16.Small, higher elevation catchments will show more winter runoff, earlier spring melt peaks and reduced summer runoff. Where glacierized areas exist, the transitional increase in glacier melt will initially offset losses from snow melt. Larger catchments, which reach lower elevations will show much smaller changes since they are already dominated by summer precipitation.

DOI

[4]
Beniston M, 2012. Is snow in the Alps receding or disappearing?WIREs Climate Change, 3: 349-358.Snow in a populated and economically diverse region such as the Alps plays an important role in both natural environmental systems, (e.g., hydrology and vegetation), and a range of socio-economic sectors (e.g., tourism or hydropower). Changes in snow amount and duration may impact upon these systems in various ways. The objective of this text is to assess whether the public perception that snow has been receding in recent decades in the European Alps is indeed upheld by observations of the behavior of the mountain snow-pack in the last few decades. This article will show that, depending on location nd in particular according to altitude he quantity of snow and the length of the snow season have indeed changed over the past century. While a major driving factor for this is clearly to be found in recent warming trends, other processes also contribute to the reduction in snow, such as the influence of the North Atlantic Oscillation on the variability of the mountain snow-pack. This article ends with a short glimpse to the future, based on recent model studies that suggest that snow at low to medium elevations will indeed have all but disappeared by 2100. WIREs Clim Change 2012 doi: 10.1002/wcc.179For further resources related to this article, please visit the WIREs website.

DOI

[5]
Bi Y B, Xie H J, Huang C L et al., 2015. Snow cover variations and controlling factors at upper Heihe River Basin, northwestern China.Remote Sensing, 7: 6741-6762.中国科学院寒区旱区环境与工程研究所机构知识库(CASNW OpenIR)以发展机构知识能力和知识管理能力为目标,快速实现对本机构知识资产的收集、长期保存、合理传播利用,积极建设对知识内容进行捕获、转化、传播、利用和审计的能力,逐步建设包括知识内容分析、关系分析和能力审计在内的知识服务能力,开展综合知识管理。

DOI

[6]
Bosilovich M G, 2006. A comparison of MODIS land surface temperature with in situ observations.Geophysical Research Letters, 33: L20112.MODerate resolution Imaging Spectroradiometer (MODIS) land surface temperatures (LSTs) are compared to in situ observations during the Coordinated Enhanced Observing Period (CEOP). The purpose is to test the utility of global enhanced station data to provide additional information on the consistency of large volumes of remotely sensed data. While comparisons are limited by unresolved spatial and temporal representativeness, many of the comparisons are quite favorable, especially in mid-latitude regions. We note the extent of cloud contamination in the data product, and also some biases that may vary seasonally. Upscaling to 25km, as would be needed for global model comparisons or some mesoscale models, did not overly change the comparison results. The veracity of remotely sensed observations is important to identify and understand as these data begin to be applied to research questions.

DOI

[7]
Brown R D, Robinson D A, 2011. Northern Hemisphere spring snow cover variability and change over 1922-2010 including an assessment of uncertainty.Cryosphere, 5: 219-229.An update is provided of Northern Hemisphere (NH) spring (March, April) snow cover extent (SCE) over the 1922–2010 period incorporating the new climate data record (CDR) version of the NOAA weekly SCE dataset, with annual 95% confidence intervals estimated from regression analysis and intercomparison of multiple datasets. The uncertainty analysis indicates a 95% confidence interval in NH spring SCE of ±5–10% over the pre-satellite period and ±3–5% over the satellite era. The multi-dataset analysis shows larger uncertainties monitoring spring SCE over Eurasia (EUR) than North America (NA) due to the more complex regional character of the snow cover variability and larger between-dataset variability over northern Europe and north-central Russia. Trend analysis of the updated SCE series provides evidence that NH spring snow cover extent has undergone significant reductions over the past ~90 yr and that the rate of decrease has accelerated over the past 40 yr. The rate of decrease in March and April NH SCE over the 1970–2010 period is ~0.8 million km2 per decade corresponding to a 7% and 11% decrease in NH March and April SCE respectively from pre-1970 values. In March, most of the change is being driven by Eurasia (NA trends are not significant) but both continents exhibit significant SCE reductions in April. The observed trends in SCE are being mainly driven by warmer air temperatures, with NH mid-latitude air temperatures explaining ~50% of the variance in NH spring snow cover over the 89-yr period analyzed. However, there is also evidence that changes in atmospheric circulation around 1980 involving the North Atlantic Oscillation and Scandinavian pattern have contributed to reductions in March SCE over Eurasia.

DOI

[8]
Coll C, Wan Z, Galve J M, 2009. Temperature-based and radiance-based validations of the V5 MODIS land surface temperature product.Journal of Geophysical Research-Atmospheres, 114: D20102.The V5 level 2 land surface temperature (LST) product of the Moderate Resolution Imaging Spectroradiometer (MODIS) was validated over homogeneous rice fields in Valencia, Spain, and the Hainich forest in Germany. For the Valencia site, ground LST measurements were compared with the MOD11_L2 product in the conventional temperature-based (T-based) method. We also applied the alternative radiance-based (R-based) method, with in situ LSTs calculated from brightness temperatures in band 31 through radiative transfer simulations using temperature and water vapor profiles and surface emissivity data. At the Valencia site, profiles were obtained from local radiosonde measurements and from National Centers for Environmental Prediction (NCEP) data. The R-based method was applied at the Hainich site using radiosonde profiles from a nearby sounding station and NCEP profiles. The T-based validation showed average bias (MODIS minus ground) of -0.3 K, standard deviation of 0.6 K and root mean square error (RMSE) of 0.7 K. For the R-based method, the quality of the atmospheric profiles was assessed through the difference (T-T) between the actual MODIS and the profile-based calculated brightness temperature difference in bands 31 and 32. For the cases where -0.3 K < (T-T) < 0.5 K, the R-based method yielded LST errors with small biases and RMSE = 卤0.6 K for the two sites. These results show the high accuracy and precision of the MODIS LST product for the two sites studied. The good performance of the R-based method opens the possibility for a more complete validation including heterogeneous surfaces where the T-based method is not feasible.

DOI

[9]
Dietz A J, Kuenzer C, Dech S, 2015. Global Snow Pack: A new set of snow cover parameters for studying status and dynamics of the planetary snow cover extent.Remote Sensing Letters, 6: 844-853.With the Global SnowPack, we present a set of global snow cover parameters – for the first time in medium resolution for the full globe and without the compromising effects of cloud coverage or polar darkness. Over 1.2 million single data sets were processed to prepare the Global SnowPack between September 2000 and 2015 – with around 246 more being added every day. Snow cover duration (SCD), early and late season SCD, and statistical products are the main components of the Global SnowPack which can be used to analyse shifts and trends of global snow cover characteristics as well as extreme events. The 50002m resolution allows for applications on a subcatchment scale. One example for a possible application is included, focusing on a detailed view of the California and Volga Basin snow cover characteristics. The Global SnowPack reveals areas with extremely low SCD in 2013/2014 and 2014/2015 which is one reason for the severe droughts in California.

DOI

[10]
Feng X Z, Li W J, Shi Z T et al., 2000. Satellite snowcover monitoring and snowmelt runoff simulation of Manas River in Tianshan Region.Remote Sensing Technology and Application, 15: 18-21. (in Chinese)The updrafted Snowmelt Runoff Model(SRM) was applied to the daily snowmelt runoff simulation of Manas River based on the spring snowcover monitoring of Tianshan Region by using the NOAA/AVHRR satellite data.The results showed that the coefficient of determination of the simulation could reach 0.89,and the deviation of the runoff volumes was within 5.1.If the parameters can be adjusted according to the method described in this paper,the model will be easily used to the similar basins.

[11]
Hall D K, 1988. Assessment of polar climate change using satellite technology.Reviews of Geophysics, 26: 26-39.Results from general circulation models (GCMs) have indicated that a predicted climate warming resulting from an increase in atmospheric carbon dioxide (CO 2 ) will be amplified in the polar regions and that temperature increases in the polar regions will be several times greater than the global average. Some GCMs predict a 4 5 C average air temperature increase in the Arctic by the middle of the next century. Evidence from the polar regions indicates that a warming in the cryosphere may already be in progress. A 2 4 C rise in permafrost temperature, measured in northern Alaska, is believed to have occurred during the last 100 years. In addition, many small valley glaciers and ice caps have experienced retreat and appear to have contributed up to 50% to the observed rise (10 15 cm) in sea level during the last century. Other work shows that increased snowfall which can be associated with warmer temperatures has caused thickening of some Alaskan glaciers. Though a decrease in snow and sea ice cover would be a likely consequence of global warming, a sustained decrease in global snow and sea ice extent has not been found from analysis of more than 20 years of image data (1.1-km pixel resolution) from National Oceanic and Atmospheric Administration meteorological satellites and more than 7 years of scanning multichannel microwave radiometer snow data (30-km pixel resolution) on the Nimbus 7 satellite. Snow and sea ice are sensitive to atmospheric temperature changes because of their large surface to volume ratio. While measurements of snow and sea ice extent, snow depth, and sea ice concentration are possible using visible, near-infrared, or microwave sensors on satellites, it is not feasible to measure the mass balance of the ice sheets with these sensors directly. Estimates by glaciologists show that the Greenland Ice Sheet is in approximate equilibrium and that the Antarctic Ice Sheet has a positive mass balance. Satellite radar altimetry (and in the future, laser altimetry) is a promising technique for measuring the surface elevation of ice sheets. Satellite-borne laser altimetry in conjunction with imagery on ice sheet extent will permit direct measurements of changes in mass balance of the ice sheets through time. The terminus positions and ablation area boundaries of valley glaciers are indicative of glacier mass balance; these can be studied using visible and near-infrared data from the Landsat satellite series and data from the French Systeme Probatoire d'Observation de la Terre (SPOT) satellite and synthetic aperture radar data. Lake ice freeze-up and breakup dates are sensitive to regional air temperature and may also be good indicators of climate trends. Monitoring the onset of lake freeze-up and breakup dates is feasible with radar and visible image data. The very important role of snow and ice in global processes is being highlighted as large-scale, satellite-derived geophysical data sets have become available and are beginning to be used as realistic input to GCMs.

DOI

[12]
Hu R, 2004. Physical Geography of the Tianshan Mountains in China. Beijing: China Environmental Science Press, 443pp. (in Chinese)

[13]
Huang X, Zhang X, Li X et al., 2007. Accuracy analysis for MODIS snow products of MOD10A1 and MOD10A2 in northern Xinjiang area.Journal of Glaciology and Geocryology, 29: 722-729. (in Chinese)By the use of NASA EOS Terra/MODIS snow products of MOD10A1 and MOD10A2 and climatic data,the snow classification accuracy was analyzed using Geographic Information System(GIS) techniques for 90 temporal daily snow composite products of MOD10A1 and 11 temporal eight-day composite products of MOD10A2 from December 1, 2004 to February 28,2005.Results showed that: 1) When snow depth is less than 3 cm,the precision of snow identified by MOD10A1 is very low,only 7.5%;as snow depth is between 4 cm to 6 cm,MOD10A1 snow identification accuracy reaches to 29.3%;and the precision is 45.6% when snow depth is between 15 to 20 cm;The mean accuracy is 31.5% when the snow depth is great than 20 cm;2) the precision of snow identification for MOD10A1 products is severely affected by climatic situation.Under sunshine weather conditions,the snow identification accuracy of MOD10A1 reaches to 50.6%;but the average of snow identification rate was only 18% when it is cloudy or overcast;3) The condition of underlying surface is another factor affecting the MOD10A1 classification results,such as,under clear sky conditions,the precision of snow identified by MOD10A1 is 68% for grasslands with sparse trees and shrubs;in desert,the snow identification rate is 64.4%,and only 40% for agricultural land and 4) It can better eliminate the influence of amount of clouds and improve the snow classification precision for MOD10A2 products,as a result,the mean precision of snow identification is 87.5%,which can reflect better the ground snow distribution and plays an important role in snow disaster monitoring in pastoral areas.

DOI

[14]
Hulley G C, Hook S J, 2009. Intercomparison of versions 4, 4.1 and 5 of the MODIS land surface temperature and emissivity products and validation with laboratory measurements of sand samples from the Namib Desert, Namibia.Remote Sensing of Environment, 113: 1313-1318.Eight new refinements were implemented in the MODIS Land Surface Temperature and Emissivity (LST&E) product suite when transitioning from version 4 (V4) to version 5 (V5). The refinements were designed to improve the spatial coverage, stability, and accuracy of the product suite. Version 4.1 (V4.1) is an interim collection which uses V5 input products (MOD02, MOD03, MOD07, MOD10, and MOD35), but the LST&E retrieval algorithm is unchanged from V4 in which the split-window and day/night temperature retrieval algorithms are only partially incorporated, and not fully incorporated as in V5. A test dataset for the V4.1 product was produced by MODAPS for a 3-month period from July through September 2004, and after an initial evaluation period, it was decided to generate the V4.1 product from mission period 2007001 onwards as a continuation of previous years of V4 data. This paper compares MODIS retrieved surface emissivities between V4, V4.1 and V5 using the level-3 MODIS daily LST&E product, MOD11B1.Comparisons of MOD11B1 retrieved surface emissivity during the Jul ep 2004 test period with lab measurements of sand samples collected at the Namib desert, Namibia result in a combined mean absolute emissivity difference for bands 29 (8.55 m), 31 (11 m) and 32 (12 m) of 1.06%, 0.65% and 1.93% for V4, V4.1 and V5 respectively. Maximum band 29 emissivity differences with the lab results were 4.10%, 2.96% and 8.64% for V4, V4.1 and V5 respectively. These results indicate that over arid and semi-arid areas, users should consider using MODIS V4 or V4.1 data instead of V5. Furthermore, users should be careful not to develop time series from a mixture of product versions that could introduce artifacts at version boundaries.

DOI

[15]
Jin X, Ke C Q, Xu Y Y et al., 2015. Spatial and temporal variations of snow cover in the Loess Plateau, China.International Journal of Climatology, 35: 1721-1731.ABSTRACT Using 8-day snow cover data of the Moderate Resolution Imaging Spectroradiometer from 2003 to 2013, we combined MOD10A2 and MYD10A2 to remove clouds and analysed the spatial and temporal variations of snow cover in the Loess Plateau, China. The snow cover throughout the entire Loess Plateau, including its central, southeast, and northwest sub-regions, exhibits consistent seasonal trends. The majority of snow cover is present from early November to late March, including four sub-cycles that involve separated snow cover accumulation and ablation processes. The maximum snow-covered area occurs in January with an areal extent of 1652426500065km2, whereas the minimum snow-covered area is observed from May to August. There is an evident relationship between snow cover distribution and elevation. The majority of snow cover is located in the central sub-region, whereas the lowest amount of snow cover exists in the northwest sub-region. In the examined 1165years, the snow cover area and snow cover days fluctuated considerably without a significant trend. A significantly negative correlation between snow cover and intra-annual temperature variation is observed. The monthly snow cover is found to correspond well with the Siberian High Central Intensity, particularly evident in November 2005, December 2007, December 2009, and December 2011. The response of the snow cover to the El Ni09o Southern Oscillation event was relatively weak, except for the significant cold event in late 2007 to early 2008 that caused a significantly positive snow cover anomaly.

DOI

[16]
Klein A G, Barnett A C, 2003. Validation of daily MODIS snow cover maps of the upper Rio Grande River Basin for the 2000-2001 snow year.Remote Sensing of Environment, 86: 162-176.Snow cover represents an important water resource for the Upper Rio Grande River Basin of Colorado and New Mexico. Accuracy assessment of MODIS snow products was accomplished using Geographic Information System (GIS) techniques. Daily snow cover maps produced from Moderate Resolution Imaging Spectroradiometer (MODIS) data were compared with operational snow cover maps produced by the National Operational Hydrologic Remote Sensing Center (NOHRSC) and against in situ Snowpack Telemetry (SNOTEL) measurements for the 2000 2001 snow season. Over the snow season, agreement between the MODIS and NOHRSC snow maps was high with an overall agreement of 86%. However, MODIS snow maps typically indicate a higher proportion of the basin as being snow-covered than do the NOHRSC snow maps. In particular, large tracts of evergreen forest on the western slopes of the San de Cristo Range, which comprise a large portion of the eastern margin of the basin, are more consistently mapped as snow-covered in the MODIS snow products than in the NOHRSC snow products. NOHRSC snow maps, however, typically indicate a greater proportion of the central portion of the basin, predominately in cultivated areas, as snow. Comparisons of both snow maps with in situ SNOTEL measurements over the snow season show good overall agreement with overall accuracies of 94% and 76% for MODIS and NOHRSC, respectively. A lengthened comparison of MODIS against SNOTEL sites, which increases the number of comparisons of snow-free conditions, indicates a slightly lower overall classification accuracy of 88%. Errors in mapping extra snow and missing snow by MODIS are comparable, with MODIS missing snow in approximately 12% of the cases and mapping too much snow in 15% of the cases. The majority of the days when MODIS fails to map snow occurs at snow depths of less than 4 cm.

DOI

[17]
Li H, Wang J, Bai Y et al., 2009. The snow hydrological processes during a representative snow cover period in Binggou Watershed in the upper reaches of Heihe River.Journal of Glaciology and Geocryology, 31: 294-300. (in Chinese)The snow hydrological process in Binggou watershed in the upper reaches of Heihe River is described synthetically in this article,and the special snow characteristics in the watershed are analyzed in detail in a framework of snow-frozen soil-runoff.Snow sublimation and melt are calculated by the energy balance methods.The changes of water content and thermal properties of the frozen soil and the snowmelt runoff in Binggou watershed are analyzed too.The importance of blowing snow is illustrated especially.The results indicate that sublimation accounted for respectively 189.6% and 164.7% of precipitation in January and February in the 2008 snow cover period.The proportion decreased to 71.8% in March,while this proportion was 3.5% in April.Snow sublimation changes periodically along with snowpack and meteorological conditions.Wind speed accelerates snow sublimation and redistributes snowpack in a large scale;however,this influence is reduced with increasing air temperature and snowmelt.The soil temperature in different depths increases after the middle February with increasing air temperature and reaches a stable condition.Snowmelt which occurs in the early snowmelt season can infiltrate into frozen soil because of the existence of soil cracks.With increasing air temperature,the soil water content changes following the snowmelt process.At the end of snowmelt period,the active layer water content of the frozen soil reaches a constant.Snowmelt season began on March 12,followed by three large-scale melt processes.The snowpack melts and refreezes in the early snowmelt season,causing ice to accumulate in the valley and moves slowly.The difference between the maximum and minimum runoff increases and the runoff increases day by day.The sum of snowmelt runoff was 3.98 106m3 in the whole snowmelt season.

DOI

[18]
Li H, Wang J, Hao X, 2014. Role of blowing snow in snow processes in Qilian mountainous region.Sciences in Cold and Arid Regions, 6: 124-130.

[19]
Liang T G, Huang X D, Wu C X et al., 2008. An application of MODIS data to snow cover monitoring in a pastoral area: A case study in northern Xinjiang, China.Remote Sensing of Environment, 112: 1514-1526.Snow is an important land cover on the earth's surface. It is characterized by its changing nature. Monitoring snow cover extent plays a significant role in dynamic studies and prevention of snow-caused disasters in pastoral areas. Using NASA EOS Terra/MODIS snow cover products and in situ observation data during the four snow seasons from November 1 to March 31 of year 2001 to 2005 in northern Xinjiang area, the accuracy of MODIS snow cover mapping algorithm under varied snow depth and land cover types was analyzed. The overall accuracy of MODIS daily snow cover mapping algorithm in clear sky condition is high at 98.5%; snow agreement reaches 98.2%, and ranges from 77.8% to 100% over the 4-year period for individual sites. Snow depth (SD) is one of the major factors affecting the accuracy of MODIS snow cover maps. MODIS does not identify any snow for SD less than 0.5cm. The overall accuracy increases with snow depth if SD is equal to or greater than 3cm, and decreases for SD below 3cm. Land cover has an important influence in the accuracy of MODIS snow cover maps. The use of MOD10A1 snow cover products is severely affected by cloud cover. The 8-day composite products of MOD10A2 can effectively minimize the effect of cloud cover in most cases. Cloud cover in excess of 10% occurs on 99% of the MOD10A1 products and 14.7% of the MOD10A2 products analyzed during the four snow seasons. User-defined multiple day composite images based on MOD10A1, with flexibilities of selecting composite period, starting and ending date and composite sequence of MOD10A1 products, have an advantage in effectively monitoring snow cover extent for regional snow-caused disasters in pastoral areas.

DOI

[20]
Liu G, Wu R, Zhang Y et al., 2014. The summer snow cover anomaly over the Tibetan Plateau and its association with simultaneous precipitation over the mei-yu-baiu region.Advances in Atmospheric Sciences, 31: 755-764.

DOI

[21]
Liu J, Yang J, Chen R, 2007. Annual variations of snow cover and its relation to air temperature and precipitation in Dongkemadi River Basin in the source regions of the Yangtze River.Journal of Glaciology and Geocryology, 29: 862-868. (in Chinese)On the basis of 500-meter resolution MODIS10A2 snow products,in this paper,the spatial characteristics of snow cover and the change of fraction of snow coverage from January 2005 to September 2006 are analyzed,also the relations are studied between snow cover and precipitation,snow cover and air temperature from May to September in the Dongkemadi River Basin in the source regions of Yangtze River,in 2005.The results showed that the distribution of snow was at the tops and slopes of mountains,the top and front of glacier,and little of snow was distributed at the flat river valley;The right side of the river had much more snow cover than the left side;In the warmer season,because of more precipitation and high air temperature,the snow was mainly distributed at the top of glacier;As a special ground conditions,the marshy meadow or frost mound also affected the spatial distribution of snow.The fraction of snow coverage monitored for two years showed that from January to April,because of little precipitation and low air temperature,the fraction of snow coverage changed drastically.In May,precipitation gradually increased,but the increased air temperature made the fraction of snow coverage also changed drastically;the relatively more precipitation and low temperature resulted in the fraction of snow coverage being above 80% form October to November;precipitation was in a solid state but snow was melted quickly from June to August,because of relatively high air and ground temperature,so the fraction of snow coverage was relatively small.The analyses of snow cover and air temperature from May to September in 2005 show that the relation between snow cover and precipitation was not significant,but air temperature was the main factor affecting the snow cover.Precipitation state from rain to sleet and then to snow was the main reason for the non-evident relation between snow cover and precipitation from May to September.

DOI

[22]
Marchane A, Jarlan L, Hanich L et al., 2015. Assessment of daily MODIS snow cover products to monitor snow cover dynamics over the Moroccan Atlas mountain range.Remote Sensing of Environment, 160: 72-86.In semi-arid Mediterranean areas, the snow in the mountains represents an important source of water supply for many people living downstream. This study assessed the daily MODIS fractional snow-covered area (FSC) products over seven catchments with a mixed snow–rain hydrological regime, covering the Atlas chain in Morocco. For this purpose, more than 4760 daily MODIS tiles (MOD10A1 version 5) from September 2000 to June 2013 were processed, based on a spatio-temporal filtering algorithm aiming at reducing cloud coverage and the problem of discrimination between snow and cloud. The number of pixels identified as cloudy was reduced by 96% from 22.6% to 0.8%. In situ data from five snow stations were used to investigate the relative accuracy of MODIS snow products. The overall accuracy is equal to 89% (with a 0.102m. threshold for snow depth). The timing of the seasonal snow was also correctly detected with 11.402days and 9.402days of average errors with almost no bias for onset and ablation dates, respectively. The comparison of the FSC products to a series of 15 clear sky FORMOSAT-2 images at 802m resolution in the Rheraya sub-basin near to Marrakech showed a good correlation of the two datasets (r02=020.97) and a reasonable negative bias of 61022702km 2 . Finally, the FSC products were analyzed through seasonal indicators including onset and melt-out dates, the Snow Cover Duration (SCD) and the maximum snow cover extent (SCAmax) at the catchment level: (1) the dynamic of the snow cover area is characterized by a very strong inter-annual signal with a variation coefficient of the SCAmax reaching 77%; (2) there is no evidence of a statistically significant long-term trend although results have pointed out that the SCD increased in February–March and, to a lesser extent, decreased in April–May for the 2000–2013 period. The study concludes that the daily MODIS product can be used with reasonable confidence to map snow cover in the South Mediterranean area despite difficult detection conditions.

DOI

[23]
Mishra B, Babel M S, Tripathi N K, 2013. Analysis of climatic variability and snow cover in the Kaligandaki River Basin, Himalaya, Nepal.Theoretical and Applied Climatology, 116: 681-694.Various remote sensing products and observed data sets were used to determine spatial and temporal trends in climatic variables and their relationship with snow cover area in the higher Himalayas, Nepal. The remote sensing techniques can detect spatial as well as temporal patterns in temperature and snow cover across the inaccessible terrain. Non-parametric methods (i.e. the Mann–Kendall method and Sen's slope) were used to identify trends in climatic variables. Increasing trends in temperature, approximately by 0.03 to 0.0802°C02year 611 based on the station data in different season, and mixed trends in seasonal precipitation were found for the studied basin. The accuracy of MOD10A1 snow cover and fractional snow cover in the Kaligandaki Basin was assessed with respect to the Advanced Spaceborne Thermal Emission and Reflection Radiometer-based snow cover area. With increasing trends in winter and spring temperature and decreasing trends in precipitation, a significant negative trend in snow cover area during these seasons was also identified. Results indicate the possible impact of global warming on precipitation and snow cover area in the higher mountainous area. Similar investigations in other regions of Himalayas are warranted to further strengthen the understanding of impact of climate change on hydrology and water resources and extreme hydrologic events.

DOI

[24]
Morán-Tejeda E, López-Moreno J I, Beniston M, 2013. The changing roles of temperature and precipitation on snowpack variability in Switzerland as a function of altitude.Geophysical Research Letters, 40: 2131-2136.In this study, we assess the role of altitude in determining the relative performance of temperature and precipitation as predictors of snowpack variability in Switzerland. The results indicate a linear relationship between altitude and the correlation of temperature (precipitation) with snowpack depth and duration. We identify a threshold altitude of approximately 1400 m a.s.l. ( 200 m, depending on the snow index considered), below which temperature is the main explanatory variable and above which precipitation is a better predictor of snowpack variability. The results also highlight that as climate warms, the altitude at which temperature is the main constraint on snow accumulation increases. This has important implications for the future viability of snow-dependent economic sectors in Switzerland, where projections indicate a continuous warming during the course of the 21st century.

DOI

[25]
Raleigh M S, Rittger K, Moore C E et al., 2013. Ground-based testing of MODIS fractional snow cover in subalpine meadows and forests of the Sierra Nevada.Remote Sensing of Environment, 128: 44-57.The Moderate Resolution Imaging Spectroradiometer (MODIS) is used widely for mapping snow cover in climate and hydrologic systems, but its accuracy is reduced in forests due to canopy obstruction. Prior validation datasets cannot quantify MODIS errors in forests, because finer-resolution passive sensors (e.g., Landsat) encounter the same canopy errors, and operational ground-based networks sample snow in clearings where snow dynamics differ from those in the forest. To assess MODIS accuracy relative to forest cover, we applied a common canopy adjustment to daily 50002m fractional snow-covered area (f SCA ) from the physically-based MODIS Snow-Covered Area and Grain size (MODSCAG) algorithm, and tested it at subalpine meadow and forest sites (0.2502km 2 –102km 2 ) in the Sierra Nevada, California during two snow seasons. 37 to 89 sensors monitored hourly ground temperature at these sites. Damped diurnal variations provided a signal for snow presence due to the insulating properties of snow, yielding daily ground-based f SCA at each site. Ground-based f SCA values were validated in a canopy-free area of a meadow site using time-lapse imagery and 1502m snow maps from the Advanced Spaceborne Thermal Emission and Reflection Radiometer (ASTER). Ground-based f SCA had high correlation (R 2 02=020.98) with time-lapse data and was within 0.05 of ASTER f SCA . Comparisons between MODSCAG and ground-based f SCA revealed that an underestimation bias remained in the canopy-adjusted MODSCAG f SCA , ranging from 61020.09 to 61020.22 at the meadow sites and from 61020.09 to 61020.37 at the forest sites. Improved canopy adjustment methods are needed for MODIS f SCA .

DOI

[26]
She J, Zhang Y, Li X et al., 2015. Spatial and temporal characteristics of snow cover in the Tizinafu Watershed of the Western Kunlun Mountains.Remote Sensing, 7: 3426-3445.The Tizinafu watershed has a complex mountainous terrain in the western Kunlun Mountains; little study has been done on the spatial and temporal characteristics of snow cover in the region. Daily snow cover data of 10 hydrological years (October 2002 to September 2012) in the watershed were generated by combining MODIS Terra (MOD10A1) and Aqua (MYD10A1) snow cover products and employing a nine-day temporal filter for cloud reduction. The accuracy and window size of the temporal filter were assessed using a simulation approach. Spatial and temporal characteristics of snow cover in the watershed were then analyzed. Our results showed that snow generally starts melting in March and reaches the minimum in early August in the watershed. Snow cover percentages (SCPs) in all five elevation zones increase consistently with the rise of elevation. Slope doesn play a major role in snow cover distribution when it exceeds 10 . The largest SCP difference is between the south and the other aspects and occurs between mid-October and mid-November with decreasing SCP, indicating direct solar radiation may cause the reduction of snow cover. While both the mean snow cover durations (SCDs) of the hydrological years and of the snowmelt seasons share a similar spatial pattern to the topography of the watershed, the coefficient of variation of the SCDs exhibits an opposite spatial distribution. There is a significant correlation between annual mean SCP and annual total stream flow, indicating that snowmelt is a major source of stream runoff that might be predictable with SCP.

DOI PMID

[27]
Spiess M, Maussion F, Möller M et al., 2015. MODIS derived equilibrium line altitude estimates for Purogangri Ice Cap, Tibetan Plateau, and their relation to climatic predictors (2001-2012). Geografiska Annaler: Series A,Physical Geography, 97: 599-614.

[28]
Szczypta C, Gascoin S, Houet T et al., 2015. Impact of climate and land cover changes on snow cover in a small Pyrenean catchment.Journal of Hydrology, 521: 84-99.The seasonal snow in the Pyrenees Mountains is an essential source of runoff for hydropower production and crop irrigation in Spain and France. The Pyrenees are expected to undergo strong environmental perturbations over the 21st century because of climate change (rising temperatures) and the abandonment of agro-pastoral areas (reforestation). Both changes are happening at similar timescales and are expected to have an impact on snow cover. The effect of climate change on snow in the Pyrenees is well understood, but the effect of land cover changes is much less documented. Here, we analyze the response of snow cover to a combination of climate and land cover change scenarios in a small Pyrenean catchment (Bassiès, 14.502km 2 , elevation range 940–265102m a.s.l.) using a distributed snowpack evolution model. Climate scenarios were constructed from the output of regional climate model projections, whereas land cover scenarios were generated based on past observed changes and an inductive pattern-based model. The model was validated over a snow season using in situ snow depth measurements and high-resolution snow cover maps derived from SPOT (Satellite Pour l’Observation de la Terre – Earth Observation Satellite) satellite images. Model projections indicate that both climate and land cover changes reduce the mean snow depth. However, the impact on the snow cover duration is moderated in reforested areas by the shading effect of trees on the snow surface radiation balance. Most of the significant changes are expected to occur in the transition zone between 150002m a.s.l. and 200002m a.s.l. where (i) the projected increase in air temperatures decreases the snow fraction of the precipitation and (ii) the land cover changes are concentrated. However, the consequences on the runoff are limited because most of the meltwater originates from high-elevation areas of the catchment, which are less affected by climate change and reforestation.

DOI

[29]
Tahir A A, Chevallier P, Arnaud Y et al., 2015. Snow cover trend and hydrological characteristics of the Astore River basin (Western Himalayas) and its comparison to the Hunza basin (Karakoram region).The Science of the Total Environment, 505: 748-761.A large proportion of Pakistan's irrigation water supply is taken from the Upper Indus River Basin (UIB) in the Himalaya–Karakoram–Hindukush range. More than half of the annual flow in the UIB is contributed by five of its snow and glacier-fed sub-basins including the Astore (Western Himalaya — south latitude of the UIB) and Hunza (Central Karakoram — north latitude of the UIB) River basins. Studying the snow cover, its spatio-temporal change and the hydrological response of these sub-basins is important so as to better manage water resources. This paper compares new data from the Astore River basin (mean catchment elevation, 410002m above sea level; m02asl afterwards), obtained using MODIS satellite snow cover images, with data from a previously-studied high-altitude basin, the Hunza (mean catchment elevation, 465002m02asl). The hydrological regime of this sub-catchment was analyzed using the hydrological and climate data available at different altitudes from the basin area. The results suggest that the UIB is a region undergoing a stable or slightly increasing trend of snow cover in the southern (Western Himalayas) and northern (Central Karakoram) parts. Discharge from the UIB is a combination of snow and glacier melt with rainfall-runoff at southern part, but snow and glacier melt are dominant at the northern part of the catchment. Similar snow cover trends (stable or slightly increasing) but different river flow trends (increasing in Astore and decreasing in Hunza) suggest a sub-catchment level study of the UIB to understand thoroughly its hydrological behavior for better flood forecasting and water resources management.

DOI PMID

[30]
Tang Z, Wang J, Li H et al., 2013. Spatiotemporal changes of snow cover over the Tibetan Plateau based on cloud-removed moderate resolution imaging spectroradiometer fractional snow cover product from 2001 to 2011.Journal of Applied Remote Sensing, 7: 073582.Snow cover changes over the Tibetan plateau (TP) are examined using moderate resolution imaging spectroradiometer (MODIS) daily fractional snow cover (FSC) data from 2001 to 2011 as well as in situ temperature data. First, the accuracy of the MODIS FSC data under clear sky conditions is evaluated by comparing with Landsat 30-m observations. Then we describe a cloud-gap-filled (CGF) method using cubic spline interpolation algorithm to fill in data gaps caused by clouds. Finally, the spatial and temporal changes of snow cover are analyzed on the basis of the MODIS-derived snow-covered area and snow-covered days (SCD) data. Results show that the mean absolute error of MODIS FSC data under clear sky condition is about 0.098 over the TP. The CGF method is efficient in cloud reduction (overall mean absolute error of the retrieved FSC data is 0.092). There is a very high inter-annual and intra-seasonal variability of snow cover in the 11 years. The higher snow cover corresponds well with the huge mountains. The accumulation and melt periods of snow cover vary in different elevation zones. About 34.14% (5.56% with a significant decline) and 24.75% (3.9% with a significant increase) of the study area presents declining and increasing trend in SCD, respectively. The inter-annual fluctuation of snow cover can be explained by the high negative correlations observed between the snow cover and the in situ temperature, especially in some elevations of February, April, May, August, and September.

DOI

[31]
Wan Z, 2008. New refinements and validation of the MODIS land-surface temperature/emissivity products.Remote Sensing of Environment, 112: 59-74.This paper discusses the lessons learned from analysis of the Moderate Resolution Imaging Spectroradiometer (MODIS) Land-Surface Temperature/Emissivity (LST) products in the current (V4) and previous versions, and presents eight new refinements for V5 product generation executive code (PGE16) and the test results with real Terra and Aqua MODIS data. The major refinements include considering surface elevation when using the MODIS cloudmask product, removal of temporal averaging in the 102km daily level-3 LST product, removal of cloud-contaminated LSTs in level-3 LST products, and the refinements for the day/night LST algorithm. These refinements significantly improved the spatial coverage of LSTs, especially in highland regions, and the accuracy and stability of the MODIS LST products. Comparisons between V5 LSTs and in-situ values in 47 clear-sky cases (in the LST range from 61 10 °C to 58 °C and atmospheric column water vapor range from 0.4 to 3.502cm) indicate that the accuracy of the MODIS LST product is better than 102K in most cases (39 out of 47) and the root of mean squares of differences is less than 0.702K for all 47 cases or 0.502K for all but the 8 cases apparently with heavy aerosol loadings. Emissivities retrieved by the day/night algorithm are well compared to the surface emissivity spectra measured by a sun-shadow method in two field campaigns. The time series of V5 MODIS LST product over two sites (Lake Tahoe in California and Namco lake in Tibet) in 2003 are evaluated, showing that the quantity and quality of MODIS LST products depend on clear-sky conditions because of the inherent limitation of the thermal infrared remote sensing.

DOI

[32]
Wang W, Huang X, Deng J et al., 2015. Spatio-temporal change of snow cover and its response to climate over the Tibetan Plateau based on an improved daily cloud-free snow cover product. Remote Sensing, 7: 169-194.Using new, daily cloud-free snow-cover products, this study examines snow cover dynamics and their response to climate change. The results demonstrate that the daily cloud-free snow-cover products not only posses the advantages of the AMSR-E (unaffected by weather conditions) and MODIS (relatively higher resolution) products, but are also characterized by high snow and overall classification accuracies (~85% and ~98%, respectively), substantially greater than those of the existing daily snow-cover products for all sky conditions and very similar to, or even slightly greater than, those of the daily MODIS products for clear-sky conditions. Using the snow-cover products, we analyzed the snow cover dynamics over the Tibetan Plateau and determined that the maximum number of snow-covered days (SCD) in a year followed a decreasing tendency from 2003 to 2010, with a decrease in snow-covered area (SCA) equivalent to 55.3% of the total Tibetan Plateau area. There is also a slightly increasing tendency in the maximum snow cover area (SCA), and a slightly decreasing tendency in the persistent snow cover area (i.e., pixels of SCD gt; 350 days) was observed for the 8-year period, which was characterized by increases in temperature (0.09 C/year) and in precipitation (0.26 mm/year). This suggests that, on the Tibetan Plateau, changes in temperature and precipitation exert a considerable influence on the regional SCD and SCA, as well as the distribution of persistent snow cover.

DOI

[33]
Wang X, Xie H, Liang T, 2008. Evaluation of MODIS snow cover and cloud mask and its application in northern Xinjiang, China.Remote Sensing of Environment, 112: 1497-1513.Using five-year (2001–2005) ground-observed snow depth and cloud cover data at 20 climatic stations in Northern Xinjiang, China, this study: 1) evaluates the accuracy of the 8-day snow cover product (MOD10A2) from the Moderate Resolution Imaging Spectroradiometer (MODIS)/Terra satellite, 2) generates a new snow cover time series by separating the MODIS cloud masked pixels as snow and land, and 3) examines the temporal variability of snow area extent (SAE) and correlations of air temperature and elevation with SAE. Results show that, under clear sky conditions, the MOD10A2 has high accuracies when mapping snow (94%) and land (99%) at snow depth ≥ 402cm, but a very low accuracy (< 39%) for patchy snow or thin snow depth (< 402cm). Most of the patchy snow is misclassified as land. The mean accuracy of the cloud mask used in MOD10A2 for December, January and February is very low (19%). Based on the ratio of snow to land of ground observations in each month, the new snow cover time series generated in this study provides a better representation of actual snow cover for the study area. The SAE (%) time series exhibits similar patterns during six hydrologic years (2001–2006), even though the accumulation and melt periods do not exactly coincide. The variation of SAE is negatively associated with air temperature over the range of 61 1002°C to 502°C. An increase in elevation generally results in longer periods of snow cover, but the influence of elevation on SAE decreases as elevation exceeds 402km in the Ili River Watershed (IRW). The number of days with snow cover shows either a decreasing trend or no trend in the IRW and the entire study area in the study period. This result is inconsistent with a reported increasing trend based on limited in situ observations. Long-term continuance of the MODIS snow cover product is critical to resolve this dilemma because the in situ observations appear to undersample the region.

DOI

[34]
Wang X, Zheng H, Chen Y et al., 2014. Mapping snow cover variations using a MODIS daily cloud-free snow cover product in Northeast China.Journal of Applied Remote Sensing, 8: 084681.Cloud contamination is one of the major barriers for wider applications of MODIS snow cover products. This study presents a cloud-removal approach, through multiday backward replacements based on Terra and Aqua daily MODIS snow cover products (MOD10A1 and MYD10A1), to generate a series of daily cloud-free snow cover products for advanced applications (MODMYD_MC). The products are evaluated using in situ snow depth data measured during 2000 to 2010 at 53 weather stations in the Heilongjiang Province, northeast China. The results show that the annual mean cloud covers of MOD10A1, MYD10A1, MODMYD_DC (the daily combination of MOD10A1 and MYD10A1), and MODMYD_MC are 50%, 54%, 35%, and 0%, mean snow covers are 6%, 6%, 10%, and 19%, and their mean agreements of snow cover mapping are 42%, 40%, 51%, and 91%, respectively. The snow-covered days (SCDs) derived from MODMYD_MC are also in good agreement (91%) with those obtained from in situ observations. The MODMYD_MC snow cover images are then used to investigate the detailed variation of snow cover in the XiaoXing'AnLing watershed. The snow-covered area in the watershed has an increasing trend in the recent decade, with the minimum present in the 2002 (hydrologic year) and the maximum present in 2010. The plains with lower elevation show shorter SCD but larger interannual variations than in the mountainous areas. This study indicates that MODMYD_MC can be applied to monitor the spatiotemporal variations of snow cover in northeast China and elsewhere in the world.

DOI

[35]
Yang C, Zhao Z, Ni J et al., 2012. Temporal and spatial analysis of changes in snow cover in western Sichuan based on MODIS images. Science China Earth Sciences, 55: 1329-1335.We developed a method for analyzing the change in snow cover using MODIS imagery.The method was applied to images of western Sichuan Province,China taken between 2002 and 2008.The model for extracting data on snow cover from MODIS images was created by spectral analysis.The multi-temporal snow layers were used to evaluate the temporal and spatial change in the area under snow cover between 2002 and 2008 using overlay and statistical analysis in ARCGIS.The majority(60.4%) of western Sichuan was rarely covered by snow and only 0.3% was covered by perennial snow in 2002.Snow cover was pri-marily distributed in Garz锚 and Aba.The area under snow cover was significantly and negatively correlated with the average monthly temperature and rainfall in 2002.The largest area under snow cover was measured in 2006 and the smallest was in 2007.Similarly,the area of snowmelt was the highest in 2006 and lowest in 2007.In general,the elevation of the snow line in-creased throughout the period 2002-2008;however,the elevation decreased in some years.Our results provide an important insight into the distribution of snow in this region,and may be useful for climate modeling and predicting the availability of water resources and the occurrence of floods and droughts.

DOI

[36]
Zhou X, Xie H, Hendrickx J M H, 2005. Statistical evaluation of remotely sensed snow-cover products with constraints from streamflow and SNOTEL measurements. Remote Sensing of Environment, 94: 214-231.Using streamflow and Snowpack Telemetry (SNOTEL) measurements as constraints, the evaluation of the Moderate Resolution Imaging Spectroradiometer (MODIS) daily and 8-day snow-cover products is carried out using the Upper Rio Grande River Basin as a test site. A time series of the snow areal extent (SAE) of the Upper Rio Grande Basin is retrieved from the MODIS tile h09v05 covering the time period from February 2000 to June 2004 using an automatic Geographic Information System (GIS)-based algorithm developed for this study. Statistical analysis between the streamflow at Otowi (NM) station and the SAE retrieved from the two MODIS snow-cover products shows that there is a statistically significant correlation between the streamflow and SAE for both products. This relationship can be disturbed by heavy rainstorms in the later springtime, especially in May. Correlation analyses show that the MODIS 8-day product has a better correlation ( r= 0.404) with streamflow and has less percentage of spurious snowmelt events in wintertime than the MODIS daily product ( r= 0.300). Intercomparison of these two products, with the SNOTEL data sets as the ground truth, shows that (1) the MODIS 8-day product has higher classification accuracy for both snow and land; (2) the omission error of misclassifying snow as land is similar for both products, both are low; (3) the MODIS 8-day product has a slightly higher commission error of misclassifying land as snow than the MODIS daily product; and (4) the MODIS daily product has higher omission errors of misclassifying both snow and land as clouds. Clouds are the major cause for reduction of the overall accuracy of the MODIS daily product. Improvement in suppressing clouds in the 8-day product is obvious from this comparison study. The sacrifice is the temporal resolution that is reduced from 1 to 8 days. The significance of the results is that the 8-day product will be more useful in evaluating the streamflow response to the snow-cover extent changes, especially from the long-term point of view considering its lower temporal resolution than the daily product. For clear days, the MODIS daily algorithm works quite well or even better than the MODIS 8-day algorithm.

DOI

Outlines

/