
Journal of Geographical Sciences >
Status of land use intensity in China and its impacts on land carrying capacity
Author: Yan Huimin (1974-), PhD, specialized in land use change. E-mail: yanhm@igsnrr.ac.cn
Received date: 2016-08-20
Accepted date: 2016-10-12
Online published: 2017-04-20
Supported by
National Key Research and Development Program of China, No.2016YFC0503500, No.2016YFC0503700
Copyright
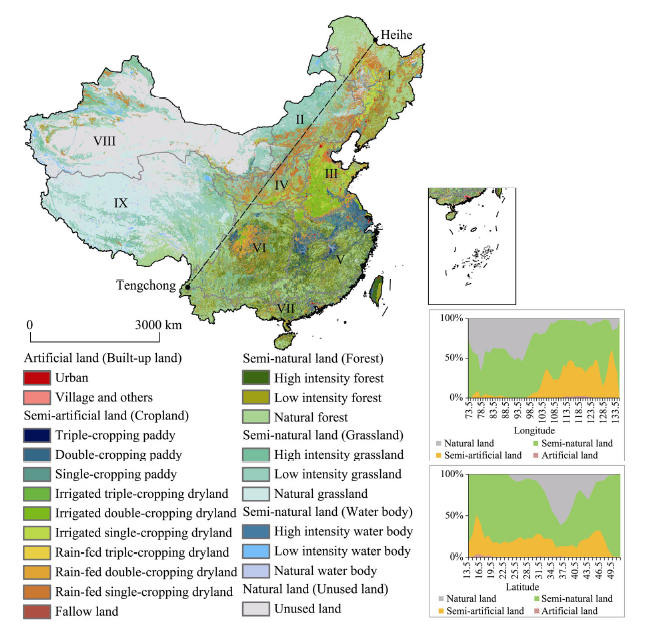
Land use intensity quantifies the impacts of human activities on natural ecosystems, which have become the major driver of global environmental change, and thus it serves as an essential measurement for assessing land use sustainability. To date, land-change studies have mainly focused on changes in land cover and their effects on ecological processes, whereas land use intensity has not yet received the attention it deserves and for which spatially-explicit representation studies have only just begun. In this paper, according to the degree and reversibility of surface disturbance by human activities, there are four main classes of land use intensity: artificial land, semi-artificial land, semi-natural land, and natural land. These were further divided into 22 subclasses based on key indicators, such as human population density and the cropping intensity. Land use intensity map of China at a 1-km spatial resolution was obtained based on satellite images and statistical data. The area proportions of artificial land, semi-artificial land, semi-natural land, and natural land were 0.71%, 19.36%, 58.93%, and 21%, respectively. Human and economic carrying capacity increased with the increase of land use intensity. Artificial land supports 24.58% and 35.62% of the total population and GDP, using only 0.71% of the total land, while semi-artificial land supported 58.24% and 49.61% of human population and GDP with 19.36% of China’s total land area.
YAN Huimin , LIU Fang , LIU Jiyuan , XIAO Xiangming , QIN Yuanwei . Status of land use intensity in China and its impacts on land carrying capacity[J]. Journal of Geographical Sciences, 2017 , 27(4) : 387 -402 . DOI: 10.1007/s11442-017-1383-7
Table 1 Land use intensity classification system |
| Class | Subclass | Description |
|---|---|---|
| Artificial land (Built-up land) | Urban | Dense built environments with very high population density |
| Village and others | Rural settlements, factories, and transportation facilities with high population but fragmented landscape | |
| Semi-artificial land (Cropland) | Triple-cropping paddy | Cropland mainly for triple paddy rice |
| Double-cropping paddy | Cropland mainly for double paddy rice | |
| Single-cropping paddy | Cropland mainly for single paddy rice | |
| Irrigated triple-cropping dryland | Dryland mainly for irrigated triple crop | |
| Irrigated double-cropping dryland | Dryland mainly for irrigated double crop | |
| Irrigated single-cropping dryland | Dryland mainly for irrigated single crop | |
| Rain-fed triple-cropping dryland | Rain-fed dryland with triple cropping | |
| Rain-fed double-cropping dryland | Rain-fed dryland with double cropping | |
| Rain-fed single-cropping dryland | Rain-fed dryland with single cropping | |
| Fallow land | Cropland left idle during the growing season | |
| Semi-natural land (Forest, Grassland, Water body) | High intensity forest | Forest with high human population density (>100 persons/km2) |
| Low intensity forest | Forest with low human population density (1-100 persons/km2) | |
| Natural forest | Forest with negligible human population density (>1 person/km2) | |
| High intensity grassland | Grassland with high livestock population density (>10 TLU/km2) | |
| Low intensity grassland | Grassland with low livestock population density (1-10 TLU /km2) | |
| Natural grasslandl water | Grassland with negligible livestock population density (<1 TLU /km2) | |
| High intensity water body | Water body located in county with high human population density (>100 persons/km2) | |
| Low intensity water body | Water body located in county with low human population density (1-100 persons/km2) | |
| Natural water body | Water body located in county with negligible human population density (<1 person/km2) | |
| Natural land (Unused land) | Unused land | Sandy land, Gobi, salina, wetland, bare soil and bare rock |
Figure 1 Land use intensity map of China in 2000. Ecological Regions include Northeast Region (I), Inner Mongolia and the Great Wall Region (II), Huang-Huai-Hai Region (III), Loess Plateau Region (IV), Middle and Lower Reaches of the Yangtze River Region (V), Southwest Region (VI), South China Region (VII), Gan-Xin Region (VIII) and Qinghai-Tibet Region (IX). |
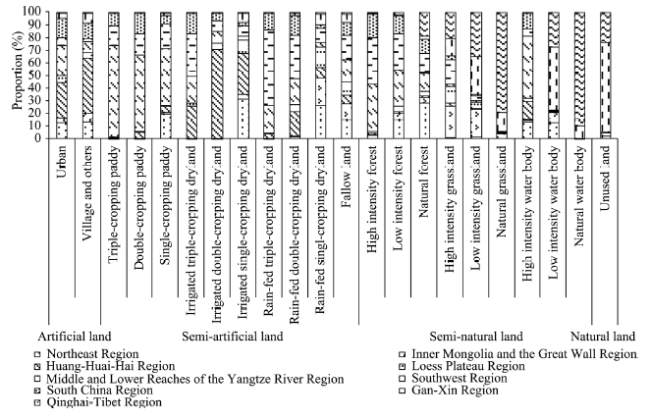
Figure 2 Area proportions of the 22 land use intensity subclasses distributed in 9 ecological regions of China |
Table 2 Proportions of land area under four land use intensity classes in 9 ecological regions of China (%) |
| Regions | Artificial land | Semi-artificial land | Semi-natural land | Natural land |
|---|---|---|---|---|
| Northeast Region | 13.20 | 17.88 | 10.12 | 2.20 |
| Inner Mongolia and the Great Wall Region | 5.42 | 8.74 | 10.22 | 2.87 |
| Huang-Huai-Hai Region | 35.57 | 19.22 | 1.09 | 0.11 |
| Loess Plateau Region | 5.10 | 8.81 | 4.23 | 0.07 |
| Middle and Lower Reaches of the Yangtze River Region | 15.98 | 18.81 | 10.80 | 0.10 |
| Southwest Region | 4.64 | 14.65 | 12.99 | 0.03 |
| South China Region | 13.62 | 6.15 | 6.56 | 0.02 |
| Gan-Xin Region | 5.78 | 5.07 | 12.89 | 70.93 |
| Qinghai-Tibet Region | 0.70 | 0.66 | 31.09 | 23.67 |
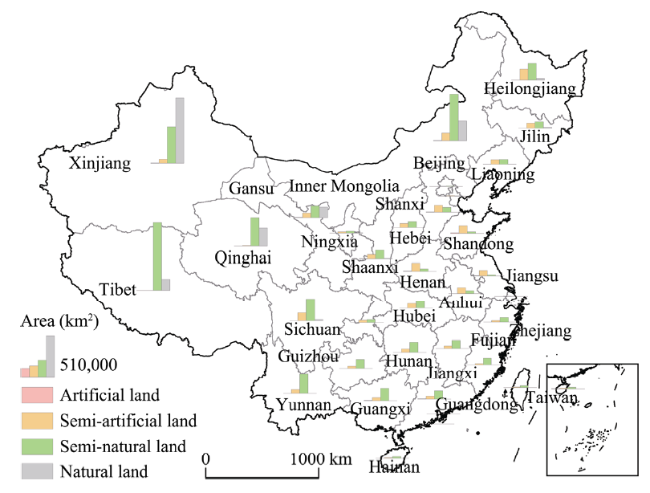
Figure 3 Area statistics on the land use intensity classes in each province of China |
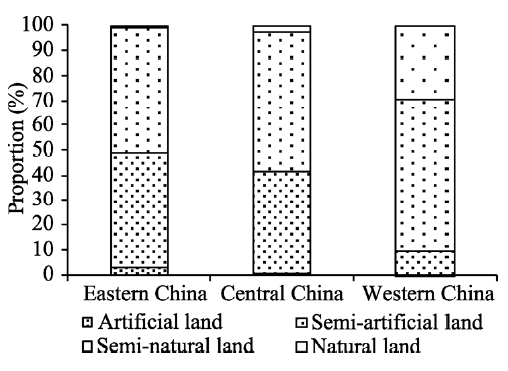
Figure 4 Proportions of the four land use intensity classes in Eastern, Central, and Western China |
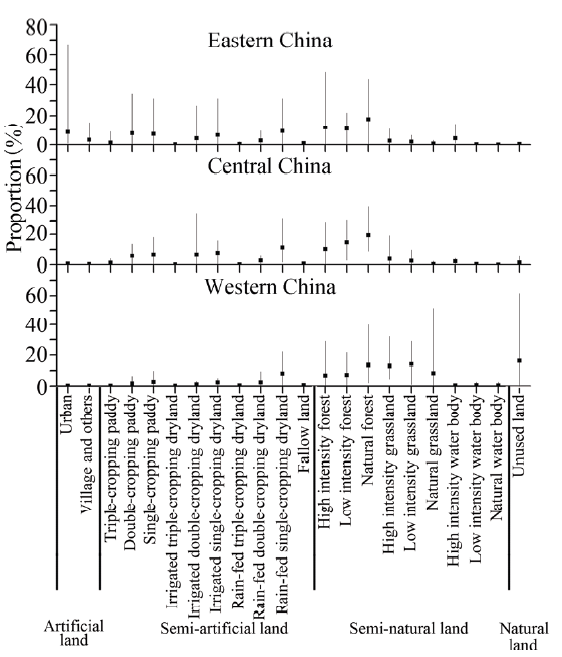
Figure 5 Proportions of the land use intensity subclasses in Eastern, Central, and Western China (diamonds are means, error bars depict min-max range) |
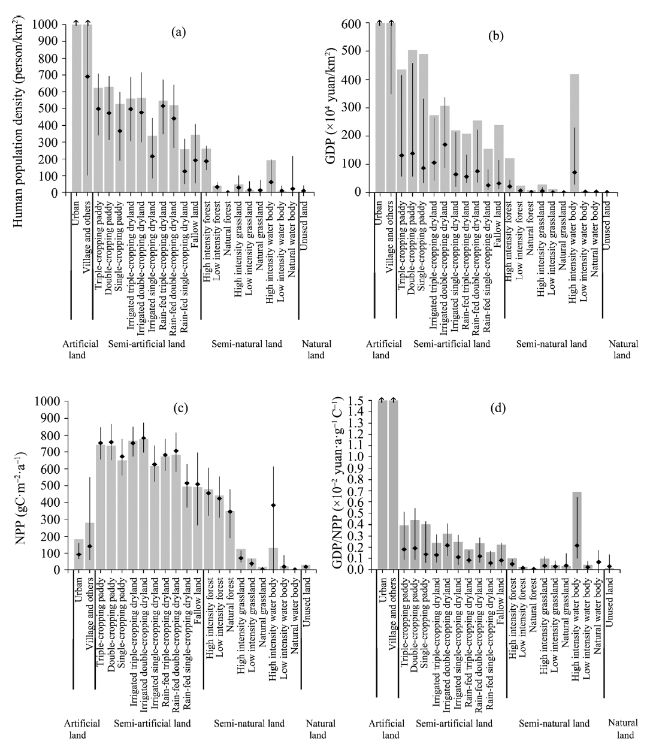
Figure 6 Statistics on population carrying capacity (a), economic carrying capacity (b), NPP (c), and land use efficiency (d) at the different levels of land use intensity. Bars represent the area-weighted means, diamonds are medians; error bars depict inter-quartile range. |
The authors have declared that no competing interests exist.
| [1] |
|
| [2] |
|
| [3] |
|
| [4] |
|
| [5] |
|
| [6] |
|
| [7] |
|
| [8] |
|
| [9] |
|
| [10] |
|
| [11] |
|
| [12] |
|
| [13] |
|
| [14] |
FAOSTAT (Food and Agriculture Organization of the United Nations, Statistical Databases), 2011. FAOSTAT, FAO Statistical Databases: Agriculture, Fisheries, Forestry, Nutrition.
|
| [15] |
|
| [16] |
|
| [17] |
|
| [18] |
|
| [19] |
|
| [20] |
|
| [21] |
|
| [22] |
|
| [23] |
|
| [24] |
|
| [25] |
|
| [26] |
|
| [27] |
|
| [28] |
|
| [29] |
|
| [30] |
|
| [31] |
|
| [32] |
|
| [33] |
|
| [34] |
|
| [35] |
|
| [36] |
|
| [37] |
|
| [38] |
|
| [39] |
|
| [40] |
|
| [41] |
|
| [42] |
|
| [43] |
|
| [44] |
|
| [45] |
|
| [46] |
|
| [47] |
|
| [48] |
|
| [49] |
|
| [50] |
|
| [51] |
|
| [52] |
|
| [53] |
|
| [54] |
|
| [55] |
|
| [56] |
|
| [57] |
|
| [58] |
|
/
| 〈 |
|
〉 |