Research Articles

Modeling urban housing price: The perspective of household activity demand

  • NIU Fangqu ,
  • LIU Weidong
Expand
  • Key Laboratory of Regional Sustainable Development Modeling, CAS, Institute of Geographic Sciences and Natural Resources Research, CAS, Beijing 100101, China

Author: Niu Fangqu (1979-), PhD, specialized in sustainable development modeling and analysis. E-mail:.

Received date: 2016-11-01

  Accepted date: 2016-12-15

  Online published: 2017-05-10

Supported by

National Natural Science Foundation of China, No.41101119, No.41530751

Copyright

Journal of Geographical Sciences, All Rights Reserved

Abstract

Existing studies about the modeling of urban housing price have figured out sets of factors and the main focus is on the relative spatial location. Generally, this line of research is descriptive rather than modeling in nature. The underlying reasons for the distribution of housing price are largely unexplored and more research is needed. The paper therefore attempted to systematically explore the spatial heterogeneities of urban housing price based on the urban activity interaction rule. Using Beijing as a case study, this study first developed a new measurement of accessibility which directly depicts the cost and possibilities to access opportunities of different activities such as employments, educational, shopping and medical services. From the perspective of demands of different households, the paper then modelled the relationships between urban housing price and these accessibilities and found that the distribution pattern of housing price can be relatively well represented by this model that the R2 could achieve 0.7. We investigated the relationship between housing price and the demands of different kinds of households categorized by households of one-generation, two-generation, three-generation and four-and-plus-generation and found that the demands of household of four-and-plus-generations is the most highly correlated with housing prices. The reason might be that this kind of household has more household members and the demands are more diverse and complex, which is more similar to the distributions of all kinds of activity opportunities in the real world. In the end of the paper, some implications for policy-making are proposed based on the results of the analyses.

Cite this article

NIU Fangqu , LIU Weidong . Modeling urban housing price: The perspective of household activity demand[J]. Journal of Geographical Sciences, 2017 , 27(5) : 619 -630 . DOI: 10.1007/s11442-017-1396-2

1 Introduction

Urban house price, as an important content of urban research, has received widespread attention form sociology, urban geography and economics areas. The existing research shows that home values are determined by architectural feature, location features and public service facilities (Rosen, 1974). Research on simulation and analysis of house price can be traced back to Thunen Agricultural Location Theory (Thunen, 1826). Thunen theory is proposed for agricultural products distribution, but its nature is a highly abstract model for city land-value spatial distribution based on a series of simplified assumptions (Krugman, 1996). Alonso’s (1964) bid-rent theory is the application of Thunen theory in the urban space. The theory holds that the determinant of urban land rent is location accessibility to the city center. Bid-rent theory is also developed under the assumption of single-core city and limited land use types. After that, overseas and domestic scholars have done a great deal of research on urban housing price, which involving distribution characteristics and influencing factors of housing price mainly include building quality (building features, the fixed number of year of building, etc.) (Gao,2010), environmental quality (Wen, 2012; Gao,2010; Li, 2010; Shi, 2006; 2010), public transit facilities (Yu, 2013; Feng, 2010; Dong, 2011; Gao, 2010; Li, 2010; Gu, 2010; Shi, 2009; 2010; Zhang, 2003; He, 2004; Benjamin, 1996; Al-Mosaind, 1993; Voith, 1993; Gatzlaff, 1993; Cervero, 1993; Koutsopoulos, 1977; Cockerill, 2002; Weinstein, 2002), commercial center (Yu, 2013; Li, 2010; Zheng, 2008; Ding, 2010; Shi, 2009; TSE, 2003), school (Yu, 2013; Li, 2010; Gao, 2010), and hospital (Dong, 2011) etc. Among these studies, as the most important factor, location is the key influencing factor of the urban house price. In terms of evaluation methods of location, most methods always adopt the accessibility indicator, e.g., the distances from the location to public transportation station, special schools, hospitals, CBD, park and other related facilities. The common conclusion is that the price of house, which is close to rail or bus stations, key school, business center area, is higher. In terms of the model simulation effect, related studies on local (or limited sample) house price differentiation simulation can achieve a certain effect, but the effect on the whole city is not very well, even the simulation results are different in different cities or in different case study areas within the same city (Gu, 2009).
A city is a complex integrated system and urban spatial development process is the interaction between different urban activities through transportation. Urban location conditions should be the results from the integrated impacts of all facilities in the city, thus urban housing price is the projection of all these facilities in the whole city. Hence, a more reasonable calculation method should include the number of all kinds of “activity opportunities” of the whole city and transport conditions. Besides, the generally adopted methods are to focus on the facilities in a certain range (e.g., the number of facilities within a 1 km radius or an hour's journey). A threshold value is always needed, but the threshold value is difficult to determine in science (e.g., the opportunity works within the 1 km, but it does not work at the 1.1 km). In addition, it is the spatial distribution pattern of urban activities but not certain facilities that determine the urban operating mechanism (Hansen, 1959; Lowry, 1964; Wegener 2004; Torrens, 2000), so the core meaning of location should be the “opportunity and cost” for obtaining some kinds of activities, rather than facilities as the substitution variable for “activity opportunity”. Therefore, if the location is direct depicted by the accessibility for various kinds of activity opportunities in the whole city rather than substitution variable, the results not only can show the information of location and transport conditions, but also can show the size and quality of related “facilities”, that is the number of activity opportunities which are involved in different facilities; the location can be analyzed on the whole city not on a limited distance; and the location conditions can be depicted dynamically rather than statically. And still another point, city residents always select residential location with family as unit. The housing location selection is the comprehensive reflection for the various kinds of household demands, so household demands provide an important approach to model housing price.
When location analysis is drawn in details, it can be identified that the location conditions include two main factors: urban activity opportunity distribution and transport conditions connected to these opportunities. A household location selection is based on its accessibilities to different activities according to family structure. Hence, in this paper, Beijing is used as a demonstrative example. Based on the integrated urban traffic system and the social economic activities distribution, a model is developed to calculate how easy to get to various kinds of activities in the whole city, i.e. transport accessibility (employment accessibility, education accessibility, consumption accessibility, and medical accessibility). Accessibility is estimated by zone and activity. Based on these activity accessibilities, the value of each location for a household is calculated according to household structure, called household accessibility, which is used to model housing price. Through discussion of city spatial structure at micro and systems level, this paper aims to provide decision-making basis for government to adjust and optimize urban space structure reasonably, provide reference for model method of spatial research of housing market.

2 Methodology and study area

2.1 Model

The accessibility of a location (zone) is expressed as the convenience of access to various kinds of economic activities in city from this location. Accessibility is the comprehensive expression of urban traffic conditions and the economic activities distribution. Traffic conditions between urban zones are depicted as the convenience to travel between different zones, which is always expressed by the shortest distance, the minimum time costs or economic costs, or can be expressed by generalized cost (g) considering time and economic costs comprehensively. The minimum time is adopted in this paper. Based on traffic network (formed by transit lines at different levels), GIS shortest path algorithm is adopted to calculate the minimum cost between zones from the minimum time. The estimate result of traffic condition is an m*m matrix, i.e. traffic cost between each pair of zones.
Based on the discussed above, the model in this paper can be developed as equation (1). Where, Ai is the traffic accessibility of zone i, Wj is the weight of zone j (opportunity distribution), gij is the transport cost from zone i to zone j, which is represented by time, α is the distribution coefficient, which represents the sensitive degree of different traffic patterns for distance change. As we do not split transport mode in this paper, α is assigned value 1.
According to the equation (1), when assessing the traffic accessibility of zone i, all zones in the city should be considered with the weight of each zone and transportation distance from each zone to zone i. In equation (1), the coefficient (-α) for distance parameter gij is negative. When the distance increases, the value of exp() decreases, and the weight of j (Wj) is discounted. Hence, if zone j is difficult to reach from i (high transportation costs), the opportunity in zone j will become meaningless; conversely, if zone j is easy to reach from i (low transportation costs), the influence of opportunity in zone j will become big. After taking logarithm, the dimension of accessibility Ai is same with transportation cost g. Hence, it is that the higher the value of Ai, the lower the accessibility. If computer program is adopted to achieve the above model, the algorithm will include two-lever loops: inner loop which is used to calculate accessibility in the specific zone, and outer loop which is used to assess the accessibility of all zones. Equation (1) is the extensive application of random utility theory (McFadden, 1978) based on a huge number of simulations.
This paper aims to assess the location traffic accessibility by activity type, i.e. work, education, consumption, medical service. In terms of working trip, traffic accessibility of a city zone i is influenced by the quantity of jobs in all zones among this city and traffic conditions between all other zones and zone i. In terms of travel for consumption activity, traffic accessibility is influenced by the market distribution around. Similarly, in terms of travel for education and medical service, traffic accessibility is influenced by education or medical service distribution around. Opportunities of each type of activity in each zone (i.e. variable W in equation 1) are counted by the number of jobs of that type of activity.

2.2 Study area and data

Beijing central urban area is inside the 6th ring road, and the other 4 suburban counties are outside the sixth ring road. In order to fully explore the evolution and extension of urban space, we take the whole Beijing as the case study area. For districts inside or intersecting with the sixth ring road, data at township (jiedao) level is used and for the suburban counties data at county level is used. In this way, the study area is disaggregated into 243 zones as shown in Figure 1.
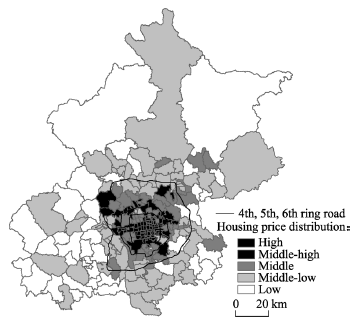
Figure 1 Study area and housing price spatial distribution
There are four kinds of data needed in this paper: housing prices data of Beijing; road network data of Beijing based on the digitization of 2010 administrative division atlas (including highways, urban expressway, national highway, provincial roads, county roads, subway lines, etc.); the 6th national population census of Beijing (for the household structure data); economic activity data of Beijing. Among these, housing prices data comes from real estate agent (Sofang). The housing price of each zone is represented by the average available housing price in this zone.
The employment activity data with detailed employment distribution of Beijing is prepared based on Baidu Map Point of Interest data (Baidu, 2013) and Beijing Economic Statistics Yearbook (CSP, 2013), which covers companies, organizations, institutes, hospitals, etc. with more than 700,000 records. The data information by company includes the scale, location, fixed assets, employees, etc.

3 Traffic accessibility

Traffic accessibility of one zone reflects the influence of urban economic activities on this zone. Based on equation (1) we calculate employment accessibility, education accessibility, consumption accessibility and medical services accessibility. According to equation (1), the weight of each zone needs to be defined to calculate accessibility of various activities, i.e., variable Wj. The number of employees in each type of activities is used as zonal weight. Comparison with adopting the number of work units/facilities, this calculation method can avoid the deviation of statistics due to different scales of units. The evaluation results of various kinds of traffic accessibility are shown in Figure 2. Evaluation value in each zone expresses the convenience of residents engaged in various kinds of economic activities, and the advantage of location.
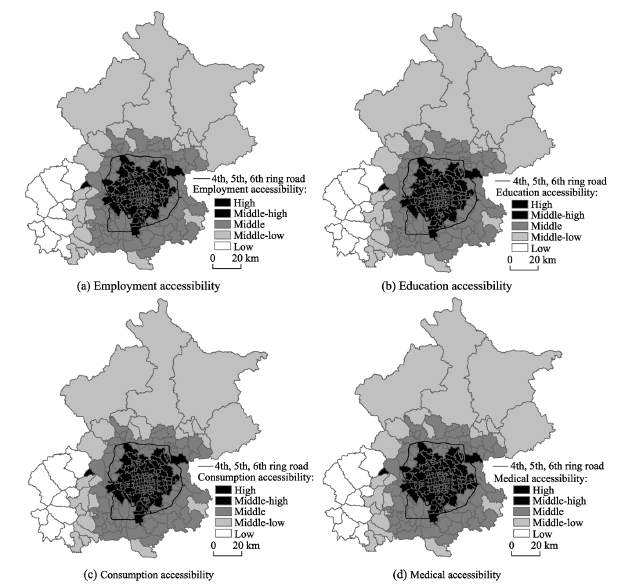
Figure 2 Urban traffic accessibility by economic activity
As shown in Figure 2, we divided each kind of traffic accessibility into five grades: high, medium-high, medium, medium-low and low. The spatial distributions of various kinds of traffic accessibility are basically similar: areas with higher degree are mainly located in city center; the degree shows a decreasing trend from city center to suburb. The reasons are that all kinds of economic activities are mainly concentrated in the central city, and the number of them declines gradually from city center to suburbs. 1) Travel for employment: Areas within the 4th ring road of Beijing still have the strongest geographical advantage. Most of employment opportunities are still distributed in the main urban area with convenient traffic conditions within the 4th ring road. 2) Travel for education: Western areas within the 5th ring road have distinct advantage, and the suburb areas between the 4th ring and the 5th ring roads also have high accessibility degree. Thus it can be seen that Xicheng district and Haidian district have good education resources, which make travel for education in these areas convenience. The other reason is that there are a large number of high quality primary and secondary schools and universities in the region. 3) The distribution of traffic accessibility for consumption and that for medical services are basically similar. Areas with high degree mainly locate within the 5th ring road especially central urban areas within the 4th ring road, which is induced by the surrounding construction of pie-style development. Due to the worsening traffic conditions in Beijing, it is imperative to evacuate medical and other activities.
Based on the evaluation results, we will calculate household demand, which is used to model housing price below.

4 Modeling housing price based on urban household demand

Location demand of the household determines household location selection. The household location selection is the comprehensive reflection for the various kinds of household demands which is determined by household composition. In order to assess the comprehensive demands of various kinds of household, this paper divided the household members into three types: children, people of prime working age, the aged (retirement), and assume that children need to get to education, worker and the aged need to get to employment and medical services. Besides that, all kinds of household need consumption (to get to different markets). We define household accessibility to represent how easy or difficult for a household to get to different activities from residential places. We will use weighted summation of different accessibilities calculated above to get the household accessibility according to household structure.

4.1 Household accessibility

According to the 6th national population census of Beijing, household is divided into four kinds: 1-generation household, 2-generation household, 3-generation household and 4-and-plus generation household. Besides, the number of children, people of prime working age and the retirement also can be obtained from the population census. Based on that, the average number of various kinds of household members can be calculated as shown in Table 1.
Based on travel frequency, referencing household structure, the weights of various kinds of economic activities on different households are calculated, as shown in Eq. 2. Where, Weight means the weight of each economic activity, Person means the number of a certain kind of household members, Frequency means the frequency of people engaged in each economic activity each month, and 2 as a constant expresses the travel for back and forth.
Table 1 Demographic structure of households
Household Household
proportion (%)
Children
(per household)
Workers
(per household)
Retired
(per household)
1-generation household 50.4 0.34 1.34 0.16
2-generation household 39.4 0.71 2.71 0.25
3-generation household 10.1 1.09 4.11 0.32
4-and-plus generation household 0.2 1.47 5.56 0.32
For employment or education activities, Person represents the number of people of prime working age or children. There are five working days in each week, 23.7 working days on average in each month. Thus, the Frequency of each person engaged in this economic activity each month is 23.7. For consumption activity, empirical value 4 is used as the weight to show that a household needs to go out for consumption four times every month. For medical services, Person is the number of the aged, the Frequency of each person for medical services each month is calculated as 2. The value of person is shown in Table.2, and based on that, the weights of various kinds of economic activities on different families are calculated as shown in Table 2.
Table 2 Weights of various kinds of economic activities on households
Household Weight of
employment
Weight of
education
Weight of
consumption
Weight of
medical services
1-generation household 58.15 14.82 3.68 0.32
2-generation household 117.66 30.99 7.35 0.50
3-generation household 178.50 47.10 11.03 0.64
4-and-plus generation household 241.26 63.87 14.71 0.65
According to the weights calculated above, household accessibility of a location can be calculated by aggregating the accessibilities for these economic activities together (equation 3). Where, Vali,v is the value of location i for household v, A(J)i, A(E)i, A(S)i, and A(M)i are the accessibilities of location i for employment, education, consumption and medical services respectively, w(J)v, w(E)v, w(S)v, and w(M)v are the weights of accessibilities for employment, education, consumption and medical services.
With this equation, household accessibilities of the zone i for various kinds of household can be calculated. As shown in Figure 3, the values of the same zone for different household are different.
As shown in Figure 3, household accessibility distribution pattern for different household are basically similar, i.e. the value decreases gradually from central city to the suburbs. The main reason is the density of each type of economic activities decreases from central city to the suburbs. Although the overall pattern is similar, the distribution details are not the same. For the real estate development, location demands for various kinds of families need to be considered to determine the house structure, so this research provides a good reference for real estate development. In the next chapter, the relationship between housing price distribution pattern and location demands of households are further explored.
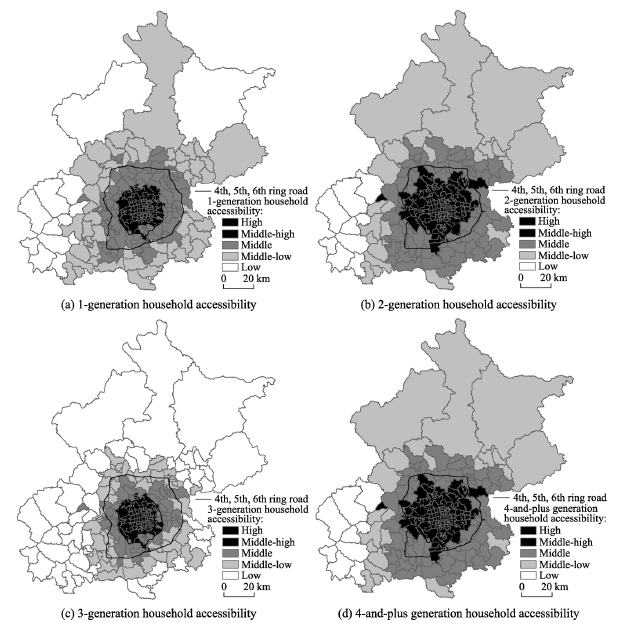
Figure 3 Household accessibility

4.2 Household location demand and housing price

In fact, household accessibility reflects the demand degree of various kinds of families for each zone. Housing price is determined by various kinds of household accessibilities together. There is power function relationship between housing price and household accessibility. In this paper, the function relationship is set as:
where Pi is the housing price in zone i, Vali,j is the household accessibility of zone i to household type j, and m is undetermined index.
Ln transformation is adopted in this function, and OLS method is used for regression analysis. The obtained results are shown in Figure 3. The overall simulation results of this model achieve the ideal results all over the city, which provide a good simulation method for simulation and analysis of housing prices.
Table 3 The estimation results of household accessibility and housing price
Variables Descriptions Exponentials Values of
exponentials
T-test
Vali,1 Household accessibility of 1-generation household in zone i m1 0.002 Insignificant
Vali,2 Household accessibility of 2-generation household in zone i m2 - Insignificant
Vali,3 Household accessibility of 3-generation household in zone i m3 0.004 Insignificant
Vali,4 Household accessibility of 4-and-plus generation household in zone i m4 0.74 17.20**

Note: R2=0.70, F=296, “**” means significant at 1% level.

As shown in Table 3, household accessibilities of 1-generation household, 2-generation household, 3-generation household are not significant, while household accessibility of 4-and-plus generation household and housing price distribution show a high correlation. There are huge differences among the different household structures. Comparison with the 4-and-plus generation household, household members are relatively few in 1-generation household, 2-generation household and 3-generation household, thus the travel demand are often concentrated and have different foci. There are normally many household members in a 4-and-plus generation households, thus the travel demands are more comprehensive. Hence, the location selection needs consider demands from various aspects comprehensively. The consistency of location advantage of 4-and-plus generation household and housing price distribution expresses that the household location selection is the result of considering all kinds of travel demands, and it is also proved that housing price is the result of joint action of various kinds of economic activities.
The size of 2-generation household is bigger than 1-generation household, but its correlation is the weakest, and is excluded in the regression. The 2-generation families usually have their children in school, thus the spatial distribution of 2-generation household is influenced greatly by education resource distribution. So it could be drawn that educational resources is not the key factor of housing price at city level. The reason is that some key primary schools or middle schools only affect housing price of their surrounding zones. Other reasons are that in the past many households only have one kid under the one-child policy, so education travel is only their demand during certain period.

5 Discussion and conclusions

City is an organic whole including the interaction between transportation and land use. It usually adopts spatial position relationship to characterize the spatial heterogeneity of housing price, but without the deeper analysis on the quantitative relationship between housing prices and traffic system, and relationship between housing prices and economic activities. Hence, it is difficult to achieve a good simulation effect at the city level, especially for mega-city like Beijing. The internal connection between the spatial heterogeneity of housing price and urban traffic or economic activities was analyzed in this paper. Based on the construction of urban traffic accessibility model, the influences of employment, education, consumption and medical services on housing price, and the relationship between the household location demand and the housing price are analyzed with model simulation. Specifically, this paper has improved the existing research in the following three aspects.
Firstly, a traffic accessibility model was constructed. According to the deep analysis of accessibility, the accessibility indicators in the existing research (distances to certain facilities) are substitute variables which are just similar with these kinds of “activity opportunities”. These accessibility indicators only reflect the number and scale of facilities, rather the number of “activity opportunities”; these indicators are static, not dynamic, thus a certain space threshold is needed but there are some scientific questions in the setting of space threshold. Therefore, this paper proposed a traffic accessibility model to abandon the substitution variables methods, and calculate the accessibility based on economic activities distribution and transport system throughout the whole city. This model is based on the rule of interaction between urban activities.
Secondly, a household accessibility model is developed to calculate household location demand based on household composition. Household accessibility depicts the demand of every member comprehensively. A household is the basic unit to select house, so household demand helps analyze the influencing factors of housing price systematically. The model helps to decide what kind of house structure to develop relating to household demand at certain location.
Lastly, an urban housing price distribution simulation model based on the household demands was developed according to the household structure. The simulation results show that: there is a significant correlation between 4-and-plus generation household location demands and housing price spatial distribution. Generally household members in 4-and-plus generation household are relative more, thus the travel demands are more comprehensive. It proved that housing price spatial heterogeneity is influenced by various kinds of economic activities jointly. However, the number of 4-and-plus generation households is relatively small (0.2%), thus the demands of this kind of household are not enough to determine the urban housing price distribution pattern. But this does not deny the usefulness of the model, thus this model provides an excellent way for the urban housing price simulation analysis.
Besides the contributions to theory, this paper is also helpful for the actual policy making. At the time of proposing the “adjusting the population based on the industry distribution” as the spatial structure adjustment in Beijing, the model proposed in this paper can be used to simulate and analyze the influence of industrial activities distribution on housing price, so as to provide references for policy scenarios analysis. “Adjusting the population based on the industry distribution” is used to adjust the distribution of population through adjusting the spatial distribution of economic activities. The simulation results of our model will change according to the change of the traffic or the number of economic activities, i.e. variables g and W in equation (1).
This paper also has some limitations, e.g., the characteristics of the house (quality, fixed number of year, amenity, etc.), location and the adjacent public service facilities have been identified as the main influencing factors on urban housing price in the existing research, but in this paper, only location and the proximity to public service facilities were considered and their interaction was emphasized. Urban economic activities are classified into four groups, i.e. employment, education, consumption and medical services. More detailed data need to be given in the future. The most detailed township dimension data which can be collected right now is adopted in this paper. The houses in the same town usually have different characteristics, thus it is difficult to distinguish them on town scale. Therefore, the simulation analysis of multiple factors should be further studied on micro-scale (e.g., community scale). When calculating the traffic condition, the shortest path between zones was calculated based on the urban traffic network in this paper. However, besides the network distance, the actual condition of city traffic is also affected by the traffic demand and supply, e.g., too much demand will lead to traffic jams; the weaker road traffic capacity will cause obstruction. Hence, the further study of this paper is to develop more intelligent traffic model, and to calculate the urban integrated transportation costs (g). In addition, different traffic patterns (e.g., bus, self-driving) have different commuting time, thus the sensitivity to the distance is also different. Therefore, the parameter α in equation (1) should be characterized as different values, which can make the model more perfect and effectively represent the real world.

The authors have declared that no competing interests exist.

[1]
Al-Mosaind M A, Duecker K J, Strathman J G, 1993. Light-rail transit stations and property values: A hedonic price approach.Transportation Research Record, 1400: 90-94.What are the effects of proximity to light-rail transit (LRT) stations on the value of single-family homes? Two forces are at work. Proximity to LRT stations may improve the accessibility of residents to the central business district and the rest of the urban area. Further, proximity to rail stations may result in transportation cost savings for nearby residents. These effects should be positively capitalized in property values. Alternatively, without attention to design, LRT stations may impose negative externalities on nearby properties, with a resulting decline in house values. Which of these effects predominates in the housing market with respect to station proximity? A study was undertaken to analyze sale prices of homes in metropolitan Portland, Oregon. Two distance models to LRT stations were compared. The first showed a positive capitalization of proximity to LRT stations for homes within 500 m (1600 ft or 1/4 mi) of actual walking distance. This effect was equally felt for all homes within that distance zone. The second model found a statistically weak negative price gradient for homes within the 500-m zone. This implies a positive influence of proximity the closer the home is to an LRT station.

[2]
Alonso W, 1964. Location and Land Use. Cambridge, MA: Harvard University Press.

[3]
Baidu, 2013

[4]
Benjamin J D, Sirmans G S, 1996. Mass transportation, apartment rent and property values.Journal of Real Estate Research, 12(1): 1-8.Rent plays a vital role in property valuation because any positive or negative influence on rent will in turn affect a property's value. This paper examines the effect of mass transportation on apartment rent. Specifically, this study investigates the impact on rent and value for residential income properties located in close proximity to Washington, D.C. Metrorail stations. After reviewing the empirical research which has focused on the effect of mass transportation availability on property values, this paper examines the benefits on apartment rent of Washington, D.C. apartment buildings from location near Metrorail stations. Our empirical results show that distance from a metro station has an adverse impact on apartment rent, i.e., each one-tenth mile increase in distance from the station results in a decrease in rent per apartment unit of about 2.50%. This analysis should be of interest to a host of domestic and international market participants including academics who study real estate markets, tax assessors who determine market value, appraisers who make market-derived rent adjustments, and property managers who set apartment rents.

[5]
Cervero R, Landis J, 1993. Assessing the impacts of urban rail transit on local real estate markets using quasi-experimental comparisons.Transportation Research A, 27(1): 13-22.No abstract provided.

DOI

[6]
CSP, 2013. Beijing Economic Statistics Yearbook. Beijing: China Statistics Press. (in Chinese)

[7]
Ding W, Zheng S, Guo X, 2010. Value of access to jobs and amenities: Evidence from new residential properties in Beijing.Tsinghua Science and Technology, 15(5): 595-603. (in Chinese)lt;h2 class="secHeading" id="section_abstract">Abstract</h2><p id="spara120">With the rapid urbanization of Chinese cities, access to jobs and amenities is becoming increasingly valued in household's choice of residential locations. In this paper, we estimate the implicit value of access to jobs and amenities in Beijing using the hedonic pricing model. The spatial distributions of jobs and amenities in the Beijing Metropolitan Area are quite centralized, supporting the traditional monocentric model in the urban economics literature. Accessibility indices are developed to measure the accessibilities to jobs and amenities of 129 Jiedaos (residential zones). We then employ the hedonic pricing equations to estimate the capitalization effects of these accessibility indices in the prices of new residential properties. The empirical results show that the accessibility indices are important determinants of residential property prices in Beijing, which means that urban residents have a willingness to pay for access to high quality amenities.</p>

DOI

[8]
Dong G P, Zhang W Z, Wu W J, Guo T Y, 2011. Spatial heterogeneity in determinants of residential land price: Simulation and prediction.Acta Geographica Sinica, 66(6): 750-760. (in Chinese)Hedonic land price models typically impose a spatial homogeneous price structure on land characteristics throughout the entire land market. However, there are increasing theoretical and empirical evidences that the marginal values of many crucial attributes of land parcels vary across space. Theoretically, localized and inelastic land supply results in spatial mismatch between demand and supply of land with certain attributes, which causes the spatial heterogeneous effects of these attributes. In this paper, we establish a series of models to evaluate the determinants of residential land price and the spatial heterogeneity of the determinants. First, we use hedonic models to diagose the determinants of residential land price. Second, we use the spatial expansion models and geographically weighted regression model (GWR) to depict the spatial instability in the impacts of land attributes. Third, we compare the prediction accuracy of the two models by predicting the land price of 10% random selected land parcels. We take Beijing as a case study and use the information of auctioned residential land parcels during 2004-2009 and GIS data of Beijing's public facilities. Based on the analysis, several conclusions are drawn as follows. 1) Spatial dependence of local residential land price and the spillover effect of local commercial land exert great effects on the residential land price, while the impact of the distance on CBD is insignificant, which indicates that the residential land market is probably local rather than global. 2) Among several public facilities, in terms of Nearest-Distance Accessibility Criteria, only the local prime elementary school, park and rail transit accessibility have a significant effect on the residential land price. 3) There is an obvious spatial pattern in the impacts of the land attributes on the land price, which is an evident signal of existence of land submarkets. 4) As the spatial expansion model imposes a fixed and definite function of spatial coordinates on the spatial heterogeneity in the marginal effect of land parcel attributes, it does not perform as well as GWR models in depicting spatial variation and prediction accuracy. GWR models perform best in explaining the land price variation, depicting spatial heterogeneity and prediction accuracy comparing to hedonic models and spatial expansion models. Also, GWR models provide a useful framework for delineating residential land submarket boundaries.

DOI

[9]
Feng C C, Li W X, Zhao F F, 2010. Influence of rail transit on nearby commodity housing prices: A case study of Beijing Subway Line Five.Acta Geographica Sinica, 66(8): 1055-1062. (in Chinese)

DOI

[10]
Gao X L, 2010. Size effect of housing price and size standard in Beijing.Geographical Research, 29(3): 500-509. (in Chinese)Due to absence of practical housing standards,the structure of housing market in Chinese cities has been seriously distorted and housing supplies are incapable to satisfy reasonable demands.Therefore,it is of great significance and in emergency to stipulate appropriate standards to guide housing construction and consumption.To this end,this study addressed the issue of housing floor area standard.First,it proposed an empirical framework for analyzing floor area standard,i.e.,the problem of determining floor area standard was formulated as an optimization problem of maximizing the utilities of households.Then,it reported an empirical study in Beijing.Using the second-hand apartment house data in the Asian-Olympic Village area,the benefit and cost of households with respect to the size of houses were examined with a hedonic regression approach.It was found that the prices of second-hand apartment houses significantly differed by housing floor areas,and the critical size thresholds were identified by the regression analysis.Based on the results,the standard of appropriate housing size was presented and suggestions were made on the regulation of housing market.Specifically,(1) it would be economically efficient to control the minimum and preferential levels of apartment housing.It is recommended to take 50 m2 as the minimum level,and 80 m2 for the preferential level.(2) It is recommended to take 50~60 m2 as suitable size standard for small families.To encourage stepwise consumption,the government might consider decreasing housing transfer costs by reducing tax or providing stipend for the development of small units.

DOI

[11]
Gatzlaff D H, Smith M T, 1993. The impact of the Miami metrorail on the value of residences near station locations.Land Economics, 69(1): 54-66.No abstract provided.

DOI

[12]
Gu Y Z, Zheng S Q, 2010. The impacts of rail transit on property values and land development intensity: The case of No.13 Line in Beijing.Acta Geographica Sinica, 65(2): 213-223. (in Chinese)lt;p>Theoretical analysis shows that the effect of rail transit on housing price is greater in suburbs than that in the central area. Empirical results validate this point by using the hedonic pricing method and housing transaction data nearby No.13 rail line in Beijing. In suburban areas, the housing prices within 1 km of rail stations are nearly 20% higher than those beyond that distance. However, with the development of surrounding urban transportation networks, the impact of rail transit is declining. Also, rail transit has significant impacts on urban land development intensity. The operation of No.13 Line encourages the land development in the north suburbs of Beijing, and raises the land development intensity around the stations. The FAR of new housing projects decreases by 1.0 every 3.3 km further away from the stations in suburban areas. These empirical results have important policy implications for the TOD strategy, the cost-benefit analysis and value capture strategy of rail transit construction in Chinese cities.</p>

DOI

[13]
Hansen W G, 1959. How accessibility shapes land use.Journal of the American Institute of Planners, 25: 73-76.An empirical examination of the residential development patterns illustrates that accessibility and the availability of vacant developable land can be used as the basis of a residential land use model. The author presents an operational definition and suggests a method for determining accessibility patterns within metropolitan areas. This is a process of distributing forecasted metropolitan population to small areas within the metropolitan region. Although the model presented is not yet sufficiently well refined for estimating purposes, the concept and the approach may be potentially useful tools for metropolitan planning purposes.

DOI

[14]
He F G, Wang X L, 2004. The influence of rail transit on house values.China Real Estate, 9: 13-15.

[15]
Koutsopoulos K C, 1997. The impact of mass transit on residential property values.Annals of the Association of American Geographers, 67(4): 564.Abstract ABSTRACT A major impact of mass transit on property values is the capitalization of the reductions in travel costs (travel savings) afforded by a new transportation alternative. The model of mass transit impact presented improves upon existing models in four ways. First, a statistical method is provided to hold constant the factors that might affect property values other than the transportation improvement. Second, the property value gradient to the CBD can be derived by utilizing empirical estimations. Third, two property value gradients are incorporated into the model to study impact. Finally, a “residualization'’process controls multicollinearity among housing attributes. The model is used to estimate the impact of newly introduced bus routes on Denver's residential property values.

DOI

[16]
Krugman P, 1996. The Self-Organizing Economy. Malden, MA: Blackwell.

[17]
Cockerill L, Stanley D, 2002. How will the centerline affect property values in Orange County. Institute of Economic and Environmental Studies, California State University-Fullerton.

[18]
Li X, Fu Wen Y, 2010. Investigation of the capitalization of municipal government infrastructure investment on housing market: Hedonic model based on Guangzhou housing price data.Geographical Research, 29(7): 1269-1280. (in Chinese)Hedonic pricing model is a tool frequently used in the analysis of housing market in western developed countries.It has a high degree of pertinence and real-time,and is a scientific method to measure externality.In the transforming context of house commercialization,it is feasible to do research on the housing market from the angle of housing demand,and with the launch of property tax in China,proper measure in the monetary value of externality from the public service is of great meaning to setting a scientific fiscal plan for the government.This article establishes the Hedonic model for Guangzhou housing market by using data in three independent time series in 2005,2006 and 2007,and explores the impact of floor ratio,area,distance from CBD,distance from the shopping center,rail accessibility,water view,park accessibility,primary school,secondary school,prestigious primary school,prestigious secondary school and campus on the housing price.The article reveals the changing tendency and degree of the housing preference of Guangzhou residents over time and the reason of the change.It also effectively measures the capitalization degree of the infrastructure investment of Guangzhou municipal government on housing market.The result shows that Guangzhou residents have increasing preference to central location,good transportation accessibility,large-scale resident districts and water view.For Guangzhou municipal government,the long-term public investment in subway construction,landscape reconstruction and education quality enhancement has been reflected by the housing market as the increasing housing preference to these variables.The article also conducts a relatively accurate measurement of the degree of this investment effect by the Hedonic model.Finally,the article views the application prospect of Hedonic pricing model in China in the context of local government-oriented urban development.

DOI

[19]
Lowry I S, 1964. A Model of Metropolis[M] RM-4035-RC. Santa Monica CA: Rand Corp.

[20]
McFadden D,1978. Modelling the choice of residential location. In: Karlquist Aet al. (eds.): Spatial Interaction Theory and Residential Location. Amsterdam: North Holland, 75-96.

[21]
Rosen S, 1974. Hedonic prices and implicit markets: product differentiation in pure competition.Journal of Political Economy, 82(1): 34-55.No abstract is available for this item.

DOI

[22]
Shi Y S, Guo H N, 2009. Temporal-spatial impacts of the Shanghai South Railway Station on housing prices.Acta Geographica Sinica, 64(2): 167-176. (in Chinese)The impact of large transport infrastructure on real estate prices has become an interesting theme. But the impact of a large-scale comprehensive transportation system on real estate prices has seldom been studied, and the empirical study of integrating temporal effects with spatial effects is rare too. In the present study, exemplified by the Shanghai South Railway Station, a large-scale comprehensive transportation system, the authors analyze its temporal and spatial impacts on housing prices at different stages and in various directions by means of modified hedonic price models and multi-regression method based on the nine-year long housing transaction data. The results show: (1) the construction of the Shanghai South Railway Station has highly stimulated economic growth in this area, and also leads to the appreciation of residential property values; (2) effects on peripheral housing prices seldom occurrs before its construction; a little reaction on peripheral housing prices during its construction; after its opening, the housing prices obviously fall as the distance increases away from the Shanghai South Railway Station; and (3) the average impact range of the Shanghai South Railway Station on housing prices is within 1.85 km. However, its effects differentiate in different directions. Along the Humin Road, its impact range is within 2.2 km; around the Shanghai Arboretum, its impact range is within 1.45 km, and along the Middle Ring Line, its impact is not marked.

DOI

[23]
Shi Y S, Zhang R, 2010. Temporal-spatial impact effects of large-scale parks on residential prices: Exemplified by the Huangxing Park in Shanghai.Geographical Research, 29(3): 510-520. (in Chinese)Along with the improvement of people's living standard and the enhancement of consciousness about environmental protection,the willing to pay(WTP) for environmental amenity has increased day by day.The research on the valuation of living environment has been paid more attentions.However,there are only the qualitative impact studies,but lack of the quantitative impact analysis from the temporal and spatial views.Moreover,the existing studies have offered little theoretical support for urban policy decision-makings.It is these shortcomings that have brought out the inequality in the distribution of real estate appreciation,a waste of location resources as well as the fault of urban land planning and urban decision-makings.In the present study the authors apply hedonic pricing method,market comparative method and spatial proliferation effect theory,bring in the weighted distance,and analyze the temporal-spatial impact effects of large-scale park on the surrounding residential prices exemplified by the Huangxing Park in Shanghai city,and put forward its metric model of value spill over.The research results show that the appreciation of housing prices varies at temporal and spatial scales,displays significant conic curve relation with weighted distance and decreases gradually with increased weighted distance.The appreciation in north-south direction is more than that in east-west direction,and its impact manifests significant cubic curve relation with weighted distance.Its maximum impact radius is 1.59 km,and the strongest impact location is 0.29 km.Finally,some suggestions are proposed so as to determine rationally the location of residential development and to distribute properly land appreciation earnings.

DOI

[24]
Thunen V, Johann H, 1826. The Isolated State, Hamburg: Perthes. English Translation. Oxford: Pergamon, 1966 (Translated by Wartenburg C M, 1966).

[25]
Torrens, P M, 2000. How land-use transportation models work. London: Centre for Advanced Spatial Analysis.

[26]
Tse C Y, Chan W H, 2003. Estimating the commuting cost and commuting time property price gradients.Regional Science and Urban Economics, 33: 745-767.In this paper, we estimate the property price gradients in Hong Kong. We distinguish our effort from previous studies on the subject by directly measuring the economic distance, i.e., the monetary commuting cost and commuting time, instead of merely the physical distance. Our results are generally supportive of the prediction of a negative property price gradient. In one specification, the estimated capitalization of the savings of commuting cost in property prices appears to be just right. The expected negative effect of commuting time on property values, however, can only be detected among observations with larger commuting times. Nevertheless, over the range where the effect of commuting time has the expected negative sign, the values of time implied by the estimates agree well with the results reported in the transportation economics literature.

DOI

[27]
Voith R, 1993. Changing capitalization of CBD-oriented transportation systems: Evidence from Philadelphia, 1970-1988.Journal of Urban Economics, 33(3): 361-376.This paper presents estimates of how the value of central business district (CBD) accessibility has changed over the period 1970-1988 for the Philadelphia metropolitan area. Using a large data set on suburban Philadelphia house sales, we estimate house value premiums associated with CBD-oriented train service provided by the Southeastern Pennsylvania Transportation Authority for each year in the sample. Additionally, we provide evidence on the changing value of highway access to the CBD. For the Philadelphia metropolitan area, we find strong evidence that accessibility to the CBD is capitalized into suburban house values. The estimated value of CBD accessibility fluctuates with the economic health of the city, indicating that the central city economy is an important factor in the overall wealth of suburban communities. From a policy perspective, these findings suggest that suburban communities may not be able to isolate themselves from the consequences of central city decline, and in fact, that suburban communities may benefit substantially from a growing central city.

DOI

[28]
Wegener, M, 2004. Overview of land-use transport models. Transport Geography and Spatial Systems. Hensher D A, Button K eds. Oxford: Elsevier, 127-146.

[29]
Weinstein B L, Clower T L, 2002. An assessment of the DART LRT on taxable property valuation and transit oriented development. Center for Economic Development and Research, University of North Texas, September.

[30]
Wen H Z, Li X N, Zhang L, 2012. Impacts of the urban landscape on the housing price: A case study in Hangzhou.Geographical Research, 31(10): 1806-1814. (in Chinese)Urban landscape areas which provide amenities for people are generally recreational places in life and have great impact on the life quality in cities.However,the benefit of urban landscape is implicit,which makes it difficult to estimate the value of the view amenity in monetary form.The hedonic price methods are widely used in empirical research by domestic and foreign scholars.In this paper,25 explanatory variables are selected to build a hedonic price model in four dimensions of building,neighborhood,location,and landscape.This paper assesses the external effects of various types of landscape on housing price.The sample is made up of 2795 valid house data in Hangzhou.The results indicate that there is an inverse relationship between the house price and its distance from the West Lake and the park,and the park size is positively correlated to house price.Increasing the distance of 1% to the West Lake or to the park decreased the house price by 0.240% or 0.036%,and increasing the size of the nearest park by 1% leads to a 0.012% price increase.What's more,the plazas,mountain views and the Qiantang River also have a positive effect on the house price within a certain distance.

DOI

[31]
Yu J H, Zhang W Z, Dong G P, 2013. Spatial heterogeneity in the attributes prices of residential land in Beijing.Geographical Research, 32(6): 1113-1120. (in Chinese)Due to the dearth of attentions to the role of residential land parcels' neighborhood attributes in land price in the existing literatures,this paper aims to investigate the impacts on residential land price of neighborhood attributes and how these neighborhood attributes affect the attributes prices of residential land using the homogeneous and heterogeneous hedonic models,based on the auctioned residential land parcels from 2004 to 2009 and GIS data of Beijing's public facilities.Several conclusions are drawn as follows.1) Spatial dependence,the accessibilities of railway and park,and mixed land use have an important effect on land price.2) The neighborhood attributes including population density,the ratio of renting public houses and residential land leasing can significantly lead to the increase of land price.3) The neighborhood attributes such as weighted job density,educational status and the ratio of renting public houses and residential land leasing impose nonlinear impacts on the attributes prices of residential land.

DOI

[32]
Zhang X S, Hu Z H, Zheng R Z.The impacts of UMT development on urban land use.Urban Mass Transit, 6: 24-26.

[33]
Zheng S, Kahn M E, 2008. Land and residential property markets in a booming economy: New evidence from Beijing.Journal of Urban Economics, 63: 743-757.Beijing's housing market has boomed over the last fifteen years. The city's population grew by 40.6% and per capita income (in constant RMB) by 273.9% from 1991 to 2005. Using two geocoded data sets, we present new evidence on the real estate price gradient, land price gradient, population densities, and building densities in Beijing's recent free housing market. The classic urban monocentric model's predictions are largely upheld in Beijing. We also document the importance of local public goods, such as access to public transit infrastructure, core high schools, clean air, and major universities, most of which have exogenous locations, as important determinants of real estate prices.

DOI

Outlines

/