Research Articles

Reconstruction of Lu-level cropland areas in the Northern Song Dynasty (AD976-1078)

  • HE Fanneng , 1, * ,
  • Li Meijiao , 1, 2 ,
  • Li Shicheng 3
Expand
  • 1. Key Laboratory of Land Surface Pattern and Simulation, Institute of Geographic Sciences and Natural Resources Research, CAS, Beijing 100101, China
  • 2. University of Chinese Academy of Sciences, Beijing 100049, China
  • 3. School of Public Administration, China University of Geosciences, Wuhan 430074, China
*Corresponding author: Li Meijiao, PhD, specialized in historical land use/cover change. E-mail:

Author: He Fanneng, Professor, specialized in historical geography and environmental changes. E-mail:

Received date: 2016-11-01

  Accepted date: 2016-12-10

  Online published: 2017-05-10

Supported by

National Natural Science Foundation of China, No.41271227

The Special Program for Basic Work of the Ministry of Science and Technology, China, No.2014FY210900

Copyright

Journal of Geographical Sciences, All Rights Reserved

Abstract

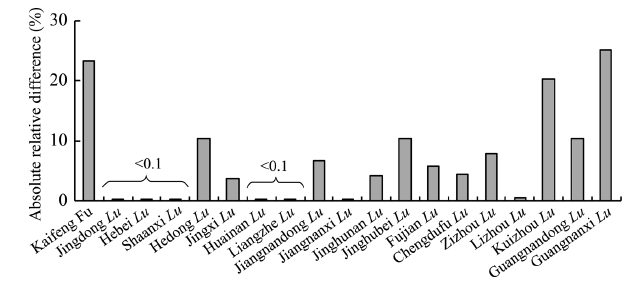
Based on data on taxed-cropland area and on the number of households in historical documents, a probabilistic model of cropland distribution and a cropland area allocation model were designed and validated. Cropland areas for the years AD976, 997, 1066, and 1078 were estimated at the level of Lu (an administrative region of the Northern Song Dynasty). The results indicated that (1) the cropland area of the whole study region for AD976, 997, 1066, and 1078 was about 468.27 million mu (a Chinese unit of area, with1 mu=666.7m2), 495.53 million mu, 697.65 million mu, and 731.94 million mu, respectively. The fractional cropland area (FCA) increased from 10.7% to 16.8%, and the per capita cropland area decreased from 15.7 mu to 8.4 mu. (2) With regard to the cropland spatial pattern, the FCA of the southeast, north, and southwest regions of the Northern Song territory increased by 12.0%, 5.2%, and 1.2%, respectively. The FCA of some regions in the Yangtze River Plain increased to greater than 40%, and the FCA of the North China Plain increased to greater than 20%. However, the FCA of the southwest region (except for the Chengdu Plain) in the Northern Song territory was less than 6%. (3) There were 84.2% Lus whose absolute relative error was smaller than 20% in the mid Northern Song Dynasty. The validation results indicate that our models are reasonable and that the results of reconstruction are credible.

Cite this article

HE Fanneng , Li Meijiao , Li Shicheng . Reconstruction of Lu-level cropland areas in the Northern Song Dynasty (AD976-1078)[J]. Journal of Geographical Sciences, 2017 , 27(5) : 606 -618 . DOI: 10.1007/s11442-017-1395-3

1 Introduction

Anthropogenic land use and land cover change (LUCC) is an important factor involved in a number of global changes. It influences climate change through both biogeochemical and biogeophysical mechanisms (Ramankutty et al., 2006; Tian et al., 2012a; Tao et al., 2013). In the historical period, LUCC has transformed the Earth’s surface and has had a strong impact on global and regional climate and the carbon cycle (Pongratz et al., 2008; Flato et al., 2013). Therefore, reconstruction of historical LUCC is an important task when modeling climate change and its ecological effects (Brovkin et al., 2004; Strassmann et al., 2008; Kaplan et al., 2012), and has increasingly come to be recognized as a core theme in global climate change research (Gaillard et al., 2010; Kaplan et al., 2011; Tian et al. 2014; Mazier et al., 2015; Santana-Cordero et al., 2016).
In recent years, many studies related to historical LUCC have been carried out. Two representative global-scale LUCC datasets have been developed: a global land use database for the period AD1700-1992 was established by the Center for Sustainability and the Global Environment (SAGE) at the University of Wisconsin-Madison (Ramankutty and Foley, 1999), and the Historical Database of the Global Environment (HYDE) was established by the Netherlands Environmental Assessment Agency (Klein Goldewijk et al., 2001). HYDE has been updated several times, with HYDE3.1 now covering the period 10000BC-AD2000 (Klein Goldewijk et al., 2011). Based on the AD1700 land cover maps of the SAGE dataset, Pongratz et al. (2008) reconstructed cropland and pastureland cover for AD800-1700 (hereinafter referred to as the PJ dataset) by using historical population data as a proxy. An anthropogenic land cover change dataset named KK10 (Kaplan et al., 2009, 2011) reconstructed land use from 8000BC to AD1850. However, the accuracy of these global datasets is poor at regional scales, as noted, for example, by Ramankutty et al., (2010), Li et al., (2012), Klein Goldewijk et al. (2013), He et al. (2013), and Zhang et al. (2013). Based on local historical documents, Chinese scholars have made great progress in the reconstruction of historical LUCC at national and regional scales (Ge et al., 2008; Ye et al. 2009; He et al., 2015; Jin et al., 2015; Wei et al., 2015; Ye et al., 2015; Li et al., 2016). However, most research has covered only the last three centuries, and few datasets have covered the whole of the last millennium.
The Northern Song Dynasty dates to the start of the 11th century in China (more precisely, to the period AD960-1127). Cropland area estimation for this period is significant for cropland area reconstruction over the whole millennium in China. In our previous studies (He et al., 2012), the cropland area for the mid Northern Song Dynasty(roughly representing AD1078) was estimated at the level of the Lu (an administrative region of the Northern Song Dynasty) by analyzing historical taxed-cropland records and related policies. However, because of a lack of historical records, cropland areas were probably underestimated for some Lus, including Zizhou Lu, Lizhou Lu, Kuizhou Lu, Guangnandong Lu, and Guangnanxi Lu. In addition, cropland area estimation was not possible at the Lu level for some other periods of the Northern Song Dynasty for which only national-level taxed-cropland records are available.
In the present study, the underestimation of taxed-cropland area in the north and south of the Northern Song Dynasty was analyzed; appropriate ranges of cropland area per household in the Northern Song Dynasty are discussed, and a revised determination is made of the underestimation of cropland area per household for the above-mentioned Lus. On the basis of this analysis, we first re-estimate the Lu-level cropland area of the mid Northern Song Dynasty. We then estimate the Lu-level cropland area for another three periods, based on the calibrated national-level taxed-cropland area data and the allocation method that we have developed. Finally, we analyze the spatial-temporal characteristics of the cropland area changes for the period AD976-1078 and make a comparison with the results of previous studies.

2 Data sources and processing

2.1 Study area

The study area is the territory of the Northern Song Dynasty (Figure 1). It is bounded by the Haihe River in Tianjin, Bazhou in Hebei Province, and Yanmenguan in Shanxi Province to the south, and by Hengshan Mountain in Shaanxi Province, the eastern Gansu Province, the Huangshui River basin in Qinghai Province, Minshan Mountain, and the Dadu River in Sichuan Province to the east. The Lu boundaries of the Northern Song Dynasty changed many times during the period AD960-1127. In this study, the 19 Lu-level units of the mid Northern Song Dynasty were employed for comparison purposes. Based on historical records, the study area was divided into two regions: the north and the south. The north includes Lus numbers 1-6, and the south Lus numbers 7-19.
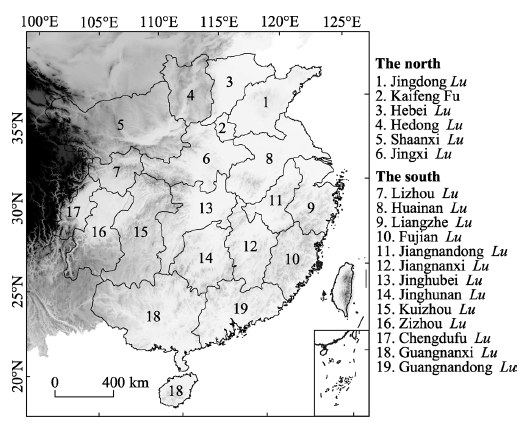
Figure 1 Location of the study area

2.2 Data sources

The data used in this study include taxed-cropland area and the number of households. The data on taxed-cropland area are used as raw materials for estimating cropland area, and the data on number of households are used to estimate population.
Data on taxed-cropland area were obtained mainly from two sources:
1.Collections of Historical Governmental Archives: The Lu-level taxed-cropland area for AD1078 and the national-level taxed-cropland area for the other five periods (Table 1) were obtained from this document.
2.Xinan Gazetteer: Data on taxed-cropland area and on the measured cropland area for six counties in Jiangnandong Lu for AD1174-1189 are recorded in this document and were employed in this study.
Data on the number of households were obtained from Collections of Historical Governmental Archives (Table 1) and the History of Chinese Population (Wu et al., 2000). Wu et al. calibrated the number of households at the Lu level based on a number of historical documents, including the National Gazette, General Condition of Society and Natural Environment in Yuanfeng Term, and Monograph on Geography from the History of Song Dynasty.
Table 1 National-level taxed-cropland area and the number of households in the Northern Song Dynasty
Year Number of households (104) Taxed-cropland area (106 Song-mu)
AD976 309.1 295.33
AD997 413.3 312.53
AD1021 867.8 524.76
AD1051 228.00
AD1066 1291.7 440.00
AD1083 1721.2 461.66

Song-mu: area unit of the Northern Song Dynasty, 1 Song-mu=584.0 m2 (Wu, 2006).

2.3 Data processing

2.3.1 Selection of taxed-cropland area data
The taxed-cropland area data in historical documents are not real cropland areas, as has been acknowledged by many researchers. However, they can still reflect the trend of changes in real cropland area (Zhou, 2001). The national-level taxed-cropland area data in Table 1 indicate that cropland area showed an overall increase during the Northern Song Dynasty, which is consistent with the increase in population and the intensification of land use in this period (Qi, 1987; Han, 1993). Note that the taxed-cropland area data for AD1021 and 1051 in Table 1 are quite different from the general trend of changes in cropland area, which casts doubts upon their validity (Qi, 1987). Therefore, only the taxed-cropland area data for AD976, 997, 1066, and 1083 were selected to reconstruct the cropland area at the Lu level.
2.3.2 Estimation of population data
We obtained data on the number of households for the Northern Song Dynasty with a resolution at the Lu level for AD980-989, 1078, and 1102 from the History of Chinese Population (Wu et al., 2000). The time periods of the data on number of households show a mismatch with those for the data on taxed-cropland area. In this study, for AD1066 and 1078, data on the number of households from the Collections of Historical Governmental Archives and the calibrated national-level results of Wu et al. (2000) were used, respectively. For AD976 and 997, linear interpolation and cross-calibration methods were used, based on the records for AD976 and 997 and the calibrated results for AD980-989 in the History of Chinese Population (Wu et al., 2000). Population data were calculated based on the number of households and conversion coefficients of 5.4 for the north and 5.2 for the south (Wu et al., 2000).

3 Reconstruction method

3.1 Method framework

The objective of this study was reconstruction of cropland area at the Lu level for the Northern Song Dynasty (Figure 2). It involved two major steps:
1) Estimation of Lu-level cropland area for the mid Northern Song Dynasty (AD1078). Based partly on real cropland area data obtained from the projects Land Measurement and Tax Equalization Law (方田均税法) for the north and Land Boundary Survey Law (经界法) for the south, we calculated the ratios of taxed-cropland area and real cropland area for the north and south. We used these ratios to estimate the real cropland area at the Lu level. Subsequently, the results were revised again based on cropland area per household.
2) Reconstruction of Lu-level cropland area for other periods of the Northern Song Dynasty, including AD976, 997, and 1066.The national-level cropland area data for the three periods were revised based on the underestimation ratios for AD1078. Then, by analyzing the relationship between crop distribution on the one hand and elevation, slope, and population on the other, we developed a cropland area distribution model. This model was used to reconstruct the cropland area at the Lu level for AD976, 997, and 1066. Finally, the changes in cropland area at the Lu level for the whole of the Northern Song Dynasty (AD976-1078) were analyzed.
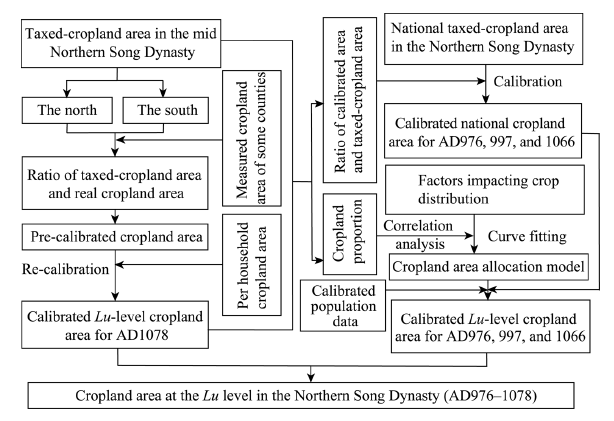
Figure 2 Scheme for reconstruction of cropland area at the Lu level in the Northern Song Dynasty

3.2 Estimation of cropland area for the mid Northern Song Dynasty (AD1078)

In the Northern Song Dynasty, land policy featured free land exchange and mergers. As a result, some people used to underreport their cropland area to the government in order to avoid agricultural tax. We analyzed the underestimation of cropland area and re-estimated cropland area for the mid Northern Song Dynasty in our previous research (Li et al., 2017). Therefore, only three major steps are described here.
3.2.1 Calibration of cropland area
For the north, we were able to use the results of a huge project conducted by Wang Anshi in AD1072 to measure the real cropland area. Data for five Lus in the north (except Jingxi Lu) have been preserved in historical records, and, based on these, we calculated the ratio between real cropland area and registered taxed-cropland area, obtaining a value of 2.08. For the south, some cropland data from the Land Boundary Survey Law project (Qi, 1984) were preserved in a local gazetteer in Huizhou, and we were able to use these to calculate the ratio between real cropland area and registered taxed-cropland area, obtaining a value of 1.93.
3.2.2 Assessment of the calibrated cropland area
Subsequently, we used per-household cropland area (PHCA) to assess the validity of the calibrated cropland area. Based on historical records of per-worker cropland area and per-household workers (1-2) (Wu et al., 2000) in the Song Dynasty, we estimated the PHCA of the Northern Song Dynasty to lie in the range from 20 to 100 Song-mu (Figure 3). Based on this estimate, the PHCA in Zizhou Lu, Lizhou Lu, Kuizhou Lu, Guangnandong Lu, and Guangnanxi Lu is clearly lower than the acceptable range, and therefore we implemented further revisions for these Lus.
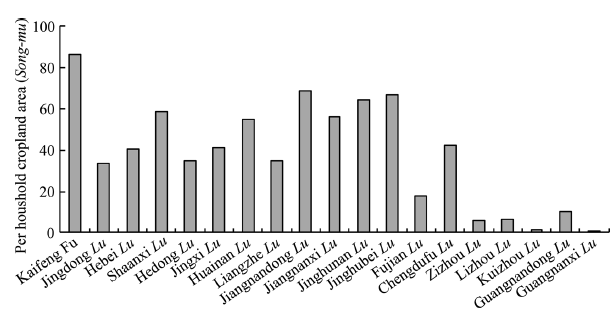
Figure 3 Preliminary revised results for cropland area per household in each Lu in the mid Northern Song Dynasty
3.2.3 Revision of the calibrated cropland area
The above-mentioned five Lus are located in the southwest of the Northern Song Dynasty. Therefore, we analyzed the grain output per Song-mu (Cheng, 2008), the cropping system (Zeng, 2005), and the mean persons in each household recorded in historical documents in the southwest, finding that the basic cropland demand of each household in Zizhou Lu, Lizhou Lu, and Guangnandong Lu was about 20 Song-mu, while in Kuizhou Lu and Guangnanxi Lu it was about 30 Song-mu. Based on these results, we revised the cropland areas of the five Lus (Table 2).
Table 2 Estimates of cropland area in five Lus in the mid Northern Song Dynasty
Lu Pre-revision results (106 Song-mu) Number of families (104) Re-estimated results (106 Song-mu)
Zizhou 2.84 47.8 9.56
Lizhou 2.49 37.2 7.45
Kuizhou 0.43 25.4 7.63
Guangnandong 6.07 57.9 11.59
Guangnanxi 0.11 23.8 7.15

3.3 Reconstruction of cropland area for AD976, 997, and 1066

3.3.1 Calibration of national-level cropland area
In the earlier periods of the Northern Song Dynasty, the government of the Northern Song also carried out a series of projects to survey the real cropland area of the country, but most of these were not implemented effectively and no records were saved (Qi, 1984). In this study, we used the ratios between taxed-cropland area and estimated cropland area of the mid Northern Song Dynasty to calibrate the national-level taxed-cropland area for AD976, 997, and 1066.
3.3.2 Cropland allocation
To reveal the spatial-temporal characteristics of cropland area changes more clearly, we tried to obtain a cropland area dataset with higher spatial resolution, i.e., Lu-level. An approach was developed to convert national-level cropland area into Lu-level cropland area.
Generally, cropland distribution is influenced by both natural factors (including topography, heat, water, soil, and vegetation) and social factors (including population, politics, economy, and war). However, the major drivers may be quite different in different regions or at different scales. Our study area is mainly located in the traditional cultivated area of China. Thus, topography (altitude and slope) is the most important natural factor influencing cropland distribution (Lin et al., 2009). In terms of social factors, the need to feed a growing population, especially during the historical period, led to an increasing area being devoted to cropland for grain production. Therefore, population is the major social factor influencing historical cropland distribution. Other factors, including politics and war, will also influence cropland distribution by their effects on population. Thus, the question arises as to whether topography or population is the dominant factor influencing cropland distribution at the Lu level.
To identify the dominant factor, we implemented correlation analyses at the Lu level between altitude and cropland proportion, between slope and cropland proportion, and between population proportion and cropland proportion. We calculated the average altitude and slope values of each Lu based on the 1 km DEM database (http://www.geodata.cn) and ArcGIS 10.1 (http://www.esri.com/software/arcgis/arcgis-for-desktop). The population proportion here is defined as the population in each Lu expressed as a proportion of the population of the whole country. Similarly, the cropland proportion is the cropland area in each Lu expressed as a proportion of the cropland area of the whole country. The correlation coefficients between altitude and cropland proportion, between slope and cropland proportion, and between population proportion and cropland proportion are -0.183, -0.287, and 0.823, respectively. These results indicate that population is the most important factor influencing cropland distribution at the Lu level.
The impact of population on cropland distribution is quantified by fitting the relationship between population proportion P(i) and cropland proportion C(i) in the mid Northern Song Dynasty (Figure 4). The fitting equation is as follows:
where C(i,tv)andP(i,tv)denote the cropland and population proportions, respectively, of Luiin year tv.
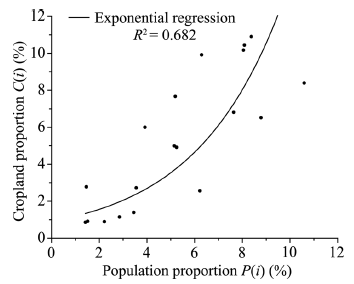
Figure 4 Fitting curve between cropland proportion and population proportion in the mid Northern Song Dynasty
The population proportion can be taken as equivalent to the cropland proportion when the per capita cropland area (PCCA) is similar in each Lu. However, we have found great differences in PCCA among the Lus in the mid Northern Song Dynasty. To eliminate the impact of PCCA on the allocation result, the fitting equation is modified by the introduction of a PCCA index. The PCCA index of Lu i in the mid Northern Song Dynasty is calculated as
where Cp(i) denotes the PCCA of Lu i in the mid Northerm Song Dynasty and max(Cp(i))denotes the maximum value of Cp(i). The modified equation, giving the probabilistic model of the cropland distribution, is then
where δ(i, tv) denotes the distribution probability of cropland area of Lu i in year tv. Equation (3) shows that the greater the population proportion and per capita cropland resource in one Lu, the greater is the cropland distribution probability. The cropland area allocation model is as follows:
where X(i, tv) denotes the cropland area of Lu i in year tv and A(tv) denotes the national-level cropland area in year tv.
Note that from the early to the middle period of the Northern Song Dynasty, there was an overall increase in population, and as a result the cropland area also increased. And to the mid Northern Song Dynasty, the cropland area of each Lu reached the greatest value of the study period (Qi, 1984). Therefore, when the cropland area in any of the Lus exceeded the value in the mid Northern Song Dynasty, the cropland area values of these Lus are replaced by their values in the mid Northern Song Dynasty, and with the extra cropland area being allocated to other Lus with lower cropland areas than those in the mid Northern Song Dynasty based on Equations (3) and (4).
To validate our reconstruction model, we used it to reconstruct the Lu-level cropland area for the mid Northern Song Dynasty, comparing the results with the Lu-level data based on historical records (Figure 5). It can be seen that the absolute relative error of our reconstruction at the Lu level is low overall. There are 19 Lus whose errors are smaller than 30%, and thenumber of Lus whose absolute relative error ranges from 0% to 10%, from 10% to 20%, and from 20% to 30% are 13, 3, and 3, respectively. This comparison indicates that our model provides a good transformation from national-level cropland area to Lu-level cropland area.
Figure 5 Absolute relative error of our reconstruction results in the mid Northern Song Dynasty

4 Results and analysis

4.1 Trend of changes in national-level cropland area

The national-level cropland area in the Northern Song Dynasty showed a tendency to increase over a 100-year period. Driven by rapid population growth, with an increase from 29.83 million in AD976 to 87.30 million in AD1078, and a series of policies and regulations enacted by government to encourage deserted cropland reclamation, the national-level cropland area increased from 468.27 million mu in AD976 to 731.94 million mu in AD1078, i.e., an increase of 263.67 million mu over 100 years (Table 3). The fractional cropland area (FCA) increased from 10.8% in AD976 to 16.9% in AD1078, an increase of 6%. However, the per capita cropland area decreased from 15.7 mu in AD976 to 8.4 mu in AD1078.
Table 3 Reconstruction results of cropland area and population for the Northern Song Dynasty
Year Cropland area
(106mu)
Fractional cropland
area (%)
Population
(104)
Per capita cropland
area (mu)
AD976 468.27 10.8 2982.7 15.7
AD997 495.53 11.4 3988.5 12.4
AD1066 697.65 16.1 6791.9 10.3
AD1078 731.94 16.9 8730.4 8.4

4.2 Trend of changes in Lu-level cropland area

Based on the reconstructed Lu-level cropland area and the land area of each Lu as provided in the Historical Atlas of China (Tan, 1982), we calculated the FCA of each Lu for AD976, 997, 1066, and 1078 (Figure 6). It can be seen from Figure 6 that in the early Northern Song Dynasty, the cropland area was distributed mainly in the Yangtze River Plain, the North China Plain, the Guanzhong Basin, and the Chengdu Plain. The FCA in the Northern Song Dynasty then steadily increased and agricultural activities were gradually restored, with reclamation of cropland expanding to the west and south.
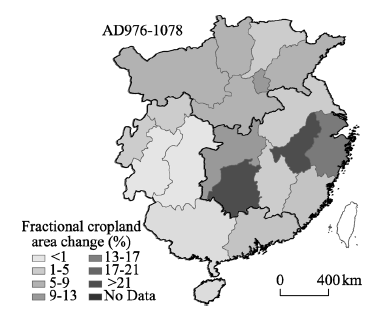
Figure 6 Fractional cropland area for AD976, 997, 1066, and 1078 in the Northern Song Dynasty
Figure 7 FCA changes in each region of the Northern Song Dynasty during AD976-1078
Figure 7 illustrates the changes in Lu-level FCAs of the Northern Song Dynasty during AD976-1078. Based on the characteristics of FCA changes, we divided the study area into three regions: north, southeast, and southwest. We then analyzed the trends of changes in FCAs of the whole country, of each region, and of each Lu.
As the traditionally most widely cultivated region of China, the north has been the main cropland distribution area during the historical period. After the establishment of the Northern Song Dynasty, the population increased and a series of land policies were carried out by the local government, promoting cropland expansion and land intensification. As a result, the FCA for the north increased from 12.7% in AD976 to 17.9% in AD1078 (Figures 6a and 6d; Table 4), and the FCAs of all Lus were greater than 10% in AD1078. In particular, the FCA for the North China Plain was greater than 20%.
The FCA of the southeast showed the greatest growth rate of the three regions in this period, increasing from 16.3% in AD976 to 28.3% in AD1078 as a consequence of increased immigration from the north. Agricultural activity greatly intensified and cropland expanded from the North China Plain to the middle-lower reaches of the Yangtze River Plain. At the Lu level, the three most obvious Lus showing increases in FCA were Jiangnandong Lu (a 33.3% increase), Liangzhe Lu (16.1%), and Jinghunan Lu (22.9%) (Figure 7). In contrast, the FCA only increased by 2.8% in Fujian Lu. In the mid Northern Song Dynasty, the FCAs for some regions of the middle-lower reaches of the Yangtze River Plain were greater than 40% (Figure 6d).
In the southwest (except for the Chengdu Plain), agricultural development was greatly restricted by natural conditions. This situation did not change during the Northern Song Dynasty, so the cropland area increased slowly in the southwest. From AD 976 to AD1078, the FCA of the southwest increased from 3.8% to 5.0% (Figures 6a and 6d; Table 4). At the Lu level, the FCA increased by 3.3% in Guangnandong Lu, 2.8% in Guangnanxi Lu, 1.5% in Chengdufu Lu, and less than 1% in the other Lus (Figure 7). In AD1078, the FCA increased to 32.2% in the Chengdufu Lu, while the FCAs of other Lus were less than 6% (Figure 6d), with values of only about 2% in Kuizhou Lu and Guangnanxi Lu.
Table 4 Changes in FCA in each region of the study area during AD976-1078 (%)
Year North Southeast Southwest
AD976 12.7 16.3 3.8
AD1078 17.9 28.3 5.0
Change 5.2 12.0 1.2

4.3 Comparative analysis with existing datasets

The previous land use datasets that have been used for conducting a comparative analysis of the outcome of restructuring historical cropland in the Northern Song Dynasty are primarily HYDE (Klein Goldewijk et al., 2011; Klein Goldewijk et al., 2001) and PJ (Pongratz et al., 2008). HYDE, PJ, and the dataset used in the present study have different temporal intervals and spatial resolutions. In order to facilitate comparison, data related to 19 Lus in AD1100 were drawn from HYDE and PJ, and then compared with this study. The results of this comparison indicate that the estimates of the total cropland area for the study area obtained from HYDE and PJ datasets, 565.50 and 492.60 million mu, respectively, were both lower than the estimate of 731.94 million mu obtained in the present study. The result using HYDE is closer to ours, so we performed another comparison with this dataset, but this time at the Lu level. The results show that the differences between the total cropland area of the Lus drawn from HYDE and those from this study are greater, with about one-third of Lus showing a difference of more than 75%. The cropland areas of Jiangnanxi Lu, Jiangnandong Lu, and Chengdufu Lu drawn from HYDE are less than those from this study by 76.2%, 77.2%, and 79.1%, respectively. In contrast, the cropland areas of Jingdong Lu, Zizhou Lu, and Guangnanxi Lu drawn from HYDE are greater than those from this study by 75.7%, 218.9%, and 410.5%, respectively (Figure 8).
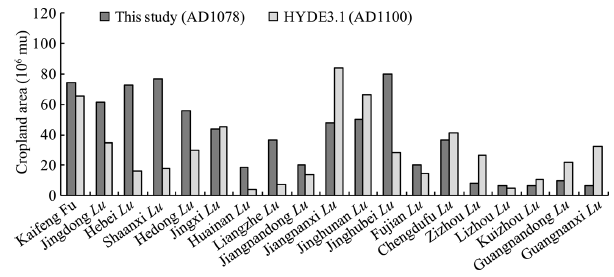
Figure 8 Comparison of reconstructed cropland areas in the mid Northern Song Dynasty at the Lu level

5 Conclusions

In this study, we have reconstructed the cropland area in the Northern Song Dynasty. The major findings of the study can be summarized as follows:
(1) Based on historical documents and an analysis of the factors influencing cropland distribution at the Lu level, a probabilistic model of cropland distribution and a cropland area allocation model have been developed. The number of Lus with absolute relative errors in the ranges from 0-20% is 16, accounting for 84.2% of all Lus, which indicates that the model provides a good representation of the spatial distribution of cropland in the Northern Song Dynasty.
(2) The cropland area of the whole country for the years AD 976, 997, 1066, and 1078 was about 468.27 million, 495.53 million, 697.65 million, and 731.94 million mu, respectively. The national-level cropland area showed a tendency to increase over a period of 100 years. The population of the whole country for AD976, 997, 1066, and 1078 was about 29.83 million, 39.89 million, 67.92 million, and 87.30 million, respectively. The FCA increased from 10.8% in AD976 to 16.9% in AD1078. PCCA in the Northern Song Dynasty decreased from 15.7 mu to 8.4 mu.
(3) In terms of the spatial patterns of cropland change during the period AD976-1078, the FCA of the southeast, north, and southwest regions of the Northern Song territory increased by 12.0%, 5.2%, and 1.2%, respectively. The FCA for some regions in the Yangtze River Plain was greater than 40% in AD1078, and for the North China Plain it was greater than 20%. The FCAs of the Lus in the southwest (except for the Chengdu Plain) of the Northern Song territory were less than 6%. The FCA was only about 2% in Kuizhou Lu and Guangnanxi Lu.

The authors have declared that no competing interests exist.

[1]
Brovkin V, Sitch S, Bloh W V et al., 2004. Role of land cover changes for atmospheric CO2 increase and climate change during the last 150 years.Global Change Biology, 2004, 10(8): 1253-1266.

[2]
Cheng M S, 2008. The study on living standard and currency value in the Song Dynasty.Journal of Historical Science, (3): 100-111. (in Chinese)

[3]
Collections of Historical Governmental Archives(《文献通考》) published in the Southern Song Dynasty, Vol. 4. (in Chinese)

[4]
Flato G, Marotzke J, Abiodun B et al., 2013. Evaluation of climate models. In: Climate Change 2013: The Physical Science Basis.Contribution of Working Group I to the fifth Assessment Report of the Intergovernmental Panel on Climate Change. Cambridge, United Kingdom and New York, NY, USA: Cambridge University Press.

[5]
Gaillard M J, Sugita S, Mazier Fet al., 2010. Holocene land-cover reconstructions for studies on land cover-climate feedbacks.Climate of the Past, 6: 483-499.The major objectives of this paper are: (1) to review the pros and cons of the scenarios of past anthropogenic land cover change (ALCC) developed during the last ten years, (2) to discuss issues related to pollen-based reconstruction of the past land-cover and introduce a new method, REVEALS (Regional Estimates of VEgetation Abundance from Large Sites), to infer long-term records of past landcover from pollen data, (3) to present a new project (LANDCLIM:LAND cover - CLIMate interactions in NW Europe during the Holocene) currently underway, and show preliminary results of REVEALS reconstructions of the regional land-cover in the Czech Republic for five selected time windows of the Holocene, and (4) to discuss the implications and future directions in climate and vegetation/land-cover modeling, and in the assessment of the effects of human-induced changes in land-cover on the regional climate through altered feedbacks. The existing ALCC scenarios show large discrepancies between them, and few cover time periods older than AD 800. When these scenarios are used to assess the impact of human land-use on climate, contrasting results are obtained. It emphasizes the need for methods such as the REVEALS model-based land-cover reconstructions. They might help to fine-tune descriptions of past landcover and lead to a better understanding of how long-term changes in ALCC might have influenced climate. The REVEALS model is demonstrated to provide better estimates of the regional vegetation/land-cover changes than the traditional use of pollen percentages. This will achieve a robust assessment of land cover at regional- to continental-spatial scale throughout the Holocene. We present maps of REVEALS estimates for the percentage cover of 10 plant functional types (PFTs) at 200 BP and 6000 BP, and of the two open-land PFTs "grassland" and "agricultural land" at five time-windows from 6000 BP to recent time. The LANDCLIM results are expected to provide crucial data to reassess ALCC estimates for a better understanding of the land suface-atmosphere interactions

DOI

[6]
Ge Q S, Dai J H, He F Net al., 2008. Land use changes and their relations with carbon cycles over the past 300a in China.Science in China Series D - Earth Sciences, 51(6): 871-884.

[7]
General Condition of Society and Natural Environment in Yuanfeng Term(《元丰九域志》) published in the Northern Song Dynasty.

[8]
Han M L, 1993. Agricultural Geography of the Song Dynasty. Taiyuan: Shanxi Ancient Classics Publishing House. (in Chinese)

[9]
He F N, Li S C, Zhang X Zet al, 2013. Comparisons of cropland area from multiple datasets over the past 300 years in the traditional cultivated region of China.Journal of Geographical Sciences, 23(6): 978-990.lt;p>Land use/cover change is an important parameter in the climate and ecological simulations. Although they had been widely used in the community, SAGE dataset and HYDE dataset, the two representative global historical land use datasets, were little assessed about their accuracies in regional scale. Here, we carried out some assessments for the traditional cultivated region of China (TCRC) over last 300 years, by comparing SAGE2010 and HYDE (v3.1) with Chinese Historical Cropland Dataset (CHCD). The comparisons were performed at three spatial scales: entire study area, provincial area and 60 km by 60 km grid cell. The results show that (1) the cropland area from SAGE2010 was much more than that from CHCD; moreover, the growth at a rate of 0.51% from 1700 to 1950 and -0.34% after 1950 were also inconsistent with that from CHCD. (2) HYDE dataset (v3.1) was closer to CHCD dataset than SAGE dataset on entire study area. However, the large biases could be detected at provincial scale and 60 km by 60 km grid cell scale. The percent of grid cells having biases greater than 70% (&lt;-70% or &gt;70%) and 90% (&lt;-90% or &gt;90%) accounted for 56%-63% and 40%-45% of the total grid cells respectively while those having biases range from -10% to 10% and from -30% to 30% account for only 5%-6% and 17% of the total grid cells respectively. (3) Using local historical archives to reconstruct historical dataset with high accuracy would be a valuable way to improve the accuracy of climate and ecological simulation.</p>

DOI

[10]
He F N, Li S C, Zhang X Z, 2012.Reconstruction of cropland area and spatial distribution in the mid-Northern Song Dynasty (AD1004-1085).Journal of Geographical Sciences, 22(2): 359-370.lt;p>To understand historical human-induced land cover change and its climatic effects, it is necessary to create historical land use datasets with explicit spatial information. Using the taxes-cropland area and number of families compiled from historical documents, we estimated the real cropland area and populations within each <em>Lu</em> (a province-level political region in the Northern Song Dynasty) in the mid-Northern Song Dynasty (AD1004-1085). The estimations were accomplished through analyzing the contemporary policies of tax, population and agricultural development. Then, we converted the political region-based cropland area to geographically explicit grid cell-based fractional cropland at the cell size of 60 km by 60 km. The conversion was based on calculating cultivation suitability of each grid cell using the topographic slope, altitude and population density as the independent variables. As a result, the total area of cropland within the Northern Song territory in the 1070s was estimated to be about 720 million <em>mu</em> (Chinese area unit, 1 <em>mu</em> = 666.7 m<sup>2</sup>), of which 40.1% and 59.9% occurred in the north and south respectively. The population was estimated to be about 87.2 million, of which 38.7% and 61.3% were in the north and south respectively, and per capita cropland area was about 8.2 <em>mu</em>. The national mean reclamation ratio (i.e. ratio of cropland area to total land area; RRA hereafter for short) was bout 16.6%. The plain areas, such as the North China Plain, the middle and lower reaches of the Yangtze River, Guanzhong Plain, plains surrounding the Dongting Lake and Poyang Lake and Sichuan Basin, had a higher RRA, being mostly over 40%; while the hilly and mountainous areas, such as south of Nanling Mountains, the southwest regions (excluding the Chengdu Plain), Loess Plateau and southeast coastal regions, had a lower RRA, being less than 20%. Moreover, RRA varied with topographic slope and altitude. In the areas of low altitude (&le;250 m), middle altitude (250-100 m) and high altitude (1000-3500 m), there were 443 million, 215 million and 64 million <em>mu</em> of cropland respectively and their regional mean RRAs were 27.5%, 12.6% and 7.2% respectively. In the areas of flat slope, gentle slope, medium slope and steep slope, there were 116 million, 456 million, 144 million and 2 million <em>mu</em> of cropland respectively and their regional mean RRAs were 34.6%, 20.7%, 8.5% and 2.3% respectively.</p>

DOI

[11]
He F N, Li S C, Zhang X Z, 2015. A spatially explicit reconstruction of forest cover in China over 1700-2000.Global and Planetary Change, 131: 73-81.The spatially explicit reconstruction of historical forest plays an important role in understanding human modifications of land surfaces and its environmental effects. Based on an analysis of the forest change history of China, we devised a reconstruction method for the historical forest cover in China. The core idea of the method is that the lands with high suitability for cultivation will be cultivated and deforested first, spreading to marginal lands with lower suitability for cultivation. By determining the possible maximum distribution extent of the forest, as well as devising the land suitability for cultivation assessment model and provincial forest area allocation model, we created 10km forest cover maps of China for the years 1700 to 2000 with 10year intervals. By comparison with satellite-based data in 2000, we found that the grids within 25% differences account for as much as 66.07% of all grids. The comparison with the historical documents-based data in northeast China indicated that the number of counties within 30% relative differences is 99, accounting for 74.44% of all counties. Therefore, the forest area allocation model we devised can accurately reproduce the spatial patterns of historical forest cover in China. Our reconstruction indicates that from 1700 to the 1960s, the deforestation mainly occurred in southwest China, the hilly regions of south China, the southeast of Gansu province, and northeast China; from the 1960s to 2000, the reforestation occurred in most traditional forested regions of China, particularly in the Tibet Plateau, hilly regions of south China and the Greater Khingan Mountains. The spatially explicit forest cover data sets we reconstructed can be used in global or regional climatic models to study the impact of land cover change on climate change.

DOI

[12]
Jin X B, Cao X, Du X Det al., 2015. Farmland dataset reconstruction and farmland change analysis in China during 1661-1985.Journal of Geographical Sciences, 25(9): 1058-1074.

DOI

[13]
Kaplan J O, Krumhardt K M, Zimmerman N, 2009.The prehistoric and preindustrial deforestation of Europe.Quaternary Science Reviews, 2009, 28(27): 3016-3034.Humans have transformed Europe's landscapes since the establishment of the first agricultural societies in the mid-Holocene. The most important anthropogenic alteration of the natural environment was the clearing of forests to establish cropland and pasture, and the exploitation of forests for fuel wood and construction materials. While the archaeological and paleoecological record documents the time history of anthropogenic deforestation at numerous individual sites, to study the effect that prehistoric and preindustrial deforestation had on continental-scale carbon and water cycles we require spatially explicit maps of changing forest cover through time. Previous attempts to map preindustrial anthropogenic land use and land cover change addressed only the recent past, or relied on simplistic extrapolations of present day land use patterns to past conditions. In this study we created a very high resolution, annually resolved time series of anthropogenic deforestation in Europe over the past three millennia by 1) digitizing and synthesizing a database of population history for Europe and surrounding areas, 2)developing a model to simulate anthropogenic deforestation based on population density that handles technological progress, and 3) applying the database and model to a gridded dataset of land suitability for agriculture and pasture to simulate spatial and temporal trends in anthropogenic deforestation. Our model results provide reasonable estimations of deforestation in Europe when compared to historical accounts. We simulate extensive European deforestation at 1000 BC, implying that past attempts to quantify anthropogenic perturbation of the Holocene carbon cycle may have greatly underestimated early human impact on the climate system.

DOI

[14]
Kaplan J O, Krumhardt K M, Ellis E Cet al., 2011. Holocene carbon emissions as a result of anthropogenic land cover change.The Holocene, 21(8): 775-791.Abstract Humans have altered the Earth land surface since the Paleolithic mainly by clearing woody vegetation first to improve hunting and gathering opportunities, and later to provide agricultural cropland. In the Holocene, agriculture was established on nearly all continents and led to widespread modification of terrestrial ecosystems. To quantify the role that humans played in the global carbon cycle over the Holocene, we developed a new, annually resolved inventory of anthropogenic land cover change from 8000 years ago to the beginning of large-scale industrialization (ad 1850). This inventory is based on a simple relationship between population and land use observed in several European countries over preindustrial time. Using this data set, and an alternative scenario based on the HYDE 3.1 land use data base, we forced the LPJ DGVM in a series of continuous simulations to evaluate the impacts of ALCC on terrestrial carbon storage during the preindustrial Holocene. Our model setup allowed us to quantify the importance of land degradation caused by repeated episodes of land use followed by abandonment. By 3 ka BP, cumulative carbon emissions caused by anthropogenic land cover change in our new scenario ranged between 84 and 102 Pg, translating to c. 7 ppm of atmospheric CO2. By ad 1850, emissions were 325-357 Pg in the new scenario, in contrast to 137-189 Pg when driven by HYDE. Regional events that resulted in local emissions or uptake of carbon were often balanced by contrasting patterns in other parts of the world. While we cannot close the carbon budget in the current study, simulated cumulative anthropogenic emissions over the preindustrial Holocene are consistent with the ice core record of atmospheric d13CO2 and support the hypothesis that anthropogenic activities led to the stabilization of atmospheric CO2 concentrations at a level that made the world substantially warmer than it otherwise would be.

DOI

[15]
Kaplan J O, Krumhardt K M, Zimmermann N E, 2012. The effects of land use and climate change on the carbon cycle of Europe over the past 500 years.Global Change Biology, 18(3): 902-914.The long residence time of carbon in forests and soils means that both the current state and future behavior of the terrestrial biosphere are influenced by past variability in climate and anthropogenic land use. Over the last half-millennium, European terrestrial ecosystems were affected by the cool temperatures of the Little Ice Age, rising CO2 concentrations, and human induced deforestation and land abandonment. To quantify the importance of these processes, we performed a series of simulations with the LPJ dynamic vegetation model driven by reconstructed climate, land use, and CO2 concentrations. Although land use change was the major control on the carbon inventory of Europe over the last 500 years, the current state of the terrestrial biosphere is largely controlled by land use change during the past century. Between 1500 and 2000, climate variability led to temporary sequestration events of up to 3 Pg, whereas increasing atmospheric CO2 concentrations during the 20th century led to an increase in carbon storage of up to 15 Pg. Anthropogenic land use caused between 25 Pg of carbon emissions and 5 Pg of uptake over the same time period, depending on the historical and spatial pattern of past land use and the timing of the reversal from deforestation to afforestation during the last two centuries. None of the currently existing anthropogenic land use change datasets adequately capture the timing of the forest transition in most European countries as recorded in historical observations. Despite considerable uncertainty, our scenarios indicate that with limited management, extant European forests have the potential to absorb between 5 and 12 Pg of carbon at the present day.

DOI

[16]
Klein Goldewijk K, 2001. Estimating global land use change over the past 300 years: The HYDE database.Global Biogeochemical Cycles, 15(2): 417-433.Testing against historical data is an important step for validating integrated models of global environmental change. Owing to long time lags in the climate system, these models should aim the simulation of the land use dynamics for long periods, i.e., spanning decades up to a century. Developing such models requires understanding of past and current trends and is therefore strongly data dependent. For this purpose, a history database of the global environment has been developed: HYDE. This paper describes and analyzes parts of HYDE version 2.0, presenting historical population and land use patterns for the past 300 years. Results suggest, among other things, a global increase of cropland area from 265 million ha in 1700 to 1471 million ha in 1990, while the area of pasture has increased more than six fold from 524 to 3451 million ha. In general, the increase of man-made agricultural land took place at the expense of natural grasslands and to a lesser extent of forests. There are differences between the several regions in the temporal pace of these land use conversions. The temperate/developed regions of Canada, United States, USSR, and Oceania appear to have had their strongest increase during the 19th century, while most of the tropical/developing regions witnessed the largest land use conversions at the end of the last century. Results of this analysis can be used to test integrated models of global change and are available at http://www.rivm.nl/env/int/hyde/.

DOI

[17]
Klein Goldewijk K, 2011. The HYDE 3.1 spatially explicit database of human-induced global land-use change over the past 12,000 years.Global Ecology and Biogeography, 20(1): 73-86.ABSTRACT Aim68 This paper presents a tool for long-term global change studies; it is an update of the History Database of the Global Environment (HYDE) with estimates of some of the underlying demographic and agricultural driving factors. Methods68 Historical population, cropland and pasture statistics are combined with satellite information and specific allocation algorithms (which change over time) to create spatially explicit maps, which are fully consistent on a 5′ longitude/latitude grid resolution, and cover the period 10,000bctoad2000. Results68 Cropland occupied roughly less than 1% of the global ice-free land area for a long time untilad1000, similar to the area used for pasture. In the centuries that followed, the share of global cropland increased to 2% inad1700 (. 3 million km) and 11% inad2000 (15 million km), while the share of pasture area grew from 2% inad1700 to 24% inad2000 (34 million km) These profound land-use changes have had, and will continue to have, quite considerable consequences for global biogeochemical cycles, and subsequently global climate change. Main conclusions68 Some researchers suggest that humans have shifted from living in the Holocene (emergence of agriculture) into the Anthropocene (humans capable of changing the Earth's atmosphere) since the start of the Industrial Revolution. But in the light of the sheer size and magnitude of some historical land-use changes (e.g. as result of the depopulation of Europe due to the Black Death in the 14th century and the aftermath of the colonization of the Americas in the 16th century) we believe that this point might have occurred earlier in time. While there are still many uncertainties and gaps in our knowledge about the importance of land use (change) in the global biogeochemical cycle, we hope that this database can help global (climate) change modellers to close parts of this gap.

DOI

[18]
Klein Goldewijk K, Verburg P H, 2013. Uncertainties in global-scale reconstructions of historical land use: an illustration using the HYDE data set.Landscape Ecology, 28(5): 861-877.Land use and land-use change play an important role in global integrated assessments. However, there are still many uncertainties in the role of current and historical land use in the global carbon cycle as well as in other dimensions of global environmental change. Although databases of historical land use are frequently used in integrated assessments and climate studies, they are subject to considerable uncertainties that often are ignored. This paper examines a number of the most important uncertainties related to the process of reconstructing historical land use. We discuss the origins of different types of uncertainty and the sensitivity of land-use reconstructions to these uncertainties. The results indicate that uncertainties not only arise as result of the large temporal and spatial variation in historical population data, but also relate to assumptions on the relationship between population and land use used in the reconstructions. Improving empirical data to better specify and validate the assumptions about the relationship between population and land use, while accounting for the spatial and temporal variation, could reduce uncertainties in the reconstructions. Such empirical evidence could be derived from local case studies, such as those conducted in landscape ecology, environmental history, archeology and paleoecology.

DOI

[19]
Li B B, Fang X Q, Ye Yet al., 2010. Accuracy assessment of global historical cropland datasets based on regional reconstructed historical data: A case study in Northeast China.Science China Earth Sciences, 53(11): 1689-1699.Historical cropland datasets are fundamental for quantifying the effects of human land use activities on climatic change and the carbon cycle. Two representative global land-use datasets, the Global Land Use Database (termed SAGE dataset) and the Historical Database of the Global Environment (termed HYDE dataset) have been established and used widely. Despite improvement of data quality and methodologies for extracting historical land use information, certain dataset limitations exist that need to be quantified and communicated to users so that they can make informed decisions on whether and how these land-use products should be used. The Cropland data of Northeast China (CNEC) is based on calibrated historical data and a multi-sourced data conversion model, and reconstructs cropland cover change in Northeast China over the last 300 years. Using the CNEC as a reference, we evaluated the accuracy of cropland cover for SAGE and HYDE in Northeast China at spatial scales ranging from the entire Northeast China to provinces and even individual raster grid cells. Neither SAGE nor HYDE reflects real historical land reclamation. Cropland areas in SAGE are overestimated by 20.98 times in 1700 to 1.6 times in 1990. Although HYDE is better, there are significant disagreements in cropland area and distribution between HYDE and CNEC, especially in the 18th and 19th centuries. The proportion of total grid cells whose relative error was greater than 100% was 63.55% in 1700 and 53.27% in 1780. Global cropland dataset errors over Northeast China originate mainly from both the reverse calculation method for historical cropland data based on modern spatial patterns, and modern land-use outputs from satellite data.

DOI

[20]
Li M J, He F N, Liu H L, 2017. Re-estimation of Lu-level cropland area in the mid-Northern Song Dynasty.Geographical Research, 35(12): 2322-2332. (in Chinese)

[21]
Li S C, He F N, Zhang X Z, 2016.A spatially explicit reconstruction of cropland cover in China from 1661 to 1996. Regional Environmental Change, 16(2): 417-428.Reconstruction of cropland cover is crucial for assessing human impact on the environment. In this study, based on existing studies concerning historical cropland, population data and government inventories, we obtained a provincial cropland area dataset of China for 1661–1996 via collection, revision and reconstruction. Then, the provincial cropland area was allocated into grid cells of 10×10km depending on the land suitability for cultivation. Our reconstruction indicates that cropland increased from ~55.5×10 4 km 2 in 1661 to ~130.0×10 4 km 2 in 1996. From 1661 to 1873, cropland expanded tremendously in the Sichuan Basin, and land reclamation was greatly enhanced in North China Plain. For 1873–1980, agricultural development occurred primarily in northeastern China. After 1980, most provinces in the traditionally cultivated region of China experienced decreases in cropland area. In comparison with satellite-based data for 2000, we found that our reconstruction generally captures the spatial distribution of cropland. Also, differences are mostly <20% (6120 to 20%). Compared with HYDE 3.1 dataset, which is designed for the global scale, our model is more suitable for reconstructing the historical crop cover of China at 10×10km grid scale. Our reconstruction can be used in climate models to study the impact of crop cover change on the climate and carbon cycle.

DOI

[22]
Mazier F, Broström A, Bragée Pet al., 2015. Two hundred years of land-use change in the South Swedish Uplands: Comparison of historical map-based estimates with a pollen-based reconstruction using the landscape reconstruction algorithm.Vegetation History and Archaeobotany, 24(5): 555-570.Long-term records of environmental history at decadal to millennial time-scales enable an assessment of ecosystem variability and responses to past anthropogenic disturbances and are fundamental for the development of environmental management strategies. This study examines the local variability of land-use history in the South Swedish Uplands over the last 20002years based on pollen records from three lake-sediment successions. Temporal changes in the proportional cover of 14 plant taxa were quantified as percentages using the landscape reconstruction algorithm (LRA). The LRA-based estimates of the extent of four land-use categories (cropland, meadows/grassland, wetland, outland/woodland) were compared to corresponding estimates based on historical maps and aerial photographs from ad 1769–1823, 1837–1895, 1946 and 2005. Although the LRA approach tends to overestimate grassland cover by 10–3002% for the two earliest time periods, the reconstructed vegetation composition is generally in good agreement with estimates based on the historical records. Subsequently, the LRA approach was used to reconstruct the 200-year history of local land-use dynamics at 20-year intervals around two small lakes. The qualitative assessment of difference approach, which requires fewer assumptions and parameters than LRA for objective evaluation of between-site differences in plant abundances, provides consistent results in general. Significant differences exist in the land-use history between the sites. Local catchment characteristics, such as soil conditions and wetland cover, appear important for the development of human impact on the landscape. Quantifications of past vegetation dynamics provide information on the amplitude, frequency and duration of the land-use changes and their effects on terrestrial and aquatic ecosystems, and should be taken into account when nature conservation strategies are developed.

DOI

[23]
Monograph on Geography from the History of Song Dynasty(《宋史·地理志》) published in the Yuan Dynasty.

[24]
National Gazette (《太平寰宇记》) published in the Northern Song Dynasty.(in Chinese)

[25]
Pongratz J, Reick C, Raddatz Tet al., 2008. A reconstruction of global agricultural areas and land cover for the last millennium.Global Biogeochemical Cycles, 22(3): 1-16.Humans have substantially modified the Earth's land cover, especially by transforming natural ecosystems to agricultural areas. In preindustrial times, the expansion of agriculture was probably the dominant process by which humankind altered the Earth system, but little is known about its extent, timing, and spatial pattern. This study presents an approach to reconstruct spatially explicit changes in global agricultural areas (cropland and pasture) and the resulting changes in land cover over the last millennium. The reconstruction is based on published maps of agricultural areas for the last three centuries. For earlier times, a country-based method is developed that uses population data as a proxy for agricultural activity. With this approach, the extent of cropland and pasture is consistently estimated since AD 800. The resulting reconstruction of agricultural areas is combined with a map of potential vegetation to estimate the resulting historical changes in land cover. Uncertainties associated with this approach, in particular owing to technological progress in agriculture and uncertainties in population estimates, are quantified. About 5 million kmof natural vegetation are found to be transformed to agriculture between AD 800 and 1700, slightly more to cropland (mainly at the expense of forested area) than to pasture (mainly at the expense of natural grasslands). Historical events such as the Black Death in Europe led to considerable dynamics in land cover change on a regional scale. The reconstruction can be used with global climate and ecosystem models to assess the impact of human activities on the Earth system in preindustrial times.

DOI

[26]
Qi X, 1983. Imbalanced development of the agricultural production in the Song Dynasty: A study based mainly on agricultural management modes and yield per unit area.Academic Journal of Zhongzhou, (1): 102-110. (in Chinese)

[27]
Qi X, 1987. The Economic History of the Song Dynasty: First Volume. Shanghai: Shanghai People’s Publishing House. (in Chinese)

[28]
Ramankutty N, Delire C, Snyder P, 2006. Feedbacks between agriculture and climate: An illustration of the potential unintended consequences of human land use activities.Global and Planetary Change, 54(1/2): 79-93.Agriculture has significantly transformed the face of the planet. In particular, croplands have replaced natural vegetation over large areas of the global land surface, covering around 18million km 2 of the land surface today. To grow crops, humans have taken advantage of the resource provided by climate - optimum temperature and precipitation. However, the clearing of land for establishing croplands might have resulted in an inadvertent change in the climate. This feedback might, in turn, have altered the suitability of land for growing crops. In this sensitivity study, we used a combination of land cover data sets, numerical models, and cropland suitability analysis, to estimate the degree to which the replacement of natural vegetation by croplands might have altered the land suitability for cultivation. We found that the global changes in cropland suitability are likely to have been fairly small, however large regional changes in cropland suitability might have occurred. Our theoretical study showed that major changes in suitability occurred in Canada, Eastern Europe, the Former Soviet Union, northern India, and China. Although the magnitude, sign, and spatial patterns of change indicated by this study may be an artifact of our particular model and experimental design, our study is illustrative of the potential inadvertent consequences of human activities on the land. Moreover, it offers a methodology for evaluating how climate changes due to human activities on the land may alter the multiple services offered by ecosystems to human beings.

DOI

[29]
Ramankutty N, Foley J A, 1999. Estimating historical changes in global land cover: Croplands from 1700 to 1992.Global Biogeochemical Cycles, 13(4): 997-1027.Baethge C, Marx C.

DOI

[30]
Ramankutty N, Foley J A, 2010. ISLSCP II historical croplands cover, 1700-1992. In: Hall F G, Collatz G J, Meeson B et al. ISLSCP Initiative II Collection.Tennessee:Oak Ridge National Laboratory Distributed Active Archive Center, 1-20.

[31]
Santana-Cordero A M, Monteiro-Quintana M L, Hernández-Calvento L, 2016. Reconstruction of the land uses that led to the termination of an arid coastal dune system: The case of the Guanarteme dune system (Canary Islands, Spain), 1834-2012. Land Use Policy, 55: 73-85.Coastal areas have been under pressure throughout history. Today these environments are occupied by a large portion of the world population and are dramatically affected by human activities. For a better understanding of the natural evolution of coastal ecosystems and their present state, historical studies are necessary. For this purpose researchers should apply methods that combine different historical sources, such as historic mapping and oral sources. In this paper we examine land uses that led to the disappearance of an arid coastal dune system, and the way to study it. Results reveal that each different land use had a different impact on the environment, and this was in correspondence with socio-economic needs. Finally, we discuss the results obtained and the methodology used.

DOI

[32]
Strassmann K M, Joos F, Fischer G, 2008. Simulating effects of land use changes on carbon fluxes: past contributions to atmospheric CO2 increases and future commitments due to losses of terrestrial sink capacity.Tellus B, 60(4): 583-603.The impact of land use on the global carbon cycle and climate is assessed. The Bern carbon cycle-climate model was used with land use maps from HYDE3.0 for 1700 to 2000 A.D. and from post-SRES scenarios for this century. Cropland and pasture expansion each cause about half of the simulated net carbon emissions of 188 Gt C over the industrial period and 1.1 Gt C yr 611 in the 1990s, implying a residual terrestrial sink of 113 Gt C and of 1.8 Gt C yr 611 , respectively. Direct CO 2 emissions due to land conversion as simulated in book-keeping models dominate carbon fluxes due to land use in the past. They are, however, mitigated by 25% through the feedback of increased atmospheric CO 2 stimulating uptake. CO 2 stimulated sinks are largely lost when natural lands are converted. Past land use change has eliminated potential future carbon sinks equivalent to emissions of 80–150 Gt C over this century. They represent a commitment of past land use change, which accounts for 70% of the future land use flux in the scenarios considered. Pre-industrial land use emissions are estimated to 45 Gt C at most, implying a maximum change in Holocene atmospheric CO 2 of 3 ppm. This is not compatible with the hypothesis that early anthropogenic CO 2 emissions prevented a new glacial period.

DOI

[33]
Tan Q X, 1982. Historical Atlas of China: The Sixth Book. Beijing: SinoMaps Press, 12-41. (in Chinese)

[34]
Tao B, Tian H Q, Chen G Set al., 2013. Terrestrial carbon balance in tropical Asia: Contribution from cropland expansion and land management.Global and Planetary Change, 100: 85-98.Tropical Asia has experienced dramatic cropland expansion and agricultural intensification to meet the increasing food demand and is likely to undergo further rapid development in the near future. Much concern has been raised about how cropland expansion and associated management practices (nitrogen fertilizer use, irrigation, etc.) have affected the terrestrial carbon cycle in this region. In this study, we used a process-based ecosystem model, the Dynamic Land Ecosystem Model (DLEM), to assess the magnitude, spatial and temporal patterns of terrestrial carbon fluxes and pools in Tropical Asia as resulted from cropland expansion and land management practices during 1901–2005. The results indicated that cropland expansion had resulted in a release of 19.1202±023.0602Pg02C (0.1802±020.02902Pg02C/yr) into the atmosphere in Tropical Asia over the study period. Of this amount, approximately 22% (4.1802±020.6602Pg02C) was released from South Asia and 78% (14.9402±022.4002Pg02C) from Southeast Asia. Larger land area was converted to cropland while less carbon was emitted from South Asia than from Southeast Asia, where forest biomass and soil carbon were significantly higher. Changes in vegetation, soil organic matter, and litter pools caused emissions of 15.58, 2.25, and 1.7102Pg02C, respectively, from the entire region. Significant decreases in vegetation carbon occurred across most regions of Southeast Asia due to continuous cropland expansion and shrink of natural forests. When considering land management practices, however, less carbon was released into the atmosphere, especially in South Asia where land management practices contributed to an approximately 10% reduction in carbon emission. This implies that optimizing land management practices could greatly reduce the carbon emissions caused by cropland expansion and might be one of important climate mitigation options in Tropical Asia.

DOI

[35]
Tian H Q, Chen G S, Zhang Cet al., 2012a. Century-level responses of ecosystem carbon storage and flux to multiple environmental changes in the southern United States.Ecosystems, 15(4): 674-694.Terrestrial ecosystems in the southern United States (SUS) have experienced a complex set of changes in climate, atmospheric CO2 concentration, tropospheric ozone (O-3), nitrogen (N) deposition, and land-use and land-cover change (LULCC) during the past century. Although each of these factors has received attention for its alterations on ecosystem carbon (C) dynamics, their combined effects and relative contributions are still not well understood. By using the Dynamic Land Ecosystem Model (DLEM) in combination with spatially explicit, longterm historical data series on multiple environmental factors, we examined the century-scale responses of ecosystem C storage and flux to multiple environmental changes in the SUS. The results indicated that multiple environmental changes shifted SUS ecosystems from a C source of 1.20 +/- A 0.56 Pg (1 Pg = 10(15) g) during the period 1895 to 1950, to a C sink of 2.00 +/- A 0.94 Pg during the period 1951 to 2007. Over the entire period spanning 1895-2007, SUS ecosystems were a net C sink of 0.80 +/- A 0.38 Pg. The C sink was primarily due to an increase in the vegetation C pool, whereas the soil C pool decreased during the study period. The spatiotemporal changes of C storage were caused by changes in multiple environmental factors. Among the five factors examined (climate, LULCC, N deposition, atmospheric CO2, and tropospheric O-3), elevated atmospheric CO2 concentration was the largest contributor to C sequestration, followed by N deposition. LULCC, climate, and tropospheric O-3 concentration contributed to C losses during the study period. The SUS ecosystem C sink was largely the result of interactive effects among multiple environmental factors, particularly atmospheric N input and atmospheric CO2..

DOI

[36]
Tian H Q, Banger K, Tao Bet al., 2014. History of land use in India during 1880-2010: Large-scale land transformations reconstructed from satellite data and historical archives.Global and Planetary Change, 121:78-88.In India, human population has increased six-fold from 200 million to 1200 million that coupled with economic growth has resulted in significant land use and land cover (LULC) changes during 1880–2010. However, large discrepancies in the existing LULC datasets have hindered our efforts to better understand interactions among human activities, climate systems, and ecosystem in India. In this study, we incorporated high-resolution remote sensing datasets from Resourcesat-1 and historical archives at district (N02=02590) and state (N02=0230) levels to generate LULC datasets at 502arc minute resolution during 1880–2010 in India. Results have shown that a significant loss of forests (from 8902million02ha to 6302million02ha) has occurred during the study period. Interestingly, the deforestation rate was relatively greater under the British rule (1880–1950s) and early decades after independence, and then decreased after the 1980s due to government policies to protect the forests. In contrast to forests, cropland area has increased from 9202million02ha to 140.102million02ha during 1880–2010. Greater cropland expansion has occurred during the 1950–1980s that coincided with the period of farm mechanization, electrification, and introduction of high yielding crop varieties as a result of government policies to achieve self-sufficiency in food production. The rate of urbanization was slower during 1880–1940 but significantly increased after the 1950s probably due to rapid increase in population and economic growth in India. Our study provides the most reliable estimations of historical LULC at regional scale in India. This is the first attempt to incorporate newly developed high-resolution remote sensing datasets and inventory archives to reconstruct the time series of LULC records for such a long period in India. The spatial and temporal information on LULC derived from this study could be used by ecosystem, hydrological, and climate modeling as well as by policy makers for assessing the impacts of LULC on regional climate, water resources, and biogeochemical cycles in terrestrial ecosystems.

DOI

[37]
Wei X Q, Ye Y, Zhang Qet al., 2016. Reconstruction of cropland change over the past 300 years in the Jing-Jin-Ji area, China.Regional Environmental Change, 16(7): 2097-2109.Land-use and land-cover change (LUCC) has strongly influenced the global and regional climate and environmental change, especially over the last three centuries. Accurate reconstruction of historical

DOI

[38]
Wu H, 2006. New Concise History of Chinese Measurement. Beijing: China Metrological Press, 119-131. (in Chinese)

[39]
Wu S D, Ge J X, 2000. The History of Chinese Population: Vol. III. Shanghai: Fudan University Press, 1-665. (in Chinese)

[40]
Xinan Gazetteer (《新安志》) published in the Southern Song Dynasty, Vol. 2. (in Chinese)

[41]
Ye Y, Fang X Q, Ren Y Yet al., 2009. Cropland cover change in Northeast China during the past 300 years. Science in China (Series D), 52(8): 1172-1182. (in Chinese)

[42]
Ye Y, Wei X Q, Li Fet al., 2015. Reconstruction of cropland cover changes in the Shandong Province over the past 300 years.Scientific Reports, 5: 13642. doi: 10.1038/srep13642.To advance global change rssearch, it is essential to reconstruct changes in historical cropland coverage on a regional scale in China.

DOI PMID

[43]
Zeng X S, 2005. Ecological environment and rice agriculture of the Lingnan Area in the Song Dynasty. In: Key Research Institute of Social History of China in Nankai University. International Symposium on Historical Environment and Social of China.Tianjin:Key Research Institute of Social History of China in Nankai University. (in Chinese)

[44]
Zhang X Z, He F N, Li S C, 2013. Reconstructed cropland in the mid-eleventh century in the traditional agricultural area of China: Implications of comparisons among datasets.Regional Environmental Change, 13(5): 969-977.Abstract<br/><p class="a-plus-plus">Reconstructions of historical cropland area and spatial distribution are necessary for studying human effects on the environment due to agricultural development. To understand the current status of reconstructions of cropland area and its spatial distribution in the mid-eleventh century in the traditional agricultural area of China, we compared three available datasets: the historic cropland inventories-based HE dataset, the population-based History Database of the Global Environment (HYDE) dataset, and the PJ dataset. The results indicate that the HYDE and PJ datasets estimated the regional mean cropland area fraction (a ratio of cropland area to total land area, hereafter, CAF) for the study area to be 0.12 and 0.09, respectively, both of which were lower than the HE estimation of 0.18. Moreover, both the HYDE and PJ datasets have a poor ability to capture the spatial distribution of the historical CAF. The HYDE dataset overestimated the cropland area in North China and underestimated the cropland area in the Yangtze River reach. The HYDE dataset also overestimated the cropland area along the great rivers in North China. The PJ dataset underestimated the cropland area in the old agricultural area and overestimated the cropland area in the relatively new agricultural area. These incorrect spatial distributions from the HYDE and PJ datasets mainly resulted from the underestimation of the historical population and an incorrect approach for the spatial allocation of cropland within China. The incorrect approach was mainly derived from a poor understanding of the historic spatial distribution of cropland. Using the expert knowledge of local historians may be an effective method to reduce the uncertainties in the global historic cropland reconstruction.</p><br/>

DOI

[45]
Zhou R, 2001. A comprehensive survey and revaluation of cropland area in the early Qing Dynasty.The Journal of Chinese Social and Economic History, (3): 39-49. (in Chinese)

Outlines

/