
Journal of Geographical Sciences >
Assessment of multifunctional landscapes dynamics in the mountainous basin of the Mo River (Togo, West Africa)
Author: Diwediga Badabate, PhD, specialized in integrated soil-landscape assessment and modeling.E-mail:diwedigaba@gmail.com; diwedigaba@yahoo.fr
Received date: 2016-01-27
Accepted date: 2016-06-28
Online published: 2017-05-10
Copyright
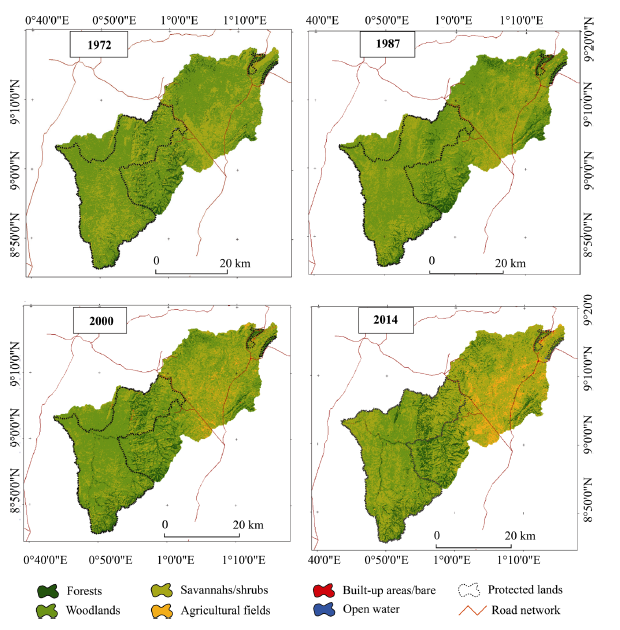
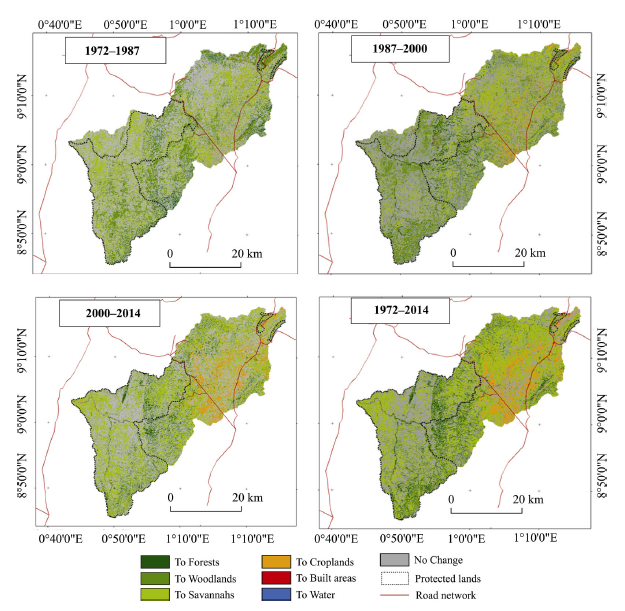
In this study, historical landscape dynamics were investigated to (i) map the land use/cover types for the years 1972, 1987, 2000 and 2014; (ii) determine the types and processes of landscape dynamics; and (iii) assess the landscape fragmentation and habitat loss over time. Supervised classification of multi-temporal Landsat images was used through a pixel-based approach. Post-classification methods included systematic and random change detection, trajectories analysis and landscape fragmentation assessment. The overall accuracies (and Kappa statistics) were of 68.86% (0.63), 91.32% (0.79), 90.66% (0.88) and 91.88% (0.89) for 1972, 1987, 2000 and 2014, respectively. The spatio-temporal analyses indicated that forests, woodlands and savannahs dominated the landscapes during the four dates, though constant areal decreases were observed. The most important dynamic process was the decline of woodlands with an average annual net loss rate of -2%. Meanwhile, the most important land transformation occurred during the transition 2000-2014, due to anthropogenic pressures. Though the most important loss of vegetation greenness occurred in the unprotected areas, the overall analyses of change indicated a declining trend of land cover quality and an increasing landscape fragmentation. Sustainable conservation strategies should be promoted while focusing restoration attention on degraded lands and fragmented ecosystems in order to support rural livelihood and biodiversity conservation.
DIWEDIGA Badabate , AGODZO Sampson , WALA Kperkouma , LE Quang Bao . Assessment of multifunctional landscapes dynamics in the mountainous basin of the Mo River (Togo, West Africa)[J]. Journal of Geographical Sciences, 2017 , 27(5) : 579 -605 . DOI: 10.1007/s11442-017-1394-4
Figure 1 Location of the study area |

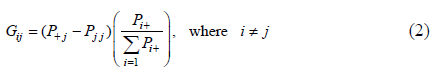

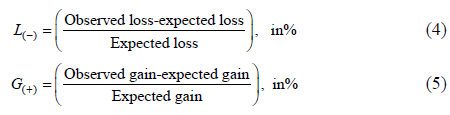
Table 1 Land cover-based landscape metrics for approximating ecosystem services (ESS) change (McGarigal and Marks, 1995; McGarigal et al., 2002 |
| Indices & Acronyms | Meaning of index - Measured ESS |
|---|---|
| Number of patches (NP) | NP ≥ 1, without limit. NP = 1 when the landscape contains only 1 patch of the corresponding patch type. Measure of the extent of class fragmentation |
| Patch density (PD) | PD has the same basic utility as number of patches as an index, except that it expresses number of patches on a per unit area basis that facilitates comparisons among landscapes of varying size. PD > 0, constrained by cell size. |
| Largest patch index (LPI) | Largest patch index quantifies the percentage of total landscape area comprised by the largest patch. As such, it is a simple measure of dominance. 0 < LPI ≦ 100; LPI approaches 0 when the largest patch in the landscape is increasingly small. |
| Patch cohesion index - COHESION | Patch cohesion index measures the physical connectedness of the corresponding patch type. 0 < COHESION < 100; COHESION approaches 0 as the proportion of the landscape comprised of the focal class decreases and becomes increasingly subdivided and less physically connected. |
| Aggregation index- AI | 0 ≦ AI ≦ 100. Aggregation index is calculated from an adjacency matrix, which shows the frequency with which different pairs of patch types (including like adjacencies between the same patch types) appear side-by-side on the map. |
Figure 2 Historical patterns of LUC types in the Mo River basin^(Note: The legend is dedicated to the four LUC maps) |
Figure 3 Historical LUCC in the Mo River basin ^Note: The legend is dedicated to the four LUCC maps |
Table 2 Areal distribution of the four main LUC types and their propotions of changes |
 |
Table 3 Matrices for the four periods under investigation in the Mo basin |
| Year 1987 | ||||||||||||||||||||||||||||||||
|---|---|---|---|---|---|---|---|---|---|---|---|---|---|---|---|---|---|---|---|---|---|---|---|---|---|---|---|---|---|---|---|---|
| Forests | Woodlands | Savannahs | Croplands | Total 1972 | Gross loss | L(-) | ||||||||||||||||||||||||||
| Year 1972 | Forests | 2.05 | 3.22 | 0.36 | 0.01 | 5.64 | 3.60 | |||||||||||||||||||||||||
| 2.05 (0.00) | 2.98 (0.24) | 1.55 (-1.18) | 0.08 (-0.07) | 6.66 (-1.02) | 4.61 (-1.01) | 1.76 | ||||||||||||||||||||||||||
| 2.05 (0.00) | 2.30 (0.92)* | 1.24 (-0.88)* | 0.05 (-0.04) | 5.65 (0.00) | 3.60 (0.00) | |||||||||||||||||||||||||||
| Woodlands | 3.54 | 40.88 | 18.89 | 0.50 | 63.85 | 22.96 | ||||||||||||||||||||||||||
| 2.80 (0.74) | 40.88 (0.00) | 17.74 (1.15) | 0.87 (-0.37) | 62.37 (1.48) | 21.49 (1.48) | 0.56 | ||||||||||||||||||||||||||
| 3.55 (0.00) | 40.88 (0.00) | 18.56 (0.34) | 0.78 (-0.28) | 63.85 (0.00) | 22.96 (0.00) | |||||||||||||||||||||||||||
| Savannahs | 0.59 | 15.78 | 12.97 | 0.84 | 30.28 | 17.31 | ||||||||||||||||||||||||||
| 1.33 (-0.74) | 15.99 (-0.21) | 12.97 (0.00) | 0.41 (0.43) | 30.75 (-0.46) | 17.77 (-0.46) | 1.33 | ||||||||||||||||||||||||||
| 1.58 (-0.99)* | 15.35 (0.44) | 12.97 (0.00) | 0.35 (0.49) | 30.28 (0.00) | 17.31 (0.00) | |||||||||||||||||||||||||||
| Croplands | 0.00 | 0.07 | 0.09 | 0.01 | 0.17 | 0.16 | 16 | |||||||||||||||||||||||||
| 0.01 (-0.01) | 0.09 (-0.02) | 0.05 (0.04) | 0.01 (0.00) | 0.16 (0.02) | 0.15 (0.02) | |||||||||||||||||||||||||||
| 0.01 (-0.01) | 0.10 (-0.03) | 0.05 (0.03) | 0.01 (0.00) | 0.17 (0.00) | 0.16 (0.00) | |||||||||||||||||||||||||||
| Total 1987 | 6.18 | 59.98 | 32.34 | 1.37 | 100.00 | 44.09 | ||||||||||||||||||||||||||
| 6.18 | 59.98 (0.00) | 32.34 (0.00) | 1.37 (0.00) | 100.00 (0.00) | 44.06 (0.02) | |||||||||||||||||||||||||||
| 7.19 (-1.01) | 58.66 (1.32) | 32.84 (-0.50) | 1.20 (0.17) | 100 (0.00) | 44.09 (0.00) | |||||||||||||||||||||||||||
| Gross gain | 4.13 | 19.09 | 19.37 | 1.36 | 44.09 | |||||||||||||||||||||||||||
| 4.13 (0.00) | 19.09 (0.00) | 19.37 (0.00) | 1.36 (0.00) | 44.08 (0.00) | ||||||||||||||||||||||||||||
| 5.14 (-1.01) | 17.77 (1.32) | 19.87 (-0.50) | 1.19 (0.17) | 44.08 (0.00) | ||||||||||||||||||||||||||||
| G(+) | 2.01 | 0.47 | 1.49 | 136 | ||||||||||||||||||||||||||||
| (b) Period 2 (1987-2000) | ||||||||||||||||||||||||||||||||
| Year 2000 | ||||||||||||||||||||||||||||||||
| Forests | Woodlands | Savannahs | Croplands | Total 1987 | Gross loss | L(-) | ||||||||||||||||||||||||||
| Year 1987 | Forests | 3.22 | 2.52 | 0.42 | 0.01 | 6.17 | 2.95 | |||||||||||||||||||||||||
| 3.22 (0.00) | 2.74 (-0.23) | 1.70 (-1.28) | 0.18 (-0.17) | 7.85 (-1.68) | 4.63 (-1.68) | 0.92 | ||||||||||||||||||||||||||
| 3.22 (0.00) | 1.76 (0.76)* | 1.08 (-0.66)* | 0.10 (-0.09) | 6.17 (0.00) | 2.95 (0.00) | |||||||||||||||||||||||||||
| Woodlands | 4.77 | 36.81 | 17.25 | 1.09 | 59.99 | 23.18 | ||||||||||||||||||||||||||
| 3.39 (1.38) | 36.81 (0.00) | 16.49 (0.76) | 1.74 (-0.65) | 58.57 (1.42) | 21.76 (1.42) | 0.63 | ||||||||||||||||||||||||||
| 4.35 (0.42) | 36.81 (0.00) | 17.16 (0.09) | 1.54 (-0.45) | 59.99 (0.00) | 23.18 (0.00) | |||||||||||||||||||||||||||
| Savannahs | 0.52 | 14.92 | 15.01 | 1.74 | 32.34 | 17.33 | ||||||||||||||||||||||||||
| 1.83 (-1.31) | 14.38 (0.54) | 15.01 (0.00) | 0.94 (0.80) | 32.24 (0.11) | 17.22 (0.11) | 1.15 | ||||||||||||||||||||||||||
| 2.23 (-1.70)* | 14.25 (0.67)* | 15.01 (0.00) | 0.79 (0.95)* | 32.34 (0.00) | 17.33 (0.00) | |||||||||||||||||||||||||||
| Croplands | 0.01 | 0.33 | 0.85 | 0.15 | 1.36 | 1.21 | ||||||||||||||||||||||||||
| 0.08 (-0.07) | 0.61 (-0.27) | 0.38 (0.48) | 0.15 (0.00) | 1.21 (0.15) | 1.06 (0.15) | 8.07 | ||||||||||||||||||||||||||
| 0.11 (-0.10) | 0.68 (-0.35) | 0.42 (0.43) | 0.15 (0.00) | 1.36 (0.00) | 1.21 (0.00) | |||||||||||||||||||||||||||
| Total 2000 | 8.53 | 54.60 | 33.61 | 3.01 | 100.00 | 44.79 | ||||||||||||||||||||||||||
| 8.53 (0.00) | 54.60 (0.00) | 33.61 (0.00) | 3.01 (0.00) | 100.00 (0.00) | 44.79 (0.00) 44.79 (0.00) | |||||||||||||||||||||||||||
| 9.92 (-1.39) | 53.57 (1.03) | 33.71 (-0.11) | 2.58 (0.44) | 100.00 | ||||||||||||||||||||||||||||
| Gross gain | 5.30 | 17.79 | 18.60 | 2.86 | 44.79 | |||||||||||||||||||||||||||
| 5.30 (0.00) | 17.79 (0.00) | 18.60 (0.00) | 2.86 (0.00) | 44.79 (0.00) | ||||||||||||||||||||||||||||
| 6.70 (-1.39) | 16.76 (1.03) | 18.70 (-0.11) | 2.43 (0.44) | 44.79 (0.00) | ||||||||||||||||||||||||||||
| G(+) | 1.65 | 0.48 | 1.24 | 19.07 | ||||||||||||||||||||||||||||
| (c) Period 3 (2000-2014) | ||||||||||||||||||||||||||||||||
| 2014 | ||||||||||||||||||||||||||||||||
| Forests | Woodlands | Savannahs | Croplands | Total 2000 | Gross loss | L(-) | ||||||||||||||||||||||||||
| 2000 | Forests | 5.08 | 2.04 | 1.34 | 0.06 | 8.53 | 3.45 | 0.68 | ||||||||||||||||||||||||
| 5.08 (0.00) | 1.16 (0.88) | 3.86 (-2.52) | 0.61 (-0.55) | 10.74 (-2.21) | 5.66 (-2.21) | |||||||||||||||||||||||||||
| 5.08 (0.00) | 1.06 (0.98)* | 2.06 (-0.72)* | 0.32 (-0.26) | 8.53 (0.00) | 3.45 (0.00) | |||||||||||||||||||||||||||
| Woodlands | 4.12 | 21.12 | 27.03 | 2.26 | 54.60 | 33.49 | 1.59 | |||||||||||||||||||||||||
| 3.55 (0.57) | 21.12 (0.00) | 24.73 (2.30) | 3.93 (-1.67) | 53.48 (1.12) | 32.37 (1.12) | |||||||||||||||||||||||||||
| 5.08 (-0.96)* | 21.12 (0.00) | 24.49 (2.54)* | 3.78 (-1.51)* | 54.60 (0.00) | 33.49 (0.00) | |||||||||||||||||||||||||||
| Savannahs | 1.75 | 4.01 | 23.11 | 4.58 | 33.61 | 10.50 | 0.45 | |||||||||||||||||||||||||
| 2.19 (-0.44) | 4.57 (-0.56) | 23.11 (0.00) | 2.42 (2.16) | 32.37 (1.23) | 9.27 (1.23) | |||||||||||||||||||||||||||
| 2.47 (-0.72)* | 6.12 (-2.11)* | 23.11 (0.00) | 1.84 (2.74)* | 33.61 (0.00) | 10.50 (0.00) | |||||||||||||||||||||||||||
| Croplands | 0.05 | 0.11 | 1.61 | 1.21 | 3.01 | 1.80 | 1.49 | |||||||||||||||||||||||||
| 0.20 (-0.14) | 0.41 (-0.30) | 1.37 (0.24) | 1.21 (0.00) | 3.19 (-0.18) | 1.98 (-0.18) | |||||||||||||||||||||||||||
| 0.22 (-0.16) | 0.53 (-0.42) | 1.04 (0.57)* | 1.21 (0.00) | 3.01 (0.00) | 1.80 (0.00) | |||||||||||||||||||||||||||
| Total 2014 | 11.03 | 27.29 | 53.18 | 8.20 | 100.00 | 0.00 | ||||||||||||||||||||||||||
| 11.03 (0.00) | 27.29 (0.00) | 53.18 (0.00) | 8.20 (0.00) | 100.00 | 49.45 | |||||||||||||||||||||||||||
| 12.87 (-1.84) | 28.89 (-1.60) | 50.81 (2.36) | 7.16 (1.03) | 100.00 | 49.45 (0.00) | |||||||||||||||||||||||||||
| Gross gain | 5.95 | 6.17 | 30.07 | 6.98 | 49.45 | 49.45 (0.00) | ||||||||||||||||||||||||||
| 5.95 (0.00) | 6.17 (0.00) | 30.07 (0.00) | 6.98 (0.00) | 49.45 (0.00) | ||||||||||||||||||||||||||||
| 7.79 (-1.84) | 7.77 (-1.60) | 27.71 (2.36) | 5.95 (1.03) | 49.45 (0.00) | ||||||||||||||||||||||||||||
| G(+) | 1.71 | 0.29 | 1.30 | 5.77 | ||||||||||||||||||||||||||||
| (d) Period 4 (1972-2014) | ||||||||||||||||||||||||||||||||
| Year 2014 | ||||||||||||||||||||||||||||||||
| Forests | Woodlands | Savannahs | Croplands | Total 1972 | Gross loss | L(-) | ||||||||||||||||||||||||||
| Year 1972 | Forests | 2.59 | 1.18 | 1.76 | 0.11 | 5.65 | 3.05 | 1.18 | ||||||||||||||||||||||||
| 2.59 (0.00) | 0.99 (0.19) | 2.87 (-1.11) | 0.46 (-0.35) | 6.95 (-1.30) | 4.36 (-1.30) | |||||||||||||||||||||||||||
| 2.59 (0.00) | 0.94 (0.24) | 1.82 (-0.06) | 0.28 (-0.17) | 5.65 (0.00) | 3.05 (0.00) | |||||||||||||||||||||||||||
| Woodlands | 5.90 | 20.93 | 33.58 | 3.35 | 63.85 | 42.92 | 2.05 | |||||||||||||||||||||||||
| 5.71 (0.19) | 20.93 (0.00) | 32.46 (1.12) | 5.21 (-1.86) | 64.68 (-0.83) | 43.75 (-0.83) | |||||||||||||||||||||||||||
| 6.51 (-0.61)* | 20.93 (0.00) | 31.38 (2.20)* | 4.84 (-1.49)* | 63.85 (0.00) | 42.92 (0.00) | |||||||||||||||||||||||||||
| Savannahs | 2.52 | 5.16 | 17.73 | 4.67 | 30.28 | 12.55 | 0.71 | |||||||||||||||||||||||||
| 2.71 (-0.18) | 5.32 (-0.16) | 17.73 (0.00) | 2.47 (2.20) | 28.41 (1.88) | 10.68 (1.88) | |||||||||||||||||||||||||||
| 2.96 (-0.43) | 7.32 (-2.15)* | 17.73 (0.00) | 2.20 (2.47)* | 30.28 (0.00) | 12.55 (0.00) | |||||||||||||||||||||||||||
| Croplands | 0.01 | 0.01 | 0.08 | 0.07 | 0.17 | 0.11 | 1.57 | |||||||||||||||||||||||||
| 0.02 (-0.01) | 0.03 (-0.02) | 0.09 (-0.01) | 0.07 (0.00) | 0.20 (-0.03) | 0.14 (-0.03) | |||||||||||||||||||||||||||
| 0.01 (0.00) | 0.03 (-0.02) | 0.06 (0.02) | 0.07 (0.00) | 0.17 (0.00) | 0.11 (0.00) | |||||||||||||||||||||||||||
| Total 2014 | 11.03 | 27.29 | 53.17 | 8.21 | 100.00 | 58.68 | ||||||||||||||||||||||||||
| 11.03 (0.00) | 27.29 (0.00) | 53.17 (0.00) | 8.21 (0.00) | 100.00 | 58.68 (0.00) | |||||||||||||||||||||||||||
| 12.08 (-1.05) | 29.22 (-1.94) | 51.02 (2.15) | 7.40 (0.81) | 99.99 (0.01) | 58.68 (0.00) | |||||||||||||||||||||||||||
| Gross gain | 8.44 | 6.36 | 35.44 | 8.14 | 58.68 | |||||||||||||||||||||||||||
| 8.44 (0.00) | 6.36 (0.00) | 35.44 (0.00) | 8.14 (0.00) | 58.68 (0.00) | ||||||||||||||||||||||||||||
| 9.48 (-1.05) | 8.29 (-1.94) | 33.29 (2.15) | 7.33 (0.81) | 58.68 (0.00) | ||||||||||||||||||||||||||||
| G(+) | 3.26 | 0.30 | 2.00 | 116.29 | ||||||||||||||||||||||||||||
Note (applicable to Tables 3a, 3b, 3c and 3d): each table contains both the outputs of gain and loss analyses. Each cell is subdivided into three rows and two columns of numbers. Left column of each cell: the first row contains bolded numbers that represent the actual (observed) proportions of inter-categorical transitions (persistence and transitions) of the landscape. The second row represents the expected percentage of land under random processes of gain (named Expected (+)) calculated using Equation 2, where figures in round parentheses are equal to the observed proportion minus the one expected (named Difference (+)). The third row contains italicized numbers representing the expected proportion of land under random processes of loss (named Expected (-)) calculated using Equation 3, where numbers within round parentheses represent the observed proportion minus the expected one (named Difference (-)). Extreme right column of the table contains the Loss-to-persistence ratio (L(-)) while the extreme row is the Gain-to-persistence ratio (G(+)). Numbers highlighted in gray represent systematic gain transitions; starred numbers represent systematic loss transitions. |
Table 4a Fragstat-based landscape indices for forest cover |
| Year | Status | NP | PD | LPI | COH | AI |
|---|---|---|---|---|---|---|
| 1972 | PA | 55 | 2.20 | 0.28 | 78.31 | 69.96 |
| UPA | 5 | 0.20 | 0.09 | 71.80 | 75.00 | |
| 1987 | PA | 148 | 5.89 | 2.30 | 91.71 | 59.32 |
| UPA | 27 | 1.08 | 0.05 | 51.83 | 36.23 | |
| 2000 | PA | 177 | 7.09 | 3.72 | 93.47 | 70.44 |
| UPA | 18 | 0.72 | 0.01 | 27.93 | 19.15 | |
| 2014 | PA | 338 | 13.47 | 4.01 | 93.84 | 69.19 |
| UPA | 62 | 2.47 | 0.37 | 73.45 | 53.77 | |
| References | NP ≥ 1 | PD > 0 | 0 < LPI ≤ 100 | 0 < COH ≤ 100 | 0 < AI ≤ 100 |
NP = number of patch; PD = patch density; LPI = largest patch index; COH = patch cohesion; AI = Aggregation index; PA = protected areas; UPA = unprotected areas |
Table 4b Fragstat-based landscape indices for woodlands |
| Year | Status | NP | PD | LPI | COH | AI |
|---|---|---|---|---|---|---|
| 1972 | PA | 28 | 1.12 | 47.24 | 99.59 | 87.19 |
| UPA | 56 | 2.24 | 23.47 | 98.59 | 84.85 | |
| 1987 | PA | 245 | 9.76 | 36.96 | 99.38 | 68.78 |
| UPA | 787 | 31.35 | 5.61 | 92.72 | 56.09 | |
| 2000 | PA | 296 | 11.86 | 28.16 | 98.56 | 75.43 |
| UPA | 368 | 14.66 | 2.37 | 90.14 | 62.15 | |
| 2014 | PA | 478 | 19.04 | 3.91 | 89.46 | 63.33 |
| UPA | 99 | 3.94 | 0.06 | 50.19 | 40.07 | |
| References | NP ≥ 1 | PD > 0 | 0 < LPI ≤ 100 | 0 < COH ≤ 100 | 0 < AI ≤ 100 |
Table 4c Fragstat-based landscape indices for savannahs |
| Year | Status | NP | PD | LPI | COH | AI |
|---|---|---|---|---|---|---|
| 1972 | PA | 75 | 3.01 | 24.43 | 98.51 | 85.60 |
| UPA | 36 | 1.44 | 55.18 | 99.72 | 88.38 | |
| 1987 | PA | 298 | 11.87 | 26.61 | 98.45 | 76.70 |
| UPA | 98 | 3.90 | 61.11 | 99.79 | 73.75 | |
| 2000 | PA | 257 | 10.30 | 25.52 | 95.06 | 71.86 |
| UPA | 40 | 1.59 | 65.84 | 99.84 | 82.34 | |
| 2014 | PA | 135 | 5.38 | 37.22 | 99.07 | 81.97 |
| UPA | 40 | 1.59 | 63.27 | 99.76 | 88.92 | |
| References | NP ≥ 1 | PD > 0 | 0 < LPI ≤ 100 | 0 < COH ≤ 100 | < AI ≤ 100 |
Table 5 Accuacy assessment reports of the produced LUC maps from Landsat archives |
 |
The authors have declared that no competing interests exist.
| [1] |
|
| [2] |
|
| [3] |
|
| [4] |
|
| [5] |
|
| [6] |
|
| [7] |
|
| [8] |
|
| [9] |
|
| [10] |
|
| [11] |
|
| [12] |
|
| [13] |
|
| [14] |
DGSCN2010. Recensement general de la population et de l'habitat. Resultats definitifs. Lome: Togo.
|
| [15] |
|
| [16] |
|
| [17] |
|
| [18] |
|
| [19] |
|
| [20] |
|
| [21] |
|
| [22] |
FAO,1996. Forest Resources Assessment. Survey of Tropical Forest Cover and Study of Change Processes. Rome, Italy, 1990.
|
| [23] |
FAO, 2015. Global Forest Resource Assessment 2015. How are the world's forests changing? Rome, Italy.
|
| [24] |
|
| [25] |
|
| [26] |
|
| [27] |
|
| [28] |
|
| [29] |
|
| [30] |
|
| [31] |
|
| [32] |
|
| [33] |
|
| [34] |
|
| [35] |
|
| [36] |
IGN, 1986. Cartes topographiques 1/200 000, 1 res Editions, Feuilles Sokode et Kara. France and D.C. N. C. & M.E.M.P.T., Togo.
|
| [37] |
|
| [38] |
|
| [39] |
|
| [40] |
|
| [41] |
|
| [42] |
|
| [43] |
|
| [44] |
|
| [45] |
|
| [46] |
|
| [47] |
|
| [48] |
|
| [49] |
|
| [50] |
|
| [51] |
|
| [52] |
|
| [53] |
|
| [54] |
|
| [55] |
MEA 2005. Ecosystems and human well-being: Synthesis. Washington, DC: Island Press.
|
| [56] |
|
| [57] |
|
| [58] |
|
| [59] |
|
| [60] |
|
| [61] |
|
| [62] |
|
| [63] |
|
| [64] |
|
| [65] |
|
| [66] |
|
| [67] |
|
| [68] |
|
| [69] |
|
| [70] |
|
| [71] |
|
| [72] |
|
| [73] |
|
| [74] |
|
| [75] |
|
| [76] |
|
| [77] |
|
| [78] |
|
| [79] |
|
| [80] |
|
| [81] |
|
| [82] |
|
| [83] |
|
| [84] |
|
| [85] |
|
| [86] |
|
| [87] |
|
| [88] |
|
| [89] |
|
| [90] |
|
| [91] |
|
| [92] |
|
| [93] |
|
| [94] |
|
| [95] |
|
| [96] |
|
| [97] |
|
| [98] |
|
| [99] |
|
| [100] |
|
| [101] |
|
| [102] |
|
/
| 〈 |
|
〉 |
