Research Articles

The dynamic response of forest vegetation to hydrothermal conditions in the Funiu Mountains of western Henan Province

  • ZHU Wenbo ,
  • LI Shuangcheng
Expand
  • College of Urban and Environmental Sciences, Peking University, Laboratory for Earth Surface Processes of the Ministry of Education, Beijing 100871, China

Author: Zhu Wenbo (1989-), PhD Candidate, specialized in the mountain ecosystem service, development and utilization of regional natural resources. E-mail:

Received date: 2016-10-22

  Accepted date: 2016-12-21

  Online published: 2017-05-10

Supported by

National Natural Science Foundation of China, No.41671090

National Basic Research Program (973 Program), No.2015CB452702

Copyright

Journal of Geographical Sciences, All Rights Reserved

Abstract

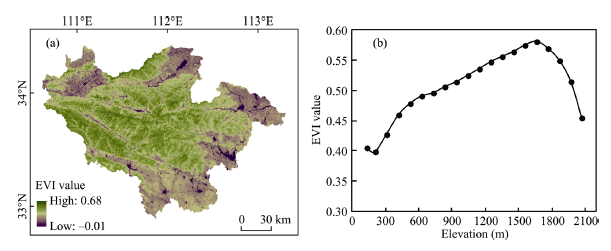
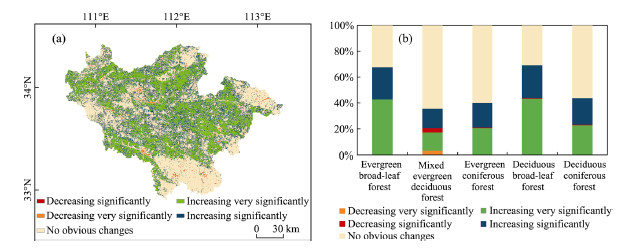
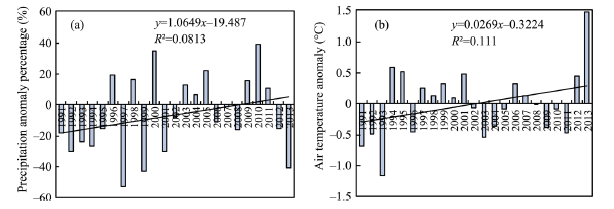
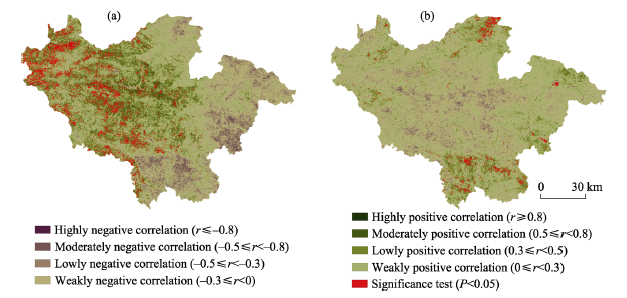
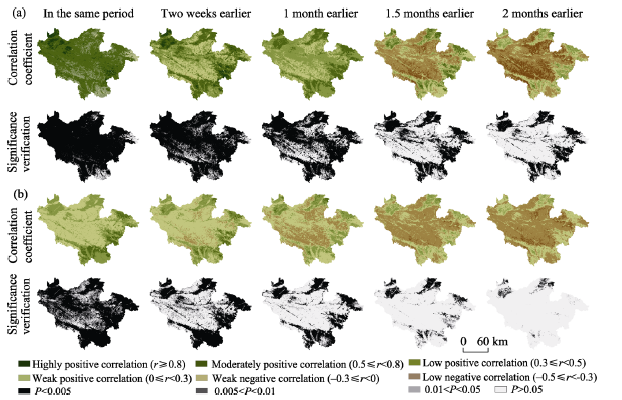
This paper uses HJ-1 satellite multi-spectral and multi-temporal data to extract forest vegetation information in the Funiu Mountain region. The S-G filtering algorithm was employed to reconstruct the MODIS EVI (Enhanced Vegetation Index) time-series data for the period of 2000-2013, and these data were correlated with air temperature and precipitation data to explore the responses of forest vegetation to hydrothermal conditions. The results showed that: (1) the Funiu Mountain region has relatively high and increasing forest coverage with an average EVI of 0.48 over the study period, and the EVI first shows a decreasing trend with increased elevation below 200 m, then an increasing trend from 200-1700 m, and finally a decreasing trend above 1700 m. However, obvious differences could be identified in the responses of different forest vegetation types to climate change. Broad-leaf deciduous forest, being the dominant forest type in the region, had the most significant EVI increase. (2) Temperature in the region showed an increasing trend over the 14 years of the study with an anomaly increasing rate of 0.27℃/10a; a fluctuating yet increasing trend could be identified for the precipitation anomaly percentage. (3) Among all vegetation types, the evergreen broad-leaf forest has the closest EVI-temperature correlation, whereas the mixed evergreen and deciduous forest has the weakest. Almost all forest types showed a weak negative EVI-precipitation correlation, except the mixed evergreen and deciduous forest with a weak positive correlation. (4) There is a slight delay in forest vegetation responses to air temperature and precipitation, with half a month only for limited areas of the mixed evergreen and deciduous forest.

Cite this article

ZHU Wenbo , LI Shuangcheng . The dynamic response of forest vegetation to hydrothermal conditions in the Funiu Mountains of western Henan Province[J]. Journal of Geographical Sciences, 2017 , 27(5) : 565 -578 . DOI: 10.1007/s11442-017-1393-5

1 Introduction

Mountain ecosystems usually show complex environmental gradients and are sensitive to climate change. As a result of global climate change, they have become the focus for studying the dynamic responses of vegetation to climate change (Xiao et al., 2005; Wang et al., 2011; Zhu et al., 2011; Yao et al., 2015). Following the vertical differentiation of mountain climate, evergreen broad-leaf forest, broad-leaf deciduous forest, coniferous forest, and various other vegetation types appear sequentially from mountain base to mountain top (Zhang et al., 2002). An investigation into the relationship between forest vegetation types and climate change enhances our understanding of the complexity and dynamics of mountain ecosystems and reveals the mechanisms of their response to climate change.
Previous studies have discovered a close relationship between mountain vegetation changes and precipitation, and a significant difference among the various vegetation types to hydrothermal conditions (Neigh et al., 2008; Yang et al., 2011; Zhang et al., 2011; Dai et al., 2015; Wang et al., 2016). Cui et al. analyzed the altitudinal variation of air temperature and vegetation coverage in the Qinling Mountain region, China, and found out that high altitude areas have the highest correlation with air temperature (Cui et al., 2013). Wang et al. revealed a one-month delay for vegetation growth in response to precipitation in China’s southern hilly and mountainous regions (Wang et al., 2014). Miao et al. suggested that vegetation in the Mongolian Plateau demonstrates a balanced and heterogeneous response to climate change, and that grassland vegetation is positively correlated with precipitation (Miao et al., 2014). Nevertheless, mountain vegetation classification used in these studies only includes forest and grassland; detailed classification of forest vegetation is still lacking. Moreover, research on the relationship between the coverage of various vegetation types and climate is only concentrated in plateau regions (Zhang et al., 2011; Bao et al., 2013; Wang et al., 2014; Zhang et al., 2015). In addition, these studies often take Normalized Difference Vegetation Index (NDVI) to assess vegetation coverage changes. However, NDVI is too sensitive to vegetation canopy background, prone to saturation, and considerably affected by soil noise. On the other hand, Enhanced Vegetation Index (EVI), derived from improved NDVI, allows higher monitoring accuracy and better reflects vegetation growth conditions (Huete et al., 2002). The use of EVI to investigate the relationships between forest vegetation type and air temperature and precipitation is absolutely necessary for further exploration of the balance and heterogeneity of mountain environments.
The Funiu Mountain region, located in the transitional zone between subtropical and warm temperate zones in central China and characterized by complex flora compositions, is an ideal site for mountain research (Ma et al., 2004; Zhang et al., 2016). But, research work has been mainly focused on surveying the flora diversity and the biome characteristics of the region (Ding et al., 2006; Fan et al., 2008), with some research exploring the relationship between dynamic variations in the mountain forest landscape and topographic gradient (Liang et al., 2010) or with the relationship between vegetation dynamics and climatic factors. This research utilized 30 m multi-temporal data from the HJ-1 satellite to extract forest vegetation types in the Funiu Mountain region, and applied the S-G filtering algorithm to reconstruct the time-series MODIS EVI data from 2000 to 2013. Integrating these data with the climatic observation data, the spatial and temporal variation characteristics of the regional forest types and their relationships with air temperature and precipitation were analyzed.

2 Data source and method

2.1 Background of the research area

The Funiu Mountains extend from northwest to southeast in the western Henan Province of China. Located between 110°30′E-113°30′E, 32°45′N-34°20′N, they belong to the eastern part of the Qinling Mountain Range (Figure 1), spanning 8 counties: Luanchuan, Songxian, Lushan, Xixia, Neixiang, Zhenping, Lushi, and Nanzhao. The mean annual temperature is 13.6℃-15.1℃, with an annual precipitation of 700-1000 mm. The Funiu Mountain region is located in the transitional zone between subtropical and warm temperate areas, also with outstanding altitudinal differences in physical geographical characteristics. Accordingly, its vegetation belongs to the transitional type between warm temperate broad-leaf deciduous forest and northern subtropical mixed evergreen and deciduous forest.
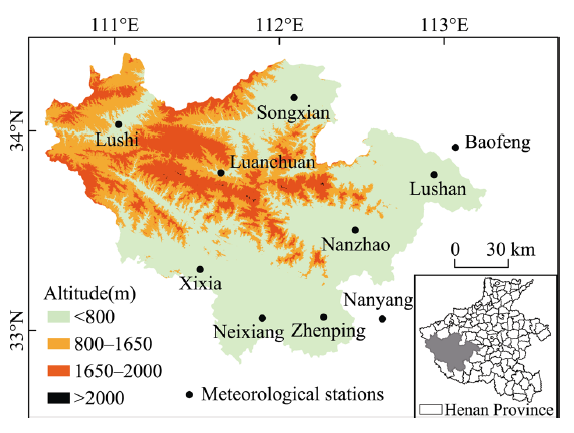
Figure 1 The location and topography of the Funiu Mountains, western Henan Province

2.2 Data source

2.2.1 Remote sensing data
The MOD13Q1 data were from the MODIS 2000-2013 data set, obtained from the National Aeronautics and Space Administration Office (NASA), with a spatial resolution of 250 m and a temporal resolution of 16 days. First, EVI data were extracted from the MOD13Q1 raw data set with the MRT tool and subjected to re-projection. In order to obtain better time series curves, the Savitzky-Golay filter was employed to re-project the MODIS EVI 16-day images for fitting the EVI variation (Chen et al., 2009). For the forest vegetation classification, cloudless and clear HJ-1 satellite 30 m multi-spectral data for January, April, and October of 2015 were employed. With ENVI 5.0, the data were subjected to various treatments, such as atmospheric correction, geometric correction, mosaic, and cropping into the research area. Altitude data were derived from the 30 m DEM of the ASTER GDEM V2, from the International Scientific Data Mirror Site of the Computer Network Information Center, Chinese Academy of Sciences.
2.2.2 Climatic data
Plant growth is influenced by the hydrothermal conditions and responds with a certain time delay to air temperature and precipitation (Cui et al., 2009; Shen et al., 2015). Air temperature and precipitation were selected in order to study the EVI response of various forest vegetation types to climatic factors. The air temperature and precipitation data were taken from 19 climatic stations during 1991-2013, of which 14 stations were from the Chinese Climatic Scientific Data Sharing Site and 5 from the Henan Climatic Bureau (Figure 1). The growing season of forest vegetation in the Funiu Mountain region is from May to September. Based on the daily mean air temperature and precipitation during the growing seasons of 1991-2013, the annual mean temperature and precipitation for the growing season of each year was obtained in order to study the variation characteristics of air temperature anomalies and precipitation anomaly percentages with time. According to the biweekly mean temperature and the biweekly precipitation from 2000 to 2013, the annual variation patterns of these two parameters were also analyzed. These parameters were compared with EVI changes within a year to see if they show any consistency. Based on the monthly mean temperature and precipitation during growing seasons from 2000 to 2013, the relationship between annual EVI and climatic factors was investigated. Furthermore, the delay in the response of biweekly EVI during the growing season to climatic factors was investigated based on the biweekly mean temperature and precipitation during March to September in 2000-2013.

2.3 Research method

2.3.1 Forest vegetation classification
In remote sensing images, objects of the same type may show different spectra under observation whereas some objects of different classes may have the same spectral curves. To reduce the classification errors brought about by these phenomena, multi-temporal remote sensing images were employed. In order to avoid “salt and pepper effects” due to pixel classification, the object-oriented classification method of the eCognition software was used to extract forest types. Forest vegetation in the Funiu Mountains was therefore classified into 5 types: evergreen broad-leaf forest, evergreen coniferous forest, deciduous coniferous forest, deciduous broad-leaf forest, and mixed evergreen and deciduous forest (Figure 2). To verify the classification accuracy, 120 sampling points were randomly chosen to assess the accuracy of the vegetation survey data in the study area. The results suggested an overall accuracy of 84.2% for the forest classification and a kappa coefficient of 0.8. The on-site survey discovered that forests in the mountain areas require a relatively long succession period. Therefore, in the past 14 years, the spatial variation ranges for the different vegetation classes in the region have been limited, and the vegetation class data can therefore be employed for effective research.
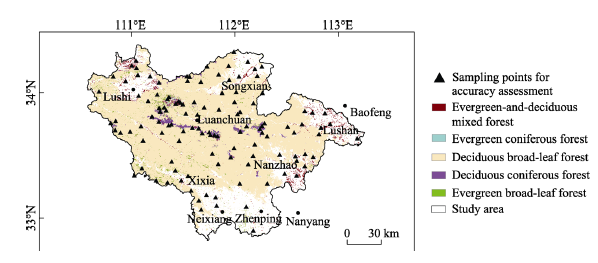
Figure 2 Vegetation types in the Funiu Mountains
2.3.2 Definition of forest vegetation growing seasons
The complete vegetation growth cycles were obtained by integrating the EVI data over the past 14 years. TIMESAT software was used to extract the pixel-based phenology information and confirm the average growing season of forest vegetation during 2000-2013. The vegetation index obtained from remote sensing images showed noise interference. Hence, TIMESAT was applied for noise reduction and vegetation index fitting, in order to obtain a time series of vegetation index and to extract vegetation phenology information (Jönsson et al., 2002, 2004) (Figure 3). It can be shown that 50.76% of the study area showed the growing season starting at 105th-120th days, i.e., in late April (Figure 3a), and that, 46.85% of the study area showed the growing season closing at 285th-300th days or in late October. (Figure 3b). Therefore, by integrating the spatial and temporal distribution of large-scale leaf growth and withering, the growing season for the vegetation in the Funiu Mountain region was defined as May to September.
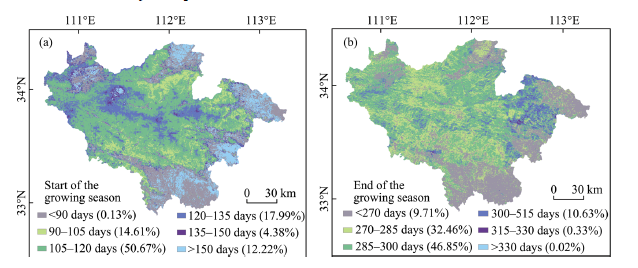
Figure 3 Spatial distribution of (a) the start and (b) the end of the vegetation growing season in the Funiu Mountain region
2.3.3 Spatial interpolation method for climatic data
With the thin-plate smoothing spline function, the associated factors were taken as covariates. Spatial interpolation of climatic data was performed with ANUSPLIN, which better enhances the spatial accuracy of time series climatic data interpolation (Liu et al., 2008). Compared with ordinary kriging, inverse-distance weighting, and the thin-plate smoothing spline function method, the thin-plate smoothing spline interpolation method (ANUSPLIN) gives the best interpolation results for air temperature and precipitation, in particular for complex mountain environments (Yu et al., 2008). Hence, ANUSPLIN was selected for air temperature and precipitation data interpolation to obtain the biweekly mean temperature and precipitation raster data, with a pixel resolution of 250 m.
2.3.4 Linear trends and correlation analysis
For the 2000-2013 EVI trend analysis, the slope of the linear regression equation was used to indicate the spatial and temporal characteristics of the vegetation. This method reflects the vegetation patterns through the trend analysis on the raster data consisting of pixels (Xu et al., 2002).
where θ is the slope of the trend line; n is the research period; i is the order of research period; EVIi is the EVI of the ith growing season. if θ>0, it represents an increasing trend; if θ<0, it represents a decreasing trend. An F-test was carried out to verify the significance of the variation trend. With the θ values and the F-test results, the yearly variation trends of the growing season EVI were divided into 5 classes (Mu et al., 2013): decreasing very significantly (θ<0, P<0.01); decreasing significantly (θ<0, 0.01<P<0.05); no obvious changes (P>0.05); increasing significantly (θ>0, 0.01<P<0.05); and increasing very significantly (θ>0, P<0.01).
Using ENVI/IDL, the pixel-based correlation analysis was conducted and the Pearson correlation coefficient was calculated. Significance verification was also carried out. In order to better reflect the correlation between vegetation and climatic factors in the research area, correlation coefficients were classified based on the degree of correlation: highly correlated (lrl≥0.8); moderately correlated (0.5≤lrl<0.8); poorly correlated (0.3≤lrl<0.5); and weakly correlated (0≤lrl<0.3).

3 Results

3.1 Spatial and temporal characteristics of EVI

The growing season EVI from 2000 to 2013 in the Funiu Mountain region is approximately 0.39-0.58, with an overall average value of 0.48. It is high in the central area but low near the boundaries (Figure 4a). By comparing Figure 4a with Figure 2, it can be seen that the forest vegetation EVI is generally higher, 0.35-0.68, in the central areas, whereas the shrubs, meadows, and crops near the mountain bases at the research area boundaries have a lower EVI. Analysis of the altitude-vegetation EVI relationship shows that the EVI first shows a decreasing trend with elevation below 200 m, then an increasing trend from 200-1700 m, and followed by a decreasing trend with elevation above 1700 m (Figure 4b). The highest vegetation EVI is observed at 1600-1700 m whilst the lowest is below 200 m. This is related to the vertical distribution of the vegetation (Song et al., 1994). Below 800 m are mainly low-mountain shrubs, meadows, and crops with relatively low EVI values. At 800-1650 m, deciduous broad-leaf forest, with a relatively high EVI, is often present. At 1650-2000 m, mixed coniferous broad-leaf forest dominates. Above 2000 m, there are mostly high-mountain shrubs and krummholz. Hence, the EVI gradually decreases after 1650 m.
The significance analysis on the annual variation in growing season EVI for 2000-2013 in the Funiu Mountain region (Figure 5) demonstrates that 33.19% of the research area shows a very significantly increasing trend, 21.29% shows a significantly increasing trend, 44.72% has no obvious changes, 0.38% shows a significantly decreasing trend, and 0.42% shows a very significantly decreasing trend respectively. The areas with an increasing EVI trend (54.48%) far exceed those with a decreasing trend (0.4%). This suggests that the growing season EVI shows an overall stable increase over the past 14 years at the 90% confidence interval. The dominant deciduous broad-leaf forest shows the most considerable increase. From the spatial distribution (Figure 5), the areas with a significantly and very significantly decreasing EVI and those with a significantly increasing EVI are scattered over the research area. The areas with no obvious changes are mostly located in the regions with non-forest vegetation, whereas the areas with a very significant EVI increase are mainly those of deciduous broad-leaf forest.
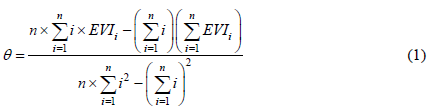
Figure 4 Spatial distribution (a) and vertical characteristics (b) of mean growing season EVI in the Funiu Mountains from 2000 to 2013
Figure 5 Spatial distribution (left) and area proportion results (right) of significance test of EVI annual changes for various forest vegetation types in the Funiu Mountains from 2000 to 2013

3.2 Variation in climatic factors

As a basic aridity index, the precipitation anomaly percentage can reflect the arid condition caused by precipitation variability (Yan et al., 2012). Data from 8 weather stations in the study area were selected to analyze the growing season precipitation anomaly percentage and the air temperature anomaly variations during 1991-2013 in the region (Figure 6a). The results indicate that the precipitation anomaly proportion is relatively small in the 1990s and gradually increases after 2000. In general, growing season precipitation in the Funiu Mountain region shows a gradually increasing trend over the last 21 years. From the 1991-2013 growing season air temperature anomaly graph, the anomaly is relatively low in 1991-1993 and then the anomaly increases slowly (positive trend line slope) at a rate of 0.27℃/10a, revealing a warming trend in this region (Figure 6b).
Figure 6 Trends of precipitation anomaly percentage (a) and temperature anomaly (b) in the Funiu Mountains from 1991-2013

3.3 Variation of biweekly vegetation EVI and climatic factors

The variations in average biweekly EVI with time (Figure 7) show that EVI from January to July increases gradually and then decreases after reaching its peak in July. Vegetation EVI is greater than 0.3 during May to September. In particular, EVI variations are greater in March and October. This is because large-scale growth starts in the dominant deciduous broad-leaf forest during late March to early April. In May, the new leaves of the deciduous trees become relatively lush and the forest vegetation coverage is higher, increasing the overall EVI. In July, the EVI starts to diminish gradually after reaching its peak. At the late stage of the growing season in September to October, the leaves of the dominant deciduous forest start to fall. The EVI then decreases and falls below 0.3 after October. Both the biweekly mean air temperature and biweekly precipitation in a year increase at first and then decrease. Both reach their peaks in July and then drop gradually. This indicates that the climatic hydrologic parameters are in phase with the thermal parameters in the study area.
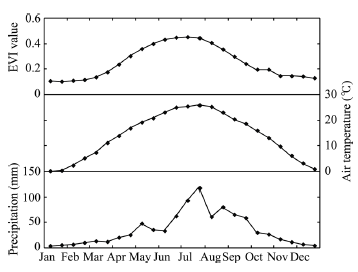
Figure 7 Biweekly changes in vegetation EVI, mean temperature, and precipitation in the Funiu Mountains

3.4 Relationship between growing season EVI variations and climatic factor variations

The correlation between the annual growing season EVI and air temperature and precipitation was analyzed in the Funiu Mountain region and subjected to significance verification (Figure 8). The area of regions with significant EVI-air temperature correlation is 3099.75 hm2, 14.28% of the total study area. The area of regions with significant EVI-precipitation correlation is 792.13 hm2, 3.65% of the total area. The regions with significant EVI-air temperature correlation are mainly located in the southwest whereas those with significant EVI-precipitation correlation are fewer and mostly located near the boundaries. There are therefore considerable differences between the EVI-air temperature correlation spatial distribution and that of the EVI-precipitation correlation. The EVI-air temperature correlation is stronger in the west than in the east (Figure 8a), mostly because the western forest has higher coverage and is more sensitive to air temperature variations. The EVI-precipitation correlation is stronger at low altitudes than at high altitudes (Figure 8b). Due to considerable human activity and dominant farmland and grassland, the low-altitude areas are more easily affected by hydrological factors.
Figure 8 The spatial distribution of significance test results and correlation coefficient for (a) mean EVI and temperature and (b) mean EVI and precipitation in the Funiu Mountains during the growing seasons of 2000-2013
The EVI-air temperature and precipitation correlation coefficients of different forest vegetation types were investigated and their coverage areas and percentages were calculated, respectively (Table 1). There are considerable differences between the correlation relationships of various vegetation types. The evergreen broad-leaf forest has the highest EVI-air temperature correlation. Some 19.03% and 37.48% of the total area show a moderate positive correlation (0.5≤r<0.8) and a low positive correlation (0.3≤r<0.5), respectively. With the second highest correlation, 34.66% of the evergreen coniferous forest area and 34.08% of the deciduous coniferous forest area show low positive correlations. Some 27.09% and 35.78% of the deciduous broad-leaf forest area show low positive and weak positive EVI-temperature correlations, respectively. The EVI-temperature correlation for mixed evergreen deciduous forest is not obvious. Some 19.97% of this forest suggests a weak positive correlation (0≤r<0.3) while 31.31% indicates a weak negative correlation (-0.3≤r<0). The EVI-precipitation correlation also differs for different forest vegetation types. 43.26% of the mixed evergreen coniferous forest has an EVI positively but weakly correlated with precipitation (0≤r<0.3), while 44.81% of the evergreen coniferous forest, 52.12% of the evergreen broad-leaf forest, 50.93% of the deciduous coniferous forest and 50.27% of the deciduous broad-leaf forest show a weak negative correlation between EVI and precipitation (-0.3≤r<0).
Table 1 The area and proportion of correlation between EVI and temperature, precipitation within forest vegetation types in the Funiu Mountains during growing season
Correlation
coefficient class
Mixed evergreen
deciduous
forest
Evergreen coniferous forest Evergreen broad-leaf forest Deciduous coniferous forest Coniferous broad-leaf forest
Highly positive Air temperature 0.05 0.23 0.25 0.35 0.11
Precipitation - - - - 0
Moderately positive Air temperature 6.57 17.44 19.03 17.87 14.46
Precipitation 1.29 0.18 0.28 0.26 0.28
Low positive
correlation
Air temperature 14.88 34.56 37.48 34.08 27.09
Precipitation 11.91 3.18 3.75 1.89 3.25
Weak positive Air temperature 19.97 39.96 34.75 36.95 35.78
Precipitation 43.26 22.7 33.69 19.54 35.44
Weak negative Air temperature 31.31 7.29 7.25 9.55 2.42
Precipitation 34.16 44.81 52.12 50.93 50.27
Low negative Air temperature 20.57 0.46 1.06 1.06 17.59
Precipitation 7.31 24.18 9.17 22.83 9.78
Moderately negative Air temperature 6.61 0.05 0.18 0.15 2.32
Precipitation 2.07 4.94 0.92 4.9 0.98
Highly negative Air temperature - - - - 0.23
Precipitation - - - 0.02 0

3.5 Response delay of growing season biweekly EVI and climatic factor variations

The correlated relationships between the growing season (May to September) biweekly EVI and the air temperature and precipitation for: the same period; two weeks earlier; 1 month earlier; 1.5 months earlier; and 2 months earlier were analyzed and subjected to significance verification (Figure 9). The monthly EVI-temperature and precipitation correlation and the correlation significance show the same variations. The correlations, in descending order, are: in the same period>two weeks earlier>1 month earlier> 1.5 months earlier>2 months earlier. In the F test, the correlation coefficients with both EVI and temperature and precipitation taken in the same period have the greatest areas with acceptable significance. On the other hand, the correlation with temperature and precipitation measured 2 months before the growing season has the smallest area with acceptable significance.
Figure 9 The spatial distribution of correlation coefficient and significance test results between EVI and temperature (a), and EVI and precipitation (b) in the Funiu Mountains during the growing season
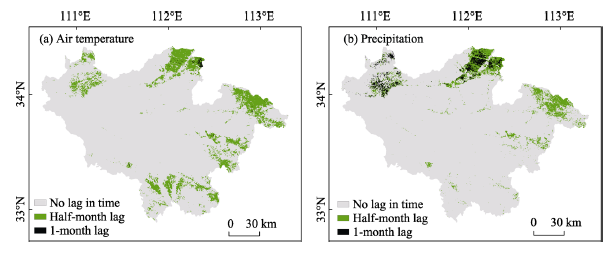
Figure 10 The spatial distribution of response lag of EVI to temperature (a) and precipitation (b) in the Funiu Mountains
With the ENVI/IDL program, the air temperature and precipitation correlation coefficient images were subjected to multi-band synthesis. The locations with the maximum coefficients were extracted and marked (Figure 10). The regions with an EVI response delay are mostly near the boundaries. Lag time is often two weeks or a month and there is no response lag time of 1.5 or 2 months. In order to investigate the characteristic lag time of EVI in response to air temperature and precipitation for different forest vegetation types, the lag time spatial distributions for air temperature and precipitation, respectively, were overlapped with the forest vegetation map, and a statistical survey was carried out (Table 2). The 5 vegetation types show identical patterns. Most of the study area has no response delay, whereas that with a 2-week lag time has the second largest percentage. The area with a 1-month lag time is the smallest. Some 73.14% and 85.09% of the mixed evergreen deciduous forest have immediate responses to air temperature and precipitation, respectively. More than 99% of evergreen coniferous forest, evergreen broad-leaf forest, deciduous coniferous forest, and deciduous broad-leaf forest show no delay in responding to air temperature and precipitation. The areas with 2-week and 1-month lag time constitute relatively small proportions of the 5 forest vegetation types. Compared with the other 4 vegetation types, mixed evergreen deciduous forest has a greater area with a 2-week response delay. The results suggest that, in general, the forest vegetation types in the Funiu Mountain region do not show a delay in their response to air temperature and precipitation, and evergreen deciduous forest shows a 2-week lag only in limited areas.
Table 2 The area percentage of different response delays to temperature and precipitation for various forest types in the Funiu Mountains
Lag Time Mixed evergreen deciduous forest Evergreen coniferous forest Evergreen broad-leaf forest Deciduous coniferous forest Coniferous broad-leaf forest
No lag Air temperature 73.14 99.77 99.24 99.7 99.65
Precipitation 85.09 99.35 99.17 99.67 99.33
Half-month lag Air temperature 27 0.23 0.8 0.3 0.41
Precipitation 12.97 0.74 0.78 0.11 0.65
1-month lag Air temperature 0.04 - 0.04 - 0.01
Precipitation 2.14 0.28 0.12 0.11 0.08

4 Conclusions

This paper investigated the dynamic, regional-scale forest responses to climate change in the Funiu Mountains and provides fundamental scientific data and technical support for monitoring and forecasting changes in mountain forest systems. However, due to remote sensing image resolution, interpolation accuracy, and inadequate survey information, there are certain difficulties in analyzing the structural responses of vegetation to air temperature and precipitation. In future, high-resolution images and fixed-point observations should be integrated so as to analyze the responses of various vegetation types to air temperature and precipitation at both community and species scales. Furthermore, different methodologies and data should be employed to establish models for vegetation dynamics and hydrothermal changes. This will allow study of vegetation responses to climate change at larger spatial and temporal scales, which is fundamental to future research.
Based on time series of MODIS EVI data reconstructed by the S-G filtering algorithm and air temperature and precipitation data, correlation analyses were conducted to study the spatial and temporal characteristics of the response of various forest vegetation types to air temperature and precipitation during the period of 2000-2013 in the Funiu Mountain region. The conclusions are as follows:
(1) The EVI first increases with altitude but then decreases at high altitude. Its peak is located at an elevation of 1600-1700 m. Areas with increasing EVI (54.48%) are far larger than those with decreasing values (0.4%). Most of the areas with increasing EVI belong to deciduous broad-leaf forest. This shows that forests are in a state of succession toward healthy development in the Funiu Mountain region.
(2) The increasing rate of air temperature is approximately +0.27℃/10a in the study area for recent years. The precipitation anomaly percentage shows a fluctuating yet increasing trend. The correlation between forest vegetation EVI and air temperature is closer than that between EVI and precipitation. The EVI-temperature correlation for evergreen broad-leaf forest is the highest. Evergreen coniferous forest and deciduous coniferous forest have the second closest EVI-temperature correlation. Mixed evergreen and deciduous forest has the weakest. Only the mixed evergreen and deciduous forest has a weak positive EVI-precipitation correlation; all other vegetation types show mainly weak negative correlations.
(3) The monthly EVI has the highest correlation with monthly air temperature and precipitation in most areas where the correlation coefficients pass the significance verification (P<0.05). In general, there is no obvious delay in forest response to air temperature and precipitation in the Funiu Mountains, only a 2-week delay in some areas of the mixed evergreen and deciduous forests.

The authors have declared that no competing interests exist.

[1]
Bao Gang, Bao Yuhai, Qin Zhihaoet al., 2013. Vegetation cover changes in Mongolian Plateau and its response to seasonal climate changes in recent 10 years.Scientia Geographica Sinica, 33(5): 613-621. (in Chinese)The change trend of vegetation cover in Mongolian plateau and its response to seasonal temperature and precipitation were analyzed by employing MODIS NDVI in 2001-2010,composed by 16 day maximum value synchronous climate variables and MODIS land cover product MCD12Q1.The result indicated that the area of vegetation cover increased which was similar to that of vegetation cover decreased,reaching 43.75% and 42.22% of the total area of Mongolian plateau,respectively.In recent 10 years,the vegetation cover decreased in spring and summer,while increased in autumn.The correlation analysis between seasonal NDVI and corresponding seasonal climate factors showed that the correlativity between NDVI and precipitation was significant in spring and summer(P=0.02 in spring,P=0.003 in summer),and the correlation coefficient between NDVI and precipitation in autumn also reached 90% confidence level,indicating that precipitation was a main factor of influencing vegetation cover changes in Mongolian plateau.It was found that five different vegetation types experienced increasing trend in autumn,vegetation changes in Gobi-desert experienced increasing trend in all 3 seasons.NDVI of forest,grassland and shrub decreased in spring and summer,while farmland decreased in spring and increased in summer.

[2]
Chen J, Jönsson P, Tamura Met al., 2004. A simple method for reconstructing a high-quality NDVI time-series data set based on the Savitzky-Golay filter.Remote Sensing of Environment, 91(3): 332-344.Although the Normalized Difference Vegetation Index (NDVI) time-series data, derived from NOAA/AVHRR, SPOT/VEGETATION, TERRA or AQUA/MODIS, has been successfully used in research regarding global environmental change, residual noise in the NDVI time-series data, even after applying strict pre-processing, impedes further analysis and risks generating erroneous results. Based on the assumptions that NDVI time-series follow annual cycles of growth and decline of vegetation, and that clouds or poor atmospheric conditions usually depress NDVI values, we have developed in the present study a simple but robust method based on the Savitzky&ndash;Golay filter to smooth out noise in NDVI time-series, specifically that caused primarily by cloud contamination and atmospheric variability. Our method was developed to make data approach the upper NDVI envelope and to reflect the changes in NDVI patterns via an iteration process. From the results obtained by applying the newly developed method to a 10-day MVC SPOT VGT-S product, we provide optimized parameters for the new method and compare this technique with the BISE algorithm and Fourier-based fitting method. Our results indicate that the new method is more effective in obtaining high-quality NDVI time-series.

DOI

[3]
Cui Linli, Shi Jun, Yang Yinminget al., 2009. Ten-day response of vegetation NDVI to the variations of temperature and precipitation in eastern China.Acta Geographica Sinica, 64(7): 850-860. (in Chinese)This paper analyzed the temporal and spatial responses of vegetation NDVI to the variations of temperature and precipitation in each ten-day period in the whole year,spring,summer and autumn covering 1998 to 2007 based on the SPOT VGT-NDVI data and daily temperature and precipitation data from 205 meteorological stations in eastern China.The results indicate that on the whole,the response of vegetation NDVI to the variation of temperature is greater than to that of precipitation in eastern China.Vegetation NDVI maximally responds to the variation of temperature with a lag of about 10 days,and it maximally responds to the variation of precipitation with a lag of about 30 days.The response of vegetation NDVI to temperature and precipitation is the greatest in autumn,and the lag time is longer in summer.Spatially,the maximum response of vegetation NDVI to the variation of temperature is greater in the northern and central parts than in the southern part of eastern China.The maximum response of vegetation NDVI to the variation of precipitation is greater in the northern part than in the central and southern parts of eastern China.There is more lag time of vegetation NDVI to the variation of temperature in the northern and southern parts,while less in the central part.The lag time of vegetation NDVI to the variation of precipitation gradually increases from the northern to the southern part according to the latitude.The response of vegetation NDVI to the variations of temperature and precipitation in eastern China is mainly consistent with other results obtained in eastern and southern China.

DOI

[4]
Cui Xiaolin, Bai Hongying, Wang Tao, 2013. Difference in NDVI with altitudinal gradient and temperature in Qinling area.Resources Science, 35(3): 618-626. (in Chinese)The Qinling Mountains are sensitive to climate change.Differences in vegetation NDVI across altitudinal gradients and its response to temperature in Qinling from 2000 to 2009 was carried out using MODIS NDVI images,temperature and 30m DEM data.We found that vegetation coverage is improving at Qinling and increasing year by year.This reflects the implementation of ecological policies around returning farmland to forest and grass.The average NDVI value increases and then decreases with increasing elevation in Qinling from 2000 to 2009.The maximum average NDVI value was from 1500锝2000m,and the minimum value was 500m.Agricultural vegetation was mainly distributed 500m,and with increasing elevation,agricultural vegetation transitioned to broadleaf forest vegetation.Due to human interference,broadleaf forest vegetation at higher altitudes was replaced by shrub vegetation gradually leading to a small NDVI value.Vegetation coverage from1500锝2000m and 2700m increased was not significant.In the past 30 years,temperature in the Qinling area has been rising at a rate higher than the national average.The correlation coefficient(0.43)between temperature and vegetation NDVI in the high altitude areas(2700 m)was the highest,reflecting that high altitude areas of terrestrial vegetation will be more vulnerable to global climate change.

[5]
Dai L, Feng Y X, Luo G Pet al., 2015. The relationship between soil, climate and forest development in the mid-mountain zone of the Sangong River watershed in the northern Tianshan Mountains, China.Journal of Arid Land, 7(1): 63-72.The mountainous forests in arid regions, being sensitive to climate change, are one of the key research topics related to the mechanism of interaction between climate and the terrestrial ecosystem. In this study, the spatial distribution of a mid-mountain forest and its environmental factors were investigated by using a combination of remote sensing technology, field survey, climate indices and soil nutrient analysis in the Sangong River watershed of the northern Tianshan Mountains. The forest ( Picea schrenkiana ) was distributed between 1,510 and 2,720 m asl. Tree height and diameter at breast height (DBH) exhibited a bi-modal pattern with increasing elevation, and rested at 2,450 and 2,250 m asl, respectively. The two maxima of DBH appeared at 2,000 and 2,550 m asl, and the taller trees were observed at 2,100 and 2,600 m asl. For the annual mean temperature, the difference was approximately 5.8C between the lowest and the highest limits of the forest, and the average decreasing rates per hundred meters were 0.49C and 0.55C with increasing altitude between 1,500 and 2,000 m asl and above 2,000 m asl, respectively. The annual precipitation in the forest zone first increased and then decreased with the increase of altitude, and the maximum value was at 2,000 m asl. For per hundred meters, the annual precipitation increased with the rate of 31 mm between 1,500 and 2,000 m asl and decreased by 7.8 mm above 2,000 m asl. The SOM, TN and TP were high between 2,000 and 2,700 m asl and low at the lower and upper forest limits. The minimum CaCO 3 concentration, pH value and EC coincided with the maximum precipitation belt at 2,000 m asl. The SOM, TN and TP were high in the topsoil (0-10 cm) and differed significantly from the values observed in the deep soil layers (>10 cm). The soil nutrients exhibited spatial heterogeneity and higher aggregation in the topsoil. In conclusion, soil and climate are closely related to each other, working synergistically to determine the development and spatial distribution of the mid-mountain forest in the study area. The order of the importance of environmental factors to forest development in this study is as follows: soil nutrients>precipitation>elevation>temperature.

DOI

[6]
Ding Shengyan, Lu Xunling, 2006. Comparison of plant flora of Funiu Mountains and Jigong Mountain natural reserves.Geographical Research, 25(1): 62-70. (in Chinese)The Funiu Mountain and Jigong Mountain naturalreserves are two famous forest reserves in Henan province.This paper compared the floras of these two natural reserves and calculated the comparability coefficients of the plants.The conclusion is as follows: the floras have certain comparability in the two regions,but they also differ to a certain extent.On the whole the transitionality in Funiu Mountain is stronger than Jigong Mountain,the flora of Funiu Mountain has a more tightness contact with Central China and North China,there are not only tropical and subtropical species but also many species of north temperate zone.Jigong Mountain is even more closely related to the north subtropical plant flora.The characteristics of these two regions are as follows:(1) the plant species and flora in Funiu Mountain are complex,dominated by tropical,subtropical and temperate zone components,while the plants in Jigong Mountain are mostly tropical and subtropical components, with temperate zone species in dominance to a certain extent.(2)Both regions are characterized by various geographical compositions,extensive flora contacts,association with east and west and transition between north and south.(3)There are many species proper to China.Funiu Mountain has close contact with floras of Central China,Southwest China and North China.Floras in Jigong Mountain are more closely related to Central China and East China.(4)Both are the unique species distributing centers of China in Henan Province,especially 80% of Henan unique species are concentrated in Funiu Mountain natural reserve.There are much more plant species in Funiu Mountain than in Jigong Mountain.This is propably related directly to their areas,the impacts of the human activities and the characteristics of transition.Furthermore,based on the comparative studies of the contact and characteristics of the floras in the two regions,we found that there are certain transitional characteristics in them,but the case of Funiu Mountain is clearer than that of Jigong Mountain.Since the two regions have an extremely higher comparability,it is suggested that these two regions should be put into one vegetation zone.However as there must be some differences between the northern slope and the southern slope of the Funiu Mountain,so whether there are close relations of vegetation between the two slopes of Funiu Mountain and Jigong Mountain need to be further studied.

DOI

[7]
Fan Yulong, Hu Nan, Ding Shengyanet al., 2008. A study on the classification of plant functional types based on the dominant herbaceous species in forest ecosystem at Funiu Mountains national natural reserve.Acta Ecologica Sinica, 28(7): 3092-3101. (in Chinese)Straddling the subtropical and warm-temperate zones of East China,the FuNiu Mountain National Natural Reserve is representative of north-south climatic transition zones.The vegetation in this natural reserve is well protected.Highly species rich,the understory layer is nonetheless mainly composed of a small number of dominant species whose abundances clearly vary along environmental(altitudinal)gradients.The shrubs appear to be greatly influenced by the trees.This may indicate that trees exert a certain degree of control over the renewal of the arboreal layer.Highly responsive to changes in environmental conditions,herbaceous plants are very useful to the study of vegetation-environment dynamics.Using community ecology techniques,we investigated plant assemblages on both the north and south slopes of the FuNiu Mountain.Results of this investigation were used to calculate species importance values,which in turn were used to identify dominant species.X2 test,together with association coefficient(AC)and percentage co-occurrence(PC),were used to measure interspecific associations of the dominant herbaceous species.PFTs were defined according to interspecific associations and altitudinal distributions of the dominant herbaceous species of the understory layer.Dynamics of these PFTs along moisture and temperature gradients were analyzed.The results of this study show that,in studies of forest understory plant assemblages,designating PFTs according to dominant herbaceous species is feasible,and PFTs thus defined are representative.Seven PFTs,each with its unique spatial distribution and morphological characteristics,are identified:campanion,alpine,dank,drought-resistant,forest gap,basic,primeval.These PFTs appear to reflect vegetation-environment dynamics well.This study may contribute to future studies on forest ecosystems and PFTs classification methods.

[8]
Huete A, Didan K, Miura Tet al., 2002. Overview of the radiometric and biophysical performance of the MODIS vegetation indices.Remote Sensing of Environment, 83(1): 195-213.We evaluated the initial 12 months of vegetation index product availability from the Moderate Resolution Imaging Spectroradiometer (MODIS) on board the Earth Observing System-Terra platform. Two MODIS vegetation indices (VI), the normalized difference vegetation index (NDVI) and enhanced vegetation index (EVI), are produced at 1-km and 500-m resolutions and 16-day compositing periods. This paper presents an initial analysis of the MODIS NDVI and EVI performance from both radiometric and biophysical perspectives. We utilize a combination of site-intensive and regionally extensive approaches to demonstrate the performance and validity of the two indices. Our results showed a good correspondence between airborne-measured, top-of-canopy reflectances and VI values with those from the MODIS sensor at four intensively measured test sites representing semi-arid grass/shrub, savanna, and tropical forest biomes. Simultaneously derived field biophysical measures also demonstrated the scientific utility of the MODIS VI. Multitemporal profiles of the MODIS VIs over numerous biome types in North and South America well represented their seasonal phenologies. Comparisons of the MODIS-NDVI with the NOAA-14, 1-km AVHRR-NDVI temporal profiles showed that the MODIS-based index performed with higher fidelity. The dynamic range of the MODIS VIs are presented and their sensitivities in discriminating vegetation differences are evaluated in sparse and dense vegetation areas. We found the NDVI to asymptotically saturate in high biomass regions such as in the Amazon while the EVI remained sensitive to canopy variations.

DOI

[9]
Jönsson P, Eklundh L, 2002. Seasonality extraction by function fitting to time-series of satellite sensor data.IEEE Transactions on Geoscience and Remote Sensing, 40(8): 1824-1832.A new method for extracting seasonality information from time-series of satellite sensor data is presented. The method is based on nonlinear least squares fits of asymmetric Gaussian model functions to the time-series. The smooth model functions are then used for defining key seasonality parameters, such as the number of growing seasons, the beginning and end of the seasons, and the rates of growth and decline. The method is implemented in a computer program TIMESAT and tested on Advanced Very High Resolution Radiometer (AVHRR) normalized difference vegetation index (NDVI) data over Africa. Ancillary cloud data [clouds from AVHRR (CLAVR)] are used as estimates of the uncertainty levels of the data values. Being general in nature, the proposed method can be applied also to new types of satellite-derived time-series data.

DOI

[10]
Jönsson P, Eklundh L, 2004. TIMESAT: A program for analyzing time-series of satellite sensor data.Computers & Geosciences, 30(8): 833-845.Three different least-squares methods for processing time-series of satellite sensor data are presented. The first method uses local polynomial functions and can be classified as an adaptive Savitzky-揋olay filter. The other two methods are more clear cut least-squares methods, where data are fit to a basis of harmonic functions and asymmetric Gaussian functions, respectively. The methods incorporate qualitative information on cloud contamination from ancillary datasets. The resulting smooth curves are used for extracting seasonal parameters related to the growing seasons. The methods are implemented in a computer program, TIMESAT, and applied to NASA/NOAA Pathfinder AVHRR Land Normalized Difference Vegetation Index data over Africa, giving spatially coherent images of seasonal parameters such as beginnings and ends of growing seasons, seasonally integrated NDVI and seasonal amplitudes. Based on general principles, the TIMESAT program can be used also for other types of satellite-derived time-series data.

DOI

[11]
Liang Guofu, Han Yan, Ding Shengyan, 2010. Forest landscape dynamics in north of Funiu Mountains along terrain gradient.Scientia Geographica Sinica, 30(2): 242-247. (in Chinese)The paper investigated the forest landscape dynamics in the north of the Funiu Mountain, where considerable attention has been drawn in issues of slowing down the agricultural expansion into the remaining natural forests. Based on the theory of landscape ecology, the terrain gradient of forest landscape dynamics were examined by using geographic information system. The results showed that terrain niche index was valuable in describing the forest landscape dynamics in the north of the Funiu Mountain. In 1986 and 2003, the predominant ranges of forest landscape change on terrain niche index were 9-30 and 10-30 respectively and there was a slight trend of up slide. From 1986 to 2003, the three predominant ranges of forest landscape change on terrain niche index in the areas of the forest landscape unchanged, the forest landscape converted to non-forest landscape, and the non-forest landscape converted to forest landscape were 10-30,5-12 and 4-10,18-24 respectively. In addition, by using spatial analysis in Arc/GIS 9.2 and Spss 10.0, the correlation of forest landscape change and the terrain gradient were analyzed. It indicated that there were notable correlations between them, especially in predominant ranges of terrain gradient.

DOI

[12]
Liu Zhihong, Mc Vicar T R, Li Lingtaoet al., 2008. Interpolation for time series of climatic variables using ANUSPLIN. Journal of Northwest A&F University (Natural Science Edition), 36(10): 227-234. (in Chinese)

[13]
Ma Jianhua, 2004. Laws of soil vertical variations on southern slope of Funiu Mt.: Simultaneous study on north boundary of subtropical zone.Acta Geographica Sinica, 59(6): 998-1011. (in Chinese)The vertical variations of soil compositions, properties, types according to genetic classification and taxonomic classification, and the north boundary of subtropical zone on the southern slope of Funiu Mountain were discussed in this paper based on soil survey in field and soil physical and chemical analysis in laboratory. There were some vertical varying laws of soil compositions and properties on the southern slope of Funiu Mountain. (1) The content of fulvic acid in soil humus exceeds that of humic acid in all profiles of soil (HA/FA1). The ratios of HA/FA in surface horizons are rising from foot to top of the mountain. The degree of humification in soil humic acid at 900 m asl is the lowest. (2) Along the altitude from foot to top of the mountain, both soil pH and base saturation percentage go down first, then go up. (3) Soils below 900 m asl have remarkable clayification horizon, argic horizon appears in each soil profile, and soils above 900 m asl have no clayification and argic horizons. (4) All of soils have higher degree of weathering and ferrallitization, average migration coefficients (Kmx) of most oxides and the values of in all of soil bodies are below 1, the values of "Saf" are smaller than 5.06, the contents of Fed in illuvial horizons are higher than 20 g路kg-1, the percentage of Fed/Fet in illuvial horizons is higher than 40%, and many kinds of ferromanganese (concretion and coating) appear in all soil bodies below 900 m asl. But for soils with lower degree of weathering, no ferrallitization takes place, and no ferromanganese appears in all soil bodies above 900 m asl. The north boundary of subtropical zone on south slope of Funiu Mountain is in the area between S3 and S4, ranging from 900 m to 1000 m, the average height of which is at 950 m above sea level.

DOI

[14]
Miao Lijuan, Jiang Chong, He Binet al., 2014. Response of vegetation coverage to climate change in Mongolian Plateau during recent 10 years.Acta Ecologica Sinica, 34(5): 1295-1301. (in Chinese)Vegetation in the arid/semi arid area is highly sensitive to climate change.The Mongolian Plateau climate is mainly controlled by the east Asia monsoon system.Hence both Inner Mongolia and the state of Mongolia(Hereafter;Mongolia) experience a similar arid/semi arid climate but have different anthropological influences via their separate social and economic development histories.In this study,we analyzed in-situ observations from 67 meteorological stations(50stations in Inner Mongolia and 17 in Mongolia) and NDVI(Normalized Difference Vegetation Index) product from SPOT(Satellite pour 1' observation de la Terre in French) using Mann-Kendall(MK) tests and Maximum Value Composition(MVC).Our results showed that;(1) Temperature is general higher in the south than the north,while precipitation ranges from low in the west to high in the east.There is a significant warming trend over the whole Mongolian Plateau region from1961 to 2009,while no obvious trends were found for precipitation;(2) Vegetation coverage in Inner Mongolia was generally greater than that in Mongolia.The time series of vegetation coverage change in these two regions can be divided into two periods.The regional averaged NDVI decreased from 1998 to 2001,fluctuated greatly and then increased continuously from 2009 to 2012.The main degraded areas are located in the Xilingol league,central Inner Mongolia,while they are mostly located in the central and western Mongolia;(3) Positive correlations were found between NDVI and precipitation in desert,steppe vegetation and forest areas in Mongolia,while negative relationships were found for temperature.In Inner Mongolia,NDVI are also positively correlated with precipitation in desert and steppe vegetation areas and also positively correlated with temperature in forests.Recently several major national ecological projects were implemented in Inner Mongolia by national central and local governments,including "The Return Cropland to Forest",the "Return Grazing Land to Grassland"(Grain for Green),and the Three North Protection Forest Plantation Project.These projects improved the local environment by stopping grazing/cropping and planting trees.We believe that these policy actions contribute to the vegetation recovery in Inner Mongolia exhibited here in the NDVI.We attribute the different trends and dynamics of vegetation change in Inner Mongolia and Mongolia to human activities since the climate is similar in these two areas.However,the mechanism driving the changes requires further study particularly investigation of the socioeconomic drivers of local land use changes.If formal/informal communication between Inner Mongolia and Mongolia are encouraged in scientific research,cultural exchange and policy making of environmental protection at different levels,it will provide more opportunity for preservation and enhancement of the nomadic culture.

DOI

[15]
Mu Shaojie, Li Jianlong, Zhou Weiet al., 2013. Spatial-temporal distribution of net primary productivity and its relationship with climate factors in Inner Mongolia from 2001 to 2010.Acta Ecologica Sinica, 33(12): 3752-3764. (in Chinese)Net primary productivity(NPP) and its responses to global change is one of the focuses of global change research.Based on MODIS NDVI data,land use classification data and meteorological data,spatio-temporal changes of the NPP of Inner Mongolia vegetation during 2001—2010 were simulated using improved light use efficiency model(CASA model).The relationships between NPP and climate factors were analyzed based on partial correlation coefficients of the two-group elements.The results showed that average annual NPP from 2001 to 2010 was 340.0 gCm-2a-1 in the study area,exhibiting obvious increase trend from southwest to northeast with a mean change rate of 200.5 gCm-2a-1/10°.The mean NPP of forest,grassland,cropland and desert were 521.9、270.3、405.7 and 85.3 gCm-2a-1,respectively,which showed significant differences.During 2001—2010,the average annual total NPP of Inner Mongolia vegetation was 322.7 TgCa-1,ranging from 276.8 to 354.4 TgCa-1.Over the 10 years period,extremely significant increase of vegetation NPP occurred in Alxa desert,the western margin of Mu Us sandy land,north of Hetao plain,the eastern and western margin of Hunshandak sandy land and northwest of Hulun Buir league,while extremely significant decrease of vegetation NPP mainly occurred in the grassland in the central of Inner Mongolia.Climate factors exerted various influences on different vegetation types.Temperature was the dominant driving force of NPP of forest,while precipitation influenced the NPP of grassland,cropland and desert vegetation more seriously.

DOI

[16]
Neigh C S R, Tucker C J, Townshend J R G, 2008. North American vegetation dynamics observed with multi-resolution satellite data.Remote Sensing of Environment, 112(4): 1749-1772.We investigated normalized difference vegetation index data from the NOAA series of Advanced Very High Resolution Radiometers and found regions in North America that experienced marked increases in annual photosynthetic capacity at various times from 1982 to 2005. Inspection of these anomalous areas with multi-resolution data from Landsat, Ikonos, aerial photography, and ancillary data revealed a range of causes for the NDVI increases: climatic influences; severe drought and subsequent recovery; irrigated agriculture expansion; insect outbreaks followed by logging and subsequent regeneration; and forest fires with subsequent regeneration. Vegetation in areas in the high Northern Latitudes appear to be solely impacted by climatic influences. In other areas examined, the impact of anthropogenic effects is more direct. The pattern of NDVI anomalies over longer time periods appear to be driven by long-term climate change but most appear to be associated with climate variability on decadal and shorter time scales along with direct anthropogenic land cover conversions. The local variability of drivers of change demonstrates the difficulty in interpreting changes in NDVI and indicates the complex nature of changes in the carbon cycle within North America. Coarse scale analysis of changes could well fail to identify the important local scale drivers controlling the carbon cycle and to identify the relative roles of disturbance and climate change. Our results document regional land cover land use change and climatic influences that have altered continental scale vegetation dynamics in North America.

DOI

[17]
Shen Xiangjin, Zhou Daowei, Li Feiet al., 2015. Vegetation change and its response to climate change in grassland region of China.Scientia Geographica Sinica, 35(5): 622-629. (in Chinese)This study analyzed the variation trend of vegetation NDVI and its response to climate change in grassland region of China by employing MODIS NDVI and meteorological data from1982 to 2006. Trend analysis, correlation analysis and spatial statistical analysis were carried out to investigate variation characteristics and spatial distribution pattern of vegetation NDVI, and analyze the relations between vegetation NDVI and meteorological factors. For temperate grassland region of China, growing season NDVI decreased gradually from northeast to southwest, and the grassland types from northeast to southwest are temperate meadow, temperate typical grassland and temperate desert grassland. For alpine grassland region of China, growing season NDVI was smaller overall than that of temperate grassland region, and it decreased on the whole from east to west, with the largest values concentrating in the east alpine meadow grassland. The results indicated that growing season NDVI increased on the whole in recent 25 years, but the spatial differences of seasonal changes were obvious. The largest increase of monthly NDVI occurred in August for temperate grassland region and in July for alpine grassland region. In the aspect of climate change, temperature showed obvious increase trend in the whole grassland region of China, while precipitation changes were not significant. For temperate grassland, spring temperature played an important impact on the vegetation growth of temperate typical grassland. The increase of summer precipitation could obviously promote the vegetation growth of temperate desert grassland. Monthly correlation analyses results showed that temperate grassland vegetation NDVI was significantly positively correlated with temperature in April, and May NDVI was significantly positively correlated with temperature in March and April. By contrast, the increase of June temperature could inhibit the growth of temperate grassland plants during the same period. In terms of precipitation, temperate grassland vegetation NDVI was significantly positively correlated with the previous month's precipitation (except August). April NDVI was significantly negatively correlated with precipitation in February, indicating that the low temperature in February could limit the growth of temperate grassland at the beginning of the growing season. Precipitation in June and July was significant for temperate grassland vegetation growth during the same time period, and the effect of August precipitation on vegetation growth was remarkable in September and October. For alpine grassland, spring temperature played an important impact on the vegetation growth of alpine meadow grassland and alpine typical grassland; summer and autumn temperatures had significant effect on alpine meadow grassland vegetation growth. Monthly correlation analyses results showed that monthly (April to October ) alpine grassland vegetation NDVI was significantly positively related to the air temperature during the same time period (except August), and temperature in August could affect alpine grassland vegetation growth in September. In addition, during the most vigorous growth period, alpine grassland vegetation had a time lag of 1-3 months for precipitation.

DOI

[18]
Song Chaoshu, 1994. Scientific Survey of the Funiu Mountains Nature Reserve. Beijing: China Forestry Publishing House, 10-11. (in Chinese)

[19]
Wang Can, Ren Zhiyuan, Zhang Chong, 2014. Intra-annual response of NDVI to changes in temperature and precipitation and its spatial characteristics in northern Shaanxi.Research of Soil and Water Conservation, 21(1): 173-177. (in Chinese)

[20]
Wang Genxu, Deng Wei, Yang Yanet al., 2011. The advances, priority and developing trend of alpine ecology.Journal of Mountain Science, 29(2): 129-140. (in Chinese)The responses of alpine ecosystems to global change not only have serious impacts on the worldwide pattern and functions of terrestrial ecosystems,but also significantly restrict the sustainable development of human society.After indicating the importance and desires for studying the alpine ecology,the advances,priority and key science problems of alpine ecology were clarified in this study.Based on the description of the importance and eagerness for developing the alpine ecology in China,the current situation and issues in alpine ecology study were discussed.Due to the largest mountain country,to further develop and study the alpine ecology in China has an important implication for maintaining the safety of ecology and environment.

DOI

[21]
Wang Jing, Wang Kelin, Zhang Mingyanget al., 2014. Temporal-spatial variation in NDVI and drivers in hilly terrain of Southern China.Resources Science, 36(8): 1712-1723. (in Chinese)Remote sensing data,MODIS NDVI from 2000 to 2010,annual dynamics,seasonal change and spatial variability in vegetation cover in hilly terrain of southern China was investigated. The causes of vegetation cover change were analyzed,considering climate change and human activities. Vegetation cover in hilly terrain of southern China was high and improved with fluctuations from 2000 to 2010. The response of NDVI to seasonal change varied with vegetation type. Grassland showed huge variation,while forest had the lowest change. The peak time of vegetation occurred in August or September. Vegetation cover change was spatially variable. Vegetation cover has increased in the ecological restoration zone,however,vegetation cover has decreased in the region because of rapid urbanization. The change in vegetation cover was the result of combined effects of climate variation and land use change. Correlation coefficients between interannual variation in NDVI and interannual variation in climate factors have apparent spatial differentiation. There was a significant correlation between temperature and vegetation cover,and temperature has controlled annual variation of vegetation growth and prolonged the growth period of vegetation. Precipitation was a controlling factor of seasonal change in vegetation growth,and a one-month lag in precipitation was positively correlated with vegetation growth. Change in land use was an important factor for vegetation spatial variation,and the implementation of large-scale vegetation construction has led to some beneficial effects in ecology,such as the Grain for Green Program and karst rocky desertification control project.

[22]
Wang Yuhang, Zhao Mingfei, Kang Muyiet al., 2016. Spatial scale-dependent and non-stationarity relationships between NDVI and climatic factors in the Loess Plateau.Geographical Research, 35(3): 493-503. (in Chinese)Understanding the relationship between vegetation and climate is the premise and foundation to reveal the distribution pattern of vegetation in large areas. Normalized Differentiation Vegetation Index (NDVI) has been regarded as an effective indicator for vegetation growth and distribution, especially for the large scope. To establish the accurate relationship between NDVI and climatic factors, this paper, based on the vegetation index product (MOD13Q1) relating to the Loess Plateau Area, northern China, and the climatic data observed in resent 50 years from the same area, has conducted a comparison between the two models named Geographically Weighted Regression, GWR, and Ordinary Least Squares, OLS, respectively. We analyzed the non-stationarity and scale-dependent characteristics between the two models with validation tool of corrected Akaike's Information Criterion, AICc, and calculated Moran's Index. The results showed: (1) the NDVI and the climatic factors had a strong scale-dependent relationship in the study area, and when the bandwidth approached to about 330 km in scale, they came up to a stable status. The annual mean precipitation, AMP, presented a larger fluctuation than the annual mean temperature, AMT, at the same scale of bandwidth. (2) Compared with OLS, the results of GWR showed a more accurate spatial distribution of vegetation, through validation by its model performance (AICc, , adjusted) and Moran's Index of residuals (<0.01). (3) The predicated result of GWR reflected the heterogeneity to some extent between the NDVI and the climatic factors. Precipitation had direct and positive influence on NDVI, whereas that of temperature was complicated. (4) The northeastern to southwestern distribution pattern between the NDVI and the climatic factors indicated a remarkable difference of climate-vegetation distribution pattern within the Loess Plateau. The heterogeneity between them also showed that some other factors such as human activities and/or orographic rains exerted influence on NDVI.

[23]
Xiao J, Moody A, 2005. Geographical distribution of global greening trends and their climatic correlates: 1982-1998.International Journal of Remote Sensing, 26(11): 2371-2390.We examined trends in vegetation activity at the global scale from 1982 to 1998 using a recently developed satellite‐based vegetation index in conjunction with a gridded global climate dataset. Vegetation greening trends were observed in the northern high latitudes, the northern middle latitudes, and parts of the tropics and subtropics. Temperature, and in particular spring warming, was the primary climatic factor associated with greening in the northern high latitudes and western Europe. Temperature trends also explained greening in the US Pacific Northwest, tropical and subtropical Africa, and eastern China. Precipitation was a strong correlate of greening in fragmented regions only. Decreases in greenness in southern South America, southern Africa, and central Australia were strongly correlated to both increases in temperature and decreases in precipitation. Over vast areas globally, strong positive trends in greenness exhibited no correlation with trends in either temperature or precipitation. These areas include the eastern United States, the African tropics and subtropics, most of the Indian subcontinent, and south‐east Asia. Thus, for large areas of land that are undergoing greening, there appears to be no climatic correlate. Globally, greening trends are a function of both climatic and non‐climatic factors, such as forest regrowth, CO2 enrichment, woody plant proliferation, and trends in agricultural practices.

DOI

[24]
Xu Jianhua.Mathematical Methods in Modern Geography, 2002. Beijing: Higher Education Press, 48-51. (in Chinese)

[25]
Yan Jianwu, Chen Baozhang, Fang Shifenget al., 2012. The response of vegetation index to drought: Taking the extreme drought disaster between 2009 and 2010 in Southwest China as an example.Journal of Remote Sensing, 16(4): 720-737. (in Chinese)Based on the 10-year(2001―2010)time series of Moderate-resolution Imaging Spectroradiometer(MODIS)NormalizedDifference Vegetation Index(NDVI)products and meteorological station data in the area of Southwest China, we extractedthe NDVI values for the footprint of meteorological measurements and calculated the percentage of precipitation anomaly(<i>P</i><sup>a</sup>)and D index(difference between precipitation and potential evapotranspiration)as two drought indices. We then involved the informationon vegetation types(Vegetation type map of China’s landmass, 2000)conducted a compressive spatial-temporal regressionanalyses against these two meteorological drought indices and NDVI anomaly at seasonal time scales. The results showingthat:(1)For most vegetation types, NDVI anomaly signif icantly corresponded to D index with a lag of about one month(<i>R</i><sup>2</sup>>=0.7,P<0.01);(2)These correlations were higher for the drought-sensitive vegetation types(i.e. dry land:<i>R</i><sup>2</sup>=0.83; grassland:<i>R</i><sup>2</sup>=0.71)than other types;(3)The spatial distribution of NDVI anomaly was relatively consistent with that of D index especiallyin drought season while it was only consistent with Pa in very drought season or for drought sensitive vegetation types.

DOI

[26]
Yang Z, Gao J, Zhou Cet al., 2011. Spatio-temporal changes of NDVI and its relation with climatic variables in the source regions of the Yangtze and Yellow Rivers.Journal of Geographical Sciences, 21(6): 979-993.The source regions of the Yangtze and Yellow rivers are important water conservation areas of China. In recent years, ecological deterioration trend of the source regions caused by global climate change and unreasonable resource development increased gradually. In this paper, the spatial distribution and dynamic change of vegetation cover in the source regions of the Yangtze and Yellow rivers are analyzed in recent 10 years based on 1-km resolution multi-temporal SPOTVGT-DN data from 1998 to 2007. Meanwhile, the correlation relationships between air temperature, precipitation, shallow ground temperature and NDVI, which is 3脳3 pixel at the center of Wudaoliang, Tuotuohe, Qumalai, Maduo, and Dari meteorological stations were analyzed. The results show that the NDVI values in these two source regions are increasing in recent 10 years. Spatial distribution of NDVI which was consistent with hydrothermal condition decreased from southeast to northwest of the source regions. NDVI with a value over 0.54 was mainly distributed in the southeastern source region of the Yellow River, and most NDVI values in the northwestern source region of the Yangtze River were less than 0.22. Spatial changing trend of NDVI has great difference and most parts in the source regions of the Yangtze and Yellow rivers witnessed indistinct change. The regions with marked increasing trend were mainly distributed on the south side of the Tongtian River, some part of Keqianqu, Tongtian, Chumaer, and Tuotuo rivers in the source region of the Yangtze River and Xingsuhai, and southern Dari county in the source region of the Yellow River. The regions with very marked increasing tendency were mainly distributed on the south side of Tongtian Rriver and sporadically distributed in hinterland of the source region of the Yangtze River. The north side of Tangula Range in the source region of the Yangtze River and Dari and Maduo counties in the source region of the Yellow River were areas in which NDVI changed with marked decreasing tendency. The NDVI change was positively correlated with average temperature, precipitation and shallow ground temperature. Shallow ground temperature had the greatest effect on NDVI change, and the second greatest factor influencing NDVI was average temperature. The correlation between NDVI and shallow ground temperature in the source regions of the Yangtze and Yellow rivers increased significantly with the depth of soil layer.

DOI

[27]
Yao Yonghui, Zhang Baiping, 2015. The spatial pattern of monthly air temperature of the Tibetan Plateau and its implications for the geo-ecology pattern of the Plateau.Geographical Research, 34(11): 2084-2094. (in Chinese)The immense and towering Tibetan Plateau(TP) acts as a heating source and shapes the climate of not only the Eurasian continent but also the entire world. Currently, air temperature of the plateau is usually obtained from discrete meteorological observational data using a series of statistical analyses and spatial interpolation. However, the interpolation accuracy is low due to the scarcity of meteorological observation stations, and little is quantitatively known about the detailed temperature pattern of the TP. According to Modisbased estimated air temperature data, this paper firstly studies the detailed spatial pattern of air temperature of the TP; Then it analyzes the spatial changes of isotherm altitudes of-10℃,-5℃,0℃, 5℃, 10℃ for every month. Isotherm altitudes are extracted from Aster GDEM; Thirdly,this paper discusses the implication of air temperature of TP for treelines and snowlines based on 148 snowline data and 267 treeline data. The results show that: 1) isotherms have a trend of rising from the eastern and northeastern edges of the plateau to the interior and about 500-2000 m higher in the interior than in the eastern and northeastern edges; 2) the northwestern plateau,or the Qiangtang plateau and the Hoh Xil region, are the coldest regions of the TP, where air temperatures are below 0℃ for seven months and lower than-10 ℃ for three or four months in a year; the southern and central plateau, especially the north flank of Himalaya-the south flank of Gangdisê Mts., the north flank of Gangdisê Mts.-the south flank of Tanggula Mts., and the great river valleys, are quite warm, with monthly mean air temperatures between 5-10 ℃ for five months and above 10 ℃ for three months in a year; especially, air temperature of the coldest month is above 0℃ below the elevations of 3500-4500 m at Lhasa, Linzhi and Zuogong. 3) The highest treeline and snowline of the Northern Hemisphere are distributed in the southeastern and southwestern parts of the plateau, respectively, revealing a significant effect of air temperature on the geo-ecological pattern of the TP.

[28]
Yu Fei, Zheng Xiaobo, Gu Xiaopinget al., 2008. Comparative study on spatial interpolation of climate elements precision in complex mountainous environment.Journal of Guizhou Meteorology, 32(3): 3-6. (in Chinese)

[29]
Zhang Baiping, Yao Yonghui, Mo Shenguoet al., 2002. Digital spectra of altitudinal belts and their hierarchical system.Journal of Mountain Science, 20(6): 660-665.This paper constructs a special data structure model for montane altitudinal belt spectra (mabs) and thereby realizes digitalization and visualization of mabs. A three-level hierarchy is drawn form abs classification: the first level is "spectra series " with same base belt. A total of 31 basic spectra series can be generalized for China; the second level is "spectra group" with same characteristic belts; the third level is "spectrum type" with same altitudinal belt combination and structure. Five ecological types of mabs are also distinguished as follows: (1) climax mabs, related with regional climate, (2) standard mabs, related with main mountains, (3) special/transitional mabs, related with special geoecological phenomenon, (4) disturbed mabs, related with human disturbances, and (5) secondary mabs, related with intensive human activities. Digital comparison and analysis of mabs could reveal more geographical information than ever before.

DOI

[30]
Zhang Chong, Ren Zhiyuan, Yuan Xin, 2011. Intra-annual response of NDVI to changes in temperature and precipitation and its spatial characteristics in northwest China.Resources Science, 33(12): 2356-2361. (in Chinese)Reducing human disturbance to natural systems is of importance in studying the relationships between vegetation and climate. Northwest China, as one of a few extensive regions with increasing human disturbance, provides an ideal region for examining response of natural vegetation cover to water/thermal conditions. Combined with daily mean temperature and precipitation data and 15-day NDVI of GIMMS VGT from 1982 through 2006, the lag cross-correlation method was used to analyze temporal and spatial characteristics of the relationships between water/thermal climate elements and vegetation cover. Results show that: 1) correlation of NDVI with temperature and precipitation was relatively strong, with the response being faster over regions of higher vegetation cover, low-altitude mountains, and along rivers. There was low correlation across basins, high-altitude plateau, and mountainous areas, with the time of response being longer. There was low correlation and a slow response over areas with less water and heat. NDVI showed a greater correlation and faster response to accumulated temperature (10) and precipitation; 2) The degree of influence of temperature and precipitation on NDVI in descending order was coniferous forest, shrub and grassland, meadow and herbaceous swamp, hardwood forest, and desert vegetation, distributed generally from east and west to desert vegetation showing decreasing correlation. A certain type of vegetation whose growth requires a higher temperature showed a faster response. On the contrary, vegetation whose growth depends on low temperature showed a slow response. This rule can also be applied to precipitation; 3) Requirement on water and heat for different vegetation types in descending order was coniferous forest, shrub and grassland, meadow and herbaceous swamp, hardwood forest, and the desert vegetation.

DOI

[31]
Zhang Geli, Xu Xingliang, Zhou Caipinget al., 2011. Responses of vegetation changes to climatic variations in Hulun Buir grassland in past 30 years.Acta Geographica Sinica, 66(1): 47-58. (in Chinese)Global warming,a global concern,has led to significant vegetation changes especially in the past 30 years.The Hulun Buir Grassland in Inner Mongolia,one of the world's three prairies,is undergoing a process of prominent warming and drying.It is necessary to investigate the effects of climatic variations(temperature and precipitation) on vegetation changes for a better understanding of acclimation to climatic change.NDVI(Normalized Difference Vegetation Index),which can reflect characteristics of plant growth,vegetation coverage,biomass,and so on,is used as an indicator in monitoring vegetation changes.GIMMS NDVI from 1981 to 2006 and MODIS NDVI from 2000 to 2009 were adopted and integrated in this study to extract the time series characteristics of vegetation change conditions in Hulun Buir.The responses of vegetation coverage changes to climatic variations from the yearly,seasonal and monthly time scales were analyzed combined with temperature and precipitation data of seven meteorological sites.In the past 30 years,vegetation coverage change was closely correlated with climatic factors,and the correlations were different on different time scales.Annual average of vegetation change was better correlated with precipitation,suggesting that rainfall was the main factor for driving vegetation change.Correlations between seasonal average of vegetation coverage and climatic factors showed that the sensitivity of vegetation growth to hydrothermal condition change was different in different seasons.The sensitivity of vegetation growth to temperature in summer was higher than in the other seasons,while that of vegetation growth to rainfall in both summer and autumn was higher,especially in summer.Correlations between monthly average of vegetation coverage and climatic factors during growing seasons showed that the response of vegetation change to temperature in April and May was stronger,indicating that the temperature effect occurred in the early stage of vegetation growth.Correlations between NDVI of the current month and precipitation of the month before the current month were better from May to August,showing a hysteresis response of vegetation growth to rainfall.Grasses turned green and began to grow in April,and the impacts of temperature on grass growth was obvious,therefore,the increase of NDVI in April might be due to an advanced growing season caused by climatic warming.In summary,relationships between annual variation of monthly vegetation and climatic factors represent temporal rhythm controls of temperature and precipitation on grass growth.

DOI

[32]
Zhang Jinghua, Feng Zhiming, Jiang Luguanget al., 2015. Analysis of the correlation between NDVI and climate factors in the Lancang River Basin.Journal of Natural Resources, 30(9): 1425-1435. (in Chinese)Based on MODIS NDVI and meteorological data from 2000 to 2010, this study analyzed the correlation between NDVI and meteorological factors pixel by pixel in the Lancang River Basin, studied the spatial pattern of the relationship between vegetation and climate, and explored the possible influence factors. The study indicated that: 1) Both temperature and precipitation had significant impacts on vegetation growth in the Lancang River Basin, and the temperature's effect was particularly striking. 2) The response of vegetation growth to climate change showed significant time lag effect, and the lag time shortened as the latitude went up. 3) For different vegetation types, both the orders of influence degree of meteorological factors on NDVI and the sensitive degree of NDVI to climate change were, in turn, grassland, cropland, shrub forest and woodland. For the same vegetation, the impact of temperature was greater than that of precipitation, but NDVI was more sensitive to precipitation. 4) Climate characteristics(perennial mean temperature and multi-year average precipitation) had significant impacts on the response time of NDVI to climate change. There is no significant influence of perennial mean temperature on the relationship between NDVI and temperature, but multi-year average precipitation has impacts on the degree of correlation between NDVI and precipitation.

DOI

[33]
Zhang Jingjing, Wang Yansong, Zhu Lianqiet al., 2016. Study on change of northern subtropical border in mountainous regions in western Henan Province. Journal of Henan University (Natural Science), 46(1): 40-49. (in Chinese)

[34]
Zhu Lianqi, Xu Limin, 2011. Analysis of effects of global change on terrestrial ecosystem.Areal Research and Development, 30(2): 161-164. (in Chinese)This paper introduces the facts of global change,e.g.,increasing of greenhouse gases concentration,climate warming,rising of sea level.On the basis of previous researches,proposed that global change is not only depended on physical variation,but also human activity is an important factor that can not be ignored,and also studied the effect of global change on grain production,husbandry,agricultural natural disasters,change of agroecosystem,forest ecosystem and biodiversity from hydro-thermal balance,climate change,rapid desertification and decrease of biodiversity,analyzed regional variation of global change's effect on terrestrial ecosystem,difference of terrestrial ecosystem's response to global change,and discussed the future situation and task of the research of global change's effects on terrestrial ecosystem.

Outlines

/