Research Articles

Evaluation of the applicability of climate forecast system reanalysis weather data for hydrologic simulation: A case study in the Bahe River Basin of the Qinling Mountains, China

  • HU Sheng , 1, 2, * ,
  • QIU Haijun , 1, 2 ,
  • YANG Dongdong 1, 2 ,
  • CAO Mingming 1, 2 ,
  • SONG Jinxi 1, 2 ,
  • WU Jiang 1, 2 ,
  • HUANG Chenlu 1, 2 ,
  • GAO Yu 3
Expand
*Corresponding author: Qiu Haijun, Associate Professor, specialized in geological disasters. E-mail:

Author: Hu Sheng (1988-), PhD Candidate, specialized in hydrology, water resources, and geological disasters. E-mail:

Received date: 2016-09-23

  Accepted date: 2016-10-21

  Online published: 2017-05-10

Supported by

International Partnership Program of Chinese Academy of Sciences, No.131551KYSB20160002

National Natural Science Foundation of China, No.41401602

Natural Science Basic Research Plan in Shaanxi Province of China, No.2014JQ2-4021

Key Scientific and Technological Innovation Team Plan of Shaanxi Province, No.2014KCT-27

Graduate Student Innovation Project of Northwest University, No.YZZ15011

Copyright

Journal of Geographical Sciences, All Rights Reserved

Abstract

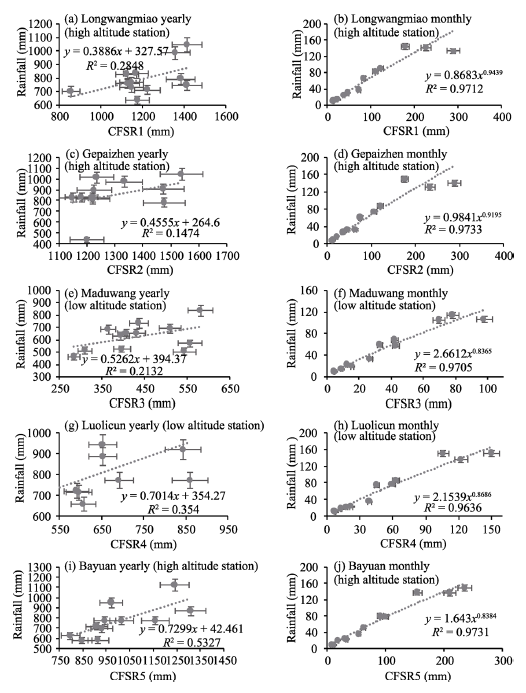
In recent years, global reanalysis weather data has been widely used in hydrological modeling around the world, but the results of simulations vary greatly. To consider the applicability of Climate Forecast System Reanalysis (CFSR) data in the hydrologic simulation of watersheds, the Bahe River Basin was used as a case study. Two types of weather data (conventional weather data and CFSR weather data) were considered to establish a Soil and Water Assessment Tool (SWAT) model, which was used to simulate runoff from 2001 to 2012 in the basin at annual and monthly scales. The effect of both datasets on the simulation was assessed using regression analysis, Nash-Sutcliffe Efficiency (NSE), and Percent Bias (PBIAS). A CFSR weather data correction method was proposed. The main results were as follows. (1) The CFSR climate data was applicable for hydrologic simulation in the Bahe River Basin (R2 of the simulated results above 0.50, NSE above 0.33, and |PBIAS| below 14.8. Although the quality of the CFSR weather data is not perfect, it achieved a satisfactory hydrological simulation after rainfall data correction. (2) The simulated streamflow using the CFSR data was higher than the observed streamflow, which was likely because the estimation of daily rainfall data by CFSR weather data resulted in more rainy days and stronger rainfall intensity than was actually observed. Therefore, the data simulated a higher base flow and flood peak discharge in terms of the water balance, except for some individual years. (3) The relation between the CFSR rainfall data (x) and the observed rainfall data (y) could be represented by a power exponent equation: y=1.4789x0.8875 (R2=0.98,P<0.001). There was a slight variation between the fitted equations for each station. The equation provides a theoretical basis for the correction of CFSR rainfall data.

Cite this article

HU Sheng , QIU Haijun , YANG Dongdong , CAO Mingming , SONG Jinxi , WU Jiang , HUANG Chenlu , GAO Yu . Evaluation of the applicability of climate forecast system reanalysis weather data for hydrologic simulation: A case study in the Bahe River Basin of the Qinling Mountains, China[J]. Journal of Geographical Sciences, 2017 , 27(5) : 546 -564 . DOI: 10.1007/s11442-017-1392-6

1 Introduction

As the driving factor for hydrological models, it is clear that hydrometeorological data is of great significance. However, investigators often encounter various practical challenges such as missing data, difficulty in collecting data, a lack of observation stations, and being located far from study areas. These problems have greatly restricted research progress and have also reduced the efficiency of models. Since the 1990s, some international researchers have used satellite data as an input to hydrological models (Barrett et al., 1993; Dile and Srinivasan, 2014). With the development of surface observation technology, satellite remote sensing, radar observation systems, and computer models, the inversion of meteorological data using these techniques has been increasingly applied to hydrological modeling. Global reanalysis weather data provided by the United States and Europe is currently used for various hydrological applications around the world (Zhao et al., 2010; Fuka et al., 2014). Some examples include: the National Centers for Environmental Prediction (NCEP) Climate Forecast System Reanalysis (CFSR); the NCEP and US Department of Energy (DOE) NCEP/DOE; the NCEP and the National Center of Atmospheric Research (NCAR) NCEP/NCAR; the European Centre for Medium-Range Weather Forecasts (ECMWF) RA-15/40; Japan Meteorological Agency (JMA) JRA-25; and National Aeronautics and Space Administration (NASA) DAO. In recent years, global reanalysis weather data has also been gradually applied to the field of hydrology. For example, it has been reported that NCEP/NCAR and ECMWF 40-year datasets have an obvious variability in the field of reanalysis precipitation, and it has therefore been suggested that higher spatial resolution data would have great advantages in acquiring higher frequency events, especially in medium-sized watersheds (Ward et al., 2011; Fuka et al., 2014). Zhao et al. (2015) reported that in terms of the performance of model simulation, Tropical Rainfall Measuring Mission (TRMM) data was more effective than gauge data provided at monthly time scale. Fuka et al. (2014) suggested that when global reanalysis data sets are selected for small- to medium-sized watersheds, three criteria should be considered: (1) the dataset should be open and available, including temperature and precipitation; (2) spatial resolution needs to be 30 km; and (3) the length of records should include adequate historical coverage to allow model calibration and validation, and extend to the present. Compared with nine other global reanalysis data products, Fuka et al. (2014) found that only the CFSR dataset could simultaneously satisfy the aforementioned criteria.
The CFSR provided by NCEP was completed over 36 years (from 1979 to 2014). It is currently used by many researchers who regard it as an ideal alternative data source. When conducting a hydrologic forecast, Dile and Srinivasan (2014) demonstrated that CFSR weather data was a viable option for simulating the hydrology of data-scarce regions such as remote parts of the Upper Blue Nile Basin. Sharp et al. (2015) compared the CFSR reanalysis hourly wind speed with in situ measurements and discovered that CFSR weather data could represent the variety of terrain across the UK well. To a certain extent, CFSR might therefore provide an alternative to in situ measurements for the UK. Fuka et al. (2014) reported that a watershed model forced by CFSR precipitation and temperature data could provide a perfect runoff simulation. The simulation result was as good as or better than a model using conventional weather data (Fuka et al., 2014). CFSR weather data is widely applied in the field of meteorology (Xu et al., 2010; Hu et al., 2013; Xiang et al., 2014), but the application of CFSR in the field of hydrology has been less frequently reported in China. According to the results of several Chinese studies, CFSR precipitation data can be affected by topography and geomorphology, the number of available sites and their homogeneity, and the physical parameters of models. This results in significant differences between CFSR precipitation and observed precipitation, resulting in streamflow simulations using CFSR precipitation being overestimated. It has also been shown that CFSR weather data has different levels of applicability in different regions (Hu et al., 2013; Tang et al., 2014; Yu and Mu, 2015). These studies have indicated that the quality of CFSR data still needs to be improved, but CFSR reanalysis data can be used for hydrological simulations, especially in areas lacking observed data. Unfortunately, although many researchers (Dileand Srinivasan, 2014; Worqlul et al., 2014; Fuka et al., 2014; Zhao et al., 2015; Yu and Mu, 2015; Blacutt et al., 2015) have conducted evaluations of the suitability of CFSR weather data, they have not proposed revised methods for the use of CFSR weather data or their methods were oversimplified. To improve the applicability of CFSR for different study areas, we undertook a preliminary revision of CFSR weather data on the basis of previous studies.
The Qinling Mountains, as the geographical boundary dividing the north and south of China, is not only an area sensitive to global climate change, but is also prone to torrential flooding, debris flows, and landslides. Due to the terrain, Qinling has a limited number of hydrometeorological stations at high altitudes, which is a major challenge for the hydrological simulation of small- to medium-sized watersheds. Therefore, we selected the Bahe River Basin, which is located on a north-facing slope in the Qinling Mountains, as the study area. Based on ArcGIS 10.2 and SWAT 2012, we used regression analysis, Nash-Sutcliffe Efficiency (NSE), and Percent Bias (PBIAS) to comprehensively explore the suitability of CFSR weather data for hydrological simulations. We used the results to propose a revised method for CFSR weather data in the Bahe River Basin. We hope that the results will provide a scientific reference for hydrological simulation and mountain hazard warning in the Qinling Mountains.

2 Study area

Rising in Jiudaogou (Nine Gaps) (part of the Bayuan Townships, Lantian County, Shaanxi Province), Bahe River is located on a north-facing slope of the Qinling Mountains and to the southeast of Xi’an City (33°50'N-34°27'N, 109°00'E-109°47′E). It has a length of 104.1 km, drainage area of approximately 2581 km2, and the river drops by 1142 m. Topographically, the area tilts from the southeast to the northwest (Figure 1). The Bahe River Basin has a warm temperate continental monsoon climate. Annual precipitation in the area is about 800 mm and annual evaporation is about 776 mm.

3 Hydrometeorological data

3.1 Data sources

Digital elevation model (DEM) data, land cover data, soil data, hydrological data and meteorological data are the essential and fundamental information required for modeling in a Soil and Water Assessment Tool (SWAT) model. The DEM dataset was obtained from the Geospatial Data Cloud (http://www.gscloud.cn) and has a resolution of 30 m × 30 m. The land cover data used in the SWAT was collected from the Department of Land and Resources of Shaanxi Province’s Second National Land Survey County-level Database. By reclassifying the land use, we identified six land use types (Figure 1) in the study area. The soil dataset was derived from the China Soil Map Based Harmonized World Soil Database (v1.1) provided by the Cold and Arid Regions Sciences Data Center at Lanzhou (http://westdc.westgis. ac.cn/), China. The hydrological data was transcribed from Yellow River Basin Hydrological Data (2001-2012), which is a special collection held in the Xi’an University of Technology Library. The meteorological data used in our study had two different sources. The conventional weather data was provided by the China Meteorological Data Network (http://data.cma.gov.cn/) and Yellow River Basin Hydrological Data (2001-2012). The CFSR weather data was downloaded from the SWAT model’s official website (http://globalweather.tamu. edu/).
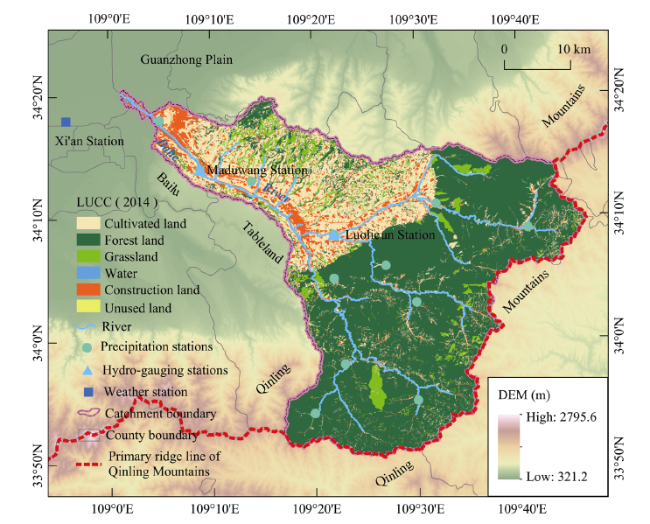
Figure 1 Map showing the location of the Bahe River Basin and its land use types in 2014

3.2 Comparison of the conventional and CFSR weather data

Meteorological data is the driving factor of the hydrological modeling in the SWAT model. However, many researchers have been unable to obtain high-quality hydrometeorological data. The main purpose of this study was to investigate if global reanalysis data products can replace observed hydrometeorological data for use in hydrological modeling, especially for areas where there is a lack of observed data. To intuitively compare the performance of a CFSR weather simulation with a conventional one in the SWAT model, no model calibration was undertaken. This also eliminated the influence of parameter calibration. Clearly, the two types of data had some significant differences in their temporal and spatial features.
Table 1 Conventional rainfall information (2001-2012) and Climate Forecast System Reanalysis (CFSR) weather data in the Bahe River Basin
Stations Id Average annual rainfall (mm) Elevation (m) Controlling sub-basins
Bayuana P01 773.9 1144 Sub 13-14, 17
Mujiayanc P02 896.3 794 Sub 3-4, 7-8, 19, 21
Muhuguanb P03 649.9 1200 Sub 25-28
Lanqiaob P04 676.7 1768 Sub 22-23
Luolicunc,e P05 830.4 544 Sub 12, 15-16, 18, 20
Gepaizhena P06 853.6 1145 Sub 32-33
Yuchuana P07 891.2 1117 Sub 29-31
Longwangmiaoc P08 806.2 1352 Sub 34-35
Wangchuana P09 904.2 985 Sub 24
Pantaowana P10 655.5 495 Sub 2, 5-6, 9-11
Maduwangc,e P11 637.2 431 Sub 1
Xiquc P12 582.8 402 Sub 1
CFSR1d p3391094 1223.5 1590 Sub 27, 29-31, 33-35
CFSR2d p3391097 1271.0 1142 Sub 28, 32
CFSR3d p3421091 437.0 470 Sub 1, 5
CFSR4d p3421094 645.2 680 Sub 2, 6-12, 15-16, 18-20, 22-24
CFSR5d p3421097 983.7 1385 Sub 3-4, 13-14, 17, 25-26

Note: aindicates rain gauging stations operating only in the flood season (from April to October) of 2001; bindicates rain gauging stations operating in the flood season during 2001-2010; cindicates rain gauging stations operating year round; dindicates meteorological stations; eindicates hydro-gauging stations.

In the Bahe River Basin, there are 12 conventional precipitation stations that provide a dense network with a uniform distribution (Figure 2). Because the SWAT model adopts the Theissen Polygon Interpolation algorithm to distribute meteorological sites for a sub-basin, each precipitation station represented only a small part of the sub-basin (Table 1). We selected the period 2001-2012. On account of some rain gauging stations only operating in flood season, equipment failure, or lags in upgrades, there was some missing data. The conventional stations provided daily observed precipitation data. The average annual precipitation of the 12 stations was 763.2 mm with the maximum value recorded at Wangchuan station (904.2 mm) and the minimum at Xiqu station (582.8 mm).
Figure 2 Map showing the distribution of sub-basins and hydrometeorological stations
CFSR is the product of global climate reanalysis grid data generated by the NCEP Global Forecast System. The horizontal resolution of the CFSR is 0.5°×0.5° (approximately 38 × 38 km). Compared with the use of conventional weather stations, CFSR is more suitable for a large-scale to mesoscale watershed. Users can access the SWAT website (http://globalweather. tamu.edu/) to freely and expediently download daily CFSR weather data (including precipitation, wind, relative humidity, and solar) in the SWAT file format for a given location and time period. As mentioned earlier, the use of CFSR weather data has many advantages, but also some drawbacks. For example, CFSR weather data over- or underestimates precipitation at some stations and there are large uncertainties in its data quality.

4 The hydrological model and its evaluation

4.1 SWAT model

The SWAT model is a watershed scale model, which was developed by Jeff Arnold of the Agricultural Research Service (ARS) of United States Department of Agriculture (USDA). It has a strong physical basis and can be used for modeling in regions where there is a lack of observational data (Wang et al., 2003). The original intention of the model was to predict the long-term effects of large watershed land management on runoff, sediment, and agricultural chemicals, under conditions of complex land use, soil type, and management measures (Hu, 2015). At present, the model is applied widely in North America, Africa, the Middle East, Europe, and other locations (Dile and Srinivasan, 2014; Rouholahnejad et al., 2014; Abbaspouret al., 2015; Troin et al., 2015). In recent years, Chinese researchers have conducted research in various basins at different scales, including the basins of Yellow River, Heihe River, Sanjiang Plain, Beiluo River, Jinjiang River, Xiangjiang River, Ganjiang River, and Hanjiang River (Liu et al., 2004; Wang and Chen, 2008; Lai et al., 2013; Liu et al., 2014; Hu, 2015).These studies have mainly involved simulations of runoff and sediment discharge, soil erosion, agricultural non-point source pollution, and climate and land use changes on runoff response, as well as SWAT model improvements, hydrological simulations at different temporal and spatial scales, the coupling of various hydrological models, the sensitivity and optimization of model parameters, and considerations of the regional adaptability of the SWAT model (Hu, 2015).

4.2 Model setup

A unified projection and coordinate system is the mathematical foundation for successfully running the SWAT model. All spatial data in this study used the Xi’an 1980 coordinate system and the 3° zoning Gauss_Kruger projection system, and the central meridian was108°E. The linear river data in the Second National Land Survey County-level Database was used in the extraction of the river network, using a DEM to ensure the accuracy of the auto-generated river network. To obtain the appropriate amount of sub-basin and number of Hydrological Response Units (HRUs), we set the minimum catchment area to 2000 ha (20 km2) on the basis of a repeated debug. The threshold of land use, soil type, and gradient was set to 20% in each case. Finally, the SWAT model generated 35 sub-basins (Figure 2) and 315 HRUs. To obtain a better initial state, the SWAT model needs to set a preheating period of 3-5 years. The preheating period of the model used in this study was set to 5 years, and therefore the start simulation time was January 1, 1996 and the end was December 31, 2012. In addition, we used the two different types of meteorological data and selected two different time intervals (monthly and annual) for hydrological simulation.

4.3 Model evaluation

(1) Regression analysis
Regression analysis is the most basic method of quantitative analysis. A unary linear regression analysis and a nonlinear regression analysis of a power exponent model, which are used in mathematical statistics to determine the quantitative relationship between two or more interdependent variables, were used in this study. Considering that the two methods are very common there is no further explanation given here.
(2) Nash-Sutcliffe Efficiency (NSE)
In hydrology, efficiency is usually evaluated with the Nash-Sutcliffe efficiency coefficient (NSE). NSE is a normalized statistic to determine the relative amount of residuals and the variance of the observed data (Nashand Sutcliffe, 1970). It is calculated with Equation (1):
where NSE is the Nash-Sutcliffe Efficiency;\(Q^i_{obs}\) is the observed streamflow at the ith time interval;\(Q^i_{sim}\)is the simulated streamflow at the ith time interval;\(Q^{mean}_{obs}\) is the average of the observed streamflow; and n is the total number of observations. NSE values can range from -∞ to 1. An NSE value of 1 corresponds to a perfect match between observed and simulated streamflow. An NSE value between 0 and 1 is considered to be an acceptable level of performance, whereas an NSE value ≤0 suggests the observed average is a better predictor than the model.
(3) Percent Bias (PBIAS)
Percent Bias (PBIAS) is another important index for evaluating the efficiency of a hydrological model (Gupta et al., 1999; Moriasi et al., 2007). It is computed with Equation (2):
The meaning of the variables in Equation (2) is the same as in Equation (1). The optimal value of PBIAS is 0. A positive value indicates that the model has underestimated and a negative value indicates an overestimation.

5 Results

5.1 Model simulations with conventional weather data

All of the simulation results in this study were obtained without any parameter calibration. Figures 3 and 4 show the simulated and observed flow at monthly and annual time scales, respectively. It was found that the discharge curve of the simulations using conventional weather data at a monthly time scale fitted perfectly with the observed steamflow. Nevertheless, the SWAT model driven by conventional weather performed poorly in the simulation of base and peak flow, and generally underestimated both values. A similar situation was apparent in the simulations with an annual time scale, in which the normal year was well simulated, but the simulation of wet years was underestimated. To accurately quantify the relationship between the simulated and observed streamflow, we performed an ordinary linear regression analysis. Figures 5 and 6 show that this resulted in a highly (0.001<P<0.01) or extremely (P<0.001) significant linear relationship. At a monthly time scale, the goodness of fit (R2) values for Luolicun and Maduwang were 0.85 and 0.83 respectively. However, the R2 values at an annual time scale were 0.66 (Luolicun) and 0.72 (Maduwang), i.e., slightly worse.
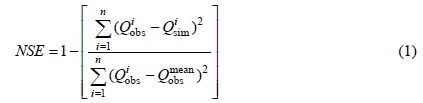
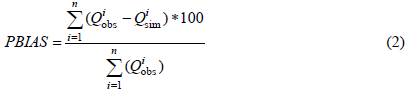
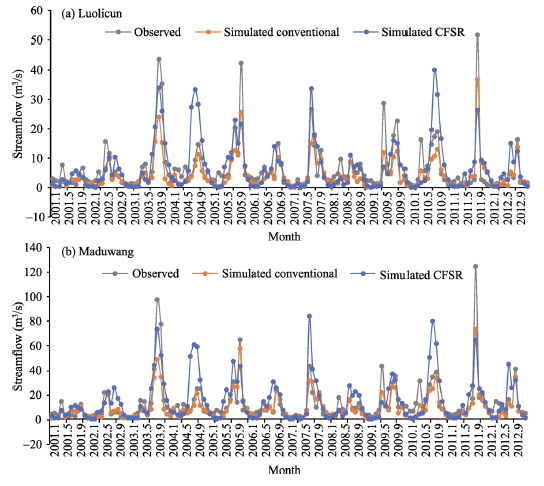
Figure 3 Hydrographs showing monthly observed streamflow and streamflow simulated with conventional and Climate Forecast System Reanalysis (CFSR) weather data
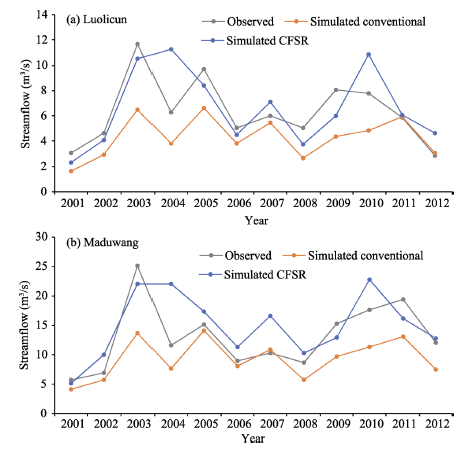
Figure 4 Hydrographs showing annual observed streamflow and streamflow simulated with conventional and Climate Forecast System Reanalysis (CFSR) weather data
As seen in Table 2, the NSE values for two hydrological stations were greater than 0, indicating that the simulation results at both monthly and annual time scales were within the acceptable range, but at different scales, and displayed a greater difference (NSEmonthly>0.7, NSEannual<0.2). The PBIAS values for Luolicun and Maduwang were greater than 0. Overall, simulated streamflow was generally lower than observed streamflow, but the PBIAS values at monthly and annual time scales were basically the same. In conclusion, the SWAT model based on conventional weather data produced better hydrological simulations. Monthly simulation results were generally more reliable than annual simulations, although they also displayed minor underestimations. There were still some concerns regarding the simulation results at an annual time scale, such as some large deviations in individual years, underestimations of NSE and goodness-of-fit (R2) values (which were the main sources of uncertainty in model simulations), the quality of hydrological and meteorological data, and modeling without parameter calibration. These issues were system errors rather than mistakes. After choosing 13 parameters to preliminarily calibrate the SWAT model, we found that the NSE value of the annual simulated result increased to 0.78, the R2 value increased to 0.8, and the |PBIAS| values decreased to 5.6 and 7.8.
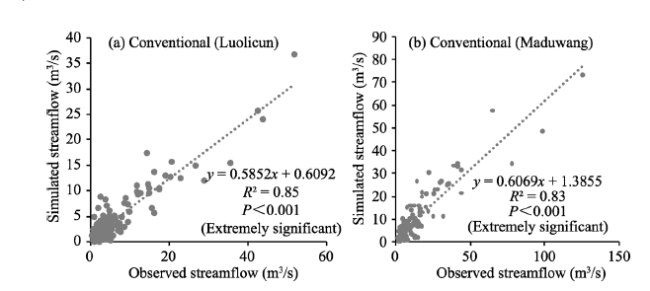
Figure 5 Regression analysis between monthly observed and simulated streamflows
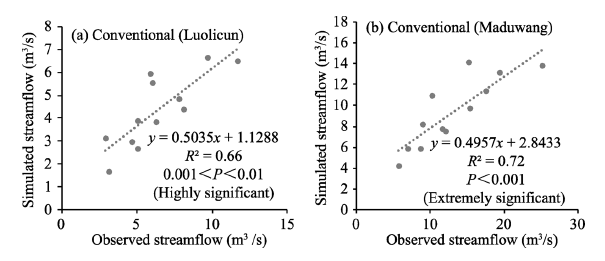
Figure 6 Regression analysis between annual observed and simulated streamflows
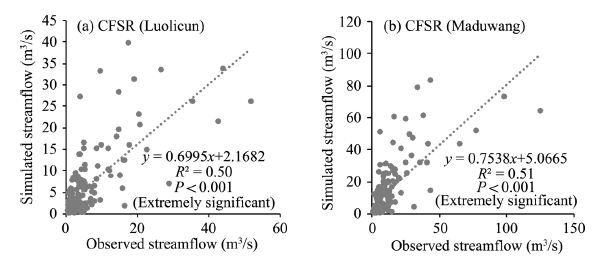
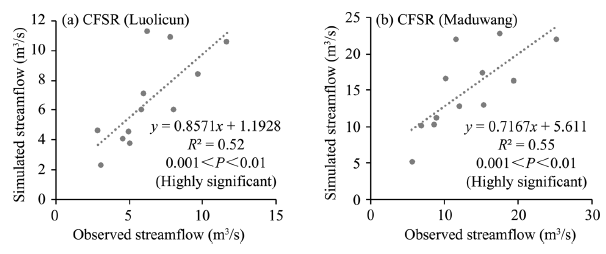
Figure 7 Regression analysis between monthly observed and simulated streamflows
Figure 8 Regression analysis between annual observed and simulated streamflows

5.2 Model simulations with CFSR weather data

For the SWAT model hydrological simulation, CFSR weather data and conventional weather data had some features in common, but the differences were more obvious (Figures 3-8 and Table 2). For example: (1) The simulated streamflow using CFSR weather data and observed streamflow had a highly (0.001<P<0.01) or extremely significant (P<0.001) linear relationship, but the R2 values at the two time scales were similar (R2monthly>0.50, R2annual>0.52). (2) NSEmonthly (Luolicun was 0.428, Maduwang was 0.372) were also higher than NSEannual (Luolicun was 0.339, Maduwang was 0.370). NSE values greater than 0 suggested that simulation results were within satisfactory thresholds. Nonetheless, both NSEmonthly and NSEannual were below 0.5, and the NSEannual values of CFSR simulations were higher than those of conventional weather simulations. (3) For the same hydrological station, the NSEmonthly and NSEannual of simulations using CFSR weather data were almost the same, but they were less than 0 and the degree of deviation of simulations was far lower than for the simulations produced using conventional weather data. A negative PBIAS value indicated an overestimation. The SWAT model based on CFSR weather data performed well in hydrological simulations, but sometimes overestimated streamflow. Compared with annual simulations, monthly simulations were more accurate. If model calibration is performed, CFSR reanalysis data will be more applicable in the Bahe River Basin.
Table 2 Model performance evaluations for monthly and annual time scales in the Bahe River Basin using conventional and Climate Forecast System Reanalysis (CFSR) weather simulations
Time scales Hydro-gauging stations Conventional CFSR
NSE PBIAS NSE PBIAS
Monthly Luolicun 0.708 31.841 0.428 -4.260
Maduwang 0.718 28.640 0.372 -14.401
Annual Luolicun 0.151 31.840 0.339 -4.523
Maduwang 0.182 28.587 0.370 -14.783

5.3 Comparison of simulated results based on the two sets of weather data

(1) Model evaluation criteria
According to the standard evaluation of model efficiency, the results above indicate that the conventional weather data in the SWAT model produced better simulations than the CFSR weather data overall. However, in terms of hydrological simulations, CFSR weather data performed better than conventional weather data at annual time intervals, as did the PBIAS values.
(2) Simulation of water balance components
Figure 9 shows that the use of the two types of weather data in the estimation of water balance produced consistent results in the Bahe River Basin, but the CFSR weather data resulted in a higher estimated value at each stage of the water balance. For annual precipitation, the value estimated by CFSR weather data (884.3 mm) was 109.4 mm higher than the value from the conventional precipitation station (774.9 mm).Actual evapotranspiration (ET) and the surface runoff contribution to streamflow (SUR_Q) were not obviously different between simulations using conventional and CFSR weather data. Runoff simulated by CFSR weather data indicated a higher groundwater contribution to streamflow (GW_Q) and a higher lateral flow contribution to streamflow (LAT_Q) than conventional weather data. In addition, the water yield (WYLD) value simulated by CFSR weather data was 106.3 mm higher than in the simulation using conventional weather. We need to understand why the CFSR simulation results for base and peak flow were overestimated.
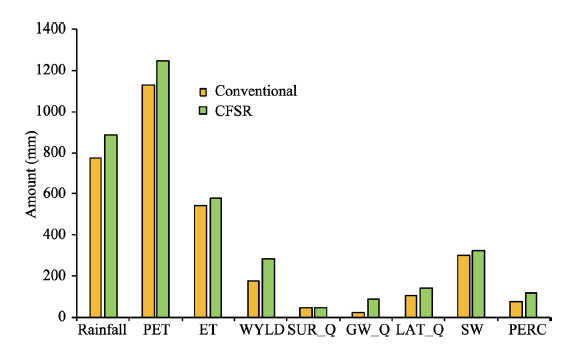
Figure 9 Water balance components for the conventional and Climate Forecast System Reanalysis (CFSR) weather data simulations in the Bahe River Basin (Rainfall, average annual precipitation; PET, potential evapotranspiration; ET, actual evapotranspiration; WYLD, water yield (= SUR_Q + LAT_Q+GW_Q-TLOSS); SUR_Q, surface runoff contribution to streamflow; GW_Q, groundwater contribution to streamflow; LAT_Q, lateral flow contribution to streamflow; SW, soil water content; PERC, water percolating passed the root zone; Q-TLOSS, transmission loss)
(3) Simulation of actual evapotranspiration
Figure 10 shows the average monthly actual evapotranspiration in the Bahe River Basin simulated by the SWAT model in 2001-2012. In terms of actual evapotranspiration, both simulation results were almost the same (a difference of just 35.2 mm), and the two curves were also extended with a similar regularity, displaying a “Λ”-shaped pattern throughout the year. In particular, the conventional weather simulation gave higher estimates than the CFSR weather simulation from January to June, but the opposite happened from July to December.
(4) Simulation of average monthly streamflow
From Figure 11, it can be seen that there are two high peak values of flow in the basin, which occurred in May and September, respectively. Although both types of weather data could simulate the change of flood season well, they underestimated the peak flow in May. It was found that CFSR weather data could satisfactorily simulate the peak flow in September, but compared with the observed and simulated streamflows obtained using the conventional weather data, the CFSR weather data overestimated the runoff in July and August.This was mainly because the rainfall simulation of the CFSR reanalysis data was about 52.85 and 28.33% higher than the observed rainfall in July and August (Figure 10). It was also the main reason why CFSR precipitation was higher than the observed rainfall at annual time scales. The runoff processes simulated by the two types of weather data from January to May were almost the same, but their values were significantly underestimated compared to the observed runoff.
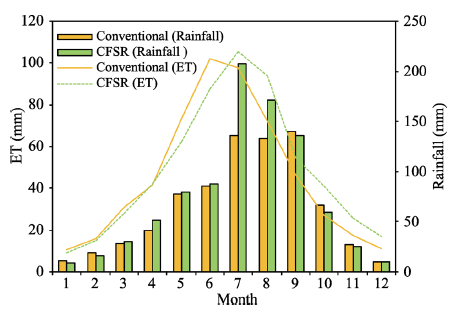
Figure 10 Average monthly actual evapotranspiration simulated with conventional and Climate Forecast System Reanalysis (CFSR) weather data in the Bahe River Basin
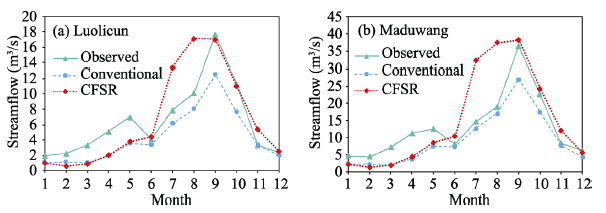
Figure 11 Average monthly streamflow hydrograph simulated with conventional and Climate Forecast System Reanalysis (CFSR) weather data in the Bahe River Basin

5.4 Attribution analysis and CFSR weather data revisal

For the runoff simulation of the SWAT model, when the conventional weather simulations were compared with the CFSR weather data simulations from multiple evaluation criteria, some issues still remained.
(1) In the hydrological simulation without model calibration, for the R2 and NSE values of the runoff simulation, the annual simulation using conventional weather data produced lower values than the monthly simulations. This was mainly due to the many precipitation stations operating in the flood season (from April to October) in the Bahe River Basin (Table 1). For this reason, annual precipitation was underestimated compared to the actual value. However, this situation could be improved by calibrating the model parameters.
(2) Rainfall is an important factor in the process of runoff generation and flow concentration. The average annual rainfall (884.3 mm) estimated by the CFSR simulation was 14.11% more than that recorded at conventional precipitation stations (774.9 mm). In terms of changes in rainfall, there were no significant differences during the other months, except for July and August for which rainfall amounts were far higher than those recorded at conventional precipitation stations. In terms of water balance, CFSR rainfall made a large contribution to base flow, lateral flow and water yield. This was an important reason why CFSR simulations overestimated the annual flows, and simulated higher monthly base and peak flows. Fortunately, CFSR weather data can effectively compensate for the inadequacies of conventional weather data. It is likely that CFSR weather data will have the potential for a broad application in hydrological predictions.
CFSR weather data is a product based on conventional ground observation data, satellite remote sensing data, and highly advanced and coupled atmospheric-oceanic-surface modeling components, and it has a high degree of space-time resolution (Dile and Srinivasan, 2014). Therefore, there must be a certain relationship between estimated and observed precipitation data (Hu et al., 2013; Worqlul et al., 2014; Blacutt et al., 2015). There have been many studies that have revised observed weather data (Ye et al., 2007), but few investigators have conducted revisions of global climate reanalysis data or weather satellite data. Studies of reanalysis weather data revisions are still at an exploratory stage. In some related studies (Zhao et al., 2010; Fuka et al., 2014; Dile and Srinivasan, 2014; Worqlul et al., 2014; Yu and Mu, 2015; Blacutt et al., 2015), the investigators did not consider the revision of CFSR weather data. Some researchers have focused on the statistical characterization of CFSR and conventional weather data, but they have not proposed a method of data revision. Some researchers have considered that revised CFSR weather data could be better used in hydrological models, but some problems exist with their proposed revisal methods (Table 3).
Table 3 Advances in methods used to revise reanalysis data in recent years
Researcher Year Revising data or not Revisal method Notes
Dile et al. 2014 No - They introduced Climate Forecast System Reanalysis (CFSR) data into a Soil Water and Assessment Tool (SWAT) model, but did not undertake a revision.
Fuka et al. 2014 No -
Worqlul et al. 2014 No - They found that the estimates of Multi-Sensor Precipitation Estimate-Geostationary (MPEG) and CFSR data conformed to the actual value, but CFSR overestimated or underestimated precipitation at some stations.
Blacutt et al. 2015 No - They focused on the contrast between the statistical characteristics of CFSR and conventional weather data, ignoring their relevance at a monthly scale.
Zhao et al. 2015 No - They used a monadic linear regression to analyze Tropical Rainfall Measuring Mission (TRMM) satellite data and observed precipitation data and found that the degree of fitting was relatively high. However, they did not give the fitting equation for the stations investigated.
Yu et al. 2015 Yes Error ratio method They defined a correction coefficient (measured annual precipitation/CFSR annual precipitation), but the modified scale was large.
Based on previous studies, we selected various CFSR stations and their adjacent conventional precipitation stations to conduct a regression analysis at monthly and annual scales, respectively. By comparing the fitting effects of different functional models, we found that the R2 value of a power exponent model at a monthly time scale was the highest. From Figure 12, it was evident that the fitting at five stations was very poor, with low R2 values (0.15-0.53). However, monthly R2 values were greater than 0.96 (P<0.001), indicating that CFSR rainfall and observed precipitation had an extremely significant power exponent relation. The different stations had different power exponent fitting equations and R2 values. R2 values in high altitude stations (>1100 m) were slightly larger than in low altitude stations (<700 m). The percentage error lines of the scatter diagram in Figure 12 show that when monthly CFSR precipitation at high altitude stations was greater than 100 mm, the percentage
error displayed an increasing trend. However, to achieve the same trend, precipitation at low altitude stations only needed to exceed 35 mm. Furthermore, we calculated the multi-year average monthly precipitation for five CFSR stations and 12 observed rainfall stations, respectively, and after fitting, we found that they equally well satisfied a power exponent relation. The fitting equation was as follows:
where x is the average monthly precipitation for a CFSR station, and y is the average monthly precipitation for a conventional precipitation station. This equation is based on the fitting of multi-year average monthly precipitation data, and needs to be more stable to reflect the relationship between the two types of weather data at monthly time scales. Using this equation, the monthly precipitation from CFSR weather data will be more accurate. The R2 value of this power exponent equation was higher than that of the monadic linear equation proposed by Zhao et al. (2015), which provides a reference method for the revision of CFSR rainfall data.
Figure 12 Annual and monthly precipitation fitting between observed rainfall stations and Climate Forecast System Reanalysis (CFSR) stations

5.5 The performance of revised CFSR weather data

There was an extremely significant power exponent relationship between the precipitation from CFSR stations and observed rainfall in the Bahe River Basin. To some extent, CFSR weather data can compensate for the shortcomings of conventional weather data in base flow and flood simulations. Runoff in the basin is not only associated with total rainfall, but is also related to the distribution of rainfall intensity (Zhou et al., 2005). Compared with the daily observed precipitation, CFSR daily rainfall data causes problems such as the overestimation of rainfall days or torrential rain intensity, which results in problems with the accuracy of the data and its applicability to certain regions. So how can we solve these problems? We conjecture that if the CFSR precipitation data is revised by the fitting equation in Figure 12, the errors associated with CFSR weather data may be reduced. We can then input the revised CFSR rainfall data to the SWAT model, with the other conditions unchanged, and operate the model again to produce a more satisfactory simulation result.
To clearly and intuitively demonstrate the difference in the simulation results before and after the revision of CFSR weather data, we undertook a comparison of the monthly runoff simulation at Maduwang hydrological station from 2001 to 2003 (Figure 13).From the scatter plots in Figure 13, it can be seen that the simulation was clearly improved after the revision. To put this in perspective, before revision, the R2 value was 0.8223, the NSE value was 0.807, and the PBIAS value was 1.270. After revision, the R2 value was 0.8516, the NSE value was 0.850, and the PBIAS value was -5.018. The discharge hydrograph displayed several changes before and after the revision of CFSR weather data. For example, after revision, CFSR precipitation data improved the base flow, reduced the small flood peak flow (e.g., in July 2001, August and September 2002), and increased the big flood peak flow (e.g., in April 2001, June 2002, April and September 2003) to make it closer to the observed peak value. This confirmed that the revision of CFSR precipitation data produced a better hydrological simulation in the Bahe River Basin, and also improved the efficiency of the SWAT model. At the same time, it also confirmed that the data revision method presented in formula (3) was effective.
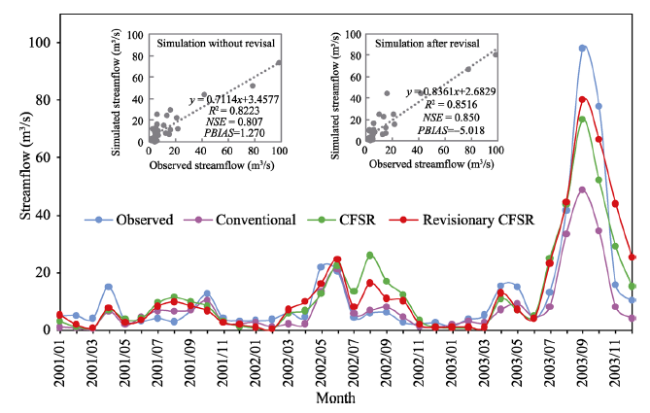
Figure 13 Contrast in simulation results (2001-2003) before and after the revision of Climate Forecast System Reanalysis (CFSR) weather data at Maduwang hydrological station

6 Conclusions and discussion

We investigated the applicability of CFSR weather data for hydrological simulation in the Bahe River Basin. The main results were as follows. (1) CFSR and conventional weather data had their own advantages and disadvantages for hydrological simulation using the SWAT model. We found that the NSE value of the simulation results was low (0.33< NSE<0.5), while the performance was improved when using the SWAT model with revised CFSR weather data (Figure 13). From the overall evaluation results, conventional weather data still had some advantages in runoff simulation, but revised CFSR weather data might be a good option for areas with a lack of observed data. (2) Simulation results driven by the two types of weather data were different at different time scales. Streamflows simulated by conventional weather data were lower than observed streamflows, with a PBIAS value between 28.5 and 31.9. Streamflows simulated by CFSR weather data were higher than observed streamflows, with a PBIAS value between -14.8 and -4.26. The main reason for this was that some rainfall stations were only used in the flood season, which would lead to a lower observed rainfall. However, CFSR daily rainfall data had a longer duration and a stronger rainfall intensity, and therefore it could simulate a higher base flow and peak flow just in terms of water balance. After analysis and comparison, some CFSR stations underestimated rainfall in the flood season and annual rainfall in some wet years, which led directly to a reduction in surface runoff, and caused an underestimation of runoff in some years (September of 2003, 2005, 2009, and 2005). This was determined by the system error and data quality of CFSR weather data, but also indicated the necessity of revising CFSR weather data. (3) Overall, there was an extremely significant power exponent relationship between observed rainfall data (y) and CFSR rainfall data (x), which could be expressed as y = 1.4789 x0.8875 (R2 = 0.98, P<0.001), but the fitting equation and R2 value for each pair of stations were different. After the revision of CFSR weather data, it was found that the R2 value increased from 0.8223 to 0.8516, the NSE value increased from 0.807 to 0.850, and the accuracy of base flow and peak flow simulation was also improved. To some extent, this compensated for the deficiencies of simulations by conventional weather data and unrevised CFSR weather data.
CFSR weather data has many advantages over conventional weather data in that it not only provides a complete set of climatic data, but also has the flexibility to be applied to different hydrological models. In addition, it has the advantages of high space-time resolution, easy data collection, and reducing the cost of study. In terms of hydrological simulation, CFSR weather data could be a valuable option for some areas lacking observed data (Dile and Srinivasan, 2014). Because of terrain, the type of climate forecast model used, and system errors, CFSR reanalysis data for daily rainfall and rainy days were overestimated in the wet period. This meant that it was not possible to use CFSR weather data for hydrological simulations without data quality control and an applicability evaluation analysis. A preliminary attempt was undertaken in this study in terms of revision of CFSR rainfall data, which found a good power exponent relationship between CFSR and observed rainfall data. The method used to revise CFSR reanalysis data and a comparison of the effects on the data before and after revision were also studied and discussed. However, due to space constraints, we presented only a preliminary discussion of the method used to revise CFSR reanalysis data. Moreover, the weather input data of the SWAT model also includes daily temperature, daily wind speed, daily relative humidity and daily solar radiation, and there may be quantitative relations between these factors and observed data. There may be a more scientific and effective method for the revision of CFSR weather data. These issues need to be investigated in the future work.

The authors have declared that no competing interests exist.

[1]
Abbaspour K C, Rouholahnejad E, Vaghefi Set al., 2015. A continental-scale hydrology and water quality model for Europe: Calibration and uncertainty of a high-resolution large-scale SWAT model.Journal of Hydrology, 524: 733-752.A combination of driving forces are increasing pressure on local, national, and regional water supplies needed for irrigation, energy production, industrial uses, domestic purposes, and the environment. In many parts of Europe groundwater quantity, and in particular quality, have come under sever degradation and water levels have decreased resulting in negative environmental impacts. Rapid improvements in the economy of the eastern European block of countries and uncertainties with regard to freshwater availability create challenges for water managers. At the same time, climate change adds a new level of uncertainty with regard to freshwater supplies. In this research we build and calibrate an integrated hydrological model of Europe using the Soil and Water Assessment Tool (SWAT) program. Different components of water resources are simulated and crop yield and water quality are considered at the Hydrological Response Unit (HRU) level. The water resources are quantified at subbasin level with monthly time intervals. Leaching of nitrate into groundwater is also simulated at a finer spatial level (HRU). The use of large-scale, high-resolution water resources models enables consistent and comprehensive examination of integrated system behavior through physically-based, data-driven simulation. In this article we discuss issues with data availability, calibration of large-scale distributed models, and outline procedures for model calibration and uncertainty analysis. The calibrated model and results provide information support to the European Water Framework Directive and lay the basis for further assessment of the impact of climate change on water availability and quality. The approach and methods developed are general and can be applied to any large region around the world.

DOI

[2]
Barrett C B, 1993. The development of the Nile hydrometeorological forecast system.Journal of the American Water Resources Association, 29: 933-938.Abstract ABSTRACT: The National Oceanic and Atmospheric Administration is developing a river forecast system for the Nile River in Egypt. The river forecast system operates on scientific work stations using hydrometeorological models and software to predict inflows into the high Aswan Dam and forecast flow hydrographs at selected gaging locations above the dam The Nile Forecasting System (NFS) utilizes satellite imagery from the METEOSAT satellite as the input to the forecast system. Satellite imagery is used to estimate precipitation over the Blue Nile Basin using five different techniques. Observed precipitation data and climatic statistics are used to improve precipitation estimation. Precipitation data for grid locations are input to a distributed water balance model, a hill slope routing model, and a channel routing model. A customized Geographic Information System (GIS) was developed to show political boundaries, rivers, terrain elevation, and gaging network. The GIS was used to develop hydrologic parameters for the basin and is used for multiple display features.

DOI

[3]
Blacutt L A, Herdies D L, Gonçalves L G G Det al., 2015. Precipitation comparison for the CFSR, MERRA, TRMM3B42 and Combined Scheme datasets in Bolivia.Atmospheric Research, 163: 117-131.The statistical variables indicated that CoSch's correlation coefficient was highest for every season and basin. Additionally, the bias and RMSE values suggested that CoSch closely represented the surface observations.

DOI

[4]
Dile Y T, Srinivasan R, 2014. Evaluation of CFSR climate data for hydrologic prediction in data-scarce watersheds: An application in the Blue Nile River Basin.Journal of the American Water Resources Association, 50(5): 1226-1241.Data scarcity has been a huge problem in modeling the water resources of the Upper Blue Nile basin, Ethiopia. Satellite data and different statistical methods have been used to improve the quality of conventional meteorological data. This study assesses the applicability of the National Centers for Environmental Prediction's Climate Forecast System Reanalysis (CFSR) climate data in modeling the hydrology of the region. The Soil and Water Assessment Tool was set up to compare the performance of CFSR weather with that of conventional weather in simulating observed streamflow at four river gauging stations in the Lake Tana basin — the upper part of the Upper Blue Nile basin. The conventional weather simulation performed satisfactorily (e.g., NSE02≥020.5) for three gauging stations, while the CFSR weather simulation performed satisfactorily for two. The simulations with CFSR and conventional weather yielded minor differences in the water balance components in all but one watershed, where the CFSR weather simulation gave much higher average annual rainfall, resulting in higher water balance components. Both weather simulations gave similar annual crop yields in the four administrative zones. Overall the simulation with the conventional weather performed better than the CFSR weather. However, in data‐scarce regions such as remote parts of the Upper Blue Nile basin, CFSR weather could be a valuable option for hydrological predictions where conventional gauges are not available.

DOI

[5]
Fuka D R, Walter M T, MacAlister Cet al., 2014. Using the Climate Forecast System Reanalysis as weather input data for watershed models.Hydrological Processes, 28(22): 5613-5623.Obtaining representative meteorological data for watershed-scale hydrological modelling can be difficult and time consuming. Land-based weather stations do not always adequately represent the weather occurring over a watershed, because they can be far from the watershed of interest and can have gaps in their data series, or recent data are not available. This study presents a method for using the Climate Forecast System Reanalysis (CFSR) global meteorological dataset to obtain historical weather data and demonstrates the application to modelling five watersheds representing different hydroclimate regimes. CFSR data are available globally for each hour since 1979 at a 38-km resolution. Results show that utilizing the CFSR precipitation and temperature data to force a watershed model provides stream discharge simulations that are as good as or better than models forced using traditional weather gauging stations, especially when stations are more than 10km from the watershed. These results further demonstrate that adding CFSR data to the suite of watershed modelling tools provides new opportunities for meeting the challenges of modelling un-gauged watersheds and advancing real-time hydrological modelling. Copyright (C) 2013 John Wiley & Sons, Ltd.

DOI

[6]
Gupta H V, Sorooshian S, Yapo P O, 1999. Status of automatic calibration for hydrologic models: Comparison with multilevel expert calibration.Journal of Hydrologic Engineering, 4(2): 135-143.The usefulness of a hydrologic model depends on how well the model is calibrated. Therefore, the calibration procedure must be conducted carefully to maximize the reliability of the model. In general, manual procedures for calibration can be extremely time-consuming and frustrating, and this has been a major factor inhibiting the widespread use of the more sophisticated and complex hydrologic models. A global optimization algorithm entitled shuffled complex evolution recently was developed that has proved to be consistent, effective, and efficient in locating the globally optimal model parameters of a hydrologic model. In this paper, the capability of the shuffled complex evolution automatic procedure is compared with the interactive multilevel calibration multistage semiautomated method developed for calibration of the Sacramento soil moisture accounting streamflow forecasting model of the U.S. National Weather Service. The results suggest that the state-of-the-art in automatic calibration now can be expected to perform with a level of skill approaching that of a well-trained hydrologist. This enables the hydrologist to take advantage of the power of automated methods to obtain good parameter estimates that are consistent with the historical data and to then use personal judgment to refine these estimates and account for other factors and knowledge not incorporated easily into the automated procedure. The analysis also suggests that simple split-sample testing of model performance is not capable of reliably indicating the existence of model divergence and that more robust performance evaluation criteria are needed.

DOI

[7]
Hu S, 2015. Simulation and prediction research of the ecohydrological process based on SWAT model in Beiluo River Basin [D]. Xi’an: Northwest University. (in Chinese)

[8]
Hu Y Z, Ni Y Y, Shao Het al., 2013. Applicability study of CFSR, ERA-Interim and MERRA precipitation estimates in Central Asia.Arid Land Geography, 36(4): 700-708. (in Chinese)In this paper,the applicability of three reanalysis precipitation datasets,CFSR,ERA-Interim and MERRA, in Central Asia was evaluated with the observed monthly precipitation data(OBS) during 1979-2011 from 162 meteorological stations by the correlation analysis,t test and the method of least squares.Accuracies of the reanalysis datasets were quantified with mean bias error(MBE),correlation coefficient(R),mean absolute error(MAE) and root mean square error(RMSE).In addition,the variations of the three reanalysis precipitation accuracies at different months and altitudes are analyzed.The results suggest as follows:(1) All the three reanalysis datasets tend to overestimate the OBS precipitation.However,there exist obvious differences of the simulation results between CFSR,ERA-Interim and MERRA.For each reanalysis data,MERRA precipitation agrees most closely with OBS(R= 0.53,MBE= 5.12 mm) than CFSR and ERA-Interim,the following is ERA-Interim with(R= 0.53, MBE= 17.75 mm) and the worst is CFSR with(R= 0.50,AE= 27.04 mm) although all of them significantly correlated with the OBS precipitations(p 0.05).This may be affected by the scarcity and uneven distribution of the meteorological stations,the complex topography in Central Asia.Furthermore,different assimilation techniques,data sources and models used in different reanalysis datasets can also cause the different simulation results.(2) CFSR, ERA-Interim and MERRA have the consistency trend in monthly precipitation change.Comparing with the OBS precipitation,the biggest magnitude overestimates appear in March and April for the three reanalysis datasets.While the smallest magnitude overestimates appear in August,September and October.The precipitation differences between the three reanalysis datasets indicate that CFSR precipitation values are bigger than ERA-Interim from January to May and from October to December with the average difference 16.33 mm,while smaller than ERA-Interim in the other months.The precipitation differences between CFSR and MERRA are positive for all the months during the year,and the corresponding average difference is higher than 21.9 mm.All the monthly precipitations for ERA-Interim are bigger than MERRA,and the biggest differences reach to 24 mm in May,June and July.(3) For the three reanalysis datasets,the best precipitation accuracy appears in 500-1 000 m ranges.When the altitude is over 1 000 m, the precipitation accuracy is decreasing following the altitude increasing which shows that the simulation results of the three reanalysis are poor at high altitudes.From the above analysis,it was found that although there exists some uncertainties for the three reanalysis simulation results at different months and areas in Central Asia,the sufficient evidences show that the result from MERRA matching the OBS precipitation data is better than that from CFSR and ERA-Interim.Therefore,MERRA precipitation data can be used to study the precipitation spatial and temporal patterns in Central Asia.The results of the applicability study between the three reanalysis datasets and OBS can provide theory and technology for the rectifying of the three reanalysis datasets.

[9]
Lai Z Q, Li S, Li C Get al., 2013. Improvement and applications of SWAT model in the upper-middle Heihe River Basin.Journal of Natural Resources, 28(8): 1404-1413. (in Chinese)Heihe river basin (HRB) is the second largest inland river basin in China, and it also is a typical water shortage region. In this study, the Soil and Water Assessment Tool (SWAT) model is applied to simulate the monthly average runoff in the upper and middle reaches of HRB from 2000 to 2009. The results show that the SWAT model can simulate the runoff processes well in the upper reaches of HRB. The Nash-Sutcliffe coefficient (<em>ENS</em>) and coefficient of determination (<em>R</em><sup>2</sup>) during the calibration period of 2005 to 2009 were 0.81 and 0.85, respectively. But the monthly runoff in the middle reaches of HRB was underestimated in winter. The complex topography and high intensity repeated groundwater irrigation-infiltration-replenishment in the middle reaches of HRB are suggested to be the primary cause. Based on the analyses of hydrological situation in middle reaches of HRB, a empirical method was proposed to simulate the runoff process by increasing the soil water infiltration of the SWAT model. The Nash-Sutcliffe coefficient (<em>ENS</em>) and the coefficient of determination (<em>R</em><sup>2</sup>) of monthly average runoff simulation for middle reach of HRB during the calibration period increased from 0.53 to 0.70 and 0.61 to 0.75 after the modification of the SWAT model. The results indicated that the simulation of the irrigation processes was important to study the water resource management and the water cycle processes in the middle reaches of HRB.

DOI

[10]
Liu C M, Xia J, Guo S Let al., 2004. Advances in distributed hydrological modeling in the Yellow River basin.Advances in Water Science, 15(4): 495-500. (in Chinese)The recent advances in distributed hydrological modeling in the Yellow River basin are reviewed in this paper.The purpose of this study is to develop distributed hydrological models for the Yellow River basin,which is part of the National Key Project "Water Resources Evolution Law and Renewability Maintaining Mechanism"(also simplified as Yellow River "973" project,G19990436). The discussion involvs the framework of distributed hydrological models and the related technological tools such as DEM,GIS and RS. Furthermore,the advances in distributed hydrological modeling are also described and some proposals for further study on hydrological modeling are discussed.

DOI

[11]
Liu G H, Luan Z Q, Yan B Xet al., 2014. Runoff simulation for marsh rivers in Sanjiang Plain based on SWAT model.Journal of China Hydrology, 34(1): 46-51. (in Chinese)Surface hydrology has changed significantly in the marsh rivers of the Sanjiang Plain which plays an important role in guaranteeing the security of the China food supply. The soil and water assessment tool(SWAT) was used to simulate discharge of the upper Naolihe River watershed, the satisfying simulation results indicating the applicability of the model to marshy rivers. Because of no or sparse hydro-meteoro-logical data in a number of basins of marshy rivers, the calibrated SWAT model was applied to the Qixinghe River watershed according to mod-el parameters transplantation method. The Nash-Sutcliffe model efficiency(NS), coefficient of determination(R2) and Percent bias(PBIAS) for annual flow were 0.92, 0.96,-0.05 for calibration periods and 0.96, 0.97,-0.18 for validation periods, respectively, suggesting that the SWAT model could be applied to this basin.

[12]
Moriasi D N, Arnold J G, Liew M W Vet al., 2007. Model evaluation guidelines for systematic quantification of accuracy in watershed simulations.Transactions of the ASABE, 50(3): 885-900.This study makes recommendations for watershed model validation criteria for streamflow, sediment, and nutrients based on up-to-date model performance criteria review and a review of papers which recommend model validation criteria for hydrologic models and important considerations in selecting model validation criteria. In addition, the study recommends general suitable guideline value ranges for the selected criteria based on reported model validation guidelines for the selected quantitative criteria, reported values for recommended quantitative criteria for validation of selected models, and important considerations [especially measured data uncertainty] in selecting suitable model validation guidelines. Factors are discussed that can be used to justify making the guidelines more or less strict.

DOI

[13]
Nash J E, Sutcliffe J V, 1970. River flow forecasting through conceptual models (Part 1): A discussion of principles.Journal of Hydrology, 10(3): 282-290.The principles governing the application of the conceptual model technique to river flow forecasting are discussed. The necessity for a systematic approach to the development and testing of the model is explained and some preliminary ideas suggested.

DOI

[14]
Rouholahnejad E, Abbaspour K C, Srinivasan Ret al., 2014. Water resources of the Black Sea Basin at high spatial and temporal resolution.Water Resources Research, 50(7): 5866-5885.The pressure on water resources, deteriorating water quality, and uncertainties associated with the climate change create an environment of conflict in large and complex river system. The Black Sea Basin (BSB), in particular, suffers from ecological unsustainability and inadequate resource management leading to severe environmental, social, and economical problems. To better tackle the future challenges, we used the Soil and Water Assessment Tool (SWAT) to model the hydrology of the BSB coupling water quantity, water quality, and crop yield components. The hydrological model of the BSB was calibrated and validated considering sensitivity and uncertainty analysis. River discharges, nitrate loads, and crop yields were used to calibrate the model. Employing grid technology improved calibration computation time by more than an order of magnitude. We calculated components of water resources such as river discharge, infiltration, aquifer recharge, soil moisture, and actual and potential evapotranspiration. Furthermore, available water resources were calculated at subbasin spatial and monthly temporal levels. Within this framework, a comprehensive database of the BSB was created to fill the existing gaps in water resources data in the region. In this paper, we discuss the challenges of building a large-scale model in fine spatial and temporal detail. This study provides the basis for further research on the impacts of climate and land use change on water resources in the BSB.

DOI

[15]
Sharp E, Dodds P, Barrett Met al., 2015. Evaluating the accuracy of CFSR reanalysis hourly wind speed forecasts for the UK, using in situ measurements and geographical information.Renewable Energy, 77: 527-538.61CFSR wind speed is compared to onshore and offshore in situ measurements.61The effect of elevation, land use and wind speed on correlation is described.61CFSR is as accurate as any other raw reanalysis dataset that has been evaluated.61CFSR wind speeds are less accurate at high elevation locations.61CFSR wind speed data represents the conditions over diverse land uses well.

DOI

[16]
Tang W, Lin Z H, Yang C Get al., 2014. Evaluation of a hydrological simulation over the Huaihe River basin using the coupled land surface and hydrologic model system and its uncertainty analysis.Climatic and Environmental Research, 19(4): 463-476. (in Chinese)

DOI

[17]
Troin M, Caya D, Velázquez J Aet al., 2015. Hydrological response to dynamical downscaling of climate model outputs: A case study for western and eastern snowmelt-dominated Canada catchments.Journal of Hydrology Regional Studies, 4: 595-610.An analysis of hydrological response to a dynamically downscaled multi-member multi-model global climate model (GCM) ensemble of simulations based on the Canadian Regional Climate Model (CRCM) is presented for three snowmelt-dominated basins in Canada. The basins are situated in the western mountainous (British Columbia) and eastern level (Quebec) regions in Canada, providing comprehensive experiments to validate the CRCM over various topographic features. The evaluation of the CRCM as a tool to improve GCM simulations of catchment scale hydrology is investigated within the bounds of uncertainty associated with RCM simulations. Daily climate variables were extracted from a 30-year CRCM and GCM ensemble simulations. The hydrological response was assessed through the comparison of catchment water components simulated by SWAT. Results show that the CRCM captures the primary features of observed climate, but there are significant biases. Most noteworthy are a positive bias in precipitation and a negative bias in temperature over the BC basin. When looking at the hydrological modeling results, the benefit of using the RCMversusGCMs emerged distinctly for the mountainous BC basin where the RCM is preferred over the GCMs. The sensitivity experiments show that uncertainty in the GCM/RCM internal variability must be assessed to provide suitable regional hydrological responses to climate change.

DOI

[18]
Wang L, Chen X W, 2008. Simulation of hydrological effects on vegetation restoration of degraded mountain ecosystem with SWAT model.Journal of Mountain Science, 26(1): 71-75. (in Chinese)

DOI

[19]
Wang Z G, Liu C M, Huang Y B, 2003. The theory of SWAT model and its application in Heihe Basin.Progress in Geography, 22(1): 79-86. (in Chinese)SWAT (Soil and Water Assessment Tool) model is a river basin, or watershed, scale model developed to predict the impact of land management practices on water, sediment, and agricultural chemical yields in large, complex watersheds with varying soils, land use, and management conditions over long periods of timeThe model is physically based and enables users to study long term impacts This paper mainly introduces and discusses the issues of the hydrological theory, the structure and functions of SWAT modelSWAT separates the hydrology of a watershed into two major divisionsThe first division is the land phase of the hydrologic cycle which controls the loadings to the main channel in each subbasinThe second division is the water or routing phase of the hydrologic cycle which can be defined as the movement of water, sediments, etcthrough the channel network of the watershed to the outletSWAT uses a command structure for routing runoff and chemicals through a watershedUsing a routing command language, the model can simulate a basin subdivided into grid cells or subbasin In case study, SWAT model was used to simulate the hydrology of Heihe (Yingluo Valley) Basin in the cold Northwest ChinaFirst, Based on DEM, Heihe (Yingluo Valley) Basin was subdivided into four subbasinsBy building user soil type database and modifying land use coding, the model made a good runoff simulation result on a daily time step,and the model NSE (Nash Sutcliffe error judge standard) is up to 083So.

DOI

[20]
Ward E, Buytaert W, Peaver Let al., 2011. Evaluation of precipitation products over complex mountainous terrain: A water resources perspective.Advances in Water Resources, 34(10): 1222-1231.The availability of in situ measurements of precipitation in remote locations is limited. As a result, the use of satellite measurements of precipitation is attractive for water resources management. Combined precipitation products that rely partially or entirely on satellite measurements are becoming increasingly available. However, these products have several weaknesses, for example their failure to capture certain types of precipitation, limited accuracy and limited spatial and temporal resolution. This paper evaluates the usefulness of several commonly used precipitation products over data scarce, complex mountainous terrain from a water resources perspective. Spatially averaged precipitation time series were generated or obtained for 16 sub-basins of the Paute river basin in the Ecuadorian Andes and 13 sub-basins of the Baker river basin in Chilean Patagonia. Precipitation time series were generated using the European Centre for Medium Weather Range Forecasting (ECMWF) 40 year reanalysis (ERA-40) and the subsequent ERA-interim products, and the National Centers for Environmental Prediction/National Center for Atmospheric Research reanalysis dataset 1 (NCEP R1) hindcast products, as well as precipitation estimation from Remotely Sensed Information using Artificial Neural Networks (PERSIANN). The Tropical Rainfall Measurement Mission (TRMM) 3B42 is also used for the Ecuadorian Andes. These datasets were compared to both spatially averaged gauged precipitation and river discharge. In general, the time series of the remotely sensed and hindcast products show a low correlation with locally observed precipitation data. Large biases are also observed between the different products. Hydrological verification based on river flows reveals that water balance errors can be extremely high for all evaluated products, including interpolated local data, in basins smaller than 1000 km(2). The observations are consistent over the two study regions despite very different climatic settings and hydrological processes, which is encouraging for extrapolation to other mountainous regions. (C) 2011 Elsevier Ltd. All rights reserved.

DOI

[21]
Worqlul A W, Maathuis B, Adem A Aet al., 2014. Comparison of rainfall estimations by TRMM 3B42, MPEG and CFSR with ground-observed data for the Lake Tana basin in Ethiopia.Hydrology & Earth System Sciences, 18(18): 4871-4881.Planning for drought relief and floods in developing countries is greatly hampered by the lack of a sufficiently dense network of weather stations measuring precipitation. In this paper, we test the utility of three satellite products to augment the ground-based precipitation measurement to provide improved spatial estimates of rainfall. The three products are the Tropical Rainfall Measuring Mission (TRMM) product (3B42), Multi-Sensor Precipitation Estimate-Geostationary (MPEG) and the Climate Forecast System Reanalysis (CFSR). The accuracy of the three products is tested in the Lake Tana basin in Ethiopia, where 38 weather stations were available in 2010 with a full record of daily precipitation amounts. Daily gridded satellite-based rainfall estimates were compared to (1) point-observed ground rainfall and (2) areal rainfall in the major river sub-basins of Lake Tana. The result shows that the MPEG and CFSR satellites provided the most accurate rainfall estimates. On average, for 38 stations, 78 and 86% of the observed rainfall variation is explained by MPEG and CFSR data, respectively, while TRMM explained only 17% of the variation. Similarly, the areal comparison indicated a better performance for both MPEG and CFSR data in capturing the pattern and amount of rainfall. MPEG and CFSR also have a lower root mean square error (RMSE) compared to the TRMM 3B42 satellite rainfall. The bias indicated that TRMM 3B42 was, on average, unbiased, whereas MPEG consistently underestimated the observed rainfall. CFSR often produced large overestimates.

DOI

[22]
Xiang H, Zhang F, Jiang Jet al., 2014. Analysis of global cloud amount over the past 30 years based on CFSR data.Meteorological Monthly, 40(5): 555-561. (in Chinese)

DOI

[23]
Xu S Q, Chen J, Song R G, 2010. The application study of NCEP reanalysis data. Journal of Qingdao University (Natural Science Edition), 23(3): 38-41. (in Chinese)

[24]
Ye B S, Yang D Q, Ding Y Jet al., 2007. A bias-corrected precipitation climatology for China.Acta Geographica Sinica, 62(1): 3-13. (in Chinese)lt;p>This paper presents the results of bias corrections of Chinese standard precipitation gauge (CSPG) measurements for wind-induced undercatch, trace amount of precipitation and wetting loss. Long-term daily data of precipitation, temperature, and wind speed during 1951-2004 at 726 meteorological stations in China were used for this analysis. It is found that wind-induced gauge undercatch is the greatest error in most regions, and wetting loss and trace amount of precipitation are important in the low precipitation regions in Northwest China. Monthly correction factors (corrected/measured precipitation) differ by location and by type of precipitation. Considerable inter-annual variation of the corrections exists in China due to the fluctuations of wind speed and frequency of precipitation. More importantly, annual precipitation has been increased by 8 to 740 mm with an overall mean of 125 mm at the 726 stations over China due to the bias corrections for the study period. This corresponds to 5% -72% increases (overall mean of 18% at the 726 stations over China) in gauge-measured yearly total precipitation over China. This important finding clearly suggests that annual precipitation in China is much higher than previously reported. The results of this study will be useful to hydrological and climatic studies in China.</p>

DOI

[25]
Yu Y M, Mu Z X, 2015. Applicability of CFSR data in runoff simulation of cold highland area.Journal of Irrigation and Drainage, 34(11): 93-97. (in Chinese)With western Tianshan mountains as study area,the applicability of CFSR rainfall data was discussed in cold highland area.Using the actual measured average precipitation in 2005 which had complete data in the study area as the benchmark,the average precipitation in 2005 with same time frequency of SWAT's official website was selected,in order to analyse the actual website precipitation data in 2005 and calculate the error ratio between two kinds of data,and the ratio was used to correct CFSR data and simulate the runoff with the before and after amending data respectively.The results showed that the average annual rainfall of the CFSR data were too large or too small,and had a big deviation compared with the monitoring station site;The precipitation data before amending had a big deviation with measured data,which caused the increase of runoff data,the peak value was very high,and NSEand RE were lower;the precipitation data after amending could react the measured data and had a good simulation results.The rainfall data after amending could be applied in the study area.

DOI

[26]
Zhao H G,Yang S T,Wang Z Wet al., 2015. Evaluating the suitability of TRMM satellite rainfall data for hydrological simulation using a distributed hydrological model in the Weihe River catchment in China.Journal of Geographical Sciences, 25(2): 177-195.The objective of this study is to quantitatively evaluate Tropical Rainfall Measuring Mission(TRMM) data with rain gauge data and further to use this TRMM data to drive a Distributed Time-Variant Gain Model(DTVGM) to perform hydrological simulations in the semi-humid Weihe River catchment in China.Before the simulations,a comparison with a10-year(2001-2010)daily rain gauge data set reveals that,at daily time step,TRMM rainfall data are better at capturing rain occurrence and mean values than rainfall extremes.On a monthly time scale,good linear relationships between TRMM and rain gauge rainfall data are found,with determination coefficients R~2 varying between 0.78 and 0.89 for the individual stations.Subsequent simulation results of seven years(2001-2007)of data on daily hydrological processes confirm that the DTVGM when calibrated by rain gauge data performs better than when calibrated by TRMM data,but the performance of the simulation driven by TRMM data is better than that driven by gauge data on a monthly time scale.The results thus suggest that TRMM rainfall data are more suitable for monthly streamflow simulation in the study area,and that,when the effects of recalibration and the results for water balance components are also taken into account,the TRMM 3B42-V7 product has the potential to perform well in similar basins.

DOI

[27]
Zhao T B, Fu C B, Ke Z Jet al., 2010. Global atmosphere reanalysis datasets: Current status and recent advances. Advances in Earth Science, 25(3): 242-254. (in Chinese)During the last decades,the reanalysis of past meteorological observations using modern data assimilation technique and the restructuring of the long-term and consistent gridded data products have made great progress.Such datasets provide us with the most primary research tools to identify the state and evolution of atmosphere,and understand the climate change and variability at different spatial-temporal scales.In this paper,the current research status and advances in the global reanalysis datasets including some of international global atmosphere reanalysis projects and the corresponding reanalyzed products,the important applications of reanalyzed products in some research fields of the atmospheric science,the validation and evaluation of the reanalysis datasets,and some quality problems represented by the reanalyzed products in climate change studies are systematically reviewed.Moreover,the prospects of the studies of atmospheric reanalysis in the future are also discussed in this paper.

DOI

[28]
Zhou Z B, Wang H, Jia Y Wet al., 2005. Temporal downscaling daily precipitation in lack-data watershed: A case study in Yellow River.Resources Science, 27(1): 92-96. (in Chinese)

DOI

Outlines

/