Research Articles

Similarities and differences of city-size distributions
in three main urban agglomerations of China
from 1992 to 2015: A comparative study based on nighttime light data

  • GAO Bin 1, 2 ,
  • HUANG Qingxu 1 ,
  • HE Chunyang 1 ,
  • DOU Yinyin 1, 3
Expand
  • 1. Center for Human-Environment System Sustainability (CHESS), State Key Laboratory of Earth Surface Processes and Resource Ecology (ESPRE), Beijing Normal University, Beijing 100875, China
  • 2. College of Resources Science & Technology, Beijing Normal University, Beijing 100875, China
  • 3. Academy of Disaster Reduction and Emergency Management, Beijing Normal University, Beijing 100875, China;
*Corresponding author: He Chunyang, Professor, specialized in urban sustainability and landscape sustainability. E-mail:
† These authors contributed equally to this work and are co-first authors.

Received date: 2016-07-14

  Accepted date: 2016-10-13

  Online published: 2017-05-10

Supported by

National Natural Science Foundation of China, No.41621061, No.41501092

Talents Training Program from the Beijing Municipal Commission of Education No.201500002012G058

Copyright

Journal of Geographical Sciences, All Rights Reserved

Abstract

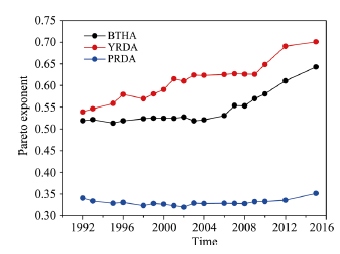
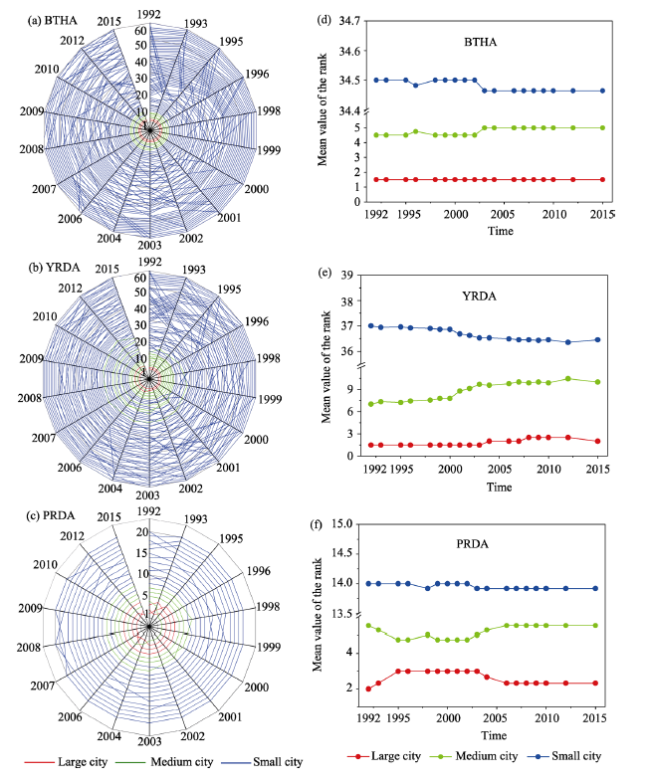
Comparing the city-size distribution at the urban agglomeration (UA) scale is important for understanding the processes of urban development. However, comparative studies of city-size distribution among China’s three largest UAs, the Beijing-Tianjin-Hebei agglomeration (BTHA), the Yangtze River Delta agglomeration (YRDA), and the Pearl River Delta agglomeration (PRDA), remain inadequate due to the limitation of data availability. Therefore, using urban data derived from time-series nighttime light data, the common characteristics and distinctive features of city-size distribution among the three UAs from 1992 to 2015 were compared by the Pareto regression and the rank clock method. We identified two common features. First, the city-size distribution became more even. The Pareto exponents increased by 0.17, 0.12, and 0.01 in the YRDA, BTHA, and PRDA, respectively. Second, the average ranks of small cities ascended, being 0.55, 0.08 and 0.04 in the three UAs, respectively. However, the average ranks of large and medium cities in the three UAs experienced different trajectories, which are closely related to the similarities and differences in the driving forces for the development of UAs. Place-based measures are encouraged to promote a coordinated development among cities of differing sizes in the three UAs.

Cite this article

GAO Bin , HUANG Qingxu , HE Chunyang , DOU Yinyin . Similarities and differences of city-size distributions
in three main urban agglomerations of China
from 1992 to 2015: A comparative study based on nighttime light data[J]. Journal of Geographical Sciences, 2017
, 27(5) : 533 -545 . DOI: 10.1007/s11442-017-1391-7

1 Introduction

City-size distribution has attracted long-term interests from researchers as it plays important roles in understanding the evolution of city sizes in an urban system and further optimizing the city sizes. According to previous studies, the size of cities in an urban system tends to follow a Pareto distribution (Batty, 2006; Gabaix et al., 2004; Soo, 2014; Xu and Zhu, 2009; Anderson and Ge, 2005; Bosker et al., 1999; Giesen and Sudekum, 2011; Tan et al., 2014; Ye and Xie, 2012). In an urban agglomeration (UA), cities have close spatial, economic and communication connections with each other (Fang, 2015). The city-size distribution in a specific UA also follows the Pareto distribution (Duan et al., 2009; Lu et al., 2014; Sheng et al., 2014; Tan et al., 2014). However, the evolution of city-size distribution may vary over time among different UAs (Henderson and Venables, 2009; Xu and Zhu, 2009). Therefore, comparing the dynamics of city-size distribution among UAs might enrich our understanding of similarities and differences in this complex process.
The Beijing-Tianjin-Hebei agglomeration (BTHA), the Yangtze River Delta agglomeration (YRDA), and the Pearl River Delta agglomeration (PRDA) are the three largest UAs in China. During the last two decades, these three UAs played a leading role in the process of urbanization in China (Fang, 2015). They have experienced unprecedented and rapid urban development during the last 20 years. Specifically, the urban population increased from 14.1, 23.7, and 10.8 million in 1990 to 51.9, 74.3 and 46.4 million in 2010 in the BTHA, YRDA and PRDA, respectively (PCO, 1992, 2012). The GDP increased from 740, 1424 and 659 billion to 3969, 7003 and 3767 billion RMB yuan, respectively, in the three UAs (NBS, 1991, 2011). Currently, these three UAs occupy approximately 3% of the total land but account for 18% of the total population and 36% of the total GDP in China (CPG, 2014). More importantly, the New-type Urbanization Plan released by the Chinese government aimed to accelerate the development speeds of these UAs and develop them into world-class UAs (CPG, 2014). The new plan also emphasized a coordinated development of city size and city function in a UA. Therefore, a timely and accurate examination of city-size dynamics is necessary to generate development strategies for the three UAs.
Several recent studies explored the city-size distribution in these three UAs. For example, Sun and Lu (2014) evaluated the city-size distribution in the BTHA between 1995 and 2010. Tian et al. (2011) monitored the city-size distribution in the PRDA between 1983 and 2003. Gu et al. (2008) examined the city-size distribution in the YRDA from 1994 to 2005. However, comparative studies of UAs are rare. Most previous studies have used the non- agricultural population as a proxy for city size, but due to massive population migration, the non-agricultural population may significantly underestimate the real urban population in cities, particularly in these three UAs, which absorb a large number of migrant workers in China (Fan, 1999; Shen, 1995; Xu and Zhu, 2009). In addition, previous studies have mainly used the Pareto regression method to monitor the overall trend of city-size distribution from the top down without identifying the underlying changes in city size and rank from the bottom up.
Measuring city size based on nighttime light data provides an effective and comparable means to examine city-size evolution consistently over time and space. Generally, there are two types of data to measure city size, the population (e.g., non-agricultural population) data and the urban area data. Researchers have found that the non-agricultural population may underestimate urban residents (Xu and Zhu, 2009), especially in large urban agglomerations that attracts a large number of migrant workers (Huang et al., 2016; Peng, 2011). In addition, the definition of non-agricultural population changed several times and may lead to incomparable results over time (Zhou and Ma, 2003). In comparison, the nighttime light data were collected by sensors with a consistent space platform and a continuous onboard design. These data provide an alternative data source to non-agricultural population data to measure city size consistently and objectively (Elvidge et al., 2009; Huang et al., 2014). Several studies have adopted city size measured by nighttime stable light (NSL) data successfully to evaluate city-size evolution in China (Huang et al., 2015; Small et al., 2011; Small and Elvidge, 2013; Wu et al., 2014). In addition, the rank clock method can explore the city-size distribution of a UA from the perspective of an individual city’s rank changes (Batty, 2006). Combining the traditional Pareto regression with the rank clock method would facilitate the elucidation of the process of city-size distribution at both the aggregated and city levels (Huang et al., 2015).
Our objective was to compare the dynamics of city-size evolution among the three UAs (i.e., the BTHA, the YRDA, and the PRDA) from 1992 to 2015. First, we explored the city-size distribution in the three UAs at the regional level based on the Pareto regression. Second, we examined the city rank dynamics among the three UAs for individual cities using the rank clock method. Finally, we discuss the potential reasons for the differences in city-size distributions among the three UAs qualitatively and provide corresponding policy suggestions.

2 Study area and data

2.1 Study area

We focused on the top three urban agglomerations in China, i.e., the BTHA, YRDA, and PRDA (Figure 1). The BTHA consists of 105 cities with a total area of 18.01 × 10⁴ km2 (Table 1). In 2010, the total population in the BTHA was approximately 83.78 million, and the proportion of urban residents was nearly 60% (PCO, 2014). Beijing and Tianjin are the two core cities. The development target for the BTHA is to be the most innovative UA in China (Fang and Yu, 2016).
There are 75 cities in the YRDA, which has a total area of approximately 10.75 × 10⁴ km2 (Table 1). In 2010, the total population of this UA was nearly 107 million, including an urban population of 74.55 million (70%). Currently, Shanghai is the core city of this UA (Fang and Yu, 2016). In the future, the YRDA aims to be a world-class region and the most competitive UA in China (Fang and Yu, 2016).
The PRDA encompasses 27 cities with a total area of 5.41 × 10⁴ km2 (Table 1). In 2010, approximately 56 million people were living in this UA. More than 82% of the total population are urban residents (Table 1). The PRDA was the pioneer of China’s economic reform and opening-up policy (Fang and Yu, 2016).

2.2 Data

In this study, we used three types of data: urban area, administrative boundaries and auxiliary data. The urban area data in China from 1992 to 2015 were produced by He et al. (2014) and Xu et al. (2016). The urban area in this dataset was extracted using NSL data, the normalized difference vegetation index (NDVI), the land surface temperature (LST), and the support vector machine classification method. The data have a spatial resolution of 1 km. The urban area data were validated by the results extracted from the Landsat TM/ETM+ images in a number of cities in China for 1995, 2000, 2005, 2012 and 2015. The average Kappa and average overall accuracy of the data are greater than 0.60 and 92.6%, respectively. The average quantity disagreement and average allocation disagreement of data are below 2.3% and 5.9%, respectively. More details on the validation process can be found in He et al. (2014) and Xu et al. (2016). Based on the dataset, the time-series urban areas from 1992 to 2015 in the three UAs were extracted to evaluate the city-size evolution.
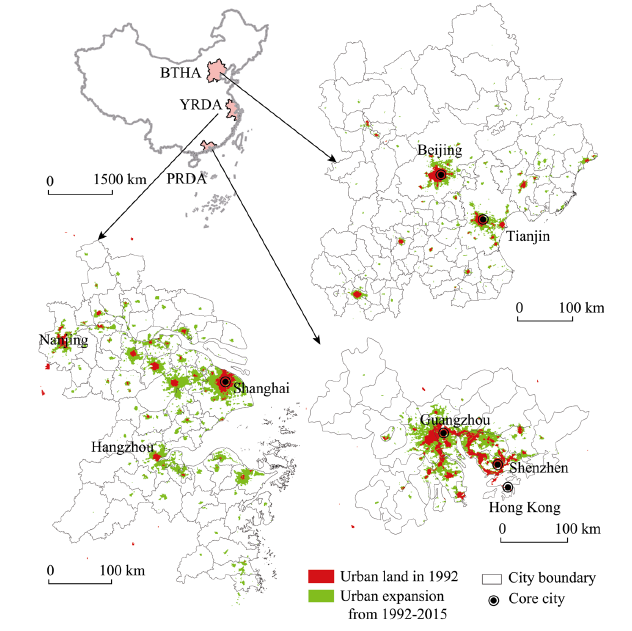
Figure 1 Urban expansion in China between 1992 and 2015 ^Note: Urban agglomeration abbreviations: BTHA (Beijing-Tianjin-Hebei agglomeration), YRDA (Yangtze River Delta agglomeration), and PRDA (Pearl River Delta agglomeration)
Table 1 Comparison of socioeconomic status among the three urban agglomerations in 2010
Urban
agglomeration
Area
(× 104 km2)
Number of cities Current core
cities
Total
population (million)
Percentage of
urban population (%)
GDP per capita (×104 yuan)
BTHA 18.20 105 Beijing, Tianjin 83.78 59.95 4.73
YRDA 10.75 75 Shanghai 106.51 69.75 6.58
PRDA 5.41 27 Guangzhou,
Shenzhen,
Hong Kong
56.13 82.72 6.71
The administrative boundaries of the cities were obtained as Geographical Information System (GIS) files at a scale of 1:4,000,000 from the National Geomatics Center of China. For the auxiliary data, China’s land use/cover datasets (NLCDs) for 1990 and 2010 with a spatial resolution of 1 km were obtained from the Data Sharing Infrastructure of the Earth System Science at the Chinese Academy of Sciences. The NLCDs were produced based on the visual interpretation of Landsat images at a spatial resolution of 30 m (Liu et al., 2014). The datasets were used to validate the results.

3 Methods

In this study, we used both the Pareto regression and the rank clock method to examine the city-size distribution in the three UAs. The two methods are complementary and the results can exhibit a whole picture of city-size distribution at the UA level as well as the city level.

3.1 Examining regional city-size distribution based on the Pareto regression

The regional city-size evolution was examined based on the Pareto regression method. This method was first proposed by Felix Auerbach, a German physicist, in 1913 (Xu and Zhu, 2009). It can be used to evaluate the distribution of city sizes (Eaton and Eckstein, 1997; Rosen and Resnick, 1980). The Pareto regression can be described as follows:
where Si refers to the size of city i (in this study, it is measured by the total urban land of a particular city). A refers to the size of the largest city. Ri refers to the number of cities with sizes no less than Si. α represents the Pareto exponent (Li and Sui, 2013). The value of α ranges from 0 to positive infinity. To examine the city-size evolution over time or across countries empirically, the following formula is often used to compute the Pareto exponent (Soo, 2014; Ye and Xie, 2012):
where u is the error term. A larger α suggests that the city-size distribution is more even, and vice versa (Xu and Zhu, 2009).

3.2 Analyzing the city rank dynamics based on the rank clock method

The rank changes among cities of different sizes were compared using the rank clock method. This method was first proposed by Batty (2006). In this method, a round disk is adopted to show the trajectories of individual cities’ rank changes clockwise within a specific time period. The rank decreases from the center to the circumference. The circumference is divided into equal shares to correspond with the time interval. Turbulent changes in city rank over time can be identified visually and quantitatively using this method.
Based on this method, we calculated the mean value of the absolute rank shift (ARS, see equation 3) of all cities in each UA to compare the city-level rank fluctuations among the three UAs:
where ARSi is the absolute rank shift of city i in a particular UA and Ri,t represents the rank of city i at year t. ARS measures the rank shift in terms of the absolute value and thus implies the magnitude of rank fluctuations during a particular period.
To further compare the differences in rank changes among the three UAs, we divided the cities within each UA into three categories according to city size and compared the changes in the average ranks of the cities over time (see equation 4).
where Rs is the average rank of cities of s type (in this study, there were three types: small city, medium city and large city). n represents the number of cities of s type.
The cities in each UA were categorized as large, medium and small. Unlike the division based on population or urban population, there were no common criteria for categorizing city sizes by the extent of urban area. In addition, using absolute values for the division may lead to conflicting results among the three UAs. For example, using the extent of urban land in Shijiazhuang to distinguish large and medium cities in the BTHA may lead to no large city in the PRDA. Therefore, we adopted a method that not only considers the power-law distribution of city sizes in a UA, but also guarantees the consistency and comparability of criteria among the three UAs. Specifically, all cities of a UA were ranked by their sizes (i.e., extent of urban area) in 1992 in a descending order. Large cities accounted for approximately 50% of the total urban areas in each UA. Medium and small cities accounted for the remaining 40% and 10%, respectively. The final division agreed with common experience, i.e., the division by population.

4 Results

4.1 Similarities of city-size evolution in the three urban agglomerations

The city-size evolution exhibited two similar trends among all three UAs. First, in all three UAs, the city-size distributions became more even between 1992 and 2015 (Figure 2). Based on the Pareto regression, the largest increase in the estimated Pareto exponent occurred in the YRDA. The exponent increased from 0.53 in 1992 to 0.70 in 2015, with an annual average change of 0.007. By contrast, the smallest increase occurred in the PRDA. The increase in the Pareto exponent in the BTHA was 0.12, with an annual average change of 0.005.
Second, in all three UAs, the average rank of small cities exhibited a similar rising trend from 1992 to 2015 (Figures 3d, 3e and 3f). This finding indicates that the sizes of some small cities exceeded those of some medium cities in all three UAs. The rise in the average rank of small cities was the largest in the YRDA, followed by the PRDA and then the BTHA. Specifically, in the YRDA, the average rank of small cities rose from 37.00 to 36.45 because the ranks of four small cities, i.e., Kunshan, Jiangyin, Wujiang and Cixi, increased from 16, 12, 25 and 18 in 1992 to 8, 9, 10 and 11 in 2015, respectively. In BTHA, the average rank of small cities increased from 34.50 to 34.46, along with the rise in rank from 7 to 5 of Qinhuangdao. The average rank of small cities in the PRDA rose from 14.00 to 13.92 due to a rise in the rank of Jiangmen.
Figure 2 Temporal changes in the Pareto exponent among the three urban agglomerations from 1992 to 2015^Please refer to Figure 1 for an explanation of the abbreviations.
Figure 3 Comparison of rank fluctuations and the average rank for cities of differing sizes among the three urban agglomerations^Note: a-c: Rank clocks of individual cities within each urban agglomeration; d-f: Changes in the average ranks of cities of differing sizes

4.2 Differences of city-size evolution among the three urban agglomerations

The city-size evolution among the three UAs also exhibited two different trends. First, the city-rank fluctuations differed among the three UAs. The BTHA experienced the largest fluctuation, followed by the YRDA and then the PRDA. The mean values of absolute rank shift (ARS) were 42.35 in BTHA, 34.48 in the YRDA, and 4.60 in the PRDA. In the BTHA, Yutian had the largest rank fluctuation, with an ARS of 88. In the YRDA, Haimen exhibited the largest rank fluctuation, with an ARS of 74. In the PRDA, Taishan witnessed the largest rank fluctuation, with an ARS of 10.
Second, the medium and large cities exhibited distinct trajectories of ranks among the three UAs. In the BTHA, the average rank of large cities remained stable, whereas that of medium cities dropped. Specifically, the two large cities (i.e., Beijing and Tianjin) remained the top two locations, whereas the rank of a medium city (Baoding) fell from 5 to 7. By contrast, in the YRDA, the average ranks of both large and medium cities dropped. In this UA, the rank of a large city (Nanjing) was exceeded by those of two medium cities (Hangzhou and Suzhou), which resulted in the rank of Nanjing dropping from 2 to 4. Meanwhile, the ranks of four medium cities, Zhenjiang, Yangzhou, Nantong and Huzhou, were surpassed by some small cities, with the ranks of these cities dropping from 7, 8, 10 and 11 to 12, 19, 14 and 21, respectively. In contrast to the other two UAs, in the PRDA, the average rank of large cities dropped, whereas the average rank of medium cities did not change over time. In this UA, the rank of Shenzhen was surpassed by Dongguan and fell from 1 to 4. Overall, the average rank of medium cities remained stable.

5 Discussion

5.1 Nighttime light data provide an alternative measure for examining city-size distribution

Two approaches were used to validate the evolution of city-size distribution measured by the DMSP/OLS NSL dataset. The validation results confirmed that the distribution of city sizes can be measured by the NSL dataset objectively and consistently. First, the Pareto exponents estimated from the NSL dataset were compared to those extracted from the NLCDs during overlapping years (i.e., between 1990 and 2010). The Pareto exponents estimated from the two datasets displayed similar trends. Specifically, the Pareto exponents derived from the two datasets increased in the BTHA and the YRDA, whereas the estimated exponents decreased in the PRDA (Table 2). Second, the findings reported here were also in line with conclusions from previous studies. For instance, at the UA scale, previous studies have also found that the distribution of city sizes became more even in the BTHA (Wen and Thill, 2016) and the YRDA (Wang et al., 2016) but more concentrated in the PRDA (Li et al., 2007), respectively.
Table 2 Comparison of the Pareto exponents derived from various datasets
Region Time DMSP/OLS NSL dataset NLCDs
Pareto exponent R2 (%) Pareto exponent R2 (%)
BTHA 1990 0.52 83.12 0.71 95.61
2010 0.61 95.77 0.78 95.81
YRDA 1990 0.54 96.68 0.83 97.28
2010 0.69 95.28 0.90 96.84
PRDA 1990 0.34 87.59 0.49 85.62
2010 0.33 78.68 0.46 90.08

Note: DMSP/OLS NSL (Defense Meteorological Satellite Program/Operational Linescan System), NLCDs (National Land use/Cover Datasets)

5.2 The driving forces for city-size distribution among the three urban agglomerations

The key factors that affect the development of a UA include political effects, the spatial linkage of industries, transportation networks, market mechanisms, technological advancement and investment (Fang and Yu, 2016). Based on existing research, we observed that the dynamics of city-size distribution among the three UAs were closely related to the similarities and differences in the key factors driving the development of the three UAs (Table 3).
Table 3 Comparison of the major driving forces of city-size distribution dynamics among the three urban agglomerations
Region City-size distribution dynamics Major driving forces
Similarity Differences Similarity Differences
BTHA Pareto
exponent
increased,
indicating a more even distribution
Rank of large cities: Stable Rank of medium cities: Down Rank of small cities: Up Political
effects exerted
great impacts on city-size distribution, such as the stable rank of large cities in BTHA and the rising of small cities in YRDA and PRDA (Lu, and Fan 2010, Gu et al., 2008).
YRDA Rank of large cities: Down Rank of medium cities: Down Rank of small cities: Up Spatial linkage of industries encouraged the rising rank of small cities close to Shanghai
(Luo and Shen, 2009)
PRDA Rank of large cities: Down Rank of medium cities: Stable Rank of small cities: Up Investment and transportation encouraged the rising ranks of small cities close to Hong Kong (Yeh and Xu, 2010, 2013; Xu & Anthony, 2009)
The evolution of the city-size distribution in the three UAs was influenced by a similar driving force, political effects. In the BTHA, the ranks of two large cities (Beijing and Tianjin) were stable and held the top two places during the studied period. One major reason for this position is that, as the national capital and a municipality that is directly under the control of the central government, Beijing and Tianjin have policy advantages and significant agglomeration effects (Wen and Thill, 2013). To guarantee the development of Beijing and Tianjin, the central government demanded that medium and small cities in this UA provide low-cost minerals, industrial materials, fresh water, and agricultural products to the two core cities and imposed restrictions on resource development, energy use, and industrial development in these medium and small cities (Lu and Fan, 2010).
In the YRDA and PRDA, political advantages also exerted great influence on the rising ranks of small cities. Specifically, the local government offered a number of preferential policies on taxation and financing to promote the development of township enterprises in small cities (Gu et al., 2008). For example, in the YRDA, the development of township enterprises in certain small cities (e.g., Jiangyin, Kunshan and Wujiang) accelerated the increase in their city sizes, which exceeded the sizes of some medium cities (e.g., Nantong and Yangzhou). Similarly, in the PRDA, “rural urbanization” driven by the growth of township enterprises has made small cities hotspots of regional economic development and urban expansion.
There were also differences in the driving forces for the city-size distribution among the three UAs. In the BTHA, political effects play a dominant role, whereas other factors have little influence. In the other two UAs, other factors also influenced the evolution of city-size distribution. In the YRDA, the evolution of city-size distribution was also influenced by the spatial linkage of industries. We observed that the ranks of large cities and medium cities in the northwestern part of the YRDA fell, whereas the ranks of small cities in the southeastern part of the YRDA increased. This pattern is attributable to the weaker intensity of spatial linkages between Shanghai and northwest cities compared to the intensity of the linkages between Shanghai and the southeast cities (Luo and Shen, 2009). The cities closer to Shanghai (e.g., Kunshan, Cixi and Wujiang) had the advantage of accepting industrial transfers from Shanghai, and their ranks rose accordingly.
In contrast to the other two UAs, the investment and transportation network in the PRDA played an important role in shaping its city-size distribution (Jin et al., 2010). The ranks of small cities in the eastern part of the PRDA ascended, whereas the ranks of the medium cities in the west remained stable or declined. The differences in investment and transportation networks between small cities in the east and medium cities in the west might explain this phenomenon. Investments from Hong Kong are largely concentrated in the cities in the eastern part of the PRDA (Yeh and Xu, 2010), and the transportation network is less efficient and more expensive in the western part of the PRDA than the eastern part (Yeh and Xu, 2010). Therefore, the cities in the eastern part of this region (i.e., Dongguan and Huizhou) underwent rapid development, and their city-size ranks continued to rise.

5.3 Policy implications

Based on the analyses of the city-size evolution in each UA, we can advocate different measures to promote coordinated development among cities of different sizes. In the BTHA, accelerating the development of medium and small cities plays a key role in promoting the sustainable development of the urban system (Lu and Fan, 2010). Medium and small cities should take advantage of the “radiation effect” of Beijing and Tianjin to encourage the aggregation of population, capital, and industries. They should also optimize their industrial structure to promote the acceptance of industry transfers from Beijing and Tianjin. In the YRDA, attention should be paid to enhancing regional industrial coordinated development (Gu et al., 2008). The spatial linkage of industries between cities in the northwestern part of the YRDA (e.g., Nanjing, Yangzhou and Zhenjiang) and the core city (i.e., Shanghai) should be strengthened by enhancing the development of complementary industries. In addition, the radiation effect of Nanjing to its surrounding cities (e.g., Yangzhou, Nantong and Huzhou) (Luo and Shen, 2009) should be enhanced to increase the spatial linkage of industries in this region. In the PRDA, accelerating the development of the medium and small cities in the western part of the urban agglomeration should be the priority for policy makers (Tian et al., 2011). To achieve this goal, the transportation connections between these cities and Hong Kong must be improved via a number of measures, for instance, the construction of the “Hong Kong-Zhuhai-Macau Bridge.”

5.4 Future work

There are some uncertainties in our study. First, the accuracy of city size extraction can be affected by the inherent limitation of the spatial resolution of the DMSP/OLS NSL datasets (Liu et al., 2012). For example, the urban land of some cities failed to be extracted due to the low spatial resolution of 1 km, particularly in regions with weak nightlight (Liu et al., 2012). Additionally, the urban area might be overestimated due to the “overglow” effect in nighttime images, particularly for large cities that have a high level of light intensity. Both the underestimation and overestimation of urban land may affect the value of the Pareto exponent. Second, we only qualitatively analyzed the potential reasons for the differences of the city-size dynamics among the three UAs based upon previous research.
In the future, the release of Visible Infrared Imaging Radiometer Suite (VIIRS) nighttime light datasets with finer spectral and spatial resolutions (Shi et al., 2014), and newly developed method identifying the urban boundary (Peng et al., 2016) should permit more accurate extraction of urban areas than the results in this study. In addition, we could use quantitative statistical approaches, such as principal component analysis and/or spatially explicit regression models (Zeng et al., 2015; Peng et al., 2015), to perform an in-depth comparison of the driving forces that underlie the changes in city-size distribution among the three UAs by simultaneously considering political, socioeconomic, locational, and physical factors.

6 Conclusions

Nighttime light data provide an effective and accurate means to examine city-size distribution at the UA scale. The Pareto exponents estimated from the nighttime light dataset were consistent with those extracted from the NLCDs during the overlapped years between 1990 and 2010.
The city-size distributions of the three largest UAs in China shared similar trends. First, the distributions of city size became more even among the three UAs from 1992 to 2015. The Pareto exponents increased by 0.17, 0.12, and 0.01 in the YRDA, BTHA, and PRDA, respectively. Second, the average ranks of small cities rose in all three UAs. Meanwhile, the city-size distribution among the three UAs exhibited different degrees of rank fluctuation, especially for large and medium cities.
The evolution of city-size distribution among the three UAs was affected by a similar driving force, the influence of preferential policies. However, the city-size distributions in the YRDA and the PRDA were affected by additional factors, including the spatial linkage of industries, investment, and transportation networks. Thus, in order to develop a more coordinated UA following the New-type Urbanization Plan released by the Chinese government, place-based measures should be used to promote the coordinated development among cities of differing sizes in the three UAs in the future.

The authors have declared that no competing interests exist.

[1]
Anderson G, Ge Y, 2005. The size distribution of Chinese cities.Regional Science and Urban Economics, 35(6): 756-776.This paper uses urban data to investigate two important issues regarding city sizes in China, the relative growth of cities and the nature of the city size distribution. The manner in which cities of different sizes grow relative to each other is examined and, contrary to the common empirical finding that the relative size and rank of cities remains stable over time, it is found that the Economic Reforms and the One Child Policy since 1979 have delivered significant structural change in the Chinese urban system. The city size distribution remains stable before the reforms but exhibits a convergent growth pattern in the post-reform period. The theoretical literature on city sizes highlights a link between log normal and Pareto distributions for city sizes prompting the employment of Pearson goodness-of-fit tests to examine directly which theoretical distribution provides the best approximation to the empirical city size distribution. Contrary to the evidence for other countries, a log normal rather than Pareto specification turns out to be the preferred distribution.

DOI

[2]
Batty M, 2006. Rank clocks. Nature, 444(7119): 592-596.

[3]
Batty M, 2010. Visualizing space-time dynamics in scaling systems.Complexity, 16(2): 51-63.

[4]
Black D, Henderson V, 2003. Urban evolution in the USA.Journal of Economic Geography, 3: 343-372.On a sustained basis, cities are of non-uniform relative sizes. This paper addresses three basic issues which arise from this simple observation by examining the size distribution of US cities over the period 1900--1990. First, we explore the reasons why there is a wide distribution of city sizes. Second, we characterize the evolution of the size distribution of cities, documenting growth in sizes and numbers of cities. We ask whether the relative size distribution of cities has remained stable over time, or if it has displayed, instead, a tendency to collapse, flatten, or otherwise change its shape. We also examine evidence on whether the size distribution obeys Zipf's Law. Third, we examine the degree and determinants of mobility of individual cities within this distribution, asking to what extent cities are moving up and down in the distribution and how this movement is influenced by cities' geographic characteristics. We use a newly constructed data with consistent metropolitan area definitions over this century, discussing the issues and linking our results to the relevant literature. Copyright 2003, Oxford University Press.

DOI

[5]
Bosker M, Brakman S, Garretsen Het al., 2008. A century of shocks: The evolution of the German city-size distribution 1925-1999.Regional Science and Urban Economics, 38: 330-347.This paper uses empirical evidence on the evolution and structure of the West-German city size distribution to assess the relevance of three different theories of urban growth. The West-German case is of particular interest as Germany's urban system has been subject to some of history's largest (exogenous) shocks during the 20th century. A unique annual data set for 62 West-German cities that covers the period 1925–1999 allows for the identification of these shocks and provides evidence on the effects of these ‘quasi-natural experiments’ on the city size distribution as a whole as well as on each city separately. Our main findings are twofold. First, WWII has had a major and lasting impact on the city size distribution. Second, and heavily based upon the results of (panel) unit root tests that analyze the evolution of the individual cities that make up the West-German city size distribution, city growth is found to be trend stationary, which is not in line with Gibrat's Law of proportional effect. Overall, our findings are most consistent with theories emphasizing the role of increasing returns to scale for city growth.

DOI

[6]
CPG (Central People’s Government of the People’s Republic of China), 2014. National New-type Urbanization Plan (2014-2020). .

[7]
Duan X J, Yu X G, Nipper J, 2009. Economic polarized trends, function and expanded boundaries of the Yangtze Delta Region.Journal of Geographical Sciences, 19(6): 733-749.

DOI

[8]
Eaton J, Eckstein Z, 1997. Cities and growth: Theory and evidence from France and Japan.Regional Science and Urban Economics, 27: 443-474.The relative distribution of the populations of the top 40 urban areas of France and Japan remained very constant during these countries' periods of industrialization and urbanization. Moreover, projection of their future distributions based on past growth indicates that their size-distributions in steady state will not differ essentially from what they have been historically. Urbanization consequently appears to have taken the form of the parallel growth of cities, rather than of convergence to an optimal city size or of the divergent growth of the largest cities. We develop a model of urbanization and growth based on the accumulation of human capital consistent with these observations. Our model predicts that larger cities will have higher levels of human capital, higher rents, and higher wages per worker, even though workers are homogeneous and free to migrate between cities. Cities grow at a common growth rate, with relative city size depending upon the environment that they provide for learning.

DOI

[9]
Elvidge C, Baugh K, Zhizhin Met al., 2013. Why VIIRS data are superior to DMSP for mapping nighttime lights.Proceedings of the Asia-Pacific Advanced Network, 35: 62-69.For more than forty years the U.S. Air Force Defense Meteorological Satellite Program (DMSP) Operational Linescan System (OLS) has been the only satellite system collecting global low-light imaging data.02 A series of twenty-four DMSP satellites have collected low-light imaging data.02 The design of the OLS has not changed significantly since satellite F-4 flew in the late 1970’s and OLS data have relatively coarse spatial resolution, limited dynamic range, and lack in-flight calibration.02 In 2011 NASA and NOAA launched the Suomi National Polar Partnership (SNPP) satellite carrying the first Visible Infrared Imaging Radiometer Suite (VIIRS)02 instrument.02 The VIIRS collects low light imaging data and has several improvements 02over the OLS’ capabilities.02 In this paper we contrast the nighttime low light imaging collection capabilities of these two systems and compare their data products.

DOI

[10]
Elvidge C, Erwin E, Baugh Ket al., 2009. Overview of DMSP nightime lights and future possibilities.Paper presented at the 2009 Urban Remote Sensing Joint Event.The Defense Meteorological Satellite Program (DMSP) Operational Linescan System (OLS) has a unique capability to collect low-light imaging data of the earth at night. The OLS and its predecessors have collected this style of data on a nightly global basis since 1972. The digital archive of OLS data extends back to 1992. Over the years several global nighttime lights products have been generated. NGDC has now produced a set of global cloud-free nighttime lights products, specifically processed for the detection of changes in lighting emitted by human settlements, spanning 1992-93 to 2008. While the OLS is far from ideal for observing nighttime lights, the DMSP nighttime lights products have been successfully used in modeling the spatial distribution of population density, carbon emissions, and economic activity.

DOI

[11]
Fan C, 1999. The vertical and horizontal expansions of China’s city system.Urban Geography, 20(6): 493-515.Most studies of the size, growth, and distribution of cities have been based on Western economies and have identified economic factors such as scale and agglomeration economies and level of economic development as major determinants of urban growth. It is unclear whether these generalizations are applicable in socialist economies. In this paper, I argue that institutional factors have played key roles in shaping China's city system, which is characterized by declining population concentration across cities and by tremendous vertical (population growth of cities) and horizontal (addition of new cities) expansions. The empirical analysis focuses on describing the size distribution of cities, estimating a multivariate model predicting the population growth of cities, and performing a logistic regression analysis of new and existing cities. The findings underscore the effects of urban and regional development policies, socialist institutions, changes in the urban administrative system, and state and local government interests, and suggest that they as a whole are more important than economic factors in explaining the attributes and changes of China's city system. [Key words: urban growth, city system, institutional factors, China.]

DOI

[12]
Fang C, 2015. Important progress and future direction of studies on China’s urban agglomerations.Journal of Geographical Sciences, 25(8): 1003-1024.Urban agglomerations are an inevitable outcome of China's new national industrialization and urbanization reaching relatively advanced stages of development over the past 30 years. In the early 2000 s, urban agglomerations became new geographical units for participating in global competition and the international division of labor, and China has spent the past decade promoting them as the main spaces for pushing forward its new form of urbanization. The convening of the first Central Work Conference on Urbanization and the National New-type Urbanization Plan(2014-2020) further defined the status of urban agglomerations as the main players in promoting China's new type of national urbanization. Nevertheless, urban agglomerations remain a weak link in Chinese academia and are in urgent need of study. Only 19 articles on the theme of urban agglomerations were published in the journal Acta Geographica Sinica between 1934 and 2013, accounting for only 0.55% of all articles written during that period. Not only are there very few, they have also all been published within a relatively short period of time, with the first having been published only 10 years ago. The studies are also concentrated among only a few authors and institutions, and research is aimed at national requirements but is rather divergent. Even so, some studies on urban agglomerations have played a leading role and made important contributions to dictating the overall formation of urban agglomerations nationwide. Specifically, a proposed spatial pattern for urban agglomerations formed the basic framework for the spatial structure of China's urban agglomerations and guided the government to make urban agglomerations the main urban pattern when promoting the new type of urbanization; proposed standards and technologies for identifying the spatial dimensions of urban agglomerations played an important role in defining the scope of national urban agglomerations; a series of studies in the area of urban agglomerations spurred more in-depth and practical studies in the field; and studies on issues related to the formation and growth of urban agglomerations provided warnings on the future selection and development of urban agglomerations. Taking the progress and results of these studies as a foundation, the foci of selecting and developing urban agglomerations in China are as follows: to be problem-oriented and profoundly reflect on and review new problems exposed in the selection and development of urban agglomerations; to concentrate on urban agglomerations and lay importance on the formation of a new "5+9+6" spatial structure for China's urban agglomerations; to rely on urban agglomerations and promote the formation of a new pattern of national urbanization along the main axes highlighted by urban agglom-erations; to be guided by national strategic demand and continue to deepen understanding of major scientific issues in the course of the formation and development of urban agglomerations, including studying the resource and environmental effects of high-density urban agglomerations, scientifically examining resource and environmental carrying capacities of high-density urban agglomerations, creating new management systems and government coordination mechanisms for the formation and development of urban agglomerations, studying the establishment of public finance systems and public finance reserve mechanisms for urban agglomerations, and studying and formulating technical specifications for urban agglomeration planning and standards for delineating urban agglomeration boundaries.

DOI

[13]
Fang C, Yu D, 2016. China’s New Urbanization: Developmental Paths, Blueprints and Patterns. Beijing: Science Press.

[14]
Gabaix X, 1999. Zipf’s law for cities: An explanation.Quarterly Journal of Economics, 114: 739-767Zipf's law is a very tight constraint on the class of admissible models of local growth. It says that for most countries the size distribution of cities strikingly fits a power law: the number of cities with populations greater than S is proportional to 1/S. Suppose that, at least in the upper tail, all cities follow some proportional growth process (this appears to be verified empirically). This automatically leads their distribution to converge to Zipf's law.

DOI

[15]
Gabaix X, Ioannides Y, 2004. The evolution of city-size distributions.Handbook of Regional and Urban Economics, 4: 2341-2378.We review the accumulated knowledge on city size distributions and determinants of urban growth. This topic is of interest because of a number of key stylized facts, including notably Zipf’s law for cities (which states that the number of cities of size greater than S is proportional to 1/S) and the importance of urban primacy. We first review the empirical evidence on the upper tail of city size distribution. We offer a novel discussion of the important econometric issues in the characterization of the distribution. We then discuss the theories that have been advanced to explain the approximate constancy of the distribution across very different economic and social systems, emphasizing both bare-bone statistical theories and more developed economic theories. We discuss the more recent work on the determinants of urban growth and, in particular, growth regressions, economic explanations of city size distributions other than Gibrat’s law, consequences of major shocks (quasi natural experiments), and the dynamics of U.S. urban evolution.

DOI

[16]
Giesen K, Sudekum J, 2010. Zipfʼs law for cities in the regions and the country.Journal of Economic Geography, 11: 667-686.The salient rank–size rule for city sizes known as ‘Zipf’s law’ is not only satisfied for Germany's national urban hierarchy, but also in single German regions. To analyse this phenomenon, we build on the theory by Gabaix (1999Quarterly Journal of Economics, 94:739–767) that Zipf's law follows (under certain conditions) from a stochastic urban growth process. In particular, Gabaix shows that if urban growth in all regions follows Gibrat's law, we should observe the Zipfian rank-size rule among large cities both at the regional and national level. This theory has never been addressed empirically. Using non-parametric techniques and various definitions of a ‘region’, we find that Gibrat's law holds at the regional level. Consistently, we find that city size distributions at the national and regional levels tend to follow a Zipfian power law.

DOI

[17]
Gu C, Wu L, Cook I, 2012. Progress in research on Chinese urbanization.Frontiers of Architectural Research, 1(2): 101-149.

DOI

[18]
He C, Liu Z, Tian Jet al., 2014. Urban expansion dynamics and natural habitat loss in China: A multiscale landscape perspective.Global Change Biology, 20: 2886-2902.AbstractChina's extensive urbanization has resulted in a massive loss of natural habitat, which is threatening the nation's biodiversity and socioeconomic sustainability. A timely and accurate understanding of natural habitat loss caused by urban expansion will allow more informed and effective measures to be taken for the conservation of biodiversity. However, the impact of urban expansion on natural habitats is not well-understood, primarily due to the lack of accurate spatial information regarding urban expansion across China. In this study, we proposed an approach that can be used to accurately summarize the dynamics of urban expansion in China over two recent decades (1992–2012), by integrating data on nighttime light levels, a vegetation index, and land surface temperature. The natural habitat loss during the time period was evaluated at the national, ecoregional, and local scales. The results revealed that China had experienced extremely rapid urban growth from 1992 to 2012 with an average annual growth rate of 8.74%, in contrast with the global average of 3.20%. The massive urban expansion has resulted in significant natural habitat loss in some areas in China. Special attention needs to be paid to the Pearl River Delta, where 25.79% or 151802km2 of the natural habitat and 41.99% or 76002km2 of the local wetlands were lost during 1992–2012. This raises serious concerns about species viability and biodiversity. Effective policies and regulations must be implemented and enforced to sustain regional and national development in the context of rapid urbanization.

DOI PMID

[19]
Henderson J V, Venables A J, 2009. Dynamics of city formation.Review of Economic Dynamics, 12: 233-254.

[20]
Huang Q, He C, Gao Bet al., 2015. Detecting the 20 year city-size dynamics in China with a rank clock approach and DMSP/OLS nighttime data.Landscape and Urban Planning, 137: 138-148.Studies have shown that, city size and rank follow a Pareto distribution across countries and over time. However, inconsistent definitions and measurements of city size (e.g., urban population and urban area) in census data in China have hindered the retrieval of comparable Pareto coefficients over time. Additionally, abrupt changes in size and rank at the city level are neglected in many studies. In this study, we extracted an alternative and consistently comparable measurement of city size from Defense Meteorological Satellite Program/Operational Line-scan System (DMSP/OLS) nighttime light images. Besides the traditional regression analysis at the national level, we also adopted the rank clock method to analyze city-size evolution at the city level. We found that: (1) the distribution of urban areas became more even in China, with an increase of the Pareto's coefficient from 0.79 in 1992 to 0.90 in 2008; (2) the most obvious change in urban-area distribution at the national level occurred during the period from 2000 to 2003, which is consistent with turbulent rank changes at the city level; and (3) our combined method revealed another period from 1992 to 1995 with large rank fluctuations, which was masked by the relatively stable Pareto's coefficients extracted at the national level. The results demonstrate that the new DMSP/OLS nighttime light images and the combined method are useful for revealing city-size dynamics in a more consistent way from both national and city perspectives. The results enrich our understanding of city-size evolution and have valuable implications for relevant decision makers and stakeholders.

DOI

[21]
Huang Q, Yang X, Gao Bet al., 2014. Application of DMSP/OLS nighttime light images: A meta-analysis and a systematic literature review.Remote Sensing, 6(8): 6844-6866.Since the release of the digital archives of Defense Meteorological Satellite Program Operational Line Scanner (DMSP/OLS) nighttime light data in 1992, a variety of datasets based on this database have been produced and applied to monitor and analyze human activities and natural phenomena. However, differences among these datasets and how they have been applied may potentially confuse researchers working with these data. In this paper, we review the ways in which data from DMSP/OLS nighttime light images have been applied over the past two decades, focusing on differences in data processing, research trends, and the methods used among the different application areas. Five main datasets extracted from this database have led to many studies in various research areas over the last 20 years, and each dataset has its own strengths and limitations. The number of publications based on this database and the diversity of authors and institutions involved have shown promising growth. In addition, researchers have accumulated vast experience retrieving data on the spatial and temporal dynamics of settlement, demographics, and socioeconomic parameters, which are "hotspot" applications in this field. Researchers continue to develop novel ways to extract more information from the DMSP/OLS database and apply the data to interdisciplinary research topics. We believe that DMSP/OLS nighttime light data will play an important role in monitoring and analyzing human activities and natural phenomena from space in the future, particularly over the long term. A transparent platform that encourages data sharing, communication, and discussion of extraction methods and synthesis activities will benefit researchers as well as public and political stakeholders.

DOI

[22]
Huang Q, Yang Y, Li Yet al., 2016, A simulation study on the urban population of China based on nighttime light data acquired from DMSP/OLS.Sustainability, 8: 521.The urban population (UP) measure is one of the most direct indicators that reflect the urbanization process and the impacts of human activities. The dynamics of UP is of great importance to studying urban economic, social development, and resource utilization. Currently, China lacks long time series UP data with consistent standards and comparability over time. The nighttime light images from the Defense Meteorological Satellite Program (DMSP) Operational Linescan System (OLS) allow the acquisition of continuous and highly comparable long time series UP information. However, existing studies mainly focus on simulating the total population or population density level based on the nighttime light data. Few studies have focused on simulating the UP in China. Based on three regression models (i.e., linear, power function, and exponential), the present study discusses the relationship between DMSP/OLS nighttime light data and the UP and establishes optimal regression models for simulating the UPs of 339 major cities in China from 1990 to 2010. In addition, the present study evaluated the accuracy of UP and non-agricultural population (NAP) simulations conducted using the same method. The simulation results show that, at the national level, the power function model is the optimal regression model between DMSP/OLS nighttime light data and UP data for 1990-2010. At the provincial scale, the optimal regression model varies among different provinces. The linear regression model is the optimal regression model for more than 60% of the provinces. In addition, the comparison results show that at the national, provincial, and city levels, the fitting results of the UP based on DMSP/OLS nighttime light data are better than those of the NAP. Therefore, DMSP/OLS nighttime light data can be used to effectively retrieve the UP of a large-scale region. In the context of frequent population flows between urban and rural areas in China and difficulty in obtaining accurate UP data, this study provides a timely and effective method for solving this problem.

DOI

[23]
Jin F, Wang C, Li Xet al., 2010. China’s regional transport dominance: Density, proximity, and accessibility.Journal of Geographical Sciences, 20(2): 295-309.lt;a name="Abs1"></a>Transport infrastructure plays an important role in shaping the configuration of spatial socio-economic structures and influences regional accessibility. This paper defines <i>transport dominance</i> from three aspects: <i>quality, quantity</i> and <i>advantage</i> measured by <i>density, proximity</i> and <i>accessibility</i> indices. County is the basic unit for analysis. The results reveal: (1) <i>Transport dominance</i> statistically follows a partial normal distribution. A very few counties, 1.4% of the total, have extremely high <i>transport dominance</i> which strongly supports the socio-economic development in these areas. In contrast, one eighth of all counties have poor <i>transport dominance</i> which impedes local socio-economic development to some extent. The remaining areas, about 70% of the counties, have median <i>transport dominance</i>. (2) <i>Transport dominance</i> is spatially unevenly distributed, with values decreasing gradually from the coastal area to the inland area. Areas in the first-highest level of <i>transport dominance</i> are mainly concentrated in the Yangtze River Delta, the Greater Beijing area, and the Pearl River Delta. Areas in the second-highest level are focused in Chengdu, Chongqing, and Wuhan metropolitan areas. Provincial capitals and a few other counties belong to the third-highest level.

DOI

[24]
Li S, Sui D.2013. Pareto’s law and sample size: A case study of China’s urban system 1984-2008.Geojournal, 78(4): 615-626.

[25]
Liu J, Kuang W, Zhang Zet al., 2014. Spatiotemporal characteristics, patterns, and causes of land-use changes in China since the late 1980s.Journal of Geographical Sciences, 24(2): 195-210.Land-use/land-cover changes (LUCCs) have links to both human and nature interactions. China’s Land-Use/cover Datasets (CLUDs) were updated regularly at 5-year intervals from the late 1980s to 2010, with standard procedures based on Landsat TMETM+ images. A land-use dynamic regionalization method was proposed to analyze major land-use conversions. The spatiotemporal characteristics, differences, and causes of land-use changes at a national scale were then examined. The main findings are summarized as follows.Land-use changes (LUCs) across China indicated a significant variation in spatial and temporal characteristics in the last 20 years (1990–2010). The area of cropland change decreased in the south and increased in the north, but the total area remained almost unchanged. The reclaimed cropland was shifted from the northeast to the northwest. The built-up lands expanded rapidly, were mainly distributed in the east, and gradually spread out to central and western China. Woodland decreased first, and then increased, but desert area was the opposite. Grassland continued decreasing. Different spatial patterns of LUC in China were found between the late 20th century and the early 21st century. The original 13 LUC zones were replaced by 15 units with changes of boundaries in some zones. The main spatial characteristics of these changes included (1) an accelerated expansion of built-up land in the Huang-Huai-Hai region, the southeastern coastal areas, the midstream area of the Yangtze River, and the Sichuan Basin; (2) shifted land reclamation in the north from northeast China and eastern Inner Mongolia to the oasis agricultural areas in northwest China; (3) continuous transformation from rain-fed farmlands in northeast China to paddy fields; and (4) effectiveness of the “Grain for Green” project in the southern agricultural-pastoral ecotones of Inner Mongolia, the Loess Plateau, and southwestern mountainous areas. In the last two decades, although climate change in the north affected the change in cropland, policy regulation and economic driving forces were still the primary causes of LUC across China. During the first decade of the 21st century, the anthropogenic factors that drove variations in land-use patterns have shifted the emphasis from one-way land development to both development and conservation.The “dynamic regionalization method” was used to analyze changes in the spatial patterns of zoning boundaries, the internal characteristics of zones, and the growth and decrease of units. The results revealed “the pattern of the change process,” namely the process of LUC and regional differences in characteristics at different stages. The growth and decrease of zones during this dynamic LUC zoning, variations in unit boundaries, and the characteristics of change intensities between the former and latter decades were examined. The patterns of alternative transformation between the “pattern” and “process” of land use and the causes for changes in different types and different regions of land use were explored.

DOI

[26]
Liu Z, He C, Zhang Qet al., 2012. Extracting the dynamics of urban expansion in China using DMSP-OLS nighttime light data from 1992 to 2008.Landscape and Urban Planning, 106(1): 62-72.Timely and accurate information about the dynamics of urban expansion is vital to reveal the relationships between urban expansion and the ecosystem, to optimize land use patterns, and to promote the effective development of cities in China. Nighttime stable light data from the Defense Meteorological Satellite Program's Operational Line-scan System (DMSP-OLS) Nighttime Lights Time Series dataset provide a new source of information that can quickly reveal the dynamics of urban expansion. However, the DMSP-OLS sensor has no on-board calibration, which makes it difficult to directly compare time series data from multiple satellites. This study developed a new method for systematically correcting multi-year multi-satellite nighttime stable lights data and rapidly extracting the dynamics of urban expansion based on this corrected data for China from 1992 to 2008. The results revealed that the proposed method effectively reduced abnormal discrepancy within the nighttime stable light data and improved continuity and comparability. The dynamics of urban expansion in China from 1992 to 2008 were extracted with an average overall accuracy of 82.74% and an average Kappa of 0.40. (C) 2012 Elsevier B.V. All rights reserved.

DOI

[27]
Lu D, Fan J.2010. Regional Development Research in China: A Roadmap to 2050. Beijing: Science Press.

[28]
Lu S, Guan X, He Cet al., 2015. Spatio-temporal patterns and policy implications of urban land expansion in metropolitan areas: A case study of Wuhan urban agglomeration, Central China.Sustainability, 6: 4723-4748.Relatively little attention has been paid to examining the spatial expansion features of cities at various tiers at the regional level in China, especially those located in central and western regions of the country. Based on Landsat satellite imagery from four years—1980, 1990, 2000, and 2010, this paper investigates the spatio-temporal pattern of urban land expansion and its influencing factors in the Wuhan Urban Agglomeration (WUA) in central China. The research found that the total area of urban land expanded from 203.66 km 2 in 1980 to 1370.07 km 2 in 2010, and that urban land areas increased by 423.82, 167.42, and 574.93 km 2 in the periods 1980–1990, 1990–2000, and 2000–2010 respectively, exhibiting significant fluctuation between the different periods studied. Geographically, this spatial expansion pattern was characterised by conspicuous concentrations and regional imbalances across the overall study period. Whilst these spatio-temporal differences were found to be closely related to industrialisation, urban population growth, land-use policies, urbanisation guidelines (governmental plans and regulations addressing urbanisation), and national development strategy, the dominant mechanisms driving those differences varied over time. In response, the paper presents an urban-rural and regional integration strategy, with the aim of avoiding economic gaps and the inefficient utilisation of various resources in the urban agglomeration areas.

DOI

[29]
Luo X, Shen J, 2009. A study on inter-city cooperation in the Yangtze River Delta region, China.Habitat International, 33(1): 52-62.Inter-city cooperation in the Yangtze River Delta region is a new phenomenon and has received much governmental and scholarly attention in recent years. This paper examines inter-city cooperation from partnership perspective. In this study, three typical cases of inter-city cooperation, Suzhou–Wuxi–Changzhou City-region Planning, the Forum for the Coordination of Urban Economy of Yangtze River Delta Region and Jiangyin Economic Development Zone in Jingjiang are selected to examine three types of partnership arrangements, namely, hierarchical partnership, spontaneous partnership and hybrid partnership. This research applies the partnership approach to regional scale based on Chinese experiences. The research focus of this paper is the effectiveness of three types of inter-city cooperation. Through tracing the process of partnership formation and investigating stakeholder interactions, this paper argues that the effectiveness of inter-city cooperation depends on cooperation mechanism, the nature and scope of the cooperation, and partner selection and the roles of actors in partnership formation.

DOI

[30]
Ministry of Housing and Urban-Rural Development PRC, 2014. China Urban Construction Statistical Yearbook 2011. Beijing: China Planning Press.

[31]
NBS (National Bureau of Statistics of China), 2013. China Statistical Yearbook 2013. Beijing: China Statistics Press.

[32]
NBS (National Bureau of Statistics of China), 1991, 2011. China Statistical Yearbook for Regional Economy. Beijing: China Statistics Press.

[33]
PCO (Population Census Office under the State Council, Development of Population and Employment Statistics in National Bureau of Statistics), 1992, 2012. Tabulation on the 1990, 2010 population census of the People’s Republic of China. Beijing: China Statistics Press.

[34]
Peng X, 2011. China’s demographic history and future challenges.Science, 333(6042): 581-587.On 28 April 2011, China’s state statistics bureau released its first report on the country’s 2010 population census. The report states that the total population of mainland China reached 1.3397 billion in 2010, with an annual average population growth rate of 0.57% during the previous 10 years. The share of the total population aged 0 to 14 declined from 22.9% in 2000 to 16.6% in 2010, whereas the proportion aged 65 and above grew from 7.0% to 8.9% during the same period. This indicates that China’s population is aging rapidly. The report also shows that China is urbanizing, with nearly half of the population—665.57 million people, or 49.7%—living in urban areas, an increase of 13 percentage points over the 2000 figure. Moreover, about 260 million Chinese people are living away from where they are formally registered, and the overwhelming majority of them (about 220 million) are rural migrants living and working in urban areas but without formal urban household registration status. China is at a demographic turning point: It is changing from an agricultural society into an urban one, from a young society to an old one, and from a society attached to the land to one that is very much on the move.

DOI PMID

[35]
Peng J, Shen H, Wu Wet al., 2015. Net primary productivity (NPP) dynamics and associated urbanization driving forces in metropolitan areas: A case study in Beijing City, China.Landscape Ecology, 31(5): 1077-1092.CONTEXT: Eco-environmental effects of urbanization are a focus in landscape ecology. OBJECTIVE: The influences of population, economic and spatial development during the urbanization process in Beijing City, China on net primary productivity (NPP) were analyzed. The responding mechanism of NPP in different urbanization stages was also examined to develop advice about eco-environmental sustainability of urban development. METHODS: Using the Carnegie Ames Stanford Approach model, we estimated NPP. Using linear regression and polynomial regression analysis, we analyzed NPP responses to stages of urbanization. RESULTS: High NPP areas were located in northeast Yanqing, northwest Miyun, northern Huairou and Pinggu. The distribution of NPP generally occurred in the following order from high NPP to low NPP: outer suburbs, inner suburbs, encircled city center, and inner city. Because of the heat island effect in winter, the estimated NPP in the encircled city center and inner city was higher in 2009 than in 2001. There was a negative correlation between NPP and both economic and spatial urbanization, but an increase in population did not necessarily lead to an immediate decrease in NPP. An analysis of NPP dynamics in five kinds of urban development zones showed that urbanization resulted in a lasting and observable loss of NPP over time and space, although there was some promotion of NPP in highly urbanized zones. CONCLUSION: There are three stages in the response of NPP to urbanization: damage stage, antagonistic stage, and coordination stage. The stage threshold depends on local eco-environmental management and urban planning interventions.

DOI

[36]
Peng J, Zhao S, Liu Yet al., 2016. Identifying the urban-rural fringe using wavelet transform and kernel density estimation: A case study in Beijing City, China.Environmental Modelling & Software, 83: 286-302.The urban-rural fringe, known as the region located between the urban and rural areas, is the frontier of urban expansion against rural reservations. Identifying this particular region precisely, which was usually simplified by researchers, is the most important prerequisite in studies related to urban-rural patterns. In this study, we proposed a new model, combining wavelet transform and kernel density estimation, to identify the urban-rural fringe based on land use data. After testing the model using Beijing City as a case study, it is proved that the model is able to delineate the boundaries of urban-rural fringe precisely with respect to different landscape patterns at different regions (central urban area, urban-rural fringe area, and outer rural area). Furthermore, due to the advantage of the self-adaptive-bandwidth kernel density estimation, the model can also distinguish some of the satellite towns from the central urban area and outer rural area with the boundaries of urban-rural fringe.

DOI

[37]
Rosen K T, Resnick M, 1980. The size distribution of cities: An examination of the Pareto law and primacy.Journal of Urban Economics, 8(2): 165-186.This paper examines the Pareto and primacy measures of the size distribution of cities. The mean Pareto exponent for a sample of 44 countries is 1.136, somewhat greater than the exponent of one implied by the rank-size rule. We find that value of the Pareto exponent is quite sensitive to the definition of the city and the choice of city sample size. The significance of non-linear terms in variants of the Pareto distribution also indicate that the rank-size rule is only a first approximation to a complete characterization of the size distribution of cities within a country. The relatively low correlation between primacy and Pareto measures confirms the need for a variety of measures of city size distributions. This paper also suggests that large cities are growing faster than small cities in most of the countries in our sample. This is indicated by the positive coefficient on the first non-linear term introduced into the Pareto equation. Finally, variations in the Pareto exponent and measures of primacy are partly explained by economic, demographic, and geographic factors.

DOI

[38]
Shen J, 1995. Rural development and rural to urban migration in China 1978-1990.Geoforum, 26: 395-409.Economic reforms since the late 1970s have brought about significant changes in rural China. A large number of surplus rural labourers have been released from the agricultural sector and there has been a massive transition of rural residents from agricultural to non-agricultural employment. These changes will be analyzed by examining the changes in the employment structure of rural residents. Rural to urban migration is another important option for many rural labourers. The size of China's urban population and the scale of rural to urban migration continue to be an ‘enigma’ due to several changes in the definition of the urban population. Several data sources will be used to provide more realistic estimates of rural to urban migrations on a set of comparable though different bases. Data on the new entries into urban employment and the urban ‘non-agricultural population’ will be used to illustrate the scale of migration by rural residents to the formal urban sector. This may only record those migrants who have changed their registration status from ‘agricultural population’ to ‘non-agricultural population’ which is tightly controlled by the government. The 1990 Census data provide some evidence on the rural to urban migration by the registered ‘agricultural population’. The 1987 1% population sampling data will be used to analyze the actual migrations among cities, towns and counties over the period 1982–1987. It is found that town and county populations tended to move to towns at the intra-provincial level, but to cities at the inter-provincial level. Out-migrants from cities tended to move to cities at both the intra- and inter-provincial levels.

DOI PMID

[39]
Sheng K, Sun W, Fan J, 2014. Sequential city growth: Theory and evidence from the US.Journal of Geographical Sciences, 24(6): 1161-1174.城市生长模式在城市的地理研究正在吸引更多的注意。这份报纸检验城市怎么从美国在新经济地理框架和实验证据下面基于一个理论模型在大规模经济在尺寸分发的上面的尾巴发展并且成长。结果证明城市在一个顺序的模式成长。有最好的经济条件的城市是第一变得最快直到他们到达一种批评尺寸,然后,他们的生长率慢下来,更小的城市远在城市的层次击倒在顺序成为快成长的。这份报纸也揭示城市的系统的三个相关特征。首先,城市尺寸分发演变从低级在一条转换 U 字形的路径平衡到首领和最后高级的平衡模式。第二,在那里存在坚持的断绝,或差距,在城市尺寸类之间。第三,在上面的尾巴的城市尺寸展出有条件的集中特征。这份报纸不能仅仅贡献提高都市化过程和城市尺寸分发动力学的理解,而且广泛地在做有效政策并且科学城市的计划被使用。

DOI

[40]
Shi K, Huang C, Yu Bet al., 2014. Evaluation of NPP-VIIRS night-time light composite data for extracting built-up urban areas.Remote Sensing Letters, 5(4): 358-366.The first global night-time light composite data from the Visible Infrared Imaging Radiometer Suite (VIIRS) day-搉ight band carried by the Suomi National Polar-orbiting Partnership (NPP) satellite were released recently. So far, few studies have been conducted to assess the ability of NPP-VIIRS night-time light composite data to extract built-up urban areas. This letter aims to evaluate the potential of this new-generation night-time light data for extracting urban areas and compares the results with Defense Meteorological Satellite Program perational Linescan System (DMSP-OLS) data through a case study of 12 cities in China. The built-up urban areas of 12 cities are extracted from NPP-VIIRS and DMSP-OLS data by using statistical data from government as reference. The urban areas classified from Landsat 8 data are used as ground truth to evaluate the spatial accuracy. The results show the built-up urban areas extracted from NPP-VIIRS data have higher spatial accuracies than those from DMSP-OLS data for all the 12 cities. These improvements are due to the relatively high spatial resolution and wide radiometric detection range of NPP-VIIRS data. This study reveals that NPP-VIIRS night-time light composite data would provide a powerful tool for urban built-up area extraction at national or regional scale.

DOI

[41]
Small C, Elvidge C, 2013. Night on earth: mapping decadal changes of anthropogenic night light in Asia.International Journal of Applied Earth Observation and Geoinformation, 22(6): 40-52.The defense meteorological satellite program (DMSP) operational linescan system (OLS) sensors have imaged emitted light from Earth's surface since the 1970s. Temporal overlap in the missions of 5 OLS sensors allows for intercalibration of the annual composites over the past 19 years (Elvidge et al., 2009). The resulting image time series captures a spatiotemporal signature of the growth and evolution of lighted human settlements and development. We use empirical orthogonal function (EOF) analysis and the temporal feature space to characterize and quantify patterns of temporal change in stable night light brightness and spatial extent since 1992. Temporal EOF analysis provides a statistical basis for representing spatially abundant temporal patterns in the image time series as uncorrelated vectors of brightness as a function of time from 1992 to 2009. The variance partition of the eigenvalue spectrum combined with temporal structure of the EOFs and spatial structure of the PCs provides a basis for distinguishing between deterministic multi-year trends and stochastic year-to-year variance. The low order EOFs and principal components (PC) space together discriminate both earlier (1990s) and later (2000s) increases and decreases in brightness. Inverse transformation of these low order dimensions reduces stochastic variance sufficiently so that tri-temporal composites depict potentially deterministic decadal trends. The most pronounced changes occur in Asia. At critical brightness threshold we find an 18% increase in the number of spatially distinct lights and an 80% increase in lighted area in southern and eastern Asia between 1992 and 2009. During this time both China and India experienced a 6520% increase in number of lights and a 65270% increase in lighted area – although the timing of the increase is later in China than in India. Throughout Asia a variety of different patterns of brightness increase are apparent in tri-temporal brightness composites – as well as some conspicuous areas of apparently decreasing background luminance and, in many places, intermittent light suggesting development of infrastructure rather than persistently lighted development. Vicarious validation using higher resolution Landsat imagery verifies multiple phases of urban growth in several cities as well as the consistent presence of low DN (<6515) background luminance for many agricultural areas. Lights also allow us to quantify changes in the size distribution and connectedness of different intensities of development. Over a wide range of brightnesses, the size distributions of spatially contiguous lighted area are consistent with power laws with exponents near 611 as predicted by Zipf's Law for cities. However, the larger lighted segments are much larger than individual cities; they correspond to vast spatial networks of contiguous development (Small et al., 2011).

DOI

[42]
Small C, Elvidge C, Balk Det al., 2011. Spatial scaling of stable night lights.Remote Sensing of Environment, 115(2): 269-280.City size distributions, defined on the basis of population, are often described by power laws. Zipf's Law states that the exponent of the power law for rank-size distributions of cities is near 鈭1. Verification of power law scaling for city size distributions at continental and global scales is complicated by small sample sizes, inappropriate estimation techniques, inconsistent definitions of urban extent and variations in the accuracy and spatial resolution of census administrative units. We attempt to circumvent some of these complications by using a continuous spatial proxy for anthropogenic development and treat it as a spatial complement to population distribution. We quantify the linearity and exponent of the rank-size distribution of spatially contiguous patches of stable night light over a range of brightnesses corresponding to different intensities of development. Temporally stable night lights, as measured by the Defense Meteorological Satellite Program-Operational Line Scanner (DMSP-OLS), provide a unique proxy for anthropogenic development. Brightness and spatial extent of emitted light are correlated to population density (Sutton et al., 2001), built area density (Elvidge et al., 2007c) and economic activity ( Doll et al., 2006 and Henderson et al., 2009 ) at global scales and within specific countries. Using a variable brightness threshold to derive spatial extent of developed land area eliminates the complication of administrative definitions of urban extent and makes it possible to test Zipf's Law in the spatial dimension for a wide range of anthropogenic development. Higher brightness thresholds generally correspond to more intense development while lower thresholds extend the lighted area to include smaller settlements and less intensively developed peri-urban and agricultural areas. Using both Ordinary Least Squares (OLS) and Maximum Likelihood Estimation (MLE) to estimate power law linearity and exponent of the resulting rank-size distributions across a range of upper tail cutoffs, we consistently find statistically significant exponents in the range 鈭0.95 to 鈭1.11 with an abrupt transition to very large, extensively connected, spatial networks of development near the low light detection limit of the sensor. This range of exponents and transition are observed at both continental and global scales. The results suggest that Zipf's Law also holds for spatial extent of anthropogenic development across a range of intensities at both continental and global scales. The implication is that the dynamics of urban growth and development may be represented as spatial phase transitions when the spatial extent and intensity of development are treated as continuous variables rather than discrete entities.

DOI

[43]
Soo K T, 2014. Zipf, Gibrat and geography: Evidence from China, India and Brazil.Papers in Regional Science, 93(1): 159-181.We investigate Zipf's Law on the size distribution and Gibrat's Law on the growth of sub-national populations in China, India and Brazil. We reject Zipf's Law for India, but not for China and Brazil; a log normal distribution also fits Brazil well, but not China and India. Gibrat's Law holds for Brazil; that is, lagged population is the best predictor of current population in Brazil. In China, market potential is an important predictor of population growth, while in India both crop area and market potential are important. Our results show that there is a diversity of experiences across countries, and we speculate that this diversity maybe caused by differences in the characteristics of the three countries.ResumenInvestigamos la ley de Zipf sobre distribución de tama09os y la Ley de Gibrat sobre el crecimiento de poblaciones subnacionales en China, la India y el Brasil. Rechazamos la ley de Zipf para la India, pero no para China y el Brasil; la distribución logarítmica normal también se ajusta al Brasil, pero no a China o la India. La ley de Gibrat se ajusta al Brasil; es decir, la población rezagada es el mejor predictor de la población actual en el Brasil. En China, el potencial de mercado es un predictor importante del crecimiento de la población, mientras que en la India son importantes tanto la superficie de cultivo como el potencial de mercado. Nuestros resultados muestran que existe una diversidad de experiencias entre países, y se especula que esta diversidad está causada por diferencias en las características de los tres países.

DOI

[44]
Tan R, Liu Y, Liu Yet al., 2014. Urban growth and its determinants across the Wuhan urban agglomeration, central China.Habitat International, 44: 268-281.China has witnessed rapid urban growth over the past two decades, which has resulted in vast ecological and environmental issues, both in urban and peri-urban areas. It is therefore extremely important to explore the driving factors, and thus gain an insight into the process of urban growth, to be able to provide help for urban planning and policy making. This paper examines the features and spatial determinants of urban growth in the Wuhan urban agglomeration (WUA) from 1988 to 2011. Four landscape metrics (patch density, landscape shape index, aggregation index, and total area) were selected to characterize the urban landscape features at two scales (5km and 10km grid sizes). Spatial regression models were then used to explore the relationships between urban landscape change and its spatial determinants. The results showed that the urban area of the WUA increased from 4.19 104ha in 1988 to 49.29 104ha in 2011, with an annual growth rate of 46.75% over the past two decades. The WUA landscape has also become more fragmented and irregular. Spatial autocorrelations were common in the urban growth changes at the two different scales. Both physical and proximity factors have significantly influenced the urban landscape changes, and they have varied with time and scale. Among these variables, all the levels of road network have had a considerable effect on the shape and density changes of the urban landscape, while distance to railway and highway did not show obvious effects on the total area change of the urban growth. In addition, city center has had an increasing effect on patch density, and a decreasing impact on the total area of the urban landscape. The different land-use policies should be compromised and reconciled so that the objectives of promoting socioeconomic development and farmland protection can be balanced. These results could help us to better understand the process of urban growth, and thus have important implications for urban management and policy making in metropolitan areas in developing countries.

DOI

[45]
Tian G, Jiang J, Yang Zet al., 2011. The urban growth, size distribution and spatio-temporal dynamic pattern of the Yangtze River Delta megalopolitan region, China. Ecological Modelling, 222(3): 865-878As one of the six megalopolitan regions in the world, the Yangtze River Delta is one of the most populated and developed regions of China. The spatial and temporal dynamic pattern of the urbanization process of the megalopolitan region is investigated. This work compared the spatial and temporal dynamic pattern of the urban growth for the five urban areas (Shanghai, Nanjing, Suzhou, Wuxi and Changzhou) in this region. During the 15 years, urban growth patterns were dramatically uneven over three 5-year periods. The size distribution of the five urban areas became more even with the rapid urbanization process. The patterns of urban expansion reflected policy adjustment and economic development throughout the time. Landscape metric analysis across concentric buffer zones was conducted to elucidate the area, shape, size, complexity and configuration of urban expansion. The study indicates the coalescence process occurred during the rapid urban growth from 1990 to 1995 and the moderate growth period from 2000 to 2005, but different urban growth period between 1995 and 2000. The urban growth pattern was coalesced for the Nanjing and Wuxi metropolitan areas and diffused for Shanghai, Suzhou and Changzhou. This approach indicates that the coalescence process was the major growth model for this region in the recent 15 years despite their different size, economic growth and population growth. The diffusion-coalesce dichotomy represent endpoints rather than alternate states of urban growth. This work will be beneficial in understanding the size distribution and urbanization process of the megalopolitan region in China.

DOI

[46]
Wang L, Wong C, Duan X, 2016. Urban growth and spatial restructuring patterns: The case of Yangtze River Delta Region, China. Environment and Planning B: Planning and Design, 43(3): 515-539.The year 1995 has been widely identified as a watershed in China0964s urbanisation process. The period before was deemed as 0900urbanisation from below0964 with a focus on small cities and towns, whereas the period afterwards has been characterised by the 0900land-centred development0964 of large cities. This paper argues that there have been further spatial and temporal differentiations since 2000. By adopting a city-regional perspective of urban land expansion, the urban growth and spatial-restructuring process of different levels of cities in Yangtze River Delta Region were examined. Different indicators and technical measures such as spatial autocorrelation analysis and Geographic Information System (GIS) mapping analysis were employed to examine growth rates, growth intensity levels and the spatial clustering patterns of 15 city-regions over three time periods between 1985 and 2007. Through the development of a unified land classification system with satellite images, and the use of the GIS grid-overlay method, our analysis overcomes various identified methodological problems of previous research.

DOI

[47]
Wen Y, Thill J, 2016. Identification, structure and dynamic characteristics of the Beijing-Tianjin-Hebei mega-city region.Cambridge Journal of Regions, Economy and Society, 9(3): 589-611.This article establishes identification criteria and metrics, and delineates the Beijing–Tianjin–Hebei mega-city region (BTHMCR). Through an empirical analysis of socio- economic data and of functional relationships denoted by advanced producer services (APS) and commuting flows, we focus on the dynamic characteristics of APS firms and their relevance for polycentricity in BTHMCR and find that: (i) BTHMCR grew fast and became more spatially polycentric in the past decade; (ii) Beijing dominates the landscape of APSs and different APSs present different spatial patterns, with BTHMCR undergoing a process of functional polycentric division of labour and complementarity; (iii) Concentration and deconcentration processes co-exist simultaneously in BTHMCR; (iv) Internal and global network connections and thus functional connectivity have been improving in BTHMCR while Beijing absolutely dominates the connectivity. Policy implications grounded in this analysis are discussed.

DOI

[48]
Wu J, Ma L, Li Wet al., 2014. Dynamics of urban density in China: Estimations based on DMSP/OLS nighttime light data.IEEE Journal of Selected Topics in Applied Earth Observations and Remote Sensing, 7(10): 4266-4275.In China, rapid urbanization has increased the demand for urban land and intensified the conflict between limited land resources and urban development. In response, high urban density has been proposed to realize sustainable urban development. Achieving this goal requires an examination of the dynamics of urban density in China. Nighttime light (NTL) data from the Defense Meteorological Satellite Program/Operational Linescan System (DMSP/OLS) are a good indicator of human activity. We applied NTL data to measure urban density in 70 major cities in China during 1992-2010. Based on temporal changes in NTL, we identified seven classes of urban density and clustered the distributions of urban density in 70 cities into six types. The dynamics of urban density were then obtained from the GDP density as an index of city development. The curves of urban density distribution gradually changed from a concave increase to W-shaped and S-shaped to a concave decrease, indicating that the current urban land use in China is unsustainable and that the shortage of land resources must be addressed. An examination of the distribution of urban density in Hong Kong revealed a different pattern and a potential solution for cities in mainland China.

DOI

[49]
Xu Z, Zhu N, 2009. City-size distribution in China: Are large cities dominant?Urban Study, 46: 2159-2185.This paper examines the evolution in size distribution of Chinese cities. Since the relaxation of restrictions on rural/urban migration in the 1980s, China has experienced rapid urban growth. However, cities of different sizes have experienced varying patterns of growth. We first describe the evolution of city size distribution in China by documenting the growth both of city size and of the number of existing cities. Then, focusing on the period from 1990-2000, we characterize the urban evolution trend with the Pareto law estimation, and examine the mobility of cities between different size groups with the Markov transition matrix. We also test the convergence hypothesis in the city population growth process. Our results suggest that, contrary to the expected dominance of large cities' growth, Chinese city size distribution evened out over the 1990s, with small cities growing more rapidly than large cities.

DOI

[50]
Xu M, He C, Liu Zet al., 2016. How did urban land expand in China between 1992 and 2015? A multi-scale landscape analysis. PLoS ONE, 11(5): e0154839.Abstract Effective and timely quantification of the spatiotemporal pattern of urban expansion in China is important for the assessment of its environmental effects. However, the dynamics of the most recent urban expansions in China since 2012 have not yet been adequately explained due to a lack of current information. In this paper, our objective was to quantify spatiotemporal patterns of urban expansion in China between 1992 and 2015. First, we extracted information on urban expansion in China between 1992 and 2015 by integrating nighttime light data, vegetation index data, and land surface temperature data. Then we analyzed the spatiotemporal patterns of urban expansion at the national and regional scales, as well as at that of urban agglomerations. We found that China experienced a rapid and large-scale process of urban expansion between 1992 and 2015, with urban land increasing from 1.22 0103 104 km2 to 7.29 0103 104 km2, increasing in size nearly fivefold and with an average annual growth rate of 8.10%, almost 2.5 times as rapid as the global average. We also found that urban land in China expanded mainly by occupying 3.31 0103 104 km2 of cropland, which comprised 54.67% of the total area of expanded urban land. Among the three modes of growth-infilling, edge expansion, and leapfrog-edge expansion was the main cause of cropland loss. Cropland loss resulting from edge expansion of urban land totalled 2.51 0103 104 km2, accounting for over 75% of total cropland loss. We suggest that effective future management with respect to edge expansion of urban land is needed to protect cropland in China.

DOI PMID

[51]
Ye X, Xie Y, 2012. Re-examination of Zipf’s law and urban dynamic in China: A regional approach.Annals of Regional Science, 49(1): 135-156.Recent efforts have been made to interpret spatial-temporal evolution of urban system using Zipf’s law. The debates remain whether Zipf’s law holds true for large and diverse countries with long urbanization history, and how varied geographical settings with different socioeconomic conditions affect city-size distributions. This research investigates China’s urban system dynamics through expanded Zipf’s law at national and regional level. First, the paper revisits urban system dynamic theories and recent applications of Zipf’s law. The city data from 1960 to 2000 are then used to analyze rapid changes of urban systems in China through Zipf’s plots of cities over the entire nation and in six macro regions, respectively. The paper also examines top ten city rank changes nationally and regionally to examine temporal trajectories of key cities and the impacts on urban systems over space. Three types of Zipf’s law reflections are found over six China’s macro regions, based on the similarities of temporal dynamics of urban systems.

DOI

[52]
Yeh A, Xu J, 2010. China’s Pan-Pearl River Delta: Regional Cooperation and Development. Vol. 1. Hong Kong: Hong Kong University Press.

[53]
Zeng C, Liu Y, Stein Aet al., 2015. Characterization and spatial modeling of urban sprawl in the Wuhan Metropolitan Area, China.International Journal of Applied Earth Observation and Geoinformation, 34: 10-24.Urban sprawl has led to environmental problems and large losses of arable land in China. In this study, we monitor and model urban sprawl by means of a combination of remote sensing, geographical information system and spatial statistics. We use time-series data to explore the potential socio-economic driving forces behind urban sprawl, and spatial models in different scenarios to explore the spatio-temporal interactions. The methodology is applied to the city of Wuhan, China, for the period from 1990 to 2013. The results reveal that the built-up land has expanded and has dispersed in urban clusters. Population growth, and economic and transportation development are still the main causes of urban sprawl; however, when they have developed to certain levels, the area affected by construction in urban areas (Jian Cheng Qu (JCQ)) and the area of cultivated land (ACL) tend to be stable. Spatial regression models are shown to be superior to the traditional models. The interaction among districts with the same administrative status is stronger than if one of those neighbors is in the city center and the other in the suburban area. The expansion of urban built-up land is driven by the socio-economic development at the same period, and greatly influenced by its spatio-temporal neighbors. We conclude that the integration of remote sensing, a geographical information system, and spatial statistics offers an excellent opportunity to explore the spatio-temporal variation and interactions among the districts in the sprawling metropolitan areas. Relevant regulations to control the urban sprawl process are suggested accordingly.

DOI

[54]
Zipf G K, 1949. Human behavior and the principle of least effort.Journal of Clinical Psychology, 6(3): 306-306.

Outlines

/