Research Articles

Evolution and geographic effects of high-speed rail in East Asia: An accessibility approach

  • JIN Fengjun , 1, * ,
  • JIN Fengjun 1, * ,
  • QI Yuanjing 3 ,
  • YANG Yu 1
Expand
  • 1. Key Laboratory of Regional Sustainable Development Modeling, Institute of Geographic Sciences and Natural Resources Research, CAS, Beijing 100101, China;
  • 2. School of Economics and Management, Beijing Jiaotong University, Beijing 100044, China
  • 3. School of Soil and Water Conservation, Beijing Forestry University, Beijing 100083, China
*Corresponding author: Jiao Jingjuan (1988-), PhD, E-mail:

Author: Jin Fengjun (1961-), Professor, specialized in transport geography and regional development studies. E-mail:

Received date: 2016-09-07

  Accepted date: 2016-11-15

  Online published: 2017-05-10

Supported by

National Natural Science Foundation of China, No.41171107, No.41371143, No.4401121

Copyright

Journal of Geographical Sciences, All Rights Reserved

Abstract

The rapid development of high-speed rail (HSR) is influencing regional development, regional structure, commuting, and regional integration. East Asia is the region with the world’s first and largest current operating and planned HSR network. In this paper, we examine the evolutionary mechanism and impacts on the transport circle and accessibility of HSR in East Asia. The results indicate that the HSR network first follows a “core-core” model and then forms a corridor in Japan, South Korea, and China Taiwan, but then forms a complete network in China Mainland. The current operating HSR lines are mostly distributed in regions with developed economies and dense populations, and more than half of the population and GDP in China can be served by HSR within 1 hour’s travel time. The planned HSR network will expand to the western region of China and Japan and the southern region of South Korea. The development of the current operating and planned HSR network considerably enlarges the transport circle of core cities, especially cities along trunk HSR lines. This 1 h transport circle of core cities has formed continuous regions in the Yangtze River Delta, the Pearl River Delta, Tokyo, Seoul, and along trunk HSR lines. The HSR network will bring about substantial improvement in accessiblity, but also increase the inequality of nodal accessibility in China Mainland. Spatially, the spatial patterns of the weighted shortest travel time of cities in China Mainland, Japan, and South Korea all present the “core-peripheral structure”, taking Zhengzhou, Tokyo, and Seoul, respectively, as core cities, and cities located along the trunk HSR lines gain large improvement in accessibility.

Cite this article

JIN Fengjun , JIN Fengjun , QI Yuanjing , YANG Yu . Evolution and geographic effects of high-speed rail in East Asia: An accessibility approach[J]. Journal of Geographical Sciences, 2017 , 27(5) : 515 -532 . DOI: 10.1007/s11442-017-1390-8

1 Introduction

Since the first high-speed rail (HSR) route (Tokaido Shinkansen) opened in Japan in 1964, HSR has experienced a rapid development period, especially since 2000. Until 2013, there were 23,000 km HSR lines with the maximum speed greater than 250 km/h. Most of these lines were distributed in Europe (7303 km) and East Asia (14,538 km), accounting for 31.7% and 63.2% of the world capacity, respectively, according to the International Union of Railways (UIC, 2013). In 2010, the European Commission submitted a plan for the Trans-European Transport Networks (including the Trans-European HSR Networks), which aimed to improve the status of countries in HSR network, instead of being a measure to promote economic integration in Europe (Vickerman et al., 2013). However, some researchers found that the development of an integrated European HSR network would mostly promote economic integration in the continent (Gutiérrez et al., 1996; Vickerman, 1997). However, plans for an integrated HSR system in East Asia have not yet been proposed. According to the Regional Plan of the Northeastern Region of China Open to Northeast Asia submitted by the central government of China and the East Asian Community proposed by Japan, it is of vital importance to build an integrated transport network (especially an integrated HSR network) in East Asia (IA-PS, CASS, 2012).
As a result of the rapid development of HSR, research on the impacts of HSR networks has become a hot topic. At present, studies have concentrated mainly on the effects of HSR on accessibility (Jiang et al., 2010; Shaw et al., 2014), commuting behaviors (Hou et al., 2011; Wu et al., 2013), regional development (Hu and Shen, 1999; Wang, 2012), spatial structure (Wang and Ding, 2011; Wang and Lin, 2011), and competition and cooperation with other transport modes (Ding et al., 2013; Wang and Hu, 2013) at international, national, regional, and city levels. At the international scale, studies have concentrated mainly on two aspects: (1) The impacts of the European HSR network on the improvement of and disparities in accessibility. The development of integrated HSR network in Europe could generate uneven “time-space convergence” and “corridor effects”, and enhance the “core- periphery” structure (Gutiérrez et al., 1996; Gutiérrez, 2001; Vickerman, 1997; Vickerman, 1999). (2) The effects of HSR on economic integration and regional specialization, taking the operating, planned or proposed HSR networks in the Pan-Asia region, China, and Europe as cases (Cheng et al., 2015; Ma et al., 2015). At the national scale, researchers focused on exploring the time saving for travel to the national capital or regional core cities from the other cities, or even between all cities, and the impacts on accessibility (Cao et al., 2013; Chen, 2012; Jiao et al., 2014; Kim and Sultana, 2015). Although some researchers have carried out work on the impacts of HSR networks separately in China Mainland and Taiwan, South Korea, and Japan, comparative studies about the effects of HSR networks in China, South Korea, and Japan and the potential implications of the proposed integrated HSR network in East Asia are rare. Thus, this paper tries to explore the spatial patterns, spatial impacts, and evolutionary mechanisms of current operating and planned HSR networks in China, South Korea, and Japan, and lastly the potential impacts of the proposed integrated HSR network are explored.

2 Study area, data, and methodology

2.1 Study areas and data

The uniform definition of HSR in East Asia has not formed. Japan, with the world’s first HSR line, defines HSR as rail lines with a maximum speed of greater than 200 km/h (LNSR, 1971), which is broadly similar to the definition given by the UIC. The HSR network defined by the UIC in 2008 includes upgraded rail lines with a maximum speed of 200 km/h and newly-built HSR lines with a top speed of 250 km/h. In South Korea, there is no widely-accepted definition either. In this paper, both the current operating and the planned HSR networks in Japan and South Korea were digitized according to the map on the UIC website (www.uic.org). According to the Management Regulations of Railway Safety published by the State Department of China in 2014, HSR in China is defined as the newly-built passenger dedicated lines (PDLs) and intercity railways with maximum speeds of greater than 250 km/h and upgraded lines with maximum speeds of greater than 200 km/h (NRA, 2014). In China, the operating HSR network is digitized based on rail lines with G, C, and D prefix bullet trains running on, and the planned HSR network is digitized according to the ‘Mid-to-long Term Railway Network Plan,’ revised in 2008 by the Ministry of Railways (MOR).
The study area includes 333 prefecture-level divisions and four municipalities in China Mainland, seven cities and 16 counties in China Taiwan, 17 cities in South Korea (including eight provincial cities, six metropolitan cities, one city in a special self-governing province, one special city, and one metropolitan autonomous city), and 47 prefectural divisions in Japan. The administrative divisions were digitized according to the 2013 People’s Republic of Administrative Divisions Booklet, the Japan Statistical Yearbook 2013, and the South Korea Statistical Yearbook 2013. The total population and annual gross domestic product (GDP) of each study object were sourced from China’s Regional Economic Statistical Yearbook 2013, the China City Statistics Yearbook 2013, the Japan Statistics Yearbook 2013, the South Korea Statistics Yearbook 2013, and the Taiwan Statistics Yearbook 2013. The GIS database of road and rail networks in China was obtained from the Thematic Database for the Human-Earth System of the Chinese Academy of Sciences and the 1:4 M Database of the National Fundamental Geographic Information System of China, while those for Japan and South Korea were from the Open Street Map (http://www.openstreetmap.org).
Three scenarios were used to explore the potential impacts of both the currently operating and planned HSR networks on accessibility. Scenario 1 involved the transport systems with highway and rail networks in 2012; Scenario 2 contained all the transport networks in Scenario 1 and the operating HSR networks in 2012, and Scenario 3 included all the transport networks in Scenario 2 and the planned HSR networks. In addition, the change from Scenario 1 to Scenario 2 is defined as the first period, and the change from Scenario 2 to Scenario 3 as the second period.

2.2 Accessibility

Accessibility is traditionally defined as the potential opportunities for interaction (Hansen, 1959) and is widely used to explore the potential impacts of HSR (Vickerman et al., 1997). According to their function, the accessibility indicators can be divided into three types, including travel cost indicators (e.g. weighted average travel time (WATT)), daily accessibility (DA), and potential accessibility (Liu, 2007).This paper attempts to explore the impacts of HSR on accessibility from the inter-regional perspective, instead of building a new indicator. Therefore, DA and WATT are chosen in this paper to explore the impacts of HSR on the transport circle and “time-space convergence”.
2.2.1 Daily accessibility (DA)
DA measures the total population or area of economic activity that can be reached from a node within a certain travel time limit (Gutiérrez et al., 2001). DA could be used to explore the impact of HSR on the transport circle of cities and the hinterland of HSR networks (Wang et al., 2015). The DA is calculated as:
where Qi is the DA of node i and qj is the population of node j. Tij is the minimum travel time between nodes i and j (in hours), and α is the time limit, which is set as 2 hours in this paper.
2.2.2 Weighted average travel time (WATT)
WATT is an accessibility measure based on space separation. The WATT, which not only considers the relative locations of nodes but also the activities of the destinations (Gutiérrez, 2001), measures the time cost from one node to another. Nodes with a small value of WATT have good accessibility. The WATT of each node is calculated as:
where Ti is the WATT of node i, Tij is the shortest travel time between nodes i and j, and Mj is the attribute of node j, which could be GDP or population scale. In this paper, both population and GDP are chosen as the attributes of nodes, and then Mj equals the square root of population multiplied by GDP for node j.

3 Evolution of HSR

3.1 Overview of HSR network expansion

The first HSR route in East Asia, in the world even, opened in Japan in 1964. After that, HSR networks experienced a rapid development period. The extent of HSR lines with speeds of greater than 250 km/h increased from 515 km in 1964 to 12,777 km in 2012, a 24.8-fold increase (UIC, 2013). The development of HSR in East Asia can be divided into three eras, namely, the Japan period (1964-2002), the Transition period (2003-2007), and the China period (2008-) (Figure 1). The following sections discuss the overall characteristics of HSR network expansion.
(1) Japan period (1964-2002)
HSR networks in this period were all distributed in Japan, while China and South Korea had just begun to study the feasibility of HSR lines. Following the Tokaido Shinkansen, Japan then opened the Sanyo Shinkansen (1972-1975), the Tohoku Shinkansen (1982-2010), the Joetsu Shinkansen (1982), and the Hokuriku Shinkansen (1997). At the same time, South Korea completed its feasibility study on an HSR line between the largest city (Seoul) and the second largest city (Busan) in 1984 and began to build it in 1992. The MOR in China proposed the construction of an HSR line between Beijing and Shanghai in 1990, published the Preliminary Research Report of Economic and Technical Problems of the Beijing-Shanghai HSR line in1993, and finished the feasibility study report of the Beijing-Shanghai HSR line in 1998. Meanwhile, the MOR implemented the first, second, third, and fourth Railway Speed Up Campaigns, which led to some rail lines upgraded into the lines with speeds of greater than 160 km/h, such as the Guangzhou-Shenzhen rail line and the Beijing-Shanghai rail line. By 2002 in Japan there was 2335 km of HSR lines with speeds of greater than 250 km/h (accounting for 30.8% of the world’s total). During this period, the spatial expansion of HSR in Japan presented a “core-core” pattern and then formed a corridor in the east of the country.
(2) Transition period (2003-2007)
During this period, the HSR network was still mostly distributed in Japan, but both China and South Korea had begun to open their HSR lines. Japan continued to extend the corridor in the east by opening the Kyushu Shinkansen between Shin Yasuhiro and Kagoshima Chuo in 2004. In 2003, China opened its first HSR line between Shenyang and Qinhuangdao, which was followed by the opening of the HSR line between Taipei and Tsoying in China Taiwan. South Korea opened its first HSR route in 2004, which was one part of the full proposed HSR line. During this period, the MOR in China continued to implement the fifth and sixth Railway Speed Up Campaigns in 2004 and 2007. After that, train speeds reached 200 km/h on the main sections of the Beijing-Guangzhou, Beijing-Harbin, Beijing-Shanghai, Lianyungang-Lanzhou, Wuhan-Guangzhou, Jinan-Qingdao, Guangzhou-Shenzhen, and Hangzhou-Zhuzhou rail lines. By the end of 2007, the extent of HSR lines with speeds of greater than 250 km/h had increased to 2452 km in Japan, 750 km in China, and 330 km in South Korea. Spatially, these HSR networks presented a “core-core” pattern in China Mainland and South Korea, but a corridor pattern in Japan and China Taiwan.
(3) China period (2008-)
China replaced Japan as the country with the largest operating HSR network in East Asia, and also in the world. During this period, Japan had just opened the Kyushu Shinkansen (Hakata-Shin-Yatsushiro, 82 km), the Tohoku Shinkansen (New Hachinohe-Aomori, 130 km), and South Korea had opened the second part of the proposed HSR lines (Daegu-Pusan, 82 km), while the HSR network in China expanded rapidly. In 2008, China opened its first newly-built HSR line between Beijing and Tianjin with a maximum speed of 350 km/h. Following this, China opened Jinan-Qingdao, Wuhan-Guangzhou, Beijing-Shanghai, Hefei-Wuhan, Zhengzhou-Xi’an, Fuzhou-Xiamen, Shanghai-Nanjing, Nanchang-Jiujiang, Shanghai-Hangzhou, Dalian-Harbin, Beijing-Wuhan, and other HSR lines. By the end of 2013, there were 11,477 km HSR lines with speeds of greater than 250 km/h in China, 2664 km in Japan, and 412 km in South Korea. Spatially, the HSR network in China Mainland had formed a complete network in the eastern and central regions and began to expand westward, whereas those in Japan and South Korea continued to extend their HSR corridors. According to the HSR plans for East Asia, the extent of the HSR network could reach 41,000 km in China, 3622 km in Japan, and 708 km in South Korea by the end of the planning period. East Asia has become the region with the largest operating and planned HSR networks in the world.

3.2 Spatial patterns of the HSR service hinterland

To better understand the distribution patterns of HSR networks, in this paper we introduce the measure about the hinterland of HSR lines (Wang et al., 2015). The results are presented in Table 1 and Figure 2. The development of the HSR lines enlarged to a great degree the
service hinterland of the HSR network in East Asia, especially in China, while the service hinterland of the HSR network had higher coverage rates for cities, population, and GDP than that for the area. In 2012, 13.6% of areas, 50.1% of cities, 62.9% of population, and 75.2% of GDP in East Asia were accessible to HSR stations within 1 hour’s travel time, which increased to 24.8%, 73.1%, 84.4%, and 83.8% with the opening of the planned HSR lines. A similar trend could be found for the 2 h service hinterland of HSR lines. At the country level, the 1 h service hinterland of operating HSR lines in Japan had the highest coverage rate compared with those in the other two countries, whereas China will eventually achieve the highest coverage rate in Scenario 3 on the number of cities, population scale, and GDP. Regarding the 2 h service hinterland, South Korea will achieve the highest coverage rate in Scenario 3. Overall, the development of the HSR network will lead to much larger areas, more cities, population, and GDP accessible to HSR stations, but the service hinterland of HSR still has a higher coverage rate for GDP and population than for area. China has the highest coverage rate of service hinterland concerning population and GDP, while South Korea ranks the highest with respect to area. The reason might be that the operating HSR network is distributed mainly in regions with developed economies and dense population (e.g., the eastern region of China), while the planned HSR network will begin to expand into the western region of China Mainland and Japan and the northern part of South Korea.
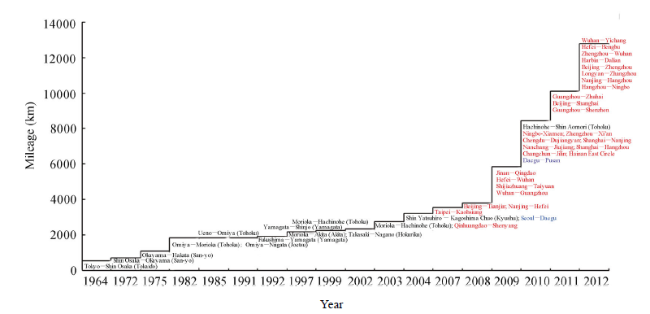
Figure 1 Chronology of High-Speed Railway (HSR) operation in East Asia^Note: HSR lines named in black are located in Japan, those in red are located in China, and those in blue are located in South Korea.
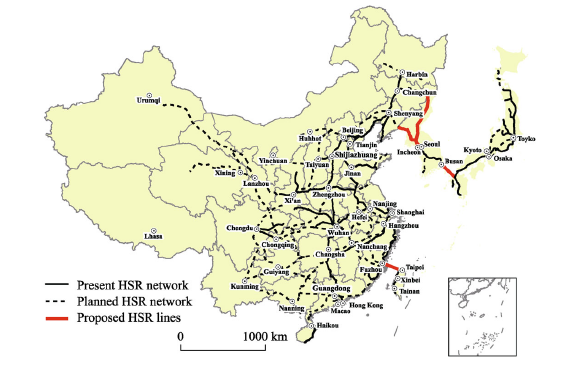
Figure 2 Spatial distribution of current operating, planned and proposed HSR networks in East Asia
Table 1 Socioeconomic attributes of areas covered by operating and planned HSR stations within 1 and 2 hours
Travel time East Asia China Japan South Korea
Number Percentage (%) Number Percentage (%) Number Percentage (%) Number Percent-
age (%)
1 h of operating HSR stations Area (104 km2) 135.8 13.6 111.3 11.7 19.8 53.0 5 47.0
No. of cities 214 51.0 174 48.7 31 66.0 9 56.3
Population
(million persons)
967.7 63.0 829.4 61.0 101.6 79.0 36.6 74.0
GDP (billion dollar) 12,066 75.2 6523 72.9 4685 79.3 858 71.9
2 h of operating HSR stations Area (104 km2) 257 25.9 224 23.6 26 69.1 8.1 80.7
No. of cities 281 66.9 229 64.2 38 80.9 14 87.5
Population
(million persons)
1204.4 78.3 1047.4 77.0 110.5 86.3 46.5 93.4
GDP (billion dollar) 13,901.8 86.6 7687.1 85.9 5097.8 86.3 1116.9 93.6
1 h of operating and planned HSR stations Area (104 km2) 247 24.8 219 23.1 23 61.2 5 47.0
No. of cities 307 73.1 265 74.2 33 70.2 9 56.3
Population
(million persons)
1298.7 84.4 1158.3 85.1 103.9 81.1 36.6 73.6
GDP (billion dollar) 13,447.8 83.8 7782.7 87.0 4789.3 81.1 875.8 73.6
2 h of operating and planned HSR stations Area (104 km2) 424 42.6 3867 40.7 30 79.2 8.1 80.8
No. of cities 357 85.0 303 84.9 40 85.1 14 87.5
Population
(million persons)
1431.9 93.1 1268.2 93.2 117.2 91.5 46.5 93.4
GDP (billion dollar) 15,044.5 93.7 8525.3 95.3 5405.7 91.5 1113.5 93.3

Note: The areas are 1 h or 2 h actual accessible areas surrounding the HSR by road traffic simulation.

The HSR network has covered most of the megacities and very large cities in municipal districts with a population of more than 3 million persons (see Table 2). The 1 h service hinterland of operating HSR lines covers all cities with a population of more than 10 million (including Tokyo, Osaka, Beijing, Shanghai, and Chongqing) and between 3 and 10 million except for Shanwei in Guangdong Province, 60% of cities with a population between 1 and 3 million, 50.74% of cities with a population between 0.5 and 1 million, and 19.61% of cities with a population below 0.5 million. A similar trend could be found for the 2 h service hinterland of the operating HSR network. As the HSR network in East Asia develops further, the coverage of the 1 h service hinterland in Scenario 3 will increase considerably, in particular for cities with a population below 0.5 million. The percentage of cities with a population below 0.5 million in Scenario 3 has risen to 47.06%, which is still the lowest coverage, compared with the other categories by population size.
Table 2 Percentage of socioeconomic attributes of cities covered by current and planned HSR stations within 1 and 2 hours (%)
Population (104 persons) <50 50-100 100-300 300-1000 >1000
Current HSR stations No. of cities 19.61 50.74 63.33 96.30 100
1 h Population 29.06 53.80 63.44 97.52 100
GDP 53.75 57.10 82.45 96.79 100
No. of cities 35.29 67.65 81.33 96.30 100
2 h Population 49.49 71.25 82.70 97.52 100
GDP 78.65 80.55 90.99 96.79 100
Planned HSR stations No. of cities 47.06 73.53 86.00 96.30 100
1 h Population 62.65 80.62 88.64 97.52 100
GDP 65.88 72.43 90.02 96.79 100
No. of cities 63.73 86.76 96.00 96.30 100
2 h Population 77.99 91.36 97.04 97.52 100
GDP 90.15 91.90 95.36 96.79 100

Note: The numbers of cities with populations less than 0.5 million persons, between 0.5 and 1, between 1 and 3, between 3 and 10, and greater than 10 million are 102, 139, 147, 27, and 5, respectively; the units of population and GDP are the same as Table 1.

3.3 Evolutionary patterns

Similar to the evolutionary and spatial patterns of HSR in East Asia, the common patterns can be summarized as the “corridor model”, the “hybrid model”, and the “network model”, as found in a previous study by Perl and Goetz (2015) (Figure 3).
(1) The corridor model. The HSR lines in the corridor model tend first to be distributed among core cities with large populations and then to continue to expand along trunk corridors. Commonly, the evolutionary patterns of HSR lines are first influenced by increasing demand between core cities or between core cities and secondary cities in the same administrative divisions, such as the HSR lines between Zhengzhou and Xi’an, between Shijiazhuang and Taiyuan, between Wuhan and Guangzhou, between Beijing and Shanghai, between Tokyo and Osaka, between Seoul and Busan, and so on. Following on from this, the smaller cities along these HSR lines tend to receive a large boost to their economies, which promotes the formation and development of economic belts.
(2) The hybrid model. The HSR lines in this model tend to connect core cities with other cities surrounding them, which spatially forms the “hybrid model”. This model is mostly located in urban agglomerations, such as the Yangtze River Delta, the Pearl River Delta, the Wuhan Megalopolis, and the Central Plains Economic Region, which enhances the economic linkages between cities and promotes regional integration in these regions.
(3) The network model. Influenced by national areas, the equalization of transport infrastructure, and national strategy, the HSR lines tended to form a complete network in some countries. China would build an HSR network with four horizontal and four vertical PDLs according to the ‘Mid-to-long Term Railway Network Plan (revised in 2008)’. There is a large scale of planned HSR to be constructed in the western region of China, although the western region has high construction costs of HSR, lack of passenger demand, a poor economy, and low population density.
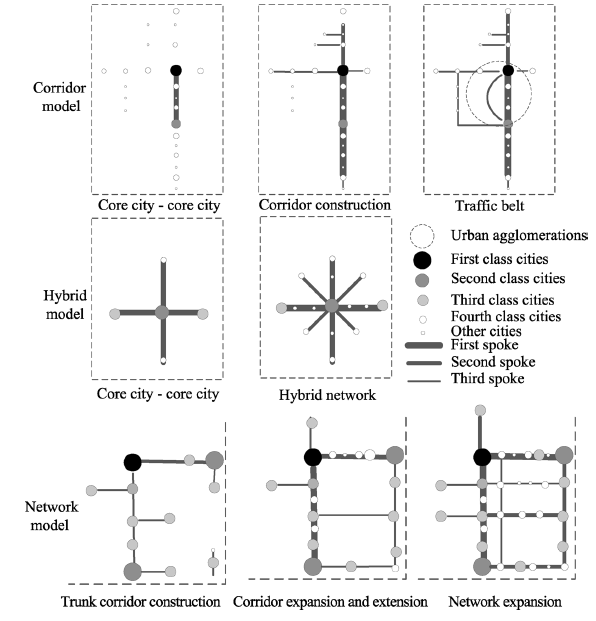
Figure 3 Spatial development model for the HSR networks in East Asia
Overall, the evolutionary patterns of HSR lines in Japan, South Korea, and China Taiwan all present the “corridor model”, while that in China Mainland shows the “network model” at the national scale, the “corridor model” at the regional scale, and the “hybrid model” in some urban agglomerations.

4 Spatial impacts of the HSR networks

4.1 Daily accessibility

The development of the HSR networks enlarges the 1 h and 2 h transport circle of cities, and the 2 h transport circle has formed continuous regions along the trunk HSR lines in Scenario 2 and will expand to much larger areas in Scenario 3 (Figure 4). Cities being located in the 1 h transport circle of a particular city means that the city can reach the particular city within 1 hour. And 1 hour is commonly regarded as the maximum time limit for commuters traveling between work place and home. The development of operating HSR lines has led to the number of city pairs within a 2 h round trip increasing from 159 (0.28% of the total) to 349 in China Mainland, from 25 (14.6% of the total) to 40 in China Taiwan, from 3 (0.3% of the total) to 7 in Japan, and from 9 (8.57% of the total) to 15 in South Korea. Spatially, the 1 h transport circle of cities distributed discretely in Scenario 1 and had formed continuous regions in the Yangtze River Delta, the Pearl River Delta, the Chengdu-Chongqing
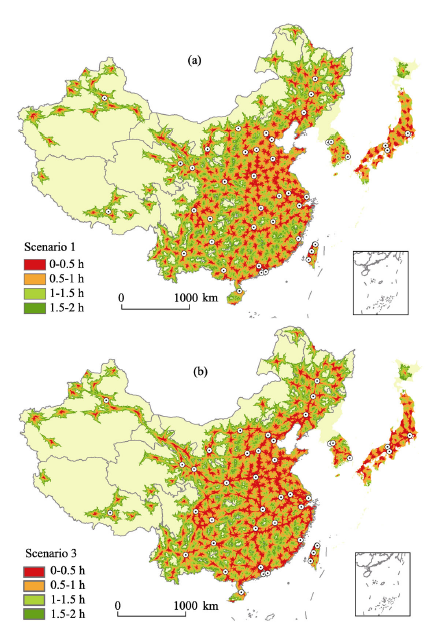
Figure 4 Spatial distribution of transport circles of cities in East Asia
Economic Zone, the Wuhan City Circle in China’s Mainland, or around Tokyo or the southern region of South Korea and the east of China Taiwan in Scenario 2. Cities being located in the 2 h transport circle of a particular city means that the city pairs can be reached each other within 2 hours, which is commonly accepted as the maximum time limit for traveling to engage in recreational activities or short vacations. The 2 h transport circle of cities has formed continuous regions in the east of China Mainland and Japan, in China Taiwan, and the northern part of South Korea in Scenario 2, and will expand to the west of China Mainland and Japan, and the southern part of South Korea in Scenario 3. Cities being located in the 4 h transport circle of a particular city means that the city pairs can be traversed within 8 hours, which could allow for possible day trips between cities. All of the city pairs in South Korea and China Taiwan could be traversed within 8 h. Comparing with Scenario 1, the city pairs could reach each other within 4 h increasing from 349 to 476 in China Mainland, from 7 to 14 in Japan, from 15 to 17 in South Korea in Scenario 3.
The development of the HSR networks primarily increases the DA of cities in China Mainland and Taiwan, Japan, and South Korea, but increases the nodal disparity of daily accessibility in China Mainland and decreases that in Japan, South Korea, and China Taiwan (Table 3). As a result of the deployed HSR network, South Korea saw the greatest increase in DA (65.2%), followed by Japan (63.5%), China Mainland (54.59%), and China Taiwan (39.03%), while China Mainland will be the largest beneficiary in terms of DA under Scenario 3 compared with Scenario 1. Overall, DA was improved much more in the first period than in the second period, and China Mainland saw the greatest increase in DA. Meanwhile, the coefficients of variation (CVs) of DA in China Mainland rose from 0.8 in Scenario 1 to 0.91 in Scenario 2, but then decreased to 0.81 in Scenario 3, whereas those in Japan, South Korea, and China Taiwan decreased in both the first and second periods. Spatially, the cities with high DA were mostly located in Chongqing, Henan, Shandong, Hebei, Jiangsu and Sichuan provinces in Scenario 1 and most of these regions had high population density. In Scenario 3, the cities with high DA will expand to the Chengdu-Chongqing Economic Zone and the regions along the trunk HSR lines, especially the Beijing-Guangzhou and Beijing-Shanghai PDLs. The cities with a greater increase in DA (Sce nario 3/1) are located at the intersection of the trunk HSR (e.g. Zhengzhou) lines or around cities with large populations (e.g. Beijing, Chengdu, Shanghai, and Tokyo) (Figure 5).
Table 3 Statistical characteristics of daily accessibility and weighted shortest travel time in East Asia
Indicators Regions Mean (104 persons (DA) or hours (WATT)) Change (%) Coefficient of variation
Without HSR network Current HSR network Planned HSR network Without/
current
HSR
network
Current/
planned
HSR
network
Without/
planned HSR
network
Without HSR
network
Current HSR network Planned HSR network
Daily accessibility China Mainland 3,364 5,200 6,684 54.59 28.52 98.68 0.800 0.910 0.810
China Taiwan 1,065 1,481 1,481 39.03 0.00 39.03 0.451 0.447 0.447
Japan 1,865 3,051 3,595 63.6 17.82 92.76 0.830 0.674 0.673
South Korea 1,678 2,772 3,295 65.2 18.86 96.35 0.598 0.531 0.429
Weighted shortest travel time China Mainland 16.19 11.28 9.39 -30.31 -16.78 -42.00 0.410 0.570 0.520
China Taiwan 1.92 1.45 1.45 -24.78 0.00 -24.78 0.270 0.380 0.380
Japan 7.57 4.35 3.81 -42.48 -12.50 -49.67 0.361 0.360 0.340
South Korea 1.99 1.59 1.52 -20.28 -4.51 -23.88 0.200 0.240 0.220

4.2 Time-space convergence

The development of the HSR lines leads to an uneven “time-space convergence” in China Mainland and Taiwan, and South Korea, with accessibility decreasing and its disparities increasing (Table 3). During the first period, Japan saw the greatest decrease (42.5%), followed by China Mainland (30.3%), China Taiwan (24.78%), and South Korea (20.28%), whereas China Mainland will get the largest decrease in WATT, followed by Japan, South Korea, and China Taiwan. Compared with that in Scenario 1, the country with the greatest decrease in WATT is Japan, which is different from that in terms of DA in Scenario 3. The development of HSR lines will increase the disparities of WATT in China Mainland, China Taiwan, and South Korea, but decrease that in Japan. The CVs of WATT in China Mainland, South Korea, and China Taiwan increased largely during the first period and decreased slightly during the second period, but rose overall, whereas that in Japan fell during both the first and second periods. Specifically, the CVs of WATT in China Mainland increased from 0.41 in Scenario 1 to 0.57 in Scenario 2, and then decreased to 0.52 in Scenario 3. At the same time, the CVs in Japan fell from 0.361 to 0.36, and then to 0.34.
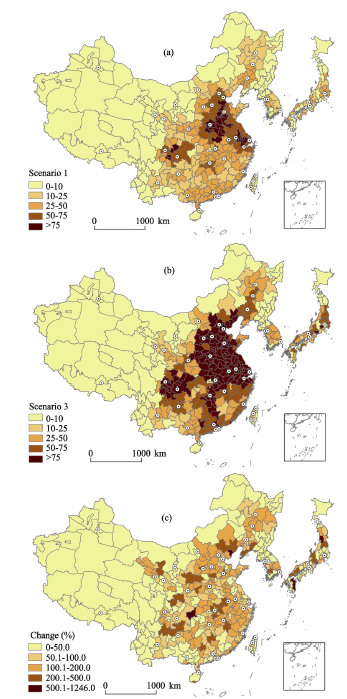
Figure 5 Spatial distribution of daily accessibility and its increase in East Asia
Spatially, the cities with the lowest WATT in China Mainland, South Korea, and Japan were mostly located around the geometric center of transport network, while those in China Taiwan were located mostly along the corridor between Taipei and Tainan (Figure 6). The
WATT contours in China Mainland, South Korea, and Japan revealed a concentric pattern around Zhengzhou in China Mainland, around Seoul in South Korea, and around Tokyo in Japan, whereas those in China Taiwan presented a spatially banded structure in Scenario 1. Along with the devleopment of the current operating and planned HSR network, the WATT contour will stretch along the trunk HSR lines, such as the Beijing-Shanghai, Beijing- Guangzhou, and the Beijing-Harbin PDLs in China Mainland, the Tokyo-Osaka Shinkansen HSR lines in Japan, and the Seoul-Pusan HSR line in South Korea. In other words, cities located along the trunk HSR lines saw a greater increase in accessibility than other cities, which could be defined as “corridor effects” (Shaw et al., 2014). Compared with Scenario 1, cities whose WATT decreased by more than 55% in China Mainland were located mainly along the Beijing-Shanghai, Beijing-Guangzhou, Beijing-Harbin, Lianyungang-Lanzhou, and Shanghai-Shenzhen PDLs in Scenario 3. Those in Japan are located mainly along the Tokyo-Osaka Shinkansen HSR lines. Although cities in South Korea and China Taiwan see a low decrease in WATT, the decrease in WATT also reveal the “corridor effect,” with cities along the HSR lines experiencing greater deduce.
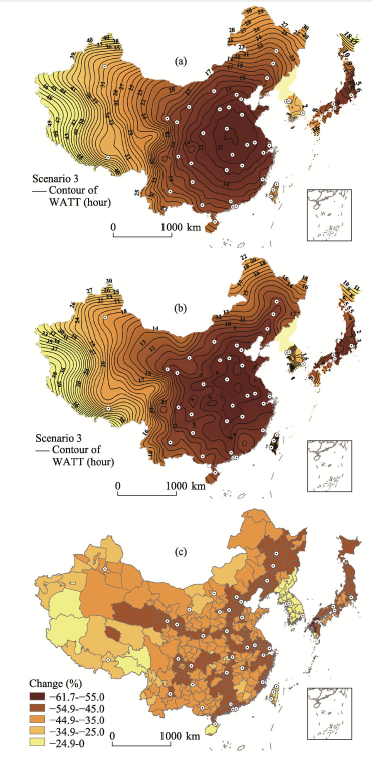
Figure 6 Spatial distribution of WATT and its increases in East Asia

4.3 Impacts of integrated HSR networks

In the ‘going global strategy’ of HSR, proposed by the Chinese Government in 2009, the central government planned to invest in a series of trans-continental HSR lines throughout Asia and Europe, including the Eurasian HSR line, the Central Asia HSR line, and the Pan- Asia HSR line, which would connect most of the countries in Europe and Asia. Meanwhile, some experts also proposed the HSR lines connecting North Korea, South Korea, and Japan (termed East Asia HSR lines in this paper). The East Asia HSR lines include the HSR lines between Fukuoka, Japan and Busan, South Korea (about 210 km), between Seoul, South Korea and Dandong, China, passing by Pyongyang, North Korea (about 400 km), between Pyongyang, North Korea and Yanji, China, and between Taipei in Taiwan and Fuzhou in Fujian province (about 210 km). In this section, we try to explore the impacts of the potential integrated HSR network on accessibility.
The development of an integrated HSR network will substantially shorten travel time between core cities in different countries of East Asia and promote regional integration (Figure 7). Integrated HSR lines make it possible to travel by rail between Shenyang, China, and Seoul, South Korea within 3 h, between Seoul and Tokyo, Japan within 4 h, and between Shenyang, China and Tokyo, Japan within 7 h. Meanwhile, the opening of integrated HSR lines will also substantially improve accessibility and connectivity, especially of the “gateway cities”. In general, the integrated HSR lines could largely promote the passengers and goods traveling via integrated HSR lines concentrating in gateway cities, thus catalyzing the economic development of gateway cities. Also, the development of integrated HSR lines would enhance the social, economic, and cultural exchanges among China, Japan and South Korea. Specifically, all the passengers and goods by Seoul-Dandong HSR lines should be transferred at the gateway cities, such as Dandong and Yanji in China, Busan in South Korea, and Fukuoka in Japan. In addition, the development of an integrated HSR network will lead to the 2 h transport circle forming a continuous region in South Korea, Japan, and the northeastern region of China.
Figure 7 Spatial distribution of the transport circle of cities in the scenario with an integrated HSR network

5 Evolutionary mechanism of HSR

The expansion and impacts of HSR are mostly influenced by natural environmental conditions, by socioeconomic conditions, and by development strategies and plans. Regional natural
environmental conditions mainly affect the costs of HSR’s construction and technology; socioeconomic conditions influence other expenses (especially land acquisition costs) and the supply of passengers for HSR lines; development strategies and plans mostly affect the construction scheme and fund sources of HSR’s construction.

5.1 Natural environmental conditions

Natural environmental conditions directly affect the construction of HSR networks, especially the types, scale, technology hierarchy, and spatial patterns of HSR networks (Jin, 2013).
(1) The construction costs of HSR networks are widely influenced by the design speed, track standard, terrain, weather conditions, land acquisition costs, the need for viaducts instead of subgrades, the need for large river-crossing bridges, the construction costs of HSR stations, etc. The construction costs in regions with excellent natural conditions are lower than those of other regions. Thus, the construction costs of HSR in the east of China might be lower than that in the western region, just considering the natural environmental conditions.
(2) The curve radii and limiting grades of HSR lines, which are mainly influenced by natural conditions, have quite different requirements in HSR technology. Regarding the natural environmental conditions in East Asia (Figure 8), the terrain is mostly rugged and mountainous in Japan and the western region of China, which requires quite different HSR’s technology with the other places.
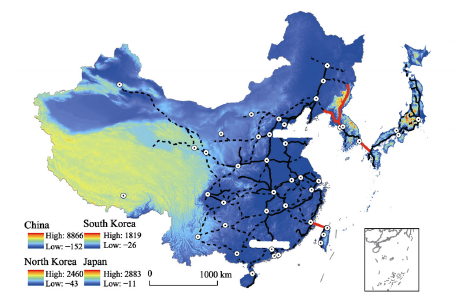
Figure 8 Distribution of HSR networks and natural conditions

5.2 Socioeconomic conditions

The socioeconomic factors influencing the expansion and impacts of HSR systems in East Asia include the following two types.
(1) Population scale and economy of cities along HSR lines. The areas with developed economies and dense populations usually require high land acquisition costs. Some local governments choose to build viaducts instead of subgrades to reduce the demand for land use, which would influence the technical costs of HSR lines. Both the high land acquisition costs and the extra technical costs would increase the total construction costs of HSR lines in the areas with developed economies and dense population. However, these areas could also provide enough passengers for HSR networks, which might be greater than the minimum demand to generate a profit. For example, the three profitable HSR lines in 2011, including the HSR lines between Paris and Lille, between Beijing and Shanghai, and the Tokaido Shinkansen, are all located in areas with developed economies and dense population. In other words, it might be much more profitable to build HSR lines in eastern and central China than in western China.
(2) Competition and cooperation between HSR and other modes of transport. Commonly, HSR lines could serve as regional feeders for airports rather than as intercity services, which might increase the passengers of HSR lines. Also, the HSR lines could be competitive with other modes of transport, especially the air transport. The development of low-cost Airlines might accelerate the competition between HSR and air transport for passengers.

5.3 Development strategies and plans

Government-oriented and market-oriented development strategies of HSR lines are also important influencing factors in the expansion of and profits made by HSR networks. Government-oriented development strategies are intended to ensure that it is much easier to raise sufficient funds for the construction of HSR lines at a short time. Under the guidance of market-oriented development strategies, the operating timetable of HSR network could be adjusted according to market demand, which mostly improves the efficiency of the network and increases HSR profits. In other words, it is important to follow government-oriented development strategies during the construction period and market-oriented development strategy during the operating period. In Japan, the building of HSR lines was first guided by government-oriented policies before 1988 and then by market-oriented development strategy. The development of an HSR network in China Taiwan obeys the rules of a transit-oriented development (TOD) model during both the construction and operation periods, whereas that in South Korea obeys the public-private partnership (PPP) model. Most of the HSR lines in China Mainland, except for the HSR line between Qingdao and Jinan, are guided by government-oriented development strategies during both the construction and operating periods, which could be the main reason for the rapid expansion of HSR. The Chinese Government plays an important role in the rapid development of HSR by submitting some active financial strategies and plans. For example, in the “stimulating economic development by investment” strategies, the Chinese Government invested 660 billion yuan during 1998-2002 and a 4 trillion yuan in 2009-2010 to combat the Asian financial crisis of 1998 and the global financial crisis of 2007-2008. About 40% of the 4 trillion yuan was used to construct transport infrastructure.

6 Conclusions

East Asia not only boasts the world’s first HSR line, but also the largest current operating and planned HSR network in the world. This paper has examined the impacts of HSR in East Asia from the perspective of accessibility and transport circle. The results are summarized as following:
(1) The evolution of the HSR network in East Asia presented a “core-core” pattern in the early years, followed by a “core-network” model more recently. The HSR lines first tended to be located in regions with developed economies and dense population and then expanded to other regions, such as western China. The evolution of the HSR networks can be divided into three periods: the Japan period (1964-2002), the Transition period (2003-2007), and the China period (2008-). During the latter period, China replaced Japan as the country with the largest operating HSR network in the world.
(2) The rapid development of HSR lines in East Asia substantially enlarges the transport circle of core cities and promotes the transport circle of some core cities from contiguous regions. Spatially, the 1 h transport circle of core cities formed the beaded regions in Scenario 1 and then formed contiguous regions in the Yangtze River Delta, the Pearl River Delta, and the Beijing-Tianjin-Hebei region in Scenario 2.
(3) The development of the HSR network generated uneven time-space convergence,with the uneven improvement in accessibility. Cities located along the trunk HSR lines saw a greater increase in WATT, while cities with developed economies and dense population saw greater increases in DA. The accessibility gets higher increase as for the development of current operating HSR network than that for the planed HSR network. The HSR network would increase the inequality of nodal accessibility in China Mainland, but decrease that in Japan, China Taiwan and South Korea.
(4) The development of the integrated HSR lines in East Asia could largely shorten the travel time between the core cities in China, Japan and South Korea, but also enlarge the transport circle of cities in South Korea, Japan, and Northeast China. However, the impacts of the integrated HSR network in East Asia are smaller than those of the HSR network at national scale. Also, there are many challengers for the integrated HSR network, such as the factors for geopolitics and cost-benefit rate of the HSR lines. Thus, further studies are needed for the integrated HSR network in East Asia.

The authors have declared that no competing interests exist.

[1]
Cao J, Liu X, Wang Yet al., 2013. Accessibility impacts of China’s high-speed rail network.Journal of Transport Geography, 28: 12-21.The large-scale implementation of High-Speed Rail (HSR) network in China not only offers a new option for travelers- mode choice, but also may influence, or even generate, the redistribution of demographic and economic activities. As has been observed over the past several years in other countries, the impact of HSR spans a wide range. However, few quantitative studies have been conducted to measure this impact. As a new attempt, this study uses accessibility analysis for quantifying the impact of China HSR network. Weighted average travel times and travel costs, contour measures, and potential accessibility are employed as indicators of accessibility at the macro or national level. Forty-nine major cities in the HSR network are used in the accessibility analysis. Accessibility quantification and spatial distribution analysis for the study cities are performed on a Geographical Information System (GIS) platform. Accessibilities associated with varying availabilities of HSR, conventional rail, and airline are estimated and compared. The selected indicators and computational methods are found effective in evaluating the accessibility impacts of HSR from different conceptualization strategies and perspectives. They also offer complementary information on accessibility capacity of the study cities created by the HSR network.

DOI

[2]
Chen C-L, 2012. Reshaping Chinese space-economy through high-speed trains: Opportunities and challenges.Journal of Transport Geography, 22(5): 312-316.78 The introduction of Chinese high-speed train development and approaches. 78Chinese spatial development strategies and anticipated regional and urban impacts. 78 Key challenges in reshaping Chinese space economy through high-speed trains at regional and urban scales.

DOI

[3]
Cheng Y, Loo B P Y, Vickerman R, 2015. High-speed rail networks, economic integration and regional specialization in China and Europe.Travel Behaviour and Society, 2(1): 1-14.The role of transport in the process of economic development and integration remains an area of controversy. Policy makers, faced with the claim that the cost of high-speed rail (HSR) makes it an expensive way of achieving the supposed benefits, seek to identify wider economic impacts through productivity gains as a justification. This paper explores the development of HSR as an instrument for promoting economic integration both through enhancing competitiveness and achieving greater economic cohesion in China and the European Union. The paper examines changes in accessibility and provides evidence on changes in specialisation for both main cities and their hinterlands. The evidence confirms that impacts differ widely and that the process of convergence and divergence differs at different stages of economic development.

DOI

[4]
Ding J, Jin F, Wang Jet al., 2013. Competition game of high-speed rail and civil aviation and its spatial effect: A case study of Beijing-Shanghai high-speed rail. Economic Geography, 33(5): 104-110.The development of high-speed rail had a serious impact on air transport.It is great significant to research the competitive relationship between high-speed railway and civil aviation on the background of rapid development of high-speed railway in China.By considered the indicators effectiveness of economic,speed,comfortable,convenient and safety,this paper used market share model to calculate the market share situation of high-speed rail and air transport in different transport distance.The results showed that 500-900km is a significant distance for the competition game of high-speed rail and air transport,and 692km is a market boundary distance for high-speed rail and air transport.Taking Beijing-Shanghai high-speed rail for example,by analyzing the relationship of airports-ize and location,we can get the general competition rules between high-speed rail and air transport: high-speed rail impact on small city airport is greater than the large city airport,and the impact on the city airport of middle zone is greater than the both ends.On this basis,this paper analyzed the spatial effect caused by competition of high-speed railway and civil aviation for quantitative and qualitative.The conclusion showed that competition between high-speed railway and civil aviation will lead regional spatial structure and regional development advantages to change inevitably,and make regional economic development more balanced.

[5]
Gutiérrez J, 2001. Location, economic potential and daily accessibility: An analysis of the accessibility impact of the high-speed line Madrid-Barcelona-French border.Journal of Transport Geography, 9: 229-242.This paper evaluates the accessibility impact of the future Madrid–Barcelona–French border high-speed line. Accessibility impact of the new infrastructure is measured by means of three indicators: weighted average travel times, economic potential and daily accessibility. These indicators respond to different conceptualizations and offer complementary information about the issue accessibility. The results are quite different: very concentrated effects in the daily accessibility indicator, less concentrated in the economic potential one and more dispersal in the location indicator. The sign (polarizing/balancing) of these effects depend on the geographic scale: polarizing effects at the national level and balancing effects at both corridor and European levels are identified. A geographic information system (GIS) was used to carry out this study.

DOI

[6]
Gutiérrez J, González R, Gómez G, 1996. The European high-speed train network: Predicted effects on accessibility patterns.Journal of Transport Geography, 4(4): 227-238.

[7]
Hansen W G, 1959. How accessibility shapes land-use.Journal of The American Planning Association, 25(2):73-76.An empirical examination of the residential development patterns illustrates that accessibility and the availability of vacant developable land can be used as the basis of a residential land use model. The author presents an operational definition and suggests a method for determining accessibility patterns within metropolitan areas. This is a process of distributing forecasted metropolitan population to small areas within the metropolitan region. Although the model presented is not yet sufficiently well refined for estimating purposes, the concept and the approach may be potentially useful tools for metropolitan planning purposes.

DOI

[8]
Hou X, Liu S, Zhang Wet al., 2011. Characteristics of commuting behaviors between Beijing and Tianjin influenced by high-speed trains.Economic Geography, 31(9): 1573-1579. (in Chinese)According to summarize and analysis of 1400 questionnaires,the author have achieved some conclusions with GIS and methods of social statistic from five parts.The five parts include the way of intercity commuting,the frequency of intercity commuting,the requirement of intercity commuting,the time and location of intercity commuting and the space feeling of intercity commuting.Then,the author conclude the characteristics of intercity behaviors and its changes with different individual attributions.The research show that HST has changed the construction of intercity commuting ways,strengthen the frequency of intercity commuting,and influenced the people's space feeling of intercity commuting,which make people produce some ideas to live in one city and job in another city.And more and more people could accept the life style of job and live separated.

[9]
Hu T, Shen J, 1999. Analysis of the effects of the Jing-Hu high-speed railway on regional economic development.Economic Geography, 19(5): 101-104. (in Chinese)

[10]
Institute of Asia-PacificStudies,Chinese Academy of Social Sciences(IA-PA,CASS),2012. Blue Book of Asia-Pacific • Annual Report on the Development of Asia-Pacific. Beijing: Social Sciences Academic Press (China). (in Chinese)

[11]
Jiang H, Xu J, Qi Y, 2010. The influence of the Beijing-Shanghai high-speed railway on land accessibility of regional center cities.Acta Geographica Sinica, 65(10): 1287-1298. (in Chinese)<p>Since some limitations existed in the current accessibility method, integrated method of network analysis and cost weighted raster analysis were designed and applied to generate city isochronous rings after the operation of high-speed railways. The valuation of accessibility was conducted with three indicators, i.e. daily accessibility, potential model, and weighted average time. After the valuation, differences between accessibility patterns with scenarios with and without high-speed railways were analyzed, and influences of the high-speed railways on center cities' accessibility were discussed. Changes in hinterlands of the center cities were also calculated with field intensity model. The results indicated that high-speed railways would expand the isochronous rings, and realize significant optimization of urban daily accessibility and form uneven time convergence space. Sites along the high-speed railways became the biggest beneficiaries of time convergence, as the variability of their weighted average time and potential values were high. In different geographical scales, the high-speed railways reduced the equilibrium of weighted average time, and their influences on the equilibrium of potential values are inconsistent. The high-speed railways would expand the hinterlands of Beijing and Shanghai, and strengthen their regional influences. As accessibility changes differed in different regions, the industrial structure should be adjusted in regions with high accessibility variability, while regions with low accessibility variability should improve rapid transit networks, and increase accessibility by strengthening their links with high-speed railways.</p>

[12]
Jiao J, Wang J, Jin Fet al., 2014. Impacts on accessibility of present and planned HSR network in China.Journal of Transport Geography, 40: 132-132.

[13]
Jin Fengjun, 2013. Infrastructure System and Socio-economic Spatial Organization. Beijing: Science Press. (in Chinese)

[14]
Kim H, Sultana S, 2015. The impacts of high-speed rail extensions on accessibility and spatial equity changes in South Korea from 2004-2008.Journal of Transport Geography, 45: 48-61.The construction of South Korean High-Speed Rail (HSR) or Korea Train eXpress (KTX) has been evolving in phases since its first operation in 2004. This development raises concerns whether the benefits from the extended HSR network would again be limited to the initial HSR corridors and will deepen the inequalities in accessibility with the rising issue of uneven regional development of the country. This paper measures the accessibility of each stage of HSR network extension and evaluates its spatial distribution, variation, and changes using weighted averaged travel time and potential accessibility indicators. The results of this study find different accessibility impacts from each stage of HSR extension. Although travel-time reduction and increased attractions have been widened in more cities by each HSR extension, the spatial equity is degenerated by the extension in 2010/2011 as the improvement of accessibility has been concentrated in cities along the primary HSR corridor near the already-advantageous Seoul capital area. In contrast, the future HSR extension in 2018 will enhance equitable accessibility to the isolated regions such as the northeast and the southwest regions of the country. However, the relative degree of accessibility improvement will not be large enough for increasing the spatial equity of accessibility without more extended HSR networks between provinces.

DOI

[15]
Law of Nation Shinkansen Railway (LNSR), 1970. Law, No.71. May 18.

[16]
Liu X, 2007. General description of spatial accessibility.Urban Transport of China, 15(6): 36-43 (in Chinese).It's been observed that different understanding on accessibility occurs.In order to have a full yet clear picture of the concept,this paper starts with a literature review on its fundamental implications and evaluation methods published both at home and abroad.In general,the methods to percept and evaluate accessibility can be categorized into three:spatial separation,opportunity agglomeration,and spatial interaction.The first one analyzes accessibility from a pure shape-and-configuration perspective,while the other two further address the impacts of land-use and opportunity on accessibility.That is,the second method stresses the amount of opportunities concentrated within an isochrone of a particular point;instead,the third method emphasizes spatial interaction intensity between a pair of origin and destination.Compared with mobility,accessibility feature is a wider and more important application in urban study and transportation planning,in that it helps to identify principles for urban transportation planning,to monitor and evaluate the implementation results of traffic improvement projects more accurately,and to explain urban spatial structure more profoundly.

[17]
Ma Y, Lu Y, Ke Wet al., 2015. The influence of Pan-Asia high-speed railway construction on the spatial relation between southwest China’s frontier area and Indo-China Peninsula.Geographical Research, 34(5): 825-837. (in Chinese)As an important part of China's "Going Global" strategy, the construction of "PanAsia High-speed Railways" can enhance cross-border cooperation not only between China and Indo- China Peninsula, but also between China and Southeast Asia. Based on aspects of accessibility changes and spatial pattern evolution, this paper explores the influence on spatial relation between border areas of Southwest China and Indo- China Peninsula, which has been brought up by the construction of Pan-Asia High-speed Railways. The results indicate that the construction of Pan-Asia High-speed Railways has generated time-space astringency effect of accessibility both on global and local levels, reduces relative disparity inside the study area to a certain extent, and brings more balance on the degree of transportation convenience along the trunk railways in the study area. It promotes the enhancement of population and GDP service level in the whole region as well, and will lead to a variability from country to country.Relatively speaking, countries with a large population or great economic powers in the research area can have easy access to to the high-speed railways. What's more, the construction of PanAsia High- speed Railways can not only highlight the location advantages of the cities and autonomous prefectures along the railway line, like Kunming city, but also promote regional integration along the mid-route of the line. As a traffic point of connection, Kunming connects China's western border area and Indo- China Peninsula, links China's interior heartland and Southeast Asia and even takes up the position as a bridgehead of China's opening up to the Southeast Asia. Pan-Asia High-speed Railways even strengthen the intensity of spatial relation between the cities and autonomous prefectures in the border area of Southwest China and countries or capital cities in Indo- China Peninsula, especially the ones along the high- speed railways, and it shapes a "^" style pattern of spatial relation, which is an enclosure of Kunming(Qujing)- Bangkok and Kunming(Qujing)- Hanoi. In the end, some targeted suggestions for policy making are provided based on the main research conclusions.

[18]
National Railway Administration (NRA), 2014. Railway Safety Management Regulations. Beijing: China Railway Publishing House.

[19]
Perl A D, Goetz A R, 2015. Corridors, hybrids and networks: Three global development strategies for high speed rail. Journal of Transport Geography, 42: 134-144.After 50years of experience with high-speed rail (HSR) development in Asia and Europe, there are important lessons that can be derived to inform future efforts to introduce HSR. This paper identifies and explores three strategic models of HSR development: (1) exclusive corridors (e.g., Japan), (2) hybrid networks oth national (e.g., France and Germany) and international (e.g., European Union), and (3) comprehensive national networks (e.g., China and Spain). Evaluations of these models yield outcomes that range from generally positive assessments of the corridor and national hybrid models to more concerns and uncertainties about the international hybrid and comprehensive national network models. When applying these lessons to the United States, contextual differences can make direct applications problematic. At the same time, though, certain elements of these three models that have been proven to be successful elsewhere may be adaptable to the U.S. and other newcomers to HSR development.

DOI

[20]
Shaw S L, Fang Z, Lu Set al., 2014. Impacts of high-speed rail on railroad network accessibility in China.Journal of Transport Geography, 10: 112-131.High speed rail (HSR) is changing the overall travel accessibility of cities in China. There have been a number of studies of high speed rail in China. However, detailed spatiotemporal accessibility pattern of cities affected by the operation of high speed rail in China has not been reported. This study takes a timetable-based accessibility evaluation approach to analyze the changes in travel time, travel cost, and distance accessibility for each of the four main stages of HSR development in China: no HSR service in Stage 1 before August 2008, several HSR lines in Stage 2 between August 2008 and July 2011, reduced operating speed of HSR trains in Stage 3 between August 2011 and November 2012, and addition of new HSR lines and reduction of ticket fares in Stage 4 between December 2012 and January 2013. In addition to the “corridor effect” and the “center-diffusion” pattern, this paper investigates the impacts of HSR on changes in in-vehicle travel time and out-of-vehicle travel time with respect to the policy changes that reduced the operating speed of HSR trains, rearranged the train timetable, and lowered the ticket fare on HSR trains. The analysis results indicate the spatiotemporal pattern of Chinese cities affected by these policy changes. This study is useful for assessing HSR impacts on the accessibility of various cities across China as well as serving as a decision-making support to policies related to adjustments of HSR operation and planning of future HSR routes by considering the existing HSR and non-HSR railway lines.

DOI

[21]
UIC, 2013.

[22]
Vickerman R W, 1997. High-speed rail in Europe: Experience and issues for future development.The Annual of Regional Sciences, 31: 21-38.The development of High-Speed Rail has been one of the central features of recent European Union transport infrastructure policy. This paper reviews the developments which have taken place in a number of countries and assesses the outcome. It identifies the lack of genuine network development which has taken place, criticises the failure to provide a more integrated framework between modes and questions the assumptions of improved regional development and cohesion which are claimed for the policy. Instead there is evidence of increasing concentration into the main metropolitan centres served by the emerging network.

DOI

[23]
Vickerman R W, 1999. Accessibility and economic development in Europe.Regional Studies, 33(1): 1-15.VICKERMAN R., SPIEKERMANN K. and WEGENER M. (1999) Accessibility and economic development in Europe, , 1-15. There is continuing debate on the role of transport infrastructure and changes in accessibility on regional economic development. The emphasis in recent European Union policy on the development of trans-European Networks (TENs) provides a focus for a re-evaluation. Much of the debate assumes that improvements in accessibility will lead to economic development and, by implication, to greater cohesion. This paper identifies some of the major difficulties in defining a simple measure of accessibility for use in such studies and proceeds to evaluate new measures of time-space and accessibility surfaces which allow for greater disaggregation at a spatial and sectoral level. An assessment of the implications for regional development in the EU is then made. The conclusions cast doubt on the ability of TENs to promote greater convergence in both accessibility and economic development.VICKERMAN R., SPIEKERMANN K. et WEGENER M. (1999) Accessibilite07 et de07veloppement e07conomique en Europe, , 1-15. Le ro le de l'infrastructure de transport et de l'accessibilite07 dans le de07veloppement e07conomique re07gional est toujours un sujet très controverse07. Dans le cadre de l'Union europe07enne, la politique re07cente a mis l'accent sur le de07veloppement des re07seaux transeurope07ens, ce qui permet une re07e07valuation. Dans une large mesure, le de07bat laisse supposer qu'une meilleure accessibilite07 incitera au de07veloppement e07conomique et, par la suite, à plus de cohe07sion. L'article distingue quelques-unes des plus grandes difficulte07s quant à la de07finition d'une mesure simple de l'accessibilite07 qui pourrait e tre employe07e dans de telles e07tudes, et e07value de nouvelles mesures de l'espace-temps et de l'accessibilite07 qui permettraient une division plus importante sur le plan ge07ographique et du point de vue sectoriel. On fait le bilan des conse07quences pour l'ame07nagement du territoire au sein de l'Union europe07enne. La conclusion met en doute la capacite07 des re07seaux transeurope07ens à promouvoir une meilleure convergence quant à l'accessibilite07 et au de07veloppement e07conomique.VICKERMAN R., SPIEKERMANN K. und WEGENER M. (1999) Zug01nglichkeit und wirtschaftliche Entwicklung in Europa, , 1-15. Die Debatte über die Rolle von Verkehrsinfrastruktur und Wandel der Zug01nglichkeit auf regionalwirtschaftliche Entwicklung h01lt weiterhin an. Die Betonung der Entwicklung transeurop01ischer Netzwerke (TEN) in den letzten politischen Diskussionen der EU liefert einen Brennpunkt für eine erneute Einsch01tzung. In der Debatte wird oft vorausgesetzt, da08 verbesserte Zug01nglichkeit zu wirtschaftlicher Entwicklung, und implizite zu st01rkerem Zusammenhalt, führen wird. Dieser Aufsatz identifiziert einige der Hauptschwierigkeiten bei der Definition eines einfachen Ma08stabs der Zug01nglichkeit zur Anwendung bei derartigen Studien, und beurteilt dann neue Ma08st01be der Zeit-Raum und Zug01nglichkeitsoberfl01che, welche gr0208ere Disaggregation auf r01umlicher wie auf Sektorenebene gestatten. Anschlie08end wird eine Einsch01tzung der Implikationen für die Regionalentwicklung in der EU vorgenommen. Sie Schlu08folgerungen lassen Zweifel an der F01higkeit transeurop01ischer Netzwerke aufkommen, gr0208ere Konvergenz von Zug01nglichkeit und wirtschaftlicher Entwicklung herbeizuführen.

DOI

[24]
Vickerman R W, Wang J, Jiao Jet al., 2013. Development and economics of high-speed rail in Europe.World Regional Studies, 22(3): 41-48. (in Chinese)This paper reviews the development of high-speed rail in Europe.It examines how the network has developed on an essentially national basis to address specific problems,how the concept of high-speed rail has changed through time to provide both more complementarity with air and shorter distance commuter services,the economic and appraisal problems expansion of the network faces and how this relates to the EU master plan for trans-European transport networks.

[25]
Wang F, 2012. Study on the influence of China high-speed railway on regional economic development [D]. Changchun: Jilin University. (in Chinese)

[26]
Wang J, Ding J, 2011. High-speed rail and its impacts on the urban spatial structure of China.Urban Planning International, 26(6): 49-54. (in Chinese)

[27]
Wang J, Hu H, 2013. Competition and cooperation of high-speed rail and air transport in China.Acta Geographica Sinica, 68(2): 175-185. (in Chinese)With a large-scale construction of high-speed rail, its safety, economy and competition with air transport have become the foci of scholars. Today, transport infrastructure is playing a more and more important role in economic and industry layout. Under the background, the paper conducts studies on the market competition and cooperation of high-speed rail and air transport in China. First, the paper measures the spatial service market of high-speed rail and air transport by road transport with GIS method. Second, the paper analyzes the service overlapping market of high-speed rail and air transport. A city having both a high-speed rail station and an airport or the area enjoying the high-speed rail and air transport service in 1/2 hours by road transport is defined as the overlapping market. Besides, the paper discusses and stimulates the spatial effect of competition and cooperation between high-speed rail and air transport. Results indicate that: (1) Both high-speed rail and air transport are inclined to serve economy and population, and they can cover most of the population and GDP in 2 hours by road transport; (2) Different technique characteristics in distance decide their own advantageous markets. The service market of high-speed rail spatially mainly cover economic belts in Eastern and Central China, and air transport has competitive advantage in Western China. (3) With the rapid construction of high-speed rail and air transport, their overlapping markets will become larger and larger; therefore urban clusters, metropolitan areas, and economic belts will become their major competitive markets. Considering the higher construction costs and a smaller number of passengers as well as its competition with air transport in Western China, we suggest the Central Government slow down the pace of high-speed rail construction in this region.

DOI

[28]
Wang J, Jiao J, Jin F, 2014. Spatial effects of high-speed rails on interurban economic linkages in China.Acta Geographica Sinica, 69(12): 1833-1846. (in Chinese)As a new mode of transportation, the rapid development of high-speed rail (HSR) will bring a leap in the history of transportation and have a comprehensive impact on the regional structure, population mobility, geographical division of labors, regional linkages, land use, and so on. Therefore, it is significantly important to study the impacts of HSR on regional spatial interactions, especially under the background of regional economic integration. The paper researches the impact of high speed rail on the reconstruction of spatial economic linkages. Based on the GIS network analysis tools, this paper first calculates the time cost matrix of 333 prefecture-level administrative units and four municipalities, and then uses the gravity model to calculate the interurban economic linkages, and lastly analyzes the distribution of the total economic linkage and the economic linkages between any two cities. In order to analyze the impact of HSR on regional spatial interaction, this paper resumes three scenarios: the current transport network in 2012 without the HSR network (scenario 1), the current transport network in 2012 (scenario 3), and the planning HSR network in 2020 (scenario 3) based on the current transport network, to calculate the time cost matrix of 337 cities. Results indicate that: (1) Cities in the east have the highest economic linkages, and cities with the highest increase of economic linkages are located along the HSR lines, which will lead to regional restructuring; (2) The development of HSR lines will improve the economic linkages between cities, and the increasing rate during the first period (comparing scenario 2 with scenario 1) is much higher than that during the second period (comparing scenario 3 with scenario 2); (3) From different perspectives and regional scales, the development of HSR has different impacts on spatial difference; (4) It is possible for cities in a long distance to have high economic linkages with the construction of HSR lines, which could also change the linkage directions.

DOI

[29]
Wang J, Lin C, 2011. High-speed rail and its impacts on the urban spatial dynamics in China: The background and analytical framework.Urban Planning International, 26(1): 16-23.

DOI

[30]
Wu K, Fang C, Zhao Met al., 2013. The intercity space of flow influenced by high-speed rail: A case study for therail transit passenger behavior between Beijing and Tianjin.Acta Geographica Sinica, 68(2): 159-174. (in Chinese)In the perspective of space of flows, the passenger flow of high-speed rail has become an important representation of functional linkage between the city-regions. Based on the interviews and questionnaires from the passengers of high-speed rail of Beijing and Tianjin, this paper analyzes the intercity space of flows and the spatial integration indicated by the individual micro behavior choice. The findings include: (1) Both of the metropolitan areas of Beijing and Tianjin are the dense areas of intercity passenger flow while suburban counties and districts are the sparse areas, which indicates the spatial polarization of HSR in the aspect of passengers' characteristics; The central city of Beijing-Tianjin is the dominant spatial association, while Beijing-Tanggu, Beijing-Wuqing and Tianjin-Wuqing corridors are the secondary spatial association axes, which presents a hub-and-spoke pattern. (2) Leisure activities, such as tourism, shopping, enhance the cross-city flows. Although intercity high-speed rail reduces the temporal and spatial distance to a certain extent, the effects on changing place of housing or work to another city are not obvious. (3) The frequency of cross-city activities is not very high, commuters across cities generally take 7 days as a cycle; Currently, passenger flows of intercity by HSR are mainly business travel and leisure tourism, which reflects HSR as the material foundation for the spaces of flows; the respondents who take the HSR are mostly male, business people with high education and prospective occupation, and the business travelers who have a higher cross-city frequency are more sensitive to travel time, which demonstrates the intercity space of flow has represented some of the elite space characteristics. (4) There is spatial asymmetry in the cross-city space of flow between Beijing and Tianjin, which could be found from the uneven distribution of O-D passenger flows, the differences on the proportion of the business travel flows and the unbalanced function linkage directions.

DOI

Outlines

/