Orginal Article

New-type urbanization in China: Predicted trends and investment demand for 2015-2030

  • SUN Dongqi , 1 ,
  • ZHOU Liang 2 ,
  • LI Yu , 1 ,
  • LIU Haimeng 1 ,
  • SHEN Xiaoyan 3 ,
  • WANG Zedong 3 ,
  • WANG Xixi 3
Expand
  • 1. Institute of Geographic Sciences and Natural Resources Research, CAS, Beijing 100101, China
  • 2. Faculty of Geomatics, Lanzhou Jiaotong University, Lanzhou 730070, China
  • 3. School of Resources & Environmental Engineering, Ludong University, Yantai 264025, Shandong, China

Author: Sun Dongqi (1985-), PhD, specialized in economic geography and regional development. E-mail: .

*Corresponding author: Li Yu (1973-), Associate Professor, specialized in urbanization and its eco-environment effects. E-mail:

Received date: 2016-07-26

  Accepted date: 2016-09-20

  Online published: 2017-08-31

Supported by

National Natural Science Foundation of China, No.41501137, No.41530634, No.41271186

Copyright

Journal of Geographical Sciences, All Rights Reserved

Abstract

The future development of new-type urbanization has drawn great attention from both the government and public alike. In this context, the present study had three related research aims. Firstly, it sought to predict the urbanization and population dynamics in China at both national and provincial levels for the period of 2015 to 2030. Secondly, on this basis, it sought to examine the spatial variation of urbanization given the predicted national urbanization rate of 70.12%. Thirdly, it sought to estimate and evaluate the national and provincial demands of investment in the development of new-type urbanization. The main conclusions from this study were as follows: (1) The population size and urbanization rate will reach 1.445 billion and 70.12%, respectively, from 2015 to 2030. (2) The demographic dividend will vanish when the population pressure reaches its maximum. During this period, there will be 70.16 million urban population born. The suburban population that becomes urbanized will be 316.7 million, and thus the net increase in urban population will reach 386 million. (3) Although the urbanization rate of every Chinese province will increase during 2015-2030, it will do so unequally, while differences in urbanization quality among provinces will also be substantial. In some provinces, moreover, the urbanization quality is not compatible with their eco-social development. (4) A total of 4,105,380 billion yuan is required to fund new-type urbanization and the investment demand for each province varies greatly; for example, Guangdong province requires the most funding, amounting to approximately 148 times that required by Tibet, the province in least need of funding. In the final part of this study, policy suggestions concerning the investment of the new-type urbanization are put forward and discussed.

Cite this article

SUN Dongqi , ZHOU Liang , LI Yu , LIU Haimeng , SHEN Xiaoyan , WANG Zedong , WANG Xixi . New-type urbanization in China: Predicted trends and investment demand for 2015-2030[J]. Journal of Geographical Sciences, 2017 , 27(8) : 943 -966 . DOI: 10.1007/s11442-017-1414-4

1 Introduction

Urbanization occurs when a population shifts in concentration from rural areas to cities (towns), thereby causing the non-agriculturalization of industrial-employment structures and a series of other institutional changes (Zhang et al., 2004). In the 30 years since China’s reform and opening up, a rapid urbanization process has been sustained (Cao and Liu, 2011), which has attracted widespread concern of scholars from different disciplines, and personalities from all walks of life (Chen et al., 2009; Jian and Huang, 2010; Li et al., 2012).
Both China and foreign countries have done much in-depth research on urbanization, primarily in the theoretical and empirical aspects: (1) Theoretical research. Theories for urbanization research have sought chiefly to explain and predict population migration. The theories with the greatest impact to date are Ravenstien’s ‘push-pull theory’ (An, 2004), Schults’ ‘population migration theory’ (Yao and Xu, 2008), Todaro’s ‘rural-urban population migration theory’ (Gao and Ji, 1995), Lewis’ ‘dual-sector model of economic growth’ (Sun, 1999), and finally, Lipton’s ‘urban bias theory’ (Wang and Chen, 2006). Although these theories express their own particular perspective, they all share the core idea that a shift in population concentration from rural to urban areas constitutes urbanization. The key difference between theories is that while some are optimistic others are pessimistic. For example, Lewis believes that the development of urbanization will gradually drive the whole country to achieve modernization, whereas Lipton believes that excessive pursuit of urbanization will lead to an urban bias, a critical driver of persistent poverty in developing countries. In addition, there are famous ideas proposed specifically for urbanization research, such as Northam’s ‘S-shaped curve’ (Chen et al., 2011) and Chenery’s ‘model for urbanization and industrialization’ (Chen et al., 2013). Collectively, this body of theory has provided a strong theoretical foundation for future empirical research on urbanization.
(2) Empirical research. Chen Mingxing has reviewed and summarized this field in detail (Chen, 2015). He argues that foreign empirical research on urbanization has focused mainly on five subject areas in the context of globalization and information technology trends (Robin, 2004); these are on the evaluation systems and dynamic monitoring of levels of urbanization development (Chen et al., 2014); on the classification and selection of models for urbanization development at the national (regional) level (Rob and Talukder, 2012; Seto and Satterthwaite, 2010); on the interaction among urbanization, resources, and the environment in addition to the sustainable development of typical city clusters (Seto et al., 2010) and their urbanization quality (Diener and Suh, 1997; Shafer et al., 2000). Domestic empirical research on urbanization has focused on a scientific understanding of, and speculation upon, the rational urbanization process with Chinese characteristics (Lu et al., 2007; Yao et al., 2012); on the relationship between urbanization and economic growth (Chen et al., 2013); on the spatial form, pattern, and regional model of urbanization (Xu and Yeh, 1986; Gu et al., 2008; Zhang, 2002); on the relationship between urbanization and bearing capacity of environmental resources (Bao, 2014; Liu et al., 2014); on the urban scale structure and the integration of urban and rural development (Yan et al., 2004) linked to several other issues (e.g., adjustment and management of urbanization and administrative divisions) (Zhang and Fan, 2002); on behaviors of urban and rural residents (Shen and Chai, 2013); and finally, on dynamic systems of urbanization (Chen and Cai, 2004). Evidently, the research on urbanization is relatively mature. Nevertheless, most empirical research consists of quantitative and qualitative analyses from the perspective of history and the status quo. In contrast, there has been far less predictive research carried out on urbanization.
In 2014 the central government announced the National New Urbanization Plan (2014-2020). This marks a major transformation of China’s urbanization policy, in that it aims at, for an urbanization rate of permanent residents, reaching roughly 60% by 2020. In addition, according to statistical analyses by the government and related research institutes, under the sustainable development and continued modernization of China’s economy, the period from 2010 to 2030 will undergo accelerated development of urbanization. By 2030, the Chinese population will reach approximately 1.445 billion and its urbanization rate will reach 70%. By that time, the population living in cities and towns will be over 1 billion. (UNDP, 2013; Yang, 2014)This means that China’s rural population will have been reduced by more than one-third, as more than 300 million people move to cities (towns) from the countryside. In theory, 70% is an important threshold in the development of the urbanization rate and urbanization will then also undergo a transformation from the stage of rapid advancement to that of stable development.
However, during the next 15 years of rapid urbanization, differences in regional development will persist. Specifically, the large population of farmers numbering over 300 million will not be distributed evenly after moving to cities (towns). Moreover, regional urbanization rates will vary widely and differ from 70%; such differences are expected to bring with them many problems, including those concerning the urban environment, employment, housing, pension, social welfare, medical security, and education (Cai, 2007). Some scholars even worry that these problems may lead to the emergence in China of a Latin American-style “urbanization trap” (Tian, 2006; Zheng, 2011; Liu, 2015), which has two main characteristics: first, the urban population grows excessively while the rural population hardly grows at all; second, the level of urbanization significantly exceeds the pace of industrialization and economic development. In this scenario, the following specific issues often arise: (1) Serious housing issues. The slum phenomenon is relatively common. (2) Prominent employment issues. Urban job creation opportunities and capacity are very limited, so the labor force transferred from rural areas has to flow to informal sectors. (3) The coverage provided by the social security system cannot keep up with urbanization, so a huge gap appears between what the system supplies versus what over-urbanization demands, in that the vast majority of working-age population already do not have social security. (4) Pauperization is increasingly prevalent and the incidence of poverty remains high. (5) Polarization is very obvious and an unfair distribution in wealth is very serious. (6) The society is at risk of falling into chaos and the crime rate remains high, becoming a chronic ill of the community. Therefore, Latin American-style “over-urbanization” is, in effect, one form of unsustainable development (Zheng, 2011).
China’s “semi-urbanization” refers to an incomplete urbanization process where agricultural migrants (chiefly migrant workers) are not fully integrated into modern cities and these people are still in limbo. Although they have managed to move to cities and achieved career transitions, they only “ought to be” citizens without “actual” civil rights. Thus “semi-urbanization” represents only the urbanization of the land rather than the urbanization of the human. As such, it is an immature state in the urbanization process. The general characteristics of “semi-urbanization” are as follows: “working in the city, but with a household registered in the countryside; the labor force concentrated in the city whereas family members are in the countryside; getting earnings in the city while saving them in the countryside; living in the city while based in the countryside”. Specific related issues of concern include the following: 1) Economically, migrant workers lack a permanent urban residence, and so they are rarely covered by the “five insurances and one fund”. This generates inequalities between migrant workers and urban citizens, such as “different pay for same job, different hours for same work, and different rights for the same work”, to name several. 2) Politically, the dual household registration system of urban and rural areas leaves migrant workers without the right to vote or to stand for election, and bars them from other political rights in the city. 3) Regarding welfare treatment, the special household registration system means that migrant workers who are part of the urban population but without a permanent urban residence cannot enjoy the same benefits of urban residents in terms of employment, social security, medical care, schooling, housing, and other aspects. 4) The special social environment has changed the migrant workers into a special social group “neither able to go back to the countryside nor able to integrate with the city”. Therefore, China’s “semi-urbanization” is, in effect, also another form of unsustainable development (Jiao, 2015; Li, 2013).
As seen from the analysis of Latin American-style “urbanization” and China’s “semi- urbanization”, the development paths of each are undesirable. During urbanization it is necessary to prevent the Latin American-style “over-urbanization” yet also avoid “semi-urbanization” outcomes. In order to resolve the “semi-urbanization” issues and achieve sustainable development, the best way forward is for China to adopt the new-type urbanization, which is in line with its national conditions and keeps pace with the level of industrialization.
In this context, predictive research on China’s future urbanization is especially important, as it will scientifically project this development with important practical significance for a macro-understanding of urbanization. Some scholars and teams have carried out relevant predictive research on future urbanization. For example, the Economist Intelligence Unit China Research Team has projected for the 2030 the urbanization rates of provinces, municipalities, and regions, albeit using relatively simple predictors (The EIU China Research Team, 2014).
The investment in “troika” (investment, consumption and export) has always been the main instrument in China’s economic development, and the construction of new-type urbanization is no exception because it is a huge and complex strategic project that is very costly. If there is not enough money guaranteed, the quality and efficiency of urbanization will be greatly reduced. More importantly, the huge amount of money required by such new-type urbanization and its spatial pattern of demand are not the only major strategic and practical issues that must be faced in China’s future development of new urbanization. The concerns of scholars of human geography and economic geography should also be considered. So far, however, no analysis has tried to predict what funds are required in the future urbanization of China and its provinces, municipalities, and regions.
In summary, this paper conducted predictive research on China’s new-type urbanization development and investment between 2015 and 2030. It did so by addressing the following questions: 1) What are the temporal and spatial differences between China’s provincial urbanization rates? 2) Over time, how do those factors change which are closely related to urbanization development (i.e., urbanization quality, population reproduced by the city or town itself, urban population transferred from rural areas, GDP development, and the three major industrial structures)? 3) Is the urbanization rate of provinces, municipalities, and regions compatible with social and economic development? 4) How much funding is required for urbanization development at the provincial level? This research not only has important historical and theoretical significance but also offers great practical significance for a better macro-understanding of China’s future urbanization development.

2 Data and methods

2.1 The sources of basic data

This study used data available for 31 provinces, municipalities, and regions of China (temporarily excluding Hong Kong, Macao, and Taiwan), taken from three sources: 1) The China Statistical Yearbook and the statistical yearbooks of the 31 provinces, municipalities, and regions from 1991 to 2013 (22 years); 2) The China City Statistical Yearbook for relevant data of the 31 provinces, municipalities, and regions from 1984 to 2013 (19 years); 3) The China Population Statistics Yearbook for relevant data of the 31 provinces, municipalities, and regions from 1983 to 2013 (20 years).

2.2 Research methods

Long-term predictions of many indicators were assessed until 2030. However, due to different natures and laws of development and evolution of indicators, different prediction methods are necessarily adopted. These are described below:
2.2.1 Time-series forecasting method
During the last 30 years, the pace of China’s urbanization has accelerated, causing widespread concern in government and academic circles. Time series forecasting method uses a form of historical data-based extended predictions; the principle underpinning this method is simply extension and extrapolation based on recorded time-series trends of social and economic phenomena to predict future trends.
The urbanization process can be non-linear and will follow an S-shaped curve when development is slow, then accelerated, and then slowed again. As China is now in the stage of accelerated urbanization, linear changes should be evident. Based on this, the following equation was used to express the relationship between urbanization rate and time, and then the time-series forecasting method was applied to predict the 2030 urbanization level of China.
Y = 1 /(1 + λe-βt) (1)
where y is the urbanization rate and t is time. Set 0 for the year 1991, 1 for 1992, and 39 for 2030. λ and β are estimated parameters. Transform equation (1) into the following one:
1/ y-1 = λe-μ (2)
Then take the natural logarithms of both sides of equation (2):
ln(y-1) =βtlnλ (3)
Let: lnλ = a0, -β = a1 and ln(1/y-1) = y1. Equation (3) is then transformed into the following one:
y1 = a0a1t (4)
Calculate y1 according to the observed urbanization rates between 1991 and 2012, and then calculate the parameters of equation (4) using SPSS v.20.0 software. Calculation results are a0 = 1.5492, a1 = -0.0616, with a R2 = 0.996. Hence there is a significant linear relationship between y1 and t, indicating that the fitted regression equation is very robust.
Furthermore, it was found that β = 4.7077 from lnβ= 1.5492. Therefore, the time series equation for the level of urbanization can be given as follows:
y = 1 / (1 + 4.7077e-0.0616t) (5)
The urbanization rates of China and those of the 31 provinces, municipalities, and regions from 2015 to 2030 were thus predicted using equation (5).
2.2.2 Estimation with a logistic curve and model building
This research involves the measurement and prediction of total population, natural population growth, urban population, rural population, and urban population transferred from rural areas and estimation using the logistic curve, which is a well-established method to predict population changes. The logistic curve is a common S-shaped function, its S-shaped functional equation is:
z = (1 /φ + b0b1t)-1 (6)
where z is the dependent variable, b0 is a constant, b1 is the regression coefficient, φ is a parameter, and t is an independent variable (time in years). For example, calculate the parameters of equation (6) with the census figures available for 1991 to 2012 (using SPSS v.20.0 software). Calculation results are φ = 0.02951, b0 = 0.853, b1 = 0.993 and t = 39. In addition, the fit of the regression is robust (r2 = 0.973). Annual growth of the urban population is a function of growth of urban areas plus those that emigrated from rural areas. In estimating these two parts, in addition to relevant data predicted via estimation with the logistic curve, two models should be built:
Pczz = Psczλdcpz = Pdcz - Pscz - Pnzc (7)
where Pczz is population growth of urban areas, Pscz is the last year’s urban population, λdcpz is natural growth rate of urban population in the same year when the survey is done (same below). Pdcz is the same year’s urban population, and Pnzc is urban population transferred from rural areas.
Pnzc = Psn(1 + λdnpz) - Pdz(1 - Vdc) (8)
where Psn(1+λdnpz) is the same year’s actual rural population, Psn is the last year’s total population, λdnpz is the natural growth rate of rural population in the same year, Pdz(1-Vd) is the same year’s urbanized rural population, Pdz is the same year’s total population, and Vdc is the same year’s urbanization rate.
2.2.3 Composite function estimation method
Using this approach, four economic indicators of the country and of the 31 provinces, municipalities and regions were predicted: GDP, primary industry, secondary industry, and tertiary industry. Nonetheless, there are several ways to predict one variable by other variables with which it is strongly correlated. Because it is impossible to immediately determine the best model based on observed quantity, function curve estimation method can be used to establish a simple and more suitable model in a number of regression models. Composite function estimation model is confirmed as the best through simulations using SPSS v.20.0 software. Predicting economic indicators using the composite function estimation method is scientific. Its equation is:
E = x (1 + α)t (9)
where E is the dependent variable, x is the base-year data, α is a parameter (growth rate), and t is an independent variable (time in years). The prediction can be achieved by calculating the parameters of equation (6) with the relevant statistical data available for 1991 to 2012 (using SPSS v.20.0 software).

3 Predictive research on China’s urbanization development between 2015 and 2030

3.1 Predictions about China’s urbanization rates, 2015-2030

Unlike for the other predictions, those for urbanization rate, total population, and GDP require some further explanation.
The urbanization rates released by the National Bureau of Statistics in recent years have included an external urban resident population (i.e., an urban floating population). In fact, the vast majority of external urban residents are from rural areas. Therefore, the urbanization rates of the national resident population and household-registered population were 54.77% and 37.11%, respectively, in 2014; the urban floating population, at 253 million, was much higher than the results calculated by experts based on the registered population statistics of the public security department. In view of this, the external urban resident population (urban floating population) were considered as part of the rural population in the predictions of urbanization rate, with high, medium, and low options projected. The calculation results for the 2030 urbanization rate of the three projections were 74.32%, 70.12%, and 68.03%, respectively. Following these results and the expertise of authorities, the present paper chose the medium option (70.12%).
Regarding the total population predictions, the National Development and Reform Commission issued the Population and Social Development Report 2014 on July 31, 2015 (NDRC, PRC, 2015). The report quoted Cai Fang and Guo Zhenwei’s Research Report on the Overall National Population Development Strategy during the Period of the “Thirteenth Five-year Plan”: it pointed out that “China’s population is expected to reach a peak of 1.45 billion in 2031 (under the existing universal two-child policy)”. The United Nations’ World Population Prospects (2015) believes that China’s population will start to fall after reaching a peak of 1.416 billion in 2028, and that China will have a population of 1.348 billion in 2050. Although some scholars disagree with both of these views, the latter is the official view of the issuing authorities. In this present paper, the prediction result following the medium option indicates that China’s population will fall after reaching a peak of 1.445 billion in 2030.
For predictions of China’s GDP in 2030, there are a variety of estimates from home and abroad. As early as 1955, Chairman Mao Zedong predicted that China’s economy would exceed the United States by 2030 (Mao, 1999). Hu Angang, from the Center for China Studies (CCS) of Tsinghua University, and others carried out estimations using three methods in the book China in 2030: Towards Common Prosperity, namely the rate method, the purchasing power parity method, etc. They concluded that China’s GDP will surpass that of the United States before 2020, reaching 2.0-2.2 times the GDP of the United States by 2030 (Hu et al., 2011). The World Bank and the Development Research Center of the State Council predicted, in China in 2030: Building a Modern, Harmonious and Creative Society, that the average annual growth rate of China’s GDP between 2011 and 2030 would be 6.625% and that China’s GDP in 2030 would be 170.66 trillion yuan (WB and SCDRC, 2013). The Chinese Academy for Environmental Planning of Ministry of Environmental Protection predicted China’s GDP in 2030 according to the high, medium, and low options, which yielded estimates of 191.60, 162.57, and 135.42 trillion yuan, respectively (Jiang et al., 2013). The British media predicted that China’s GDP would surpass that of the United States in 2021 to reach 75 trillion dollars in 2030 (BMF, 2014), or 460.75 trillion yuan based on the current exchange rate of the RMB against the US dollar (1 dollar = 6.1433 yuan). According to the composite function estimation method, if GDP growth rate between 2015 and 2030 is calculated using high (7.5%), medium (7%), and low (6.5%) options, China’s GDP would be 190.97, 175.40, and 161.39 trillion yuan, respectively. We believe that the medium-driven development of GDP growth is more in line with China’s national conditions. Some experts and scholars think that China’s economic development has entered a “new normal”, one characterized by a gradual slowing of overall economic growth. Although true, slackened economic growth does not mean a halt to development in the future. Actually, China’s GDP in 2015 still grew by 6.9% over the previous year, although this figure in 2015 has been the lowest in the last 25 years. This figure is close to 7%, and does not capture untapped potential for China’s economic development. On February 14, 2016, Premier Li Keqiang expressed his views on China’s economy at the executive meeting of China’s State Council, saying that China’s economy still has huge potential and it will be “braver after each fight” (Li, 2016). Thus, there is still ample space for economic development to sustain average annual GDP growth of about 7% (the medium option) for the next 15 years (2016 to 2030). For this reason, all the predicted indicator data adopt the medium option (Table 1).
As shown in Table 1, we estimate that the urbanization rate for 2015 was 48.23%, which is neither the urbanization rate of the resident population nor that of the household registered population. It is a kind of ‘hybrid’ urbanization rate based on the urban and rural population in 1983 (excluding the external urban resident population) simultaneously estimated according to 20 consecutive years (1983-2013) of fertility, mortality, and natural growth rate data. Although there must be some error inherent in this estimate — because of the development of and changes in urban and rural populations — we believe it is a valid and objective approximation. In support of this view, our estimate is not in conflict with the 2015 resident population urbanization rate of 56.1% that was released by the National Bureau of Statistics. Their estimation is based on the one-percent sample census, so it too has some error. Even the state-released urbanization rate of the household registered population has some error, because it is not uncommon for one person to have multiple registered permanent residences, or even to hold multiple identity cards.
Table 1 The dynamics of China’s urbanization rate and related factors 2015-2030
Year Urbani-
zation
rate
(%)
Total
population (100
million)
Urban population
(100
million)
Rural population
(100
million)
Urban
population
transferred
from rural
areas (100
million)
GDP
(trillion yuan)
GDP/100 million people
(trillion yuan)
The structure
of the primary, secondary,
and tertiary
industries
(%)
2015 48.23 13.75 6.63 7.12 0.1836 68.2 4.96 10/45/45
2016 49.77 13.81 6.87 6.94 0.1869 72.63 5.26 10/45/45
2017 51.31 13.87 7.12 6.75 0.1896 77.35 5.58 10/45/45
2018 52.85 13.92 7.36 6.56 0.1911 82.38 5.92 10/44/46
2019 54.38 13.97 7.6 6.37 0.1928 87.74 6.28 10/44/46
2020 55.9 14.03 7.84 6.19 0.1948 93.44 6.66 10/44/46
2021 57.41 14.07 8.08 5.99 0.1966 99.51 7.07 10/44/46
2022 58.91 14.12 8.32 5.8 0.1983 105.98 7.51 10/44/46
2023 60.40 14.17 8.56 5.61 0.2003 112.87 7.97 10/44/46
2024 61.86 14.21 8.79 5.42 0.1997 120.21 8.46 10/44/46
2025 63.30 14.26 9.03 5.23 0.1989 128.02 8.98 10/43/47
2026 64.72 14.30 9.25 5.05 0.1984 136.34 9.53 10/43/47
2027 66.11 14.34 9.48 4.86 0.1965 145.2 10.13 10/43/47
2028 67.48 14.38 9.7 4.68 0.1954 154.64 10.75 10/43/47
2029 68.82 14.41 9.92 4.49 0.1932 164.7 11.43 10/43/47
2030 70.12 14.45 10.13 4.32 0.1903 175.4 12.14 10/43/47
China’s population will increase to 1.445 billion in 2030 from 1.375 billion in 2015; the urbanization rate will increase to 70.12% from 48.23%; the urban population will increase to 1.053 billion from 663 million with a net increase of 388 million and an average net increase of 25.8667 million per year; the rural population will decline to 432 million from 712 million with an average net reduction of 17.50 million per year; the urban population transferred from rural areas will reach 310.64 million with an average transfer of 19.415 million. GDP will increase to 175.40 trillion yuan from 68.20 trillion yuan and the per capita GDP will increase to 12, 400 yuan from 49 600 yuan. The structural proportions of the primary, secondary, and tertiary industries will change to 10%, 45%, and 45% from 10%, 44%, and 46%, respectively. The proportion of the primary industry stays unchanged, but the proportion of the secondary industry declines and the proportion of the tertiary industry increases, which shows that the tertiary industry, namely services, will become more developed with the increasing urbanization rate and continuously improved urbanization quality. Furthermore, for a long time China has been an agricultural country. Although its industries have developed immensely compared with the past, with respect to China’s population of nearly 1.4 billion, the security and fundamental status of agriculture remains firm. Although the China has been actively adjusting industry to promote economic restructuring, as the economy enters a new normal, the structural proportions of the primary, secondary, and tertiary industries will change little in the next 15 years (Figure 1).
Figure 1 Temporal differentiation laws of China’s urbanization rate and the development of the main related factors, 2015-2030

3.2 Spatial-temporal predictions about China’s provincial urbanization rates between 2015 and 2030

For the same period, 2015-2030, the same methods were used to predict the Table 1 column variables for China’s provinces, municipalities, and regions. The external urban resident population (urban floating population) was considered as part of the rural population in making the predictions about the urbanization rate. For this reason, differences were expected between our prediction results and those released by the National Bureau of Statistics for ranks of the 31 provinces, municipalities, and regions. To paint a clearer picture of the results, four points in time — namely 2015, 2020, 2025 and 2030 — were surveyed and evaluated (Table 2).
3.2.1 Predictions about the temporal and spatial evolution of China’s provincial urbanization
As shown in Table 2, the country’s urbanization rate in 2015 was 48.23%. Only the original municipalities of Beijing, Shanghai, and Tianjin exceeded rates of 70%, with Shanghai’s rate the highest at 79.78%; Guangdong ranked fourth with 64.30%; the urbanization rates of seven provinces, municipalities and regions were between 50% and 60%; the urbanization rates of 15 provinces and regions were between 40% and 50%; the urbanization rates of four provinces and regions were between 30% and 40%; and Tibet’s urbanization rate was the lowest, at only 22.38%.
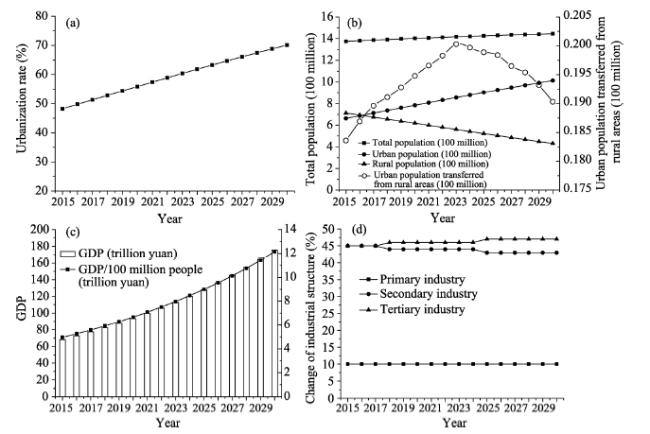
Table 2 China’s urbanization rate (by province, %) in 2015, 2020, 2025, and 2030
Provincial regions 2015 2020 2025 2030 Provincial regions 2015 2020 2025 2030
Beijing 77.13 85.02 92.32 99.46 Hubei 46.15 53.77 61.14 67.96
Tianjin 72.91 81.26 89.1 98.64 Hunan 43.58 51.82 59.85 67.36
Hebei 40.86 49.02 57.01 64.51 Guangdong 64.3 76.21 87.81 96.07
Shanxi 46.95 54.74 62.3 69.27 Guangxi 40.86 48.49 55.95 62.9
Inner Mongolia 52.34 60.34 68.04 75.11 Hainan 47.75 56.13 64.28 71.86
Liaoning 57.67 64.3 70.51 76.04 Chongqing 52.09 62.77 73.24 83.09
Jilin 48.79 53.64 58.12 62.02 Sichuan 40.37 47.98 55.4 62.34
Heilongjiang 50.03 54.73 59.03 62.74 Guizhou 32.51 38.49 44.32 49.76
Shanghai 79.78 87.43 94.46 99.89 Yunnan 35.26 41.99 48.57 54.72
Jiangsu 58.72 69.61 80.22 90.13 Tibet 22.38 25.77 29.03 32.02
Zhejiang 58.69 71.41 83.92 95.73 Shaanxi 43.86 51.84 59.6 66.83
Anhui 42.48 50.59 58.5 65.9 Gansu 32.36 37.94 43.35 48.38
Fujian 56.32 67.73 78.89 89.39 Qinghai 40.49 45.97 51.19 55.92
Jiangxi 42.59 50.18 57.57 64.43 Ningxia 43.67 50.56 57.21 63.34
Shandong 49.56 58.28 66.77 74.66 Xinjiang 36.08 39.07 41.76 44.02
Henan 38.62 45.81 52.81 59.36 China 48.23 55.9 63.3 70.12
China’s urbanization rate continues to grow from 2015 to 2030, increased in absolute terms by 21.89% - ‘growing by’ suggests an increment per unit time. The urbanization rates of all 31 provinces, municipalities, and regions also increase but there are some notable differences among them. In 2030, the urbanization rates of six provinces and municipalities stood above 90% and Shanghai and Beijing have the highest urbanization rates. As for the percentage change in urbanization rates, Beijing, Shanghai, and Tianjin exceed 20% while Guangdong, Zhejiang and Jiangsu did so by over 30%; the urbanization rates of Fujian and Chongqing (in descending order) increase to between 80% and 90%, corresponding to an absolute increase exceeding 30%; the urbanization rates of Liaoning, Inner Mongolia, Shandong, and Hainan (in descending order) are between 70% and 80%. Except for Liaoning (with an increase of 18.37%), the urbanization rates of the remaining three provinces and regions increase by over 20%; the urbanization rates of Shanxi, Hubei, Hebei, Hunan, Shanxi, Anhui, Jiangxi, Ningxia, Guangxi, Heilongjiang, Sichuan, and Jilin (in descending order) are between 60% and 70%. The urbanization rates of all other provinces increase by over 20% except for Ningxia, Jilin, and Heilongjiang; the urbanization rates of Henan, Qinghai and Yunnan (in descending order) are between 50% and 60%, corresponding to an absolute increase exceeding 15%, among which, the urbanization rate of Yunnan increases by almost 20%; the urbanization rates of Guizhou, Gansu, and Xinjiang (in descending order) are between 40% and 50% corresponding to an absolute increase exceeding 7.9%; Tibet’s urbanization rate is still the lowest, at only 32.02%, but it increases by 9.64%. Regional economic development promotes urbanization; in turn, urbanization also promotes regional economic development. This creates a virtuous circle. Therefore, the temporal and spatial evolution laws of the country’s 31 provinces, municipalities, and regions’ urbanization between 2015 and 2030 should reflect the same laws decreed by the provinces (cities, towns, regions) for regional economic development. In the next 15 years, our results indicate that no major changes are predicted to occur in the spatial pattern of urbanization of the country’s provinces, municipalities, and regions (Figure 2).
Figure 2 The spatial distribution of China’s projected urbanization rate (by province) for 2015-2030
3.2.2 Spatial-temporal predictions about the urbanization of the three economic belts
As shown in Table 2, in 2015 the average urbanization rate of the eastern economic belt (i.e., Beijing, Tianjin, Hebei, Liaoning, Shanghai, Jiangsu, Zhejiang, Fujian, Shandong, Guangdong, Guangxi, and Hainan) was 58.71%, which is 10.48% greater than the national average urbanization rate. The average urbanization rate of the central economic belt (i.e., Shanxi, Inner Mongolia, Jilin, Heilongjiang, Anhui, Jiangxi, Henan, Hubei, and Hunan) was 45.73%, and thus just 2.49% less than the national rate. In contrast, the urbanization rate of the western economic belt (i.e., Sichuan, Chongqing, Guizhou, Yunnan, Tibet, Shaanxi, Gansu, Ningxia, Qinghai, and Xinjiang) was lower, at 37.91%, which was 10.32% less than the national rate.
By 2030, however, China’s urbanization rate will reach 70.12%, or 21.89% more than in 2015. The urbanization rates of the eastern, the central, and the western economic belts will be 84.99%, 66.02%, and 56.04%, respectively, corresponding to increases of 26.28%, 20.29%, and 18.13% from 2015, respectively. From the perspective of the three economic belts’ urbanization process, the eastern one develops fastest, followed by the central one, and then the western economic belt (Figure 2).

3.3 A predictive analysis of urbanization quality in the context of China’s urbanization rate of 70.12% in 2030

There are many ways to evaluate urbanization quality (Jian and Huang, 2010; Guo and Ding, 2006) and the number of indices involved in the evaluation index system varies widely (Fang and Liu, 2009; Guan et al., 2008). Compared with previous development, China’s future new-type urbanization has a different focus. It will focus more on solving the semi-urbanization problems through economical and intensive low-consumption, employment solutions. Still, it is difficult to obtain comprehensive historical data for such indices. With reference to Niu Wenyuan’s Report on China’s New Urbanization (2010) and Lin Tingjin and Xuan Chao’s Report on the Development of China’s New Urbanization (2015) (Niu, 2010; Lin and Xuan, 2015), based on the basic principles of being scientific, simple and data available and reflecting the objective reality, this paper constructed an index system to evaluate urbanization quality that contains three 2nd-level indices, eight 3rd-level indices, and 56 indices at the 4th level (Figure 3).
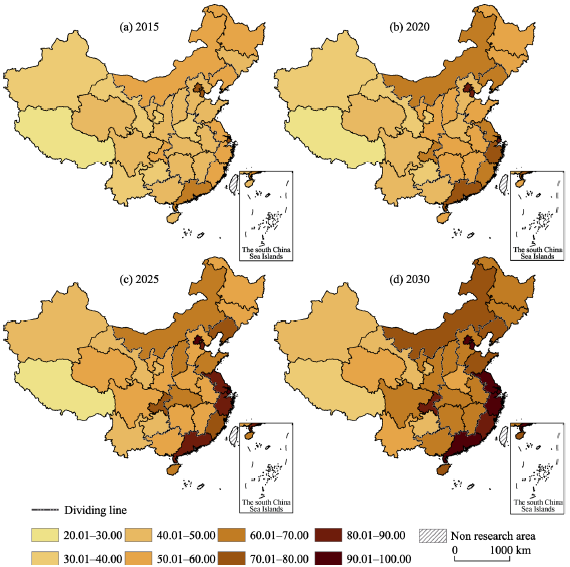
Figure 3 The evaluation system of China’s new-type urbanization quality
We first selected 16 years of consecutive data corresponding to the 56 4th-level indices between 1998 and 2013 (data source: China Statistical Yearbook, China City Statistical Yearbook, China Environment Yearbook, Finance Yearbook of China; provincial, municipal and regional statistical yearbook; and provincial, municipal and regional statistic bulletin on national economic and social development). Using multiple models in simulative predictions for the 56 4th-level indices (using SPSS v.20.0), we conducted a comparative analysis from which we selected the best model for each specific index to predict the situation in 2030. Based on the predicted data, the urbanization quality index (σ) of the country and each of the 31 provinces, municipalities, and regions in 2030 could be arrived at using an analytic hierarchy process in SPSS v.20.0 (Table 3).
Table 3 The index of national and provincial urbanization quality in 2030
Provincial
regions
σ Provincial regions σ Provincial regions σ Provincial regions σ
Beijing 0.6746 Shanghai 0.6788 Hubei 0.4377 Yunnan 0.1465
Tianjin 0.6763 Jiangsu 0.6273 Hunan 0.4452 Tibet 0.0067
Hebei 0.4315 Zhejiang 0.6165 Guangdong 0.6077 Shaanxi 0.2242
Shanxi 0.2279 Anhui 0.3815 Guangxi 0.2158 Gansu 0.0796
Inner Mongolia 0.4525 Fujian 0.5713 Hainan 0.3856 Qinghai 0.0719
Liaoning 0.4769 Jiangxi 0.2261 Chongqing 0.4667 Ningxia 0.1429
Jilin 0.3419 Shandong 0.6046 Sichuan 0.2558 Xinjiang 0.1391
Heilongjiang 0.2463 Henan 0.3925 Guizhou 0.0348 China 0.4371
As shown in Table 3, Shanghai has the highest urbanization quality index in 2030 (σ = 0.6746) whereas Tibet has the lowest (σ = 0.0067). National urbanization quality index is 0.4371; only for eight provinces, four municipalities, and one region did the urbanization quality index exceed the national level (Shanghai, Tianjin, Beijing, Jiangsu, Zhejiang, Guangdong, Shandong, Fujian, Liaoning, Chongqing, Inner Mongolia, Hunan, and Hubei). The urbanization quality index of all remaining 18 provinces and regions, or nearly two-thirds, was below the national level.
Based on our results for urbanization quality index, the 31 provinces, municipalities, and regions could be divided into four categories: (1) Higher-quality (σ>0.5): Shanghai, Tianjin, Beijing, Jiangsu, Zhejiang, Guangdong, Shandong, and Chongqing; their urbanization rate closely matches their social and economic development; (2) High-quality (0.5>σ>0.3): Liaoning, Fujian, Inner Mongolia, Hunan, Hubei, Hebei, Henan, Hainan, Anhui, and Jilin; the urbanization rate of these provinces basically approximates their social and economic development; (3) Low-quality (0.3>σ>0.2): Sichuan, Heilongjiang, Shanxi, Jiangxi, Shaanxi, and Guangxi; these provinces have an urbanization rate that is relatively inconsistent with their social and economic development; (4) Lower-quality (σ<0.2): Yunnan, Ningxia, Xinjiang, Gansu, Qinghai, Guizhou, and Tibet all have urbanization rates that does not correspond to their social and economic development.

4 Predictive research on funds required for China’s urbanization development between 2015 and 2030

At the core of new-type urbanization is the urbanization of people through the citizenization of migrant workers. Funds required to do this include those for necessary education, medical treatment, housing, social security, and infrastructure.
Some scholars and groups have predicted the funds required for China’s new-type urbanization development. Since 2006, six institutions-Chinese Academy of Sciences, the former Ministry of Construction, China Development Research Foundation, Development Research Center of the State Council, Chinese Academy of Social Sciences, and China Development Bank - have estimated the cost of urbanization and the per capita cost of citizen-ization of migrant workers to range from 20 000 yuan to 130 000 yuan (RGSCDRC, 2011; Ma, 2013; MHURC, PRC, 2014). Until 2030, approximately 390 million farmers in China are waiting for citizenization and the per capita public cost is approximately 131,000 yuan; so the total public cost required alone by citizenization will reach 51 trillion yuan (Pan and Wei, 2013), and more funds will be required if other associated costs, such as infrastructure construction, are considered. Gu Shengzu believes that in the next 10 years, the urbanization of nearly 400 million people will require an increase investment demand of 40 trillion yuan, if calculated by the fixed asset investment standard of 100 000 yuan per capita (Gu et al., 2014). Shi believes that a staggering 56 trillion yuan should have been invested in urbanization by 2030 (Shi, 2013). Vice Minister Wang Baoan of the Ministry of Finance, said that urbanization rate was expected to reach 60% in 2020, which would result in an investment demand of approximately 42 trillion yuan (Chen, 2014). According to the estimates from China Development Bank, China’s urbanization will require investment and financing funds of 25 trillion yuan in the next 3 years, with an average of more than 8 trillion yuan per year, thus accounting for nearly 20% of the annual national investment in fixed assets of nearly 40 trillion yuan. Until 2020, China must invest at least 50 trillion yuan more in urban construction (Ma, 2014). An additional investment in urban fixed assets of nearly 6 trillion yuan is needed for every 1% increase in China’s urbanization rate. It is also estimated that China’s urbanization rate will reach about 60% in 2020, while its urban population will reach about 850 million; for this, an additional investment in urban fixed assets of approximately 38 trillion yuan is required. Meanwhile, more than 200 million migrant workers included in the current urban population and their accompanying families lack basic public services available to urban residents; so an additional payment of 10 trillion yuan is required based on an average public service cost of 50 000 yuan per capita. Thus, China’s urbanization process will require a total of almost 50 trillion yuan, with an annual average of over 7 trillion yuan, equivalent to 60% of the national revenue in 2012 (SC, 2014; Yang and Shi, 2014).
The National New Urbanization Plan (2014-2020) anticipates the urbanization rate of the resident population to reach 60% in 2020, and the urbanization rate of the household-registered population to reach 45%, thus enabling approximately 100 million migrant workers and other resident population members to settle in urban areas (RGSCDRC, 2011). According their predictions, the urbanization rate will reach 60.40% in 2023, which will require an investment of 50 trillion yuan. If calculated using a conservative annual investment of 8 trillion yuan, an additional investment of at least 56 trillion yuan is needed when urbanization rate reaches 70.12% in 2030. Taken together, a total of 105.38 trillion yuan is required for China’s urbanization construction between 2015 and 2030; this total is equivalent to the projected national GDP in 2022 (105.98 trillion yuan). Hence, China must make wise strategic preparations in its thinking and planning, theories, policy, funds, and talents to promote and implement the new-type urbanization successfully (MHURC, PRC, 2014).
Authorities and experts predict that 400 million farmers will have become citizens by 2030 (Yu, 2009). In fact, not all these people are farmers, as some will have come from the urban area population. Our calculation results indicate that the urban population will increase by 385.8422 million from 2015 to 2030, which includes 315.6796 million people emigrating from rural areas and 70.1626 million born in already urban areas.
Though there are differences in the cost during urbanization among countries, provinces, cities, and counties, the urbanization qualitative object is the same. Therefore, we use the same standard to calculate the cost for each. Using this net increase in the urban populations between 2015 and 2030, we were able to work out the changes in the provincial, municipal, and regional population sizes and the investment funds required for the construction of new-type urbanization when the national urbanization rate has reached 70.12% in 2030 (Table 4).
Table 4 summarizes the spatial distribution of the Chinese population in 2030 and that of urban areas, urban population transferred from rural areas, population to be urbanized, funds needed for new urbanization construction, total GDP, and other factors.
Between 2015 and 2030, only Guangdong’s population to be urbanized exceeds 30 million (up to 63.0646 million); for Jiangsu, Shandong, and Zhejiang, the population to be urbanized is between 20 and 30 million; for Henan, Hebei, Sichuan, Hunan, Fujian, Anhui, Shanxi, Hubei, Shanghai, Beijing, Yunnan, Jiangxi, and Guangxi, the population to be urbanized is between 10 and 20 million; for Liaoning, Shaanxi, Chongqing, Guizhou, Inner Mongolia, Tianjin, and Heilongjiang, the population to be urbanized is between 5 and 10 million; for Gansu, Jilin, Xinjiang, and Hainan, the population to be urbanized is between 3 and 5 million; for Ningxia and Qinghai, the population to be urbanized is between 1 and 3 million; the lowest population to be urbanized is that of Tibet at 437 600 (Table 4).
Between 2015 and 2030, only Guangdong’s urban population transferred from rural areas exceeds 30 million (up to 53.8101 million); for Jiangsu, Shandong, and Zhejiang, the urban population transferred from rural areas is between 20 and 30 million; for Henan, Hebei, Sichuan, Hunan, Fujian, Anhui, and Shanxi, the urban population transfer is between 10 and 20 million; for Shanghai, Yunnan, Beijing, Hubei, Jiangxi, Guangxi, Shaanxi, Liaoning, Chongqing, and Guizhou, the urban population transfer is between 5 and 10 million; for Inner Mongolia, Tianjin, Heilongjiang, Gansu, Jilin, and Xinjiang, the urban population transfer is between 3 and 5 million; for Hainan, Ningxia, and Qinghai the urban population transfer is between 1 and 3 million; finally, Tibet has the lowest urban population transferred from rural areas, at 359,300 (Table 4).
Between 2015 and 2030, only Guangdong’s funds for new urbanization construction exceeds 10 trillion yuan (up to 17.17 trillion yuan); for Jiangsu, Shandong, Zhejiang, and Henan, the funds required are between 5 and 10 trillion yuan; for Hebei, Sichuan, and Hunan, the funds required are between 4 and 5 trillion yuan; for Fujian, Anhui, Shanxi, Hubei, Shanghai, Beijing, and Yunnan, the funds required are between 3 and 4 trillion yuan; for Jiangxi, Guangxi, Liaoning, Shaanxi, and Chongqing, the funds required are between 2 and 3 trillion yuan; for Guizhou, Inner Mongolia, Tianjin, Heilongjiang, Gansu, Jilin, and Xinjiang, the funds required are between 1 and 2 trillion yuan; for Hainan, Ningxia, Qinghai, and Tibet, the funds required are less than 1 trillion yuan (Tibet needs the least funds, at 120 billion yuan; Table 4).
Table 4 The population dynamics and urbanization investment in China and its provinces for 2015-2030
Provincial regions The total popula-
tion
in 2030 (million)
Urban population in
2030 (million)
Urban reproduction population
by itself (million)
Rural to urban
population
(million)
Population
of urban growth
(ten
thousand)
New-type urbanization construction funds needed
in yuan
(trillion)
The proportion
of funds accounted (%)
GDP
in yuan
(trillion)
Urbaniza-
tion funds as a percentage of GDP (%)
Beijing 2992.12 2975.96 198.1 923.25 1121.35 3.07 2.91 53.6 5.73
Tianjin 1604.24 1582.42 105.34 446.25 551.59 1.51 1.43 31.5 4.79
Hebei 7500.32 4838.46 322.09 1477.44 1799.53 4.92 4.67 74.87 6.57
Shanxi 4729.47 3276.1 218.1 1049.87 1267.97 3.46 3.28 35.46 9.76
Inner Mongolia 2524.87 1896.43 126.25 489.21 615.46 1.69 1.6 48.65 3.47
Liaoning 4388.53 3337.04 222.15 710.59 932.74 2.56 2.43 72.24 3.54
Jilin 2800.62 1736.94 115.63 328.77 444.4 1.22 1.16 34.8 3.51
Heilongjiang 3760.28 2359.2 157.05 382.82 539.87 1.49 1.41 38.59 3.86
Shanghai 3011.63 3008.32 200.26 937.24 1137.5 3.1 2.94 63.49 4.88
Jiangsu 8170.34 7363.93 490.22 2209.68 2699.9 7.37 6.99 157.33 4.68
Zhejiang 5946.81 5692.88 378.98 2089.71 2468.69 6.73 6.39 98.13 6.86
Anhui 6059.4 3993.14 265.83 1112.78 1378.61 3.77 3.58 50.14 7.52
Fujian 4068.7 3637.01 242.11 1205.9 1448.01 3.95 3.75 56.57 6.98
Jiangxi 4680.76 3015.81 200.76 888.5 1089.26 2.98 2.83 38.1 7.82
Shandong 9799.01 7315.94 487.03 2079.85 2566.88 7.01 6.65 141.5 4.95
Henan 9494.06 5635.67 375.16 1584.68 1959.84 5.36 5.09 83.78 6.4
Hubei 5563.67 3781.07 251.72 909.88 1161.6 3.18 3.02 65.31 4.87
Hunan 6415.51 4321.49 287.69 1206.37 1494.06 4.09 3.88 66.13 6.18
Guangdong 14470.67 13901.97 925.45 5381.01 6306.46 17.17 16.29 164.42 10.44
Guangxi 4853.91 3053.11 203.24 865.63 1068.87 2.92 2.77 38.92 7.5
Hainan 1066.6 766.46 51.03 255.15 306.18 0.83 0.79 10.39 7.99
Chongqing 2690.93 2235.89 148.85 601.95 750.8 2.05 1.95 34.14 6
Sichuan 7785.76 4853.64 323.12 1289.88 1613 4.41 4.18 69.93 6.31
Guizhou 3701.6 1841.92 122.62 509.82 632.44 1.73 1.64 17.81 9.71
Yunnan 5194.26 2842.3 189.22 923.6 1112.82 3.03 2.88 29.69 10.21
Tibet 366.95 117.5 7.83 35.93 43.76 0.12 0.11 1.98 6.06
Shaanxi 3844.83 2569.5 171.06 737.61 908.67 2.48 2.35 42.88 5.78
Gansu 2709.57 1310.89 87.27 368.2 455.47 1.24 1.18 16.16 7.67
Qinghai 649.93 363.44 24.2 99.82 124.02 0.34 0.32 5.44 6.25
Ningxia 783.91 496.53 33.05 156.82 189.87 0.52 0.49 7.26 7.16
Xinjiang 2896.73 1275.14 84.88 309.75 394.63 1.08 1.02 21.44 5.04
China 144526 101341.63 7016.26 31567.96 38584.22 105.38 100 1649.21 6.39
Between 2015 and 2030, only for Guangdong did the funds required for new urbanization construction account for over 10% of the national funds required (up to 16.29%); for Jiangsu, Shandong, Zhejiang, and Henan, the funds account for 5% to 10%; for Hebei and Sichuan, the funds account for 4% to 5%; for Hunan, Fujian, Anhui, Shanxi, and Hubei, the funds account for 3% to 4%; for Shanghai, Beijing, Yunnan, Jiangxi, Guangxi, Liaoning, and Shaanxi, the funds account for 2% to 3%; for Chongqing, Guizhou, Inner Mongolia, Tianjin, Heilongjiang, Gansu, Jilin, and Xinjiang, the funds account for 1% to 2%; for Hainan, Ningxia, Qinghai, and Tibet, the funds account for below 1% (Tibet accounts for the least proportion, at only 0.11%; Table 4).
Between 2015 and 2030, when considered as a percentage of GDP, only for Guangdong and Yunnan do the funds required for new urbanization account for over 10%; for Shanxi and Guizhou, the funds account for 9% to 10% of GDP; for Hainan, Jiangxi, Gansu, Anhui, Guangxi, and Ningxia, the funds account for 7% to 9% of GDP; for Fujian, Zhejiang, Hebei, Henan, Sichuan, Qinghai, Hunan, Tibet, and Chongqing, the funds for 6% to 7% of GDP; for Shaanxi, Beijing, and Xinjiang, the funds account for 5% to 6% of GDP; for Shandong, Shanghai, Hubei, Tianjin, and Jiangsu, the funds account for 4% to 5%; for Heilongjiang, Liaoning, Jilin, and Inner Mongolia, the funds account for 3% to 4% of GDP (Inner Mongolia, not Tibet, accounts for the least at 3.47%; Table 4).
In summary, between 2015 and 2030, owing to the stark demographic differences presented in Table 4, stark spatial differences ensue in the funds required by the provinces, municipalities, and regions for new-type urbanization construction. such differences are huge for each province, municipality or region regardless of the size of the differences.
Currently, however, national investment in urbanization construction remains very limited. Of the national investment in fixed assets for the construction of urban public facilities, the proportions of the cumulative amount of each investment, out of the total investment, between 2001 and 2013 were as follows: the central financial allocations accounted for 1.71%, local financial allocations accounted for 27.59%, domestic bank loans accounted for 34.72%, bonds accounted for 0.51%, foreign direct investment accounted for 1.69%, self-raised funds accounted for 28.54%, and other funds accounted for 5.24%. The national investment in fixed assets for the construction of urban public facilities in 2013 totaled 1.63498 trillion yuan, among which the central financial allocations accounted for less than 1.71% (MHURC, PRC, 2014). The state should not rely solely on provincial, municipal, and regional construction during the promotion of new-type urbanization. Some provinces and regions have difficulty in promoting new urbanization, so the state must give them some financial support. The next 15 years heralds the golden age of China’s new-type urbanization development. We suggest that the state should make rational allocations of investment intensity into new urbanization, and that it treat investment in provinces, municipalities, and regions differently and contextually according to objectively derived circumstances.
A quantitative description is given below based on the investment intensity index model of China’s new-type urbanization construction.
where δ is the investment intensity index of China’s new urbanization construction; GDPlji is the total GDP of provinces, municipalities, and regions between 2015 and 2030; Mci is the total funds required for provincial, municipal, and regional new urbanization construction between 2015 and 2030; Pi is the total population of provinces, municipalities, and regions in 2030; GDPljn is the total national GDP between 2015 and 2030; Mcn is the total funds required for national new urbanization construction; and Pn is the total population of China in 2030. Equation (10) shows that the funds for new urbanization construction are less available when δ is higher, thus indicating that financial support should be increased. Conversely, when δ is lower, funds are more available, and thus financial support should be reduced (Table 5).
According to the results shown in Table 5, the 31 provinces, municipalities, and regions could be divided into six categories or levels ranked in descending order of their investment intensity for China’s new-type urbanization construction. Level A represents the highest level whereas level F represents the lowest level. 1) Level A, δ>0.4, includes four provinces and regions, namely Guizhou, Tibet, Yunnan, and Gansu; 2) Level B, 0.4>δ>0.3, includes three provinces and regions, namely Shanxi, Xinjiang, and Guangxi; 3) Level C, 0.3>δ>0.1, includes eight provinces and regions, namely Jiangxi, Anhui, Qinghai, Henan, Sichuan, Ningxia, Hainan, and Hebei; 4) Level D, 0.1>δ>0.0, includes four provinces, namely Hunan, Heilongjiang, Guangdong, and Shaanxi; 5) Level E, 0.0>δ>-0.5, includes seven provinces and municipalities, namely Hubei, Chongqing, Jilin, Fujian, Shandong, Zhejiang, and Liaoning; and finally, 6) Level F, δ<-0.5, includes five provinces, municipalities and regions, namely Beijing, Jiangsu, Inner Mongolia, Tianjin, and Shanghai.
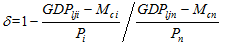
Table 5 The investment intensity index of China’s new-type urbanization construction for 2015-2030
Provincial regions δ Region δ Provincial
regions
δ Region δ
Guizhou 0.5933 Anhui 0.2836 Heilongjiang 0.0764 Shandong -0.2849
Tibet 0.5255 Qinghai 0.2654 Guangdong 0.0474 Zhejiang -0.4388
Yunnan 0.5195 Henan 0.2267 Shaanxi 0.0163 Liaoning -0.4864
Gansu 0.4845 Sichuan 0.2122 Entire country 0.0000 Beijing -0.5809
Shanxi 0.3666 Ningxia 0.1951 Hubei -0.0454 Jiangsu -0.7182
Xinjiang 0.3420 Hainan 0.1609 Chongqing -0.1164 Inner Mongolia -0.7412
Guangxi 0.3057 Hebei 0.1269 Jilin -0.1225 Tianjin -0.7501
Jiangxi 0.2976 Hunan 0.0947 Fujian -0.2107 Shanghai -0.8772
The above division reveals the national investment in provincial, municipal, and regional new urbanization construction in the next 15 years. Moreover, it also suggests the way for provinces, municipalities, and regions to select a new-type urbanization construction investment and financing model that is in line with their conditions and within the scope of national conditions as well. This research exercise thus provides a scientific basis for new urbanization path which is in line with national conditions or their own regional conditions more specifically.

5 Conclusions and discussion

(1) China’s population will grow to 1.445 billion and its urbanization rate will reach 70.12% between 2015 and 2030. Authorities and experts predict that China’s population will see negative growth around 2030 (Yu, 2009; Liu and Li, 2013). By this time, the age structure, sex ratio, occupational structure, urban-rural structure, spatial distribution structure, and other patterns of the population will have changed dramatically. Consequently, the demographic dividend will gradually disappear, and China will come under greatest pressure from the total population size. This marks a key turning point in the development of China’s population and is an important factor restricting China’s transition from a moderately developed country to a fully developed country.
Based on the international research of urbanization development (Chen, 2012; Shang, 2013), urbanization development is rapid when the urbanization rate is between 30% and 70%, but it will gradually slow down when the urbanization rate exceeds 70%. In theory, then, the period around 2030 will be a turning point in China’s urbanization development, as urbanization development will slow down. However, the estimate of 70% may not represent the true urbanization rate that will manifest, and thus social, economic, ecological, and other problems may persist in some form. All levels of government, from the central to local, should attach great importance to the coordinated development of urbanization and tackling various issues in the future development of China.
(2) From the perspective of the special and temporal differentiation rule in China’s development, the urbanization rate will increase to 70.12% from 48.23% between 2015 and 2030. In this context, some experts and scholars posit that approximately 400 million rural people need to be urbanized before 2030. This view is only put forward according to the temporal difference laws in the development of urbanization rate. In fact, the increase in the urbanization rate, and thus the urban population, is not simply a transferral of the rural population migrating into the urban population, because it also includes the reproduction within the urban population. In view of this, the calculation results of this paper indicate that the urban population will reproduce 70.1626 million people, and that 315.6796 million rural residents are to be urbanized between 2015 and 2030. The process of urbanization development between 2015 and 2030 is actually the growth of these two segments of the whole population. Therefore, in the future construction of new-type urbanization, strictly speaking, the urbanization cost of these two distinct parts should be calculated separately to define and refine the investment scenarios more accurately.
(3) Based on the predictions of the temporal and spatial differences in China’s urbanization rate between 2015 and 2030, clearly the development of urbanization rates of provinces, municipalities, and regions varies substantially. Nevertheless, these projected urbanization rates are increasing with great spatial differences. In 2030, with respect to urbanization rate, six provinces and municipalities are over 90%, two more are between 80% and 90%, four provinces and regions are between 70% and 80% with another 12 between 60% and 70%, 3 more are between 50% and 60%, and just four provinces and regions are between 40% and 50%, while Tibet is ranked last at 32.02%. Concerning the percentage change in the urbanization rate, five provinces and municipalities are over 30%, 16 provinces, municipalities, and regions are between 20% and 30%, eight provinces and regions are between 10% and 20%, and Tibet and Xinjiang are below 10%. Such temporal and spatial differences reveal that almost all the provinces, municipalities, and regions with an urbanization rate over 70% in 2030 are on the east coast, whereas almost all the provinces and regions with an urbanization rate below 60% are found in the northwest inland and border areas. Provinces and municipalities with changes in their urbanization rate of over 30% are mainly developed provinces, which are distributed in the eastern economic belt, whereas those provinces and regions with a percentage below 20% are mainly in the western economic belt.
The urbanization rate, and its increase in the eastern, central, and western economic belts between 2015 and 2030, reflects in part the above laws. Specifically, our analysis suggests that, in the next 15 years, the flow of China’s population and the development of the new urbanization will continue its east-west trend (particularly, as before, into the three urban city clusters).
(4) There exist significant differences in the population, natural conditions, eco-environmental quality, the historical and cultural environment, economic development level and other factors of the provinces, municipalities and regions. Thus, the differences in the development of urbanization quality of the provinces, municipalities and regions between 2015 and 2030 objectively reflect the development laws of various environmental factors, which is a normal phenomenon. What is important is to understand and reduce these variable differences to better promote the balanced development of regional urbanization quality in China. According to the four-category division of the 31 provinces, municipalities, and regions based on their urbanization quality in 2030, this present paper recommends that, for future construction of the new-type urbanization, the state should take the following measures: higher-quality provinces and municipalities should mainly rely on their own investment in construction; high-quality provinces and regions should be given some financial support; low-quality provinces and regions should receive more financial support; lower-quality provinces and regions should be the focus of financial support.
(5) We estimated that at least 105.38 trillion yuan will be required to invest in the construction of China’s new-type urbanization by 2030. Ostensibly, this is a huge “astronomical figure”. As such, the country and its provinces, municipalities, and regions should ponder on what kind of investment and financing model(s) ought to be established. The construction of new-type urbanization is comprehensive, but most important therein is the construction of urban public facilities, in which the country invests less than it could. Currently, there are many drawbacks in the investment and financing model of China’s urbanization construction that manifest as follows: the government is in a dominant position, financing is mainly bank credit-based, and the financing platform assumes the financing responsibility of local governments. Practices have proved that this investment and financing model is not sustainable. Therefore, in promoting the construction of the new-type urbanization, there must be an investment and financing model that is in line with China’s national conditions. This will serve as an important guarantee for the smooth construction of the new-type urbanization.
(6) Promoting the new-type urbanization involves two basic yet critical factors, namely people and capital. Developing people-oriented urbanization is not possible without reasonable capital investment. How should the central and local governments invest in the new urbanization construction of provinces, municipalities, and regions between 2015 and 2030? When and where to invest? How much money is appropriate? Where to get the money? Governments must conduct in-depth rigorous research on national (provincial, municipal, and regional contexts) conditions to find out more about the real situation, to provide a more detailed scientific basis, and to develop better scientific and detailed regional plans for investment in the construction of the new-type urbanization. Undoubtedly this endeavor involves much complex and systematic research, but implementing such a project is next on our agenda.
(7) Finally, the future development of China’s new-type urbanization must comply with China’s basic national conditions. Such national conditions are derived from the great temporal and spatial differences in its population, resources, environments, and economic, social, and cultural capital and development trends. Importantly, the objective laws of such differences form the basis and preconditions to promote the scientific development of new-type urbanization. Failing to clearly understand this process, or going against these laws, will likely invite a variety of problems and issues. If this is allowed to happen, it will be even more difficult to guarantee the quality and scientific development of the new-type urbanization in China through 2030.

The authors have declared that no competing interests exist.

1
An J S, 2004. Study on some laws of migration in ancient China.Geographical Research, 23(5): 667-676. (in Chinese)

2
Bao C, 2014. Spatiotemporal coupling relationships among urbanization, economic growth and water use change in China.Acta Geographica Sinica, 69(12): 1799-1809. (in Chinese)

3
British Media Forecast (BMF), 2014. China beyond American economy in 2021. Reference News, 08-25(3).

4
Cai F, 2007. China Population and Sustainable Development. Beijing: Science Press. (in Chinese)

5
Cao G Z, Liu T, 2011. Rising role of inland regions in China’s urbanization in the 21st century: The new trend and its explanation.Acta Geographica Sinica, 66(12): 1631-1643. (in Chinese)

6
Chen J Y, Cai F, 2004. The reformation of household register system and population mobility between urban and suburban in China.China Labor Economics, 117-118. (in Chinese)

7
Chen M, Wang K, 2013. Speed and tendency of China’s urbanization: Comparative study based on cross-country panel data model.China City Planning Review, 37(5): 16-21. (in Chinese)

8
Chen M X, 2015. Research progress and scientific issues in the field of urbanization.Geographical Research, 34(4): 614-630. (in Chinese)

9
Chen M X, Lu D D, Zhang H, 2009. Comprehensive evaluation and the driving factors of China’s urbanization.Acta Geographica Sinica, 64(4): 387-398. (in Chinese)

10
Chen M X, Tang Z P, Bai Y P, 2013. Relational pattern of urbanization and economic development: The parameter revaluation of Chenery’s Model.Acta Geographica Sinica, 68(6): 739-749. (in Chinese)

11
Chen M X, Ye C, Zhou Y, 2011. Urbanization rate and its policy implications: Discussion and development of Northam’s curve. Geographical Research, 30(8): 1499-1507. (in Chinese)

12
Chen M X, Zhang H, et al. 2014. The global pattern of urbanization and economic growth: Evidence from the last three decades.PloS One, 9(8): e103799.

13
Chen Q S, 2014. Macro thinking on financial of the new urbanization: At least 50 trillion of funds.China Enterprise News, 04-08. (in Chinese)

14
Chen R, 2012. The Urbanisation Roads of the World and China. Beijing: Social Sciences Academic Press. (in Chinese)

15
Diener E, Suh E, 1997. Measuring quality of life: Economic, social, and subjective indicators.Social Indicators Research, 40(2): 189-216.

16
Fang C L, Liu X L, 2009. Temporal and spatial differences and imbalance of China’s urbanization development during 1950-2006. Journal of Geographical Sciences, 19(6): 719-732.

17
Gao G L, Ji R J,1995. Research on population migration in the process of regional economic development: A case study of Pearl River Delta in Guangdong Province.Economic Geography, 15(2): 76-82. (in Chinese)

18
Gu C L, Yu T F, Li W M et al., 2008. The Pattern, Process and Mechanism of Urbanization in China. Beijing: Science Press. (in Chinese)

19
Gu S Z, Zheng C, Cao Y B, 2014. Strategic thinking on developing small and medium-sized cities to balance urbanization. Population Research, 38(4): 19-26. (in Chinese)

20
Guan W H, Lin Z S, et al ., 2008. Study on the regional difference of urbanization level since 1978 in China.China Soft Science, 16(9): 74-89. (in Chinese)

21
Guo Z Y, Ding G, 2006. The study on the forecasting methods of urbanization level. Population and Economy, 36(6): 3-8.

22
Hu A G, Yan Y L, Wei X, 2011. China Towards Common Prosperity for 2030. Beijing: China Renmin University Press. (in Chinese)

23
Jian X H, Huang K, 2010. Empirical analysis and forecast of the level and speed of urbanization in China.Economic Research Journal, (3): 28-39. (in Chinese)

24
Jiang H Q, Liu N L, Lu Y L et al., 2013. Research Report on China’s Four Regional Environmental Economic Situation Analysis and Forecast (2012-2030). Beijing: China Environmental Science Press. (in Chinese)

25
Jiao X Y, 2015.An analysis on the peri-urbanization problem in the process of China’s urbanization and the countermeasures.Contemporary Economic Management, 37(3): 64-67. (in Chinese)

26
Li A M, 2013. Peri-urbanization in China. Population Research, 37(4): 80-91. (in Chinese)

27
Li K Q, 2016. China economy will develop better and better.Reference News, 02-17. (in Chinese)

28
Li Q, Chen Y L, Liu J M, 2012. On the “Development Mode” of Chinese urbanization.Social Sciences in China, (7): 82-100. (in Chinese)

29
Lin T J, Xuan C, 2015. The State of China’s New Urbanization Development 2015. Beijing: Peking University Press. (in Chinese)

30
Liu C L, Liu W D, Lu D D, 2014. A study of the geographical features and implications of eco-compensation.Geographical Research, 33(5): 803-816. (in Chinese)

31
Liu J X, Li N, 2013. Dynamic’s analysis and prediction of urban and rural population. Mathematics in Practice and Theory, 43(18): 68-77.

32
Liu M G, 2015. Road choice for China in the 21st century.Reformation & Strategy, 31(2): 26-33. (in Chinese)

33
Lu D D, Yao S M, Liu H et al., 2007. 2006 China Regional Development Report: Urbanization Process and Spatial Expansion. Beijing: The Commercial Press. (in Chinese)

34
Ma W H, 2013. China development bank expects urban construction funds in China to 25 trillion in the next 3 years.China Times, 12-20. (in Chinese)

35
Ma Y W, 2014. Reflections on urbanization construction funds problems in China.Financial and Economic Review, 5(1): 23-32. (in Chinese)

36
Mao Z D, 1999. Speech at the symposium on the issue of socialist transformation of capitalist industry and commerce in 1955. In: Mao Zedong’s Collected Works. Beijing: People’s Publishing House. (in Chinese)

37
Ministry of Housing and Urban-Rural Construction of the People’s Republic of China (MHURC, PRC), 2014. Chinese City Construction Statistical Yearbook (2013). Beijing: China Statistics Press (in Chinese) China Statistics Press. (in Chinese)

38
National Development and Reform Commission, P. R. China (NDRC, PRC), 2015. The Population and Social Development Report 2014. Beijing: National Development and Reform Commission, P. R. China. (in Chinese)

39
Niu W Y, 2010. China’s New Urbanization Report (2010). Beijing: Science Press (in Chinese) Science Press. (in Chinese)

40
Pan J H, Wei H K, 2013. Chinese City Development Report (2013). Beijing: Social Sciences Academic Press (in Chinese) Social Sciences Academic Press. (in Chinese)

41
Rob U, Talukder M N, 2012. Urbanization prospects in Asia: A six-country comparison.International Quarterly of Community Health Education, 33(1): 23-37.

42
Robin L C, 2004. Global shift: Reshaping the global economic map in the 21st century by Peter Dicken.Economic Geography, 80(4): 411-412.

43
Seto K C, Sánchez-Rodríguez R, Fragkias M, 2010. The new geography of contemporary urbanization and the environment.Annual Review of Environment and Resources, 35(1): 167-194.

44
Seto K C, Satterthwaite D, 2010. Interactions between urbanization and global environmental change.Current Opinion in Environmental Sustainability, 2(3): 127-128.

45
Shafer C S, Lee B K, Turner S, 2000. A tale of three greenway trails: User perceptions related to quality of life.Landscape and Urban Planning, 49: 163-178.

46
Shang J, 2013. The Road of Urbanization with Chinese Characteristics. Beijing: Science Press. (in Chinese)

47
Shen Y, Chai Y W, 2013. Daily activity space of suburban mega-community residents in Beijing based on GPS data.Acta Geographica Sinica, 68(4): 506-516. (in Chinese)

48
Shi Y S, 2013. Analysis of capital requirement and its sources for development of new-type urbanization in China.China Land Sciences, 27(12): 3-11. (in Chinese)

49
Sun F H, 1999. Theoretical study and practical exploration on the shift of rural surplus labour. Progress in Geography, 18(2): 111-117. (in Chinese)

50
The EIU China Research Team, 2014. China urbanization in 2003. China Police Review, 19(7): 93-98. (in Chinese)

51
The Research Group of the State Council Development Research Center (RGSCDRC), 2011. Citizenizing the Rural Migrants. Beijing: China Development Press. (in Chinese)

52
The State Council, 2014. National New Urbanization Planning (2014-2020). Beijing: People’s Publishing House. (in Chinese)

53
The United Nations Development Programme (UNDP), 2013. China National Human Development Report 2013. Beijing: China Translation & Publishing Corporation.

54
Tian X Y, 2006. Alert Latin American Trap of population urbanization. Macroeconomics, 27(2): 12-17. (in Chinese)

55
Wang H, Chen L, 2006. Review on the development theories of rural and urban areas in West.Economic Geography, 26(3): 463-468. (in Chinese)

56
World Bank, State Council Development Research Center (SB and SCDRC), 2013. 2030 China: Construction Modern Harmonious and Creative Society. Beijing: China Financial & Economic Publishing House.

57
Xu X Q, Yeh G, 1986. Provincial variation of urbanization in China.Acta Geographica Sinica, 41(1): 8-22. (in Chinese)

58
Yan X P, Wei L H, Zhou R B, 2004. Research on the coordination between urban and rural area in the rapid urbanization with the redevelopment of Guangzhou village-amid-the-city as a case.China City Planning Review, 28(3): 30-38. (in Chinese)

59
Yang Q W, 2014. Annual Report on the Development of China’s Investment (2013). Beijing: Social Sciences Academic Press (in Chinese) Social Sciences Academic Press. (in Chinese)

60
Yang Z H, Shi L, 2014. The strategy prepare of Chinese new urbanization.Journal of Management, 27(2): 28-34. (in Chinese)

61
Yao H S, Xu X Q, 2008. Progress of research on migration in western countries.World Regional Studies, 17(1): 154-166. (in Chinese)

62
Yao S M, Lu D D, Chen Z G et al. , 2012. Serious problems of urbanization: Under the national conditions of China.Economic Geography, 32(5): 1-6. (in Chinese)

63
Yu X J, 2009. Change of population, expanding domestic demand and economic growth.Population Research, 33(5): 36-41. (in Chinese)

64
Zhang J X, Fan C L, 2002. On administrative division adjustment and urbanization promotion.Urban Planning Forum, (5): 25-28. (in Chinese)

65
Zhang J Y, Wang G X, Li J, 2004. Population changes in urbanization progress and the influence on land use in Suizhou City.Progress in Geography, 23(4): 87-96. (in Chinese)

66
Zhang S Y, 2002. Deference analysis on regional urbanization development level in China.Population Journal, (5): 37-42. (in Chinese)

67
Zheng B W, 2011. The lessons of Latin American and China urbanization problems.Foreign Theoretical Trends, 20(7): 46-51. (in Chinese)

68
Zheng B W, 2011. Urbanization in Latin America & Caribbean: Experiences and Lessons. Beijing: The Contemporary World Press. (in Chinese)

Outlines

/