Orginal Article

Exploring the differential impacts of urban transit system on the spatial distribution of local and floating population in Beijing

  • ZHAO Meifeng , 1, * ,
  • LIU Shenghe , 2, 3 ,
  • QI Wei 2
Expand
  • 1. College of Urban and Environmental Science, Tianjin Normal University, Tianjin 300387, China
  • 2. Institute of Geographic Sciences and Nature Resources Research, CAS, Beijing 100101, China
  • 3. College of Resources and Environment, University of Chinese Academy of Sciences, Beijing 1000, China

Author: Zhao Meifeng (1986-), PhD, specialized in urban geography. E-mail:

*Corresponding author: Liu Shenghe (1967-), Professor, specialized in urban geography. E-mail:

Received date: 2016-06-02

  Accepted date: 2016-12-06

  Online published: 2017-06-10

Supported by

Key Project of National Natural Science Foundation of China, No.41230632, No.71433008

Doctoral Project of Tianjin Normal University, No.52XB1621

Copyright

Journal of Geographical Sciences, All Rights Reserved

Abstract

The floating population has become the main driver of urban population excessive growth in China’s mega cities. Urban transit system (UTS) is a significant factor in population spatial distributions within urban areas, especially rapid and high-capacity transit systems. This paper analyzes the causal effects of the extension of expressways and subways between 2000 and 2010 in the Beijing Metropolitan Area (BMA), focusing on the group differences between the local residents and the floating population. Due to the endogeneity of transportation improvements and population growth, Instrumental Variable (IV) regression model is applied to avoid this problem. The results show the local residents increased in the inner suburbs but decreased in the city center, while the floating population increased in the majority areas. IV regression results show that the extension of urban transit systems had statistically significant impacts on population growth across the BMA. The results also show that the extension of urban subway system had more effects on the floating population than the local residents across the BMA. It is mainly caused by the rather low fare of urban subway system. This implies that the excessive subsidy on urban subway system could result in excessive floating population growth and residential differentiation, even residential segregation. Hence, it is necessary to plan and design reasonable and scientific urban transit systems in order to advance reasonable population size and promote residential integration. Moreover, the regional analysis shows that the effects of urban transportation improvements on the local residents are not statistically significant in the inner suburbs. It implies that urban transportation improvements had limited effects on inducing people to move to suburban areas and controlling center city’s population in Beijing. Therefore, it should be stressed the differentiated effects of urban transportation improvements on population distribution in the process of urban planning and population control.

Cite this article

ZHAO Meifeng , LIU Shenghe , QI Wei . Exploring the differential impacts of urban transit system on the spatial distribution of local and floating population in Beijing[J]. Journal of Geographical Sciences, 2017 , 27(6) : 731 -751 . DOI: 10.1007/s11442-017-1403-7

1 Introduction

The urbanization rate in China has been increasing at a high speed following the initiation of the domestic economic reforms in the 1980s, especially the initiation of market economy system in the 1990s. In 2012, 53.7% of the total population lived in urban areas, and the urbanization rate is rising by approximately 1.3% every year. The urban population growth comes mainly from the massive influx of rural floating population into cities, especially in the megacities like Beijing and Shanghai. In 1978-2010, Beijing’s floating population accounted for 62.61% of total population growth, with an increase at an average annual rate of 11.47% (4.5 times faster than for the total population) in Beijing. The floating population has become the main driver of urban population excessive growth in China’s mega cities.
While the total population grows in the urban area, the spatial pattern of population is changing and exhibits group differences between the local residents (the people with local household registration) and the floating population (the migrants without local household registration) in China. Due to the institutional constraints of the hukou (household registration) system, floating population is not entitled to full citizenship rights as local residents, which lead to inequality in their housing inequality and residential differentiation in cities (Huang and Jiang, 2009; Wang et al., 2010; Wu, 2008). The floating population experiences many institutional restrictions associated with hukou system. They have very limited or no access to the housing-distribution system, state sector jobs, private cars, or the citywide welfare programs in Beijing. For instance, the floating population is required to demonstrate having paid into the Beijing personal income tax and social welfare pool for the previous five years to purchasing commodity housing or private vehicles. The floating population is excluded from access to Beijing housing guarantee policy (affordable or public housing). The majority of migrants are restricted to jobs that are desirable to the local population. Given these constraints, the floating population makes different housing choices and may have different residential distribution pattern. Previous studies suggest that local residents primarily reside in the city center, whereas the floating population is distributed mostly at the urban fringe. The spatial distribution of the floating population shows an outward shifting tendency from the city center to the suburban areas, while the local residents exhibit a decentralization trend due to urban expansion and urban renewal (Wu, 2008; He, 2010).
In the determinants of population spatial redistribution within urban areas, urban transit system (UTS), especially rapid and high-capacity transit system, is a significant factor (Ma and Zhang, 2006; Qin and Du, 2000). UTS improvements accelerate the development of housing, office, retail and other amenities in urban areas alongside the new major roads because of the improvement of transportation accessibility. It would motivate people to relocate their residence from high-density inner city to low-density suburbs alongside the urban major roads (Zeng and Lin, 2005). Thus, transportation improvements are always viewed as a useful tool to induce urban population redistribution and urban spatial restructuring by designers and governments in China. Beijing municipal government proposes and pursues a transit-oriented development (TOD) policy to decrease population density in the city center. Due to the importance of urban transportation in population spatial distribution, the group differences between the local residents and the floating population on the effects of urban transportation improvements should be paid much more attentions.
This paper analyzes the impact of UTS on the population spatial distribution and the group differences between the urban local residents and the urban floating population, taking the BMA as a case. To estimate the causal effects of urban transit improvements on the spatial distribution of population, we employ an instrumental variable (IV) estimation that uses natural experiments and transportation plans as instruments for the 2000-2010 changes in distance to the nearest expressway ramp and the distance to the nearest subway station. This paper proceeds as follows. In Section 2 we introduce the data source and the model of the relationship between UTS and population distribution based on urban land use theory. In Section 3 we analyze the change of population spatial distribution between 2000 and 2010 and UTS in the BMA. Section 4 is the IV regression results. It shows the extent to which the urban transit improvements had contributed to population growth of local residents and the floating population. In Section 5 we draw some conclusions.

2 Theory and estimation

2.1 Urban land use theory

The urban land use theory developed by Alonso (1964), Mills (1967) and Muth (1969) proposes a mechanism by which improvements in UTS may cause population redistribution. The classical monocentric city model assumes the city has only a single center, a central business district (CBD) that is the site of all business and commerce. In the model, population densities decline with distance from the city center, because people will pay a premium to avoid commutes to their jobs in the CBD (Arnott et al., 2008). Population densities decrease near the CBD and increase in the suburban areas when transit improvements increase commuting speeds. While the classical monocentric land use theory developed by Alonso (1964), Mills (1967) and Muth (1969) gave a reasonable mechanism through which transportation cost reduction may influence population spatial redistribution, it is still simplistic and crude. A large number of western scholars have made extensions to the baseline model presented above.
The first of these extensions regards modeling polycentric cities. Polycentric cities have emerged in many mega cities since the middle of 20th century due to employment dispersion (Meyer and Gómez-Ibáñez, 1981). Theories and models have been developed to analyze polycentric urban growth based on the concept of the polycentric city (Muller, 1981; Garreau, 1991; Veneri, 2010; Sweet et al., 2016).
The second of these extensions regards travel costs. Travel cost is not only in monetary term, but also in time cost. Anas and Moses (1979), Kim (2007), Baum-Snow (2007), Duranton et al. (2008), Garcia-López (2008), Kotavaara et al. (2011), more recently Chi (2012), considered competitions of different transportation infrastructures and incorporated radial commuting highways into the network of streets. Baum-Snow (2007) assessed the extent to which the construction of new limited access highways had contributed to central city population decline in the United States. He found that one new highway passing through a central city reduced its population by about 18%. Garcia-López (2008) and Chi (2012) investigated the effect of transportation improvements on population changes and extended the finding of Baum-Snow (2007) at a much finer geographical scale. Kotavaara et al. (2011, 2012) and Calvo et al. (2013) paid more attention to the spatial varied impacts of urban transportation. Kotavaara et al. (2012) modelled the relationship between transport accessibility and population change and compared results using six different resolutions. The results showed that the relevance of modelled relationships was noted to be clearly dependent on geographical scale. Calvo et al. (2013) found that the impacts of Madrid subway on population settlement around new subway stations were greater in the outer areas.
The third of these extensions regards the heterogeneous resident characteristics. Residents have heterogeneous preferences of housing by demographic characteristics. Scholars proposed many urban land use models with a consideration of residents’ heterogeneous income level and commuting costs (Beckmann, 1969; Starrs et al., 1989; Glaeser et al., 2008; Lau, 2011; Rogalsky, 2013; Preston et al., 2013). Starrs et al. (1989) stated that the public transport improved the mobility of the transport disadvantaged. Glaeser et al. (2008) found that the public transportation expansion raised the appeal of the city center to the poor in Atlanta, Portland, and Washington D.C. in the 1980s, because it eliminates the need to own a car in U.S. He states that poor residents would live in small dwellings close to the CBD, whereas rich residents should live in large house in the suburbs. Rogalsky (2013) focused on the unequal access to necessary transportation services of working-poor women.
Compared to the extensions in western research, the research in China concerns the extension of modeling polycentric cities and travel costs, but not the heterogeneous resident characteristics. Qin and Du (2000), Ma and Zhang (2006) and Zeng and Lin (2005) analyzed the relationship between urban transportation improvements and suburbanization in big cities of China. Ji et al. (2014) explored the interaction between urban transport and the distribution of population in Beijing. Wu et al. (2016) proposed a city expansion model to capture the coevolution relationship between population diffusion and road growth. In recent years, social-spatial differentiations occur in many big cities of China, such as Beijing (Feng and Zhou, 2008), Nanjing (Wu et al., 2013), Shanghai (Li and Wu, 2006). Not only the poor but also the floating population exhibit residential differentiation (Wang et al., 2010; Wu, 2008). With the constant increasing of the floating population in urban areas, the housing location and intra-city moving of the floating population were paid more and more attention. Liu (2015) found that migrant workers, who being the most marginalized group, have to move persistently as the city expands and modernizes itself. However, it is not clear of the differentiated casual effects of urban transportation improvement among varied social groups in China. The research in China provides almost no direct insights into the group differences concerning the impact of transit system on the population redistribution.
The study on the differentiated casual effects of urban transportation improvement between local residents and floating population has significant implications. From the theoretical aspects, it complements the urban land use theory with a consideration of Chinese institutional context. The previous western literatures pay much attention to heterogeneous resident characteristics in the urban transportation study. Western literatures mainly concern the different effects of urban transportation on the poor and the affluent. Due to institutional differences, there is not a social group in the western counties just like the floating population in China. As a unique social group in China, the floating population not only suffers from the socio-economic disadvantages as the poor, but also suffers from the institutional disadvantages. Our study focusing on the effects of urban transportation on the floating population could supplement the urban land use theory. From the practical aspects, it can assist the urban planner and management to optimally utilize the urban transportation when pursuing reasonable spatial redistribution of urban population. And it is also helpful to decrease residential segregation degree and improve social integration for the floating population.

2.2 Estimated model

Based on the classical monocentric land use model and its extensions on travel costs and polycentric cities, the effects of UTS on population density can be estimated by Equation (1) and Equation (2), respectively.
Based on the model, the effects of UTS on population density can be estimated by the following function (Clark, 1951; McDonald, 1989):
logPi = αm + βmdisiCBD + δmdisitra + εi (1)
where logPi is log population density for subdistrict i; disiCBD is the distance from the subdistrict i centroid to CBD; disitra is the distance from the subdistrict i centroid to the nearest transportation infrastructure; ε is the error term.
Polycentric models allow the possibility of several main centers (Fujita and Ogawa, 1982; Anas and Kim, 1996; Wooldridge, 2009). The resulting spatial distribution of population follows a decreasing density pattern from the CBD and from the subcenters. In a polycentric city the effects of UTS on population density can be estimated by the following function:
logPi = αp + βpdisiCBD + δpdisisub + γdisitra + εi (2)
where logPi, disiCBD, disitra and ε are as described before; disisub is the distance from the subdistrict i centroid to the nearest subcenter.
The BMA is characterized by the polycentric urban spatial structure (Feng et al., 2009; Sun, 2012). To study whether transit improvements affect changes of spatial distribution in the population, we estimate a first-difference specification base on Equation (2).
∆(logPi) = ω0 + ω1disiCBD + ω2disisub + ξ∆(disitra) + ω3Ci + εi (3)
where logPi, disiCBD, disisub, disitra and ε are as described before; ∆(logPi) represents the change of log population density for subdistrict i during one period; ∆(disitra) represents the change of the distance from the subdistrict i centroid to the nearest transportation infrastructure during one period; ξ is a gradient and shows the extent to which the change of population density with the transportation improvements. C represents the control variables, including initial population density.
As previous research points out, transportation improvements are expected to be endogenous to population growth. That is, transportation improvements could foster population growth in suburban areas while population growth in one place may increase the demand for transportation improvements and then stimulates the transportation construction. To deal with this issue, we apply IV regression to estimate the causal effects of transit system improvements on change of spatial distribution of population. IV regression allows consistent estimation when the model has endogenous explanatory variables. In this condition, ordinary linear regression (OLS) generally produces biased and inconsistent estimates (Imbens and Angrist, 1992; Yi, 2014). IV regression can eliminate simultaneous causality bias by an instrumental variable (Z). Z is uncorrelated with the error term ε but is correlated with the endogenous explanatory variables. With this new variable, the IV estimator captures only the effects on the dependent variables of shifts in the endogenous explanatory variables induced by Z whereas the OLS estimator captures not only the direct effects of the endogenous explanatory variables on the dependent variables but also the effect of endogeneity.
We use the Two Stage Least Squares (TSLS) to calculate IV estimates. Specifically, in the first stage we use all the exogenous covariates and the instruments (Z) to predict the transportation improvements (∆(disitra)). In the second stage, we use the predicted transportation improvements (rather than the original ∆(disitra)) to predict the population density change. The TSLS estimation process is as follows.
Stage 1: Regress ∆(disitra) on all exogenous covariates and the instrumental variables (Z) and compute $\Delta (\overline{dis_{i}^{tra}})$ (Isolation of transportation improvements due to shifts in the population demand).
∆(disitra) = γ0 +γ1disiCBD +γ2disisub3Zi +γ3Ci +μi (4)
where Zi is the exogenous instruments that have to satisfy the relevance, cov(Z, ∆(disitra)|X)≠0, and the exogeneity, cov(Z, ε)=0.
Stage 2: Regress ∆(logPi) on$\Delta (\overline{dis_{i}^{tra}})$.
∆(logPi) = ω0 + ω1disiCBD + ω2disisub + ξ$\Delta (\overline{dis_{i}^{tra}})$ + ω3Ci + εi (5)
where $\Delta (\overline{dis_{i}^{tra}})$is predicted changes in distance to transportation infrastructure as estimated in the first-stage.

3 Data and model specification

3.1 Data

The study area of our analysis is BMA. The BMA includes 12 districts of Beijing municipal administrative area, except for four districts of Huairou, Pinggu, Miyun and Yanqing. This definition and territorial scope of the BMA is drawn from Sun (1992), which is widely used in the BMA literatures (Feng et al., 2009; Sun et al., 2012). The BMA covers 9115 km2 of land, and in 2010 had a population of 18.01 million with a density of 1979 people per km2. Also in 2010 the floating population of 6.77 million accounted for 37.59% of the total population: one in every three people in the BMA was a member of the floating population. We divide the BMA into three zones based on the distance to the city center and 6th Ring Road that is a natural and recognized boundary of urban public transit systems in the BMA: city center, inner suburbs and outer suburbs (see Figure 1). The city center comprises Dongcheng District and Xicheng District. The inner suburbs are the subdistricts within the 6th Ring Road or passing through the 6th Ring Road. The outer suburbs are the remaining subdistricts. We use the subdistrict as our unit of observation that includes 226 subdistricts in the entire BMA. As the administrative boundaries of some subdistricts were rearranged in 2000-2010, it poses a problem for the population dynamic analysis at a subdistrict scale over time. We employ the merging method to resolve the problem. The merging method is a process of merging or incorporating the subdistricts, which were split, combined, or partially annexed to neighboring subdistricts in 2000-2010, into a set of new geographic units. The boundaries of this set of new geographic units could be held constant for the population from 2000 to 2010.
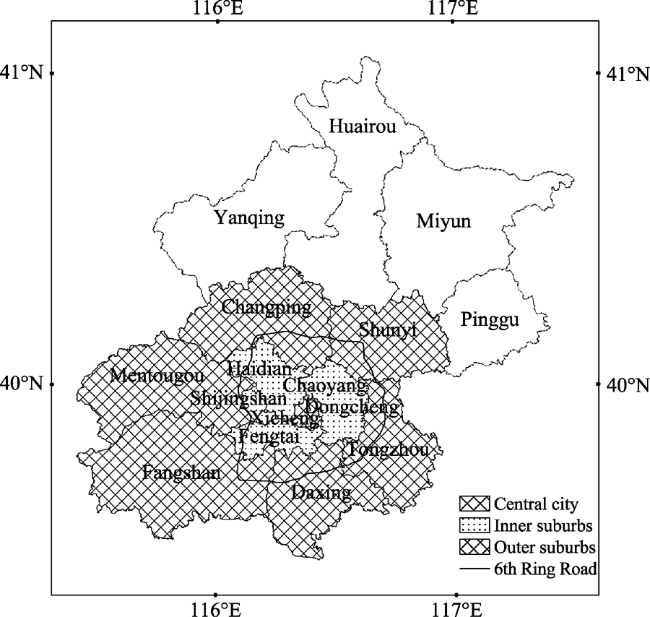
Figure 1 Geographical location of Beijing Metropolitan Area
We use population data from the 2000 and 2010 Population Censuses. We categorize the population of the BMA into two groups: the local residents and the floating population. The local residents refer to those people who have Beijing hukou (household registration) and the floating population refers to the migrants from other provinces and without Beijing hukou.
Our transportation data is obtained from Beijing Travel and Transportation Map, satellite images in Google Earth and Beijing Urban Master Planning (2004-2010). The 2000 transportation data is acquired by vectoring Beijing Travel and Transportation Map in 2000. The 2010 transportation data is the combination of the Beijing transportation map in Beijing Urban Master Planning (2004-2010) and satellite images in Google Earth (the images were obtained in 2010). We obtain the urban transportation spatial data for 2010 by vectorization.

3.2 Model specification

3.2.1 Dependent variables
Our analysis is related to three separate dependent variables. First, in order to assess the impacts of transportation improvements on the total population growth, we examine the 2000-2010 changes in log total population density, ∆(logP2000-2010)=logP2010-logP2000. Second, in order to assess the group differences of the impacts of transportation improvements between the local residents and the floating population, we examine the 2000-2010 changes in log local resident density and the 2000-2010 changes in log floating population density, respectively.
3.2.2 Independent and control variables
As the urban land use theory and Beijing’s population studies illustrated, the main variables related to urban population distribution are distance to employment center, travel cost and residential characteristics. Previous literatures on Beijing’s population density also stated that Beijing’s population spatial distribution were influenced mainly by employment opportunity, housing provision, transportation accessibility and individual characteristics such as income level, migration status and ownership of private vehicles (Qin and Du, 2000; Ma and Zhang, 2006; Feng et al., 2009; Banerjee et al., 2012). In this paper, we choose the distance to large employment center, transportation accessibility and the motorization rate as the explanatory variables. The migration status is also explored by constructing the model for local residents and the floating population respectively. We exclude housing provision and income levels from the control variables, which is based on our statistical analysis. We conduct OLS regression analysis in which the dependent variable is the change of log (total population density) in 2000-2010 and the independent variables include the average second-hand apartment listed prices, the number of rent apartments, the distance to CBD, the distance to the nearest subcenter, the change of distance to the nearest expressway ramp, and the change of distance to the nearest subway station. The result shows that the average second-hand apartment listed prices and the number of rent apartments are both insignificant related to the BMA population change in 2000-2010 (p>0.1). This result is contrary to previous research in which the housing provision is regarded as an important factor in the residential differentiation between local residents and floating population (Logan, 2008; Logan et al., 2009). We think this inconsistence between our study and previous research is the result of our imperfect housing data. Our housing data can only reflect the formal housing market but not the informal housing market which is an important housing source for the floating population. As the informal housing is illegal, the informal housing sale and rent transactions are conducted in private. Most property website, for example Soufun.com, Anjuke.com and Lianjia.com, and housing administration bureau cannot obtain the informal housing transaction data. Therefore, we should strive to mine the informal housing data and improve our analysis in the future study. Although our final estimated model does not include the housing provision, it is included in the error term and does not affect our results about the impact of urban transportation greatly. And we conduct correlational analysis to figure out the existence of multi-collinearity between the income level and the ownership of private vehicle. The results show that the average income is highly correlated to the private vehicle holding rate in the BMA (p<0.01). Thus, these unobserved variables would not significantly disturb and bias our results.
Due to the polycentric spatial structure of the BMA, we choose the distance to CBD and the distance to the nearest subcenter as the proxy to the distance to employment center. As for the travel cost, many Chinese studies stated that transportation accessibility was the main factor influencing urban population spatial distribution (Qin and Du, 2000; Zeng and Lin, 2005). The road network can be divided into three main parts: regular roads, expressways and subways in the BMA. In our study the urban transportation improvement just involves the latter two transit systems. In 2000-2010 Beijing transportation authority made great efforts on extension of rapid and high-capacity transportation infrastructures, such as subway systems and expressway systems; whereas, the regular road network was already highly dense, hence government’s efforts were made on broadening and repairing it in the BMA. We conduct OLS regression analysis to verify whether or not the extension of urban regular road system is statistically significantly related to the population changes in the BMA. In this OLS regression model, the change of log (total population density) in 2000-2010 is regarded as the dependent variables, the change of urban regular road density is regarded as the explanatory variables, the distance to CBD, the distance to the nearest subcenter, and the change of distance to the nearest expressway ramp and the change of distance to the nearest subway station are regarded as the control variables. The results show that the change of urban regular road density is not statistically significantly associated with population density changes in the BMA (Table 1). Therefore, we choose the subway improvements and expressway improvements to measure the change of travel cost. The neglect of regular road network will not have many influences on the transportation accessibility improvement in the BMA. Considering the particularity of subways and expressways, which are only accessed by stations and ramps, we use the distance to the nearest subway station and the distance to the nearest expressway ramp to measure the transportation accessibility. The motorization rate, as an important demographic characteristic, may affect the effects of transportation accessibility, is included as a controlling variable. It is expected that expressway improvements should attract population residing in the areas with high motorization rate. Due to the data unavailability of motorization data by groups, we conduct preliminary quantitative analysis of the effects of motorization rate only for total population and discuss the possible effects by groups. The initial population density is also included as a controlling variable due to the agglomeration effects and the natural population growth.
Table 1 The regression results of urban regular road, 2000-2010
Variables Variable description Coefficient P
Δ(densurr) 2000-2010 Δ[urban regular road density] (km/km2) 0.002 0.425
Δ(disexp) 2000-2010 Δ[distance to the nearest expressway ramp] (km) -0.006 0.447
Δ(dissw) 2000-2010 Δ[distance to the nearest subway station] (km) -0.029 0.001
disCBD Distance to CBD (km) -0.008 0.001
dissub Distance to the nearest subcenter (km) -0.003 0.555
Constant 0.371 0.001
R-squared 0.168
Number of subdistricts 226 226
The main explanatory variables include two types of urban transit improvements: expressway improvements and subway improvements. We construct expressway variable as the 2000-2010 changes in the distance to the nearest expressway ramp, ∆(logdisexp2000-2010)= logdisexp2010-logdisexp2000, and the subway variable as the 2000-2010 changes in the distance to the nearest subway station, ∆(logdissw2000-2010)=logdissw2010-logdissw2000. These distances are computed as the straight-line distances. The geographical locations of CBD and the subcenters in the BMA are set as that in the finding of Sun et al. (2012). As the city center of Beijing is occupied by the Forbidden City, Beijing has developed two CBDs: one is Jinrong subdistrict located in the west of the Forbidden City; the other is Jianwai subdistrict located in the east of the Forbidden City. The subcenters of the BMA included Shangdi subdistrict, Zhongguancun subdistrict, Yayuncun, Gongzhufen, and Yingfeng subdistrict (location of Sinopec Beijing Yanshan Company), which are big urban business areas, hi-tech industrial parks, or large-size state-owned enterprises. To control for initial population density conditions, we use log 2000 population density.
3.2.3 Instrumental variables
We choose the Euclidean spanning tree network and 1956 Beijing subway plan as our instrumental variables. We construct a hypothetical minimum spanning tree expressway network as instrument for actual expressway networks that are referred to as Euclidean spanning tree network. This instrument corresponds to the question of which expressway central planners would have been likely to construct if the sole policy objective had been to connect all targeted destinations on a single network in a least costly manner. In another words, Euclidean spanning tree network corresponds to the objectives of the expressway central planner: connecting Beijing and important cities in north China and minimizing global construction cost. To construct the Euclidean spanning tree network, the first step is to compute straight distances between all possible connections of the network, including Beijing, provincial capitals and other important cities in north China. We then compute Kruskal’s algorithm to identify the minimum number of edges that connect all targeted destinations subject to the minimization of total network distance. As they were implemented with the aim of connecting Beijing and important cities in north China, the expressways happened to cross subdistricts which are located between Beijing city center and these important cities. Therefore, Euclidean spanning tree network is exogenous to population growth and socio-economic development of the BMA. Banerjee et al. (2012), Donaldson (2013) and Faber (2014) all used natural experiments to address the endogenous issue between transportation and economic growth. The validity of the 1956 Beijing subway plan as an instrument variable is based on the fact that this plan is the first subway plan in Beijing, and designed by the Central Government to facilitate military defense, not to facilitate the BMA development. Some scholars have used transportation plans as instrument variables of contemporary transportation, to evaluate their impacts on suburbanization (Baum-Snow, 2007; Garcia-López, 2012).

4 Population spatial distribution and UTS in the Beijing Metropolitan Area

4.1 Change of population spatial distribution between 2000 and 2010

Table 2 shows the change of the spatial distribution of the population in the BMA in 2000-2010. The total population growth came mainly from the inner suburbs. The total population of the inner suburbs accounted for 96% of the BMA’s total population growth. Meanwhile, the total population growth of city center accounted for less than 1% of the total population growth of the BMA. There were also group differences in spatial distribution among the local residents and the floating population. It is remarkable that the local residents grew fastest in the inner suburbs while decreased in the city center. The floating population increased in every zone and the share of the floating population growth in the inner suburbs was 66.81% of the total population growth in the BMA.
Table 2 Population growth in different zones of different groups in Beijing Metropolitan Area, 2000-2010 (million)
Region Population in 2010 Population growth in 2000-2010
Total (% of total population) Local residents (% of total population) Floating population (% of total population) Total (% of total population growth) Local residents (% of total population growth) Floating population (% of total population growth)
City center 2.15(11.94%) 1.59(8.83%) 0.54(3.00%) 0.06(0.94%) -0.20(-3.47%) 0.26(4.39%)
Inner suburbs 13.99(77.68%) 8.04(44.64%) 5.82(32.32%) 5.65(96.15%) 1.68(28.62%) 3.92(66.81%)
Outer suburbs 1.86(10.33%) 1.44(8.00%) 0.40(2.22%) 0.17(2.9%) -0.06(-1.01%) 0.23(3.96%)
BMA 18.01(100%) 11.07(61.48%) 6.77(37.57%) 5.87(100%) 1.42(24.14%) 4.41(75.15%)
Figure 2 demonstrates the population spatial distribution in the BMA in 2000-2010. The total population density decreased in most subdistricts of the city center and in the western mountain areas of outer suburbs. Total population density increased in most subcenters except for Yingfeng subdistrict of Fangshan district where petrochemical industry was dominant. As Beijing municipal government made efforts on moving energy- intensive, polluting businesses out of Beijing, the scale of the petrochemical industry is decreasing in recent years. Shangdi subcenter located in the northern inner suburbs attracted most people among all five subcenters. Shangdi subcenter is an electronic information industrial park, which experienced rapid development since the early 2000s. Total population density increased by the largest level in the inner suburbs encircling the city center which were always located large-scale residence communities, economic-technological development areas, and new satellite towns.
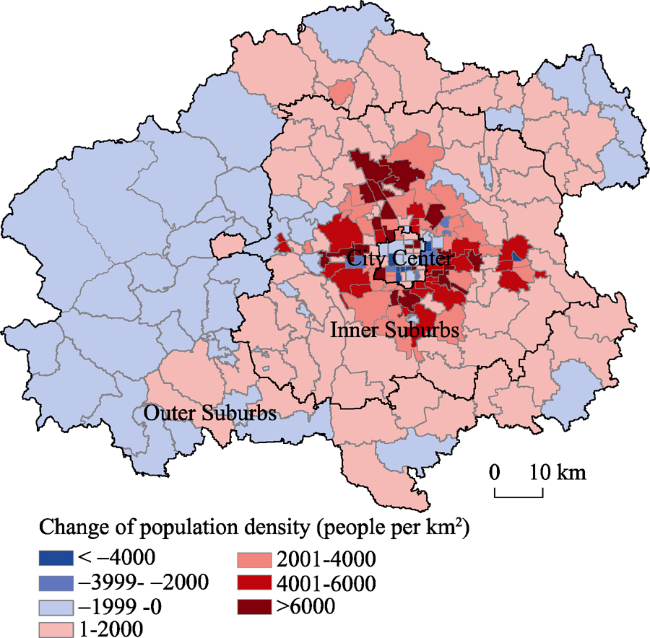
Figure 2 Changes of total population density of BMA at the subdistrict scale in 2000-2010
Figure 3 shows more explicitly the group differences of population growth in 2000-2010. The density of local residents showed a decreasing trend in the city center but an increasing trend in the inner suburbs. The local resident density decreased in Yingfeng subcenter but increased in other subcenters. This is because Yingfeng subcenter’s dominant industry is state-owned petrochemical industry, which have no or little access to the floating population and whose employees are mostly accounted by the local residents. With the decreasing scale of the petrochemical industry, the local resident density showed accordingly a decreasing trend in the Yingfeng subcenter. However, the floating population density showed a totally different geographic pattern which increased in most subdistricts. Specifically, the local resident density decreased in a larger scale, including the city center, most subdistricts of the outer suburbs and the subdistricts of the inner suburbs that were far away from the city center. The local resident density increased by the largest level in the subdistricts of the northern and eastern inner suburbs. The change of the floating population density was totally different from the local residents. The floating population density increased in most subdistricts, except some subdistricts in western outer suburbs and several subdistricts in the city center. They increased by the largest level in the subdistricts of the inner suburbs which were about 12-17 km from the city center and exhibited a ring circling the city center.
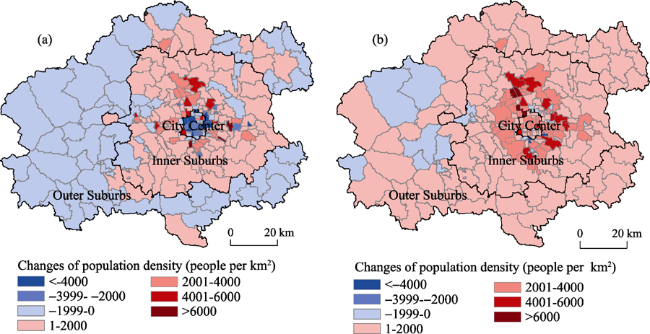
Figure 3 Population density changes of local residents and floating population of BMA at the subdistrict scale in 2000-2010: (a) Local residents; (b) Floating population

4.2 The UTS in Beijing Metropolitan Area

The UTS in the BMA can be described as a combination of a chessboard pattern in the city center and a circular and radial pattern in suburban areas. The ring roads, radial expressways and subways are the arteries of these transit systems (see Figure 4). The First Ring Road circles the Forbidden City. All the other ring roads were constructed as urban areas expanded outwardly. In 2000 Beijing had four ring roads that were 172 km long with the 4th Ring Road serving as the boundary of the built-up area, which is approximately 8 km far away from the center of Beijing. In 2010 Beijing had six ring roads that were 543 km long, threefold the length as 2000. With the urban expansion, the 5th Ring Road became the edge of the built-up area that was roughly 17 km far away from central Beijing and the 6th Ring Road was designed as the regional transit road, a major truck road connecting other cities passing through the center of Beijing. The radial expressways link Beijing to its suburbs and other cities, providing rapid access between the ring roads and creating traffic corridors between Beijing and other cities. In 2010 Beijing had nine radial expressways with a total length of 357 km, doubling that of 2000. In the early 2000s, after Beijing won its bid for the 2008 Olympic Games, the Beijing municipal government began to focus on extending the subway system. In 2000 the Beijing Subway only had 2 lines, 53 km of tracks and 39 stations; by the end of 2010 it has 8 lines, 194 km of tracks and 112 stations in operation.
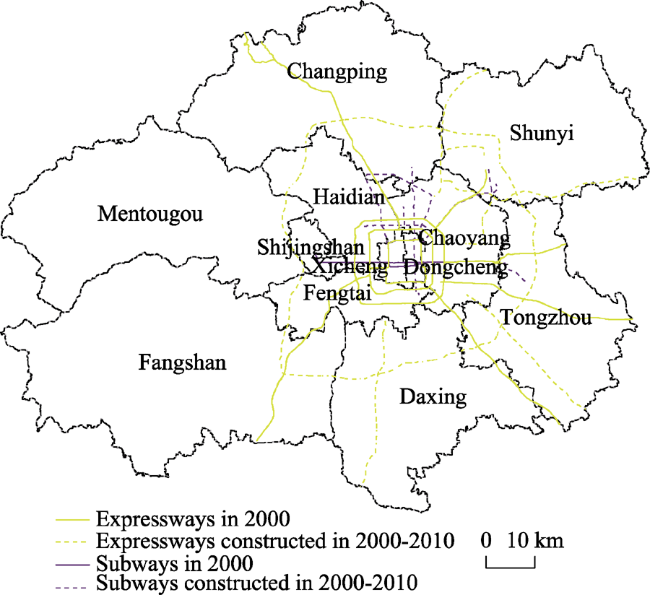
Figure 4 UTS of BMA in 2000 and new transportation improvements in 2000-2010

5 The causal effects of transportation improvements on population redistribution in Beijing Metropolitan Area

5.1 Descriptive statistics

There were 252 subdistricts in 2010 and 268 subdistricts in 2000 in the BMA. After we reorganize the administrative boundaries and design a set of new subdistricts whose boundaries are held constant in 2000-2010, there are 226 sample subdistricts in the BMA, 135 sample subdistricts in the inner suburbs, and 60 sample subdistricts in the outer suburbs. Table 3 presents descriptive statistics for the dependent, independent/control, and instrumental variables. In the entire BMA between 2000 and 2010 the average total growth of log population density was 0.27, and the average growth of log floating population density was as high as 0.92 while the growth of log local resident density was only 0.07. In the inner suburbs between 2000 and 2010 the average growth of log total population density was 0.47, twice that as the entire BMA. In the outer suburbs between 2000 and 2010 the total population density exhibited a declining trend, with the average decline of log total population density as 0.02. The key independent variables--reduction of distance to the nearest expressway ramp and reduction of distance to the nearest subway station--averaged 2.77 km and 4.50 km in the entire BMA, while in the inner suburbs they averaged 2.08 km and 4.35 km and they averaged the highest in the outer suburbs, with 5.72 km and 7.01 km respectively. The average motorization rate was 19.15% in the entire BMA, while it averaged 18.96% in the inner suburbs and it averaged the lowest in the outer suburbs (16.22%).
Table 3 Summary statistics for main variables
Variables Variable description Entire BMA Inner suburbs Outer suburbs
Mean S.D. Mean S.D. Mean S.D.
Dependent variables
∆ (logTP) 2000-2010 △[log(total population density)] 0.271 0.470 0.465 0.474 -0.024 0.292
∆ (logLR) 2000-2010 △[log(local resident density)] 0.065 0.400 0.200 0.429 -0.125 0.228
∆ (logFP) 2000-2010 △[log(floating population density)] 0.916 0.700 1.077 0.632 0.714 0.864
Independent and control variables
∆ (disexp) 2000-2010 △[distance to the nearest expreeway ramp] (km) -2.767 4.675 -2.083 3.383 -5.715 6.600
∆ (dissw) 2000-2010 △[distance to the nearest subway station] (km) -4.497 5.805 -4.354 4.996 -7.006 7.468
disCBD Distance to CBD (km) 20.639 16.401 14.561 8.383 43.148 10.583
dissub Distance to the nearest subcenter (km) 15.209 11.854 11.652 7.528 28.298 12.282
logTP2000 log(total population density) in 2000 7.843 1.839 8.251 1.374 5.768 1.084
logLR2000 log(local resident density) in 2000 7.624 1.827 7.971 1.412 5.651 1.069
logFP2000 log(floating population density) in 2000 5.867 2.180 6.588 1.386 3.108 1.498
Motor The private vehcle amount in every 100 people in 2010 19.149 3.572 18.956 2.686 16.217 1.062
Instrumental variables
dissw56 Distance to the nearest subway station in 1956 plan (km) 13.784 14.371 7.893 7.187 33.874 9.406
dises Distance to the Euclidean spanning tree network (km) 7.072 7.872 4.932 5.151 12.992 10.658
Number of subdistricts 226 135 60

5.2 First-stage results

We conduct the first-stage analysis to test the validity of the instruments. If the instruments are highly correlated with the transportation improvements and uncorrelated with the error term, the instruments are regarded as strong instruments. Table 4 shows that the Euclidean spanning tree network and the 1956 Beijing subway plan are both strong predictors of actual urban transit improvements in 2000-2010. Using all the exogenous covariates and these two instruments, we can predict transportation improvements. This transportation improvement predictor represents the real transportation improvements but is exogenous with the population change. With this transportation improvement predictor, the following IV estimator capture only the effects of transportation improvements on population changes and addresses the issue of endogeneity. First-stage results indicate that expressways were improved close to Euclidean spanning tree network and the subway stations in the 1956 plan, whereas contemporary subway stations were far away from them. Panel A in Table 4 shows that conditional on control variables, in the BMA one kilometer closer to Euclidean spanning tree network resulted in a 0.11 kilometer reduction of the distance to the nearest expressway ramp for total population; and one kilometer farther away from the nearest subway station in the 1956 plan resulted in a 0.19 kilometer reduction of the distance to the nearest contemporary subway station for total population. Panel B and Panel C show in the outer suburbs the estimated coefficients of the distance to the nearest expressway ramp and the distance to the nearest subway stations are around twice that as the inner suburbs. This means that the actual transportation improvements were greater in outer suburbs than that in inner suburbs, conditioning the control variables.
Table 4 First-stage results of the Two-Stage Least Squares (TSLS)
Variables Total population Local residents Floating population
Model 1 Model 2 Model 3 Model 4
∆ (disexp) ∆ (dissw) ∆ (disexp) ∆ (dissw) ∆ (disexp) ∆ (dissw) ∆ (disexp) ∆ (dissw)
Panel A: Entire BMA
dises 0.107*** -0.485*** 0.110*** -0.477*** 0.106*** -0.484*** 0.112*** -0.460***
dissw56 0.652*** -0.190* 0.639*** -0.229** 0.666*** -0.201** 0.648*** -0.200**
disCBD -0.502*** 0.278*** -0.487*** 0.323*** -0.506*** 0.298*** -0.508*** 0.218***
dissub -0.404*** -0.235*** -0.399*** -0.219*** -0.406*** -0.224*** -0.410*** -0.280***
logP2000 -0.088 -0.307 -0.128 -0.433 -0.118 -0.137 -0.175 -0.981***
Motor 0.715 0.224**
Constant 4.680* 1.782 3.410 -2.204 4.965* -0.006 5.272** 7.030***
R-squared 0.491 0.577 0.492 0.586 0.491 0.576 0.491 0.598
Number of subdistricts 226 226 226 226 226 226 226 226
Panel B: Inner suburbs
dises 0.050 -0.676*** 0.078* -0.695*** 0.050 -0.673*** 0.036 -0.655***
dissw56 0.594*** -0.268** 0.605*** -0.275** 0.592*** -0.267** 0.619*** -0.316***
disCBD -0.517*** 0.185** -0.475*** 0.157** -0.523*** 0.196** -0.506*** 0.143*
dissub -0.271*** -0.056 -0.239*** -0.078 -0.277*** -0.047 -0.260*** -0.098
logP2000 0.224 -0.156 0.368 -0.255 0.143 0.014 0.444 -0.881**
Motor 0.313*** -0.213
Constant 1.777 0.983 -6.569* 6.663 2.648 -0.479 0.294 6.869**
R-squared 0.545 0.623 0.580 0.630 0.544 0.622 0.550 0.637
Number of subdistricts 135 135 135 135 135 135 135 135
Panel C: Outer suburbs
dises 0.182** -0.363*** 0.243*** -0.319*** 0.179** -0.368*** 0.250*** -0.326***
disswt56 1.038*** -0.611** 1.415*** -0.340 1.103*** -0.563** 0.842*** -0.845***
disCBD -0.780** 0.715*** -1.069*** 0.507** -0.841** 0.672*** -0.606** 0.915***
dissub -0.547*** -0.233*** -0.616*** -0.283*** -0.561*** -0.242*** -0.511*** -0.198***
logP2000 -1.639 -2.189*** -0.100 -01.730*** -1.835* -2.296*** -1.109* -1.637***
Motor -2.057** -1.477***
Constant 15.335 6.760*** 45.878*** 28.691*** 17.177 7.675 7.184 -2.952
R-squared 0.411 0.810 0.477 0.836 0.420 0.809 0.421 0.835
Number of subdistricts 60 60 60 60 60 60 60 60

Notes: *p<0.10; **p<0.05; ***p<0.01. logP2000 is general designation of log population density in 2000. In Column 1-2 logP2000 refers to logTP2000; in Column 3-4 logP2000 refers to logLR2000; in Column 5-6 logP2000 refers to logFP2000.

5.3 Results of Two Stage Least Squares

In this section we present estimates of the causal effects of the improvements of expressways and subways on population growth. In addition, these estimates are compared between the local residents and the floating population. In IV regression, the distance to the Euclidean spanning tree network and the distance to the nearest subway station in the 1956 plan enter as instruments for the actual improvements of expressways and subways. Comparing the TSLS results and their OLS counterparts, we find that in the BMA the TSLS estimators of transportation improvements are smaller than the OLS estimator while in the inner suburbs the TSLS estimators are larger than the OLS estimator. In the whole urban area, the OLS regression would overestimate the effects of transportation improvements on population growth because high population density areas would attract much more transportation infrastructure investment. On the contrary, in the suburban areas, the OLS regression would underestimate the effects of transportation improvements because a large number of government’s transportation infrastructure investments may be placed on undeveloped areas and aim to attract population. We use three statistics: F-statistic, Wald χ2 -statistics and R-squared to measure the fit of the estimation model. F-statistic and Wald χ2 -statistics are used to test the whole estimation model for the OLS regression and IV regression respectively, and R-squared is used to measure how well the estimates have explained the actual dependent variable. Except for the estimation model for the floating population in the outer suburbs, F-statistic and Wald χ2 -statistics are statistically significant in most estimation models. This shows that the fit of most estimation models is good. The low R-squared values of most estimation models in Table 5 indicate that we could not produce reasonably precise predictions. This might be caused by the difficulty to predict human behavior, such as population spatial distribution. Therefore, despite of the low R-squared, our conclusions about how changes in the population density changes are associated with changes in the transportation improvement are still valid.
Table 5 First-difference regression of the determinants of population growth, 2000-2010
Variables Δ(logTP) Δ(logLR) Δ(logFP)
Model 1 Model 2 Model 3 Model 4
OLS IV OLS IV OLS IV OLS IV
Panel A: Entire BMA
Δ(disexp) 0.010 -0.004 0.012** 0.008 0.006 -0.014 0.018* 0.036
Δ(dissw) -0.029*** -0.027*** -0.026*** -0.021** -0.018*** -0.020** -0.045*** -0.025*
disCBD -0.025*** -0.025*** -0.028*** -0.028*** -0.013*** -0.013*** -0.050*** -0.049***
dissub -0.012*** -0.014** -0.012*** -0.011* -0.010*** -0.015** -0.002 0.011
logP2000 -0.229*** -0.225*** -0.204*** -0.202*** -0.137*** -0.131*** -0.357*** -0.326***
Motor -0.036*** -0.037***
Constant 2.664*** 2.634*** 3.217*** 3.219*** 1.474*** 1.433*** 3.917*** 3.659***
R-squared 0.354 0.342 0.388 0.387 0.204 0.168 0.385 0.357
F 24.13*** 23.11*** 11.24*** 27.5***
Wald χ2 97.34*** 119.80*** 45.88*** 108.69***
Number of subdistricts 226 226 226 226 226 226 226 226
Panel B: Inner suburbs
Δ(disexp) 0.017 -0.009 0.021 -0.009 0.012 -0.022 0.031** 0.028
Δ(dissw) -0.020** -0.033*** -0.019** -0.030** -0.011 -0.025* -0.030*** -0.042***
disCBD -0.023*** -0.029*** -0.026*** -0.032*** -0.011 -0.020** -0.041*** -0.045***
dissub -0.009 -0.012* -0.012* -0.014** -0.012* -0.016** 0.007 0.004
logP2000 -0.267*** -0.261*** -0.280*** -0.269*** -0.160*** -0.151** -0.400*** -0.411***
Motor -0.027 -0.019
Constant 3.055*** 3.022*** 3.774*** 3.534*** 1.761*** 1.718*** 4.171*** 4.273***
R-squared 0.332 0.308 0.346 0.318 0.163 0.116 0.444 0.438
F 12.82*** 11.26*** 5.03*** 20.6***
Wald χ2 61.37*** 63.11*** 24.76*** 102.48***
Number of subdistricts 135 135 135 135 135 135 135 135
Panel C: Outer suburb
Δ(disexp) 0.008 0.001 0.008 0.006 0.006 -0.010 0.028 0.403
Δ(dissw) -0.008 -0.015 0.003 -0.015 -0.003 -0.016 -0.012 0.231
disCBD -0.010** -0.008 -0.009** -0.008 -0.004 0.000 -0.056*** -0.143
dissub 0.003 -0.002 0.003 0.001 0.004 -0.001 0.014 0.231
logP2000 0.057 0.035 0.063 0.054 0.067* 0.030 -0.159* 0.607
Motor -0.015 -0.030
Constant -0.039 0.047 0.152 0.412 -0.436 -0.322 3.316*** 2.372
R-squared 0.352 0.317 0.354 0.346 0.223 0.001 0.432 0.001
F 5.88*** 4.84*** 3.10*** 8.20***
Wald χ2 30.63*** 32.32*** 13.89** 4.25
Number of subdistricts 60 60 60 60 60 60 60 60

Notes: *p<0.10; **p<0.05; ***p<0.01. logP2000 is described as Table 3.

Panel A in Table 5 shows results of the effects of the improvements of expressways and subways on population growth for the entire BMA. It indicates that only subway improvements were significantly positively associated with population growth. Although OLS results show weak negative association between expressway improvements and the growth of the floating population, IV results indicate this association was not statistically significant. For the total population, coefficients on the subway improvements indicate that subdistricts with greater reductions in the distance to their nearest subway stations grew more quickly. OLS results indicate that conditional on control variables, reducing the distance to the nearest subway station by one kilometer was associated with approximately 2.9% population growth. IV estimates imply roughly a 2.7% population growth for each kilometer reduced to the nearest subway station. In respect to the social group differences, the greater effect of the subway improvements was on the floating population. OLS results indicate that conditional on control variables, reducing access by one kilometer to the nearest subway station was associated with a 4.5% increase in the floating population, while IV estimates imply a 2.5% increase in the floating population by reducing each kilometer to the nearest subway station. This implies that urban subway system had more appealing to the floating population than the local residents. It is mainly caused by the rather low fare of urban subway system. Beijing’s subway had been one of the world’s cheapest because of a massive government subsidy during 2000 and 2010. This could result in excessive floating population growth and residential segregation between the local residents and the floating population. First, the rather low fare largely cut down the travel cost and mitigated the floating population’s living pressure unnaturally in Beijing. This might attract more floating population to migrate into Beijing and aggregate excessive population growth. Secondly, the low fare of urban subway system attracts massive floating population to living near the subway stations and might result in residential segregation. Residential segregation hampers the floating population’s economic progress and goes against urban economic sustainability through negative neighborhood effects, spatial mismatch between jobs and residents, and shortage of education, health care, medical treatment services. Columns 3 and 4 in Table 5 is the results of considering the motorization rate for the total population. It shows that expressway improvements still had no significant effects on the population growth in all the three zones conditioning the motorization rate. The reason is the low motorization rate in the suburbs where a large amount of new expressways were constructed in 2000-2010. The motorization rate declined away from CBD. The population growth in the suburbs had limited response to the expressway improvements due to the low motorization rate. As for the group differences in the motorization rate, the floating population were facing many institutional limitations on car purchasing due to hukou system. This would result in the less response to the expressway improvements for the floating population conditioning on the motorization rate.
Panel B and Panel C in Table 5 show the regional differences of the impact of the transportation on the population growth. The results show that subway improvements had significantly positive effects on population growth in the inner suburbs, not in the outer suburbs. This coincides with the convergence of the subway system in the BMA. The subways were constructed within 6th Ring Road and had not been extended to the outer suburbs. For the total population, OLS results indicate that conditional on control variables reducing access to the nearest subway station by one kilometer was associated with a population growth of 2%. IV estimates imply about a 3.3% population growth by reducing each kilometer of access to the nearest subway station. The group differences of the effects of the subway improvements in the inner suburbs were significant. The subway improvements were significantly positively associated with the growth of the floating population, while it just had a weakly significant effect on the growth of the local residents. For the floating population OLS estimates imply a 3% population growth in the inner suburbs by reducing each kilometer of access to the nearest subway station; whereas, IV variable estimates indicate a 4.2% population growth by reducing each kilometer of access to the nearest subway station. The weakly significant association between the subway improvements and the local resident growth in the inner suburbs implies that the local residents moved to the inner suburbs not because of the increased transportation accessibility, but rather other factors, for example, urban renewal, factory suburbanization, and low-cost affordable housing construction.
The other finding in Table 5 is that the expressway improvements did not have a statistically significant impact on the population growth of either the inner suburbs or the outer suburbs. This is in contrast to previous research done in western developed countries and also contradicts the original intention of building expressways in the BMA (Baum-Snow, 2007; Garcia-López, 2012). The Beijing municipal government expects that expressways can induce the population in the city center to move to the outer suburbs, which would promote the urban polycentric development of the BMA. However, the causal effects of expressway improvements contradicted its original intention. It is mainly resulted from differences of the population composition and the motorization rate in the suburban areas between China and western countries. Most new expressways were constructed in the suburban areas in the BMA in 2000-2010. But in these areas the floating population accounted for the majority group and they had less access to private vehicles. This resulted in the fact that the population growth had limited response to the expressway improvements due to the low motorization rate. In western countries, highways give rise to suburbanization and the affluent population move to suburban areas to seek better living condition with the popularity of private vehicles. However, the living condition of suburban areas in China is not as desirable as western countries (Zhao, 2011). This cause the affluent people are willing to reside close to the city center. The suburbanization in Chinese city came mainly from the urban renewal, industry spatial restructuring and low-cost affordable housing construction, which involve mainly the socio-economic disadvantaged people. These disadvantaged people largely rely on public transportation rather than private vehicles (Chen and Cai, 1996; Gao and Jiang, 2002). Therefore, expressway improvements were not an incentive of suburbanization and did not significantly affect population redistribution in metropolitan areas in China.

6 Conclusions and discussion

This study analyzes the spatial redistribution of population in the BMA between 2000 and 2010 and estimates the causal effects of urban transportation improvements on population spatial redistribution, focusing on the group differences between the local residents and the floating population. Due to the endogeneity of transportation improvement and population growth, IV regression model is applied to avoid this problem, and then to estimate the extent to which urban transportation improvement had casual effects on population growth across the BMA. We find that:
Firstly, the BMA was at a suburbanization stage between 2000 and 2010, which refers total population density decreased in the city center but increased in the inner suburbs. This finding is consistent with previous suburbanization studies in Beijing (Hu and Foggin, 1994; Zhou, 1996). In addition, we find that Beijing’s suburbanization was mostly attributed to the local residents rather than the floating population, which is always neglected by urban researchers.
Secondly, IV regression results verified that urban transportation improvements had significantly effects on population redistribution in the BMA. However, the regional studies show this association was not applicable for the local residents in the inner suburbs. It indicates that suburbanization in the BMA was not driven by the extension of UTS. This conclusion contradicts previous suburbanization studies in China, which states that transportation accessibility improvements were an incentive for people to move to suburban areas.
Thirdly, the positive effects of transportation improvements on population growth just occurred in inner suburbs, not in outer suburbs. This is related to the insignificant association of expressway improvement with population growth. This finding is different from the research on cities in western countries. It is mainly resulted from differences of the population composition in the suburban areas between China and western countries. The majority group is the floating population in the suburban areas of China, who rely mostly on public transportation; whereas the affluent people is the largest group in the suburban areas of western countries, who have more access to private vehicle.
These findings have considerable implications in the decision-making process of urban planning and management. Firstly, urban transportation accessibility improvement can be utilized as an essential tool in the process of pursuing reasonable redistribution of urban population for the urban planners and authorities. Secondly, the effects of urban transportation improvements on population growth should be assessed scientifically. It is given too little attention to that the extension of UTS had limited effects on inducing population moving to suburban areas and controlling center city’s population under the present circumstances in China. In other words, urban transportation improvements gave rise to the population growth in suburban areas, but did not induce people to move from city center to suburban areas in the big cities in China. Thirdly, it is urgently needed to improve urban public transportation accessibility in the suburban areas, especially in the outer suburbs. This is an essential step to achieve floating population equalization of basic services and prompt the floating population to integrate into local society. Moreover, it is necessary to plan and design reasonable and scientific UTS in order to control excessive population growth and promote residential integration. And residential integration would advance the floating population’s economic progress and urban competitiveness increasing. Even though it can mitigate traffic congestion and reduce automobile gas emission, the excessive subsidy on urban public transportation may aggregate heavy population pressure and residential differentiation in the BMA. Therefore, it should be considered and evaluated the dual effects of urban public transportation on urban sustainability development.

The authors have declared that no competing interests exist.

[1]
Alonso W, 1964. Location and Land Use. MA, USA Harvard University Press.

[2]
Anas A, Mosesm L N, 1979. Mode choice, transport structure, and urban land use.Journal of Urban Economics, 6(2): 228-246.A theoretical model of the urban land market is solved to examine the impact of bimodal passenger transportation on equilibrium residential land use. In this model travel to the central business district occurs on a dense system of radial roads or bus routes and a competing system or radial expressways or mass transit lines fed by a subsidiary system of densely spread access streets. Under rational behavior assumptions for households, it is shown that various basic urban forms can result depending on the relative generalized cost characteristics of the competing dense and sparse radial networks. The basic urban forms yield fundamental shapes, differing as to the relative geometry and position of the market areas for the two modes. The standard Alonso-Muth model of unimodal travel and circular urban form is found to result as a special case in several of these cases. American urbanized areas of various sizes and modal mix provide plausible examples for each of the basic forms. The paper concludes with a discussion of the model's implications as a framework for examining optimum urban transport structure and the proliferation of transport routes as a function of urban size.

DOI

[3]
Arnott R J, McMillen D P, 2008. A Companion to Urban Economics. Blackwell: Oxford, UK.

[4]
Baum-Snow N, 2007. Did highways cause suburbanization?The Quarterly Journal of Economics, 122(12): 775-805.

DOI

[5]
Beckmann M J, 1969. On the distribution of urban rent and residential density. Journal of Economic Theory, 1(1): 60-67.This paper develops a simple model to illustrate the determination of equilibrium prices and quantities in urban residential land use under perfect competition. Assuming equal tastes and logarithmic utility functions it is shown that commuting distance rises with income. Assuming a Pareto income distribution the differential equation equating supply and demand may be solved in closed form. Rent, density and income turn out to be power functions of distance. A simple relationship between city population and total area is also obtained.

DOI

[6]
Brezzi M, Veneri P, 2014 Assessing polycentric urban systems in the OECD: Country, regional and metropolitan perspectives.European Planning Studies, 23(6): 1128-1145.Contemporary urban systems in OECD countries are structured around functional regions, which often overcome established city boundaries. Reading space in terms of functional regions allows assessing changes in urban hierarchies and spatial structures, including the polycentricity of urban systems at national, regional and metropolitan scale. By using a harmonised definition of functional urban areas in OECD countries, this paper first provides a sound definition of polycentricity at each spatial scale, highlighting for each of them the different links with policy. Second, it provides measures of polycentricity and explores the economic implications of different spatial structures. Results show that relatively more monocentric regions have higher GDP per capita than their more polycentric counterparts. At country level, on the other hand, polycentricity is associated with higher GDP per capita.

DOI

[7]
Calvo F, Oña J D, Arán F, 2013. Impact of the Madrid subway on population settlement and land use.Land Use Policy, 31(2): 627-639.This paper studies the impact of the recent expansion of the subway system in Madrid (Spain). The population, land use and transit system evolution is described and relations between them are analyzed. It was found that residential developments and population growth in the vicinity of the new subway stations have been greater in the outer areas of Madrid than in the city center and Madrid's satellite towns. These effects have been even greater in the new suburbs that have sprung up simultaneously with the subway. Urbanization and population settlement is substantially more dynamic in areas affected by subway expansion than in similar areas elsewhere (whether or not they are served by urban rail). The impact of distance to the station can be seen in the areas around the new stations in the outer areas of Madrid and in the satellite towns, where population density diminishes as distance increases. This effect is more pronounced in the development of new urban areas spurred by new subway stations, where the speed and importance of the population settlement diminishes as distance increases. Therefore, these results demonstrate the benefits of an integrated land use and transit system planning.

DOI

[8]
Chi G, 2012. The impacts of transport accessibility on population change across rural, suburban, and urban areas: A case study of Wisconsin at subcounty levels.Urban Studies, 49(12): 2711-2731.A large body of research has found that highways and airports have played important roles in promoting development and population growth (or decline). However, little attention has been paid to the possible spatial variation of their effects on population change. This study uses data related to population change in 198009“90 at the minor civil division level in Wisconsin to investigate the effects of highway and airport accessibility and accessibility improvements on population change across rural, suburban and urban areas. The results show that the effects vary across the three area types. In rural areas, highway improvement and airport accessibility promote population growth; in suburban areas, airport accessibility promotes population growth but highway accessibility facilitates population flows; and in urban areas, neither highways nor airports have a statistically significant effect on population change. The findings have important implications for local transport planning, as highways and airports play different roles along the rural09“urban continuum.

DOI

[9]
Clark C, 1951. Urban population densities.Journal of the Royal Statistical Society, 114(4): 490-496.

DOI

[10]
Duranton G, Turner M A, 2008. Urban growth and transportation.Review of Economic Studies, 79(4): 1407-1440.

[11]
Feng J, Wang F, Zhou Y, 2013. The spatial restructuring of population in metropolitan Beijing: Toward polycentricity in the post-reform era.Urban Geography, 30(7): 779-802. (in Chinese)Based on data from the third (1982), fourth (1990), and fifth (2000) Population Census of China, this research examines the changing patterns of population distribution in the Beijing metropolitan area in the post-reform era. In the mid-1980s, China launched a series of urban land use reforms aimed toward achieving a market economy. A direct impact of these reforms in Beijing was the restructuring of land uses, evidenced by the relocation of central-city residents to the suburbs to make room for commercial development. This residential suburbanization trend emerged during the 1980s and accelerated in the 1990s. Population change rates varied significantly across subdistricts, and variation was much greater in the 1990s than in the 1980s, indicating an increasingly diverse set of growth trajectories across metropolitan Beijing over time. Various population density functions are tested. The population density pattern is best characterized by a monocentric model in 1982, a dual-centered model in 1990, and a seven-centered model in 2000. This transition in Beijing's urban form toward polycentricity is similar to trends in most Western cities.

DOI

[12]
Feng J, Zhou Y, 2008. Restructuring of socio-spatial differentiation in Beijing in the Transition Period.Acta Geographica Sinica, 63(8): 829-844. (in Chinese)Based on the data at the level of sub-district of the third population census in 1982 and the fifth one in 2000, the authors try to analyze the characteristics of socio-spatial differentiation in Beijing Metropolitan Area and calculate several indices, including the information entropy, the absolute differentiation index and the relative one, and the index of residential segregation, to indicate the features of the restructuring of socio-spatial differentiation in Beijing Metropolitan Area. The authors prove that the scale of sub-districts is still an important spatial unit for studying urban socio-spatial structure in China with enough maneuverability. The analysis of the 2000 census data shows both the pattern of socio-spatial differentiation of each kind of residential population, including density of residential population, migrant population, family size, old people, population of each kind of educational level, and the minorities, and that of the employment and housing status under the background of suburbanization and the transition of urban economy in Beijing Metropolitan Area.The authors find out that the degree of socio-spatial differentiation of Beijing Metropolitan Area in most social indices decreased in the period 1982-2000, except for several indices including the old, sex ratio, family size and the farmers on the basis of the absolute differentiation model. In the same period, on the basis of the relative differentiation model, they find out that the spatial distribution of migrant population, the minorities, population with higher education level, and the employment population of the secondary and the tertiary industries tend to accord with the spatial pattern of total urban population, while the old, the illiterate and the farmers do not. From 1982 to 2000, the residential mixture of most demographic indices tend to be increasing, while that of the old, the migrants and the farmers does not. Generally speaking, the change of the information entropy indicates that urban social spatial structure tend to be more complex with more and more heterogeneity, which accords with the findings of similar research on the basis of the analysis of Beijing's social areas. Most important of all, by contrast, the analysis by differentiation models show us more details about urban socio-spatial differentiation and its restructuring, which can also be indicated from the restructuring of the relationship between the socio-spatial differentiation and the distance from the city center. Finally, the authors put forward a theoretical framework based on the evolution of system, market and culture in order to explain the restructuring of socio-spatial differentiation of Beijing Metropolitan Area in the transition period.

DOI

[13]
Fujita M, Ogawa H, 1982. Multiple equilibria and structural transition of non-monocentric urban configurations.Regional Science and Urban Economics, 12(82): 161-196.A model of non-monocentric urban land use is presented, which requires neither employment nor residential location to be specified a priori. It is shown that the model is capable of yielding multicentric pattern as well as monocentric and dispersed patterns, and that the model generally yields multiple equilibria under each fixed set of parameter values. It is also shown that the city may undergo a catastrophic structural transition when the parameters take critical values.

DOI

[14]
Garcia-López M, 2012. Urban spatial structure, suburbanization and transportation in Barcelona.Journal of Urban Economics, 72(S2/3): 176-190.I investigate the effect of transportation improvements on changes in population location patterns in Barcelona between 1991 and 2006. At a much finer geographical scale, I verify and extend the finding of Baum-Snow (2007a) that transportation cause suburbanization: highway and railroad improvements foster population growth in suburban areas, whereas the transit system also affects the location of population inside the CBD. To estimate the causal relationship between the growth of population (density) and transportation improvements, I rely on an instrumental variables estimation which uses distances to the nearest Roman road, the nearest 19th century main road, and the nearest 19th century railroad network as instruments for the 2001-1991 changes in distance to the nearest highway ramp and the distance to the nearest railroad station.

DOI

[15]
Garreau J, 1991. Edge City: Life on the New Frontier. New York, USA: Doubleday.First there was downtown. Then there were suburbs. Then there were malls. Then Americans launched the most sweeping change in 100 years in how they live, work, and play. The Edge City.

[16]
Glaeser E L, Kahn M E, Rappaport J, 2008. Why do the poor live in cities? The role of public transportation.Journal of Urban Economics, 63: 1-24.More than 19 percent of people in American central cities are poor. In suburbs, just 7.5 percent of people live in poverty. The income elasticity of demand for land is too low for urban poverty to come from wealthy individuals' wanting to live where land is cheap (the traditional explanation of urban poverty). A significant income elasticity for land exists only because the rich eschew apartment living, and that elasticity is still too low to explain the poor's urbanization. The urbanization of poverty comes mainly from better access to public transportation in central cities.

DOI

[17]
Hashimoto S, Taniguchi M, Matsunaka R, 2009. Relation of public transportation service level and city diffusion by area based population density.Journal of the City Planning Institute of Japan, 44: 117-123.Relation of public transportation service level and city diffusion by area based population density HASHIMOTO Shinsuke , TANIGUCHI Mamoru , MATSUNAKA Ryoji Journal of the City Planning Institute of Japan 44(1), 117-123, 2009-04-25

[18]
He S, 2010. New-build gentrification in central Shanghai: Demographic changes and socioeconomic implications. Population, Space and Place, 16(5): 345-361.In Shanghai, globalised urban images and a well-functioning accumulation regime are enthusiastically sought after by urban policy, and explicitly promoted as a blueprint for a civilised city life. The city is celebrating its thriving neo-liberal urbanism by implementing enormous new-build gentrification, mostly in the form of demolition鈥搑ebuild development involving direct displacement of residents and landscapes. This study aims to understand demographic changes and the socioeconomic consequences of new-build gentrification in central Shanghai. The paper first examines demographic changes between 1990 and 2000 in central Shanghai, i.e. the changing distribution of potential gentrifiers and displacees. It then looks into two cases of new-build gentrification projects in central Shanghai, to compare residents' socioeconomic profiles in old neighbourhoods and new-build areas. This study also examines the impacts of gentrification on displacees' quality of life and socioeconomic prospects. Because the enlarging middle class and the pursuit of wealth-induced growth by the municipal government are turning the central city into a hotspot of gentrification, inequalities in housing and socioeconomic prospects are being produced and intensified in the metropolitan area. This study thus emphasises that critical perspectives in gentrification research are valuable and indispensable. Copyright 2009 John Wiley & Sons, Ltd.

DOI

[19]
Huang Y, Jiang L, 2009. Housing inequality in transitional Beijing.International Journal of Urban and Regional Research, 33(4): 936-956.Abstract Abstract The market transition in China has resulted in significant social inequality, including housing inequality, in a formerly egalitarian society. This article provides both a conceptual framework and an empirical analysis of housing inequality in transitional urban China. Using the 1995 1% Population Survey and the 2000 Census data for Beijing, it shows that there was significant housing inequality between different socio-economic and institutional groups, and that the reforms in the late 1990s aggravated it. While emerging market mechanisms began to contribute to housing inequality, socialist institutions such as the household registration ( hukou ) system continued to be significant in the late 1990s, although there is evidence of the declining importance of other institutional factors such as political status. This study contributes to the market transition debate by arguing that different elements of the socialist institutions follow different paths in the reform and thus have different impacts on social inequality. Résumé En Chine, le marché de transition s’est traduit par une inégalité sociale considérable, y compris en matière de logement, dans une société autrefois égalitaire. Cet article fournit un cadre conceptuel et une analyse empirique de l’inégalité du logement dans la Chine urbaine en transition. Exploitant les données de l’enquête sur 1% de la population nationale de 1995 et celles du recensement de 2000 pour Beijing, il montre qu’il existait une nette inégalité de logement entre différents groupes socio-économiques et institutionnels, laquelle a été aggravée par les réformes de la fin des années 1990. Tandis que les mécanismes d’un marchéémergent se sont mis à alimenter l’inégalité de logement, des institutions socialistes telles que le système d’enregistrement des ménages ( hukou ) ont gardé leur prépondérance, même si on peut démontrer le recul d’autres facteurs institutionnels comme la position politique. Cette étude s’inscrit dans le débat sur le marché de transition en affirmant que différents éléments des institutions socialistes suivent des trajectoires différentes dans le cadre de la réforme, ayant donc des impacts différents sur l’inégalité sociale.

DOI

[20]
Ji W, Wang Y, Zhuang Det al., 2014. Spatial and temporal distribution of expressway and its relationships to land cover and population: A case study of Beijing, China.Transportation Research Part D Transport & Environment, 32: 86-96.The interaction between urban transport, land cover change and the distribution of population is a typical manifestation of the urbanization process. As high-grade road, expressway plays a significant role in promoting resource circulation and economic development. Based on the road distribution, land cover and population census data, this study specifically probed the relationship between the expressways and the land cover and population of Beijing. The results show that: (1) as the distance from an expressway increases, the amount of built-up land gradually decreased, and the transfer of land cover near the expressway was more intensive and frequent when compared with that of the whole city; (2) In 2010, a district that was less than 3km from both sides of the expressway and which occupies one-quarter of the entire city had concentrations of 42% industrial land, 58% of settlement land, and 76% transportation land of the entire city; (3) As for Beijing, the population density was positively correlated to road density, and population density declined with a corresponding increase in buffer distance; (4) The ring area between the Fifth and the Sixth Ring Road featured the greatest density of expressways and the most dramatic changes in both land cover and population. According to our study, there a positive interactive feedback relationship between the expressways, land cover and population of Beijing. Also, due to the concentration of population, industry and transport system around the expressways, special attention should be paid to environmental pollution and the inhabitants health in this area.

DOI

[21]
Logan J R, 2008. Chapter 14. Temporary Migrants in Shanghai: Housing and Settlement Patterns. The New Chinese City: Globalization and Market Reform. Blackwell Publishers Ltd.Summary This chapter contains section titled: Studying Migrants in the Context of China Migrant Housing Patterns Geographical Distribution of Migrants Conclusions Acknowledgments

DOI

[22]
Logan J R, Fang Y, Zhang Z, 2009 Access to housing in urban China.International Journal of Urban & Regional Research, 33(4): 914-935.Abstract Abstract Like income inequality, housing inequality in urban China is strongly affected by state policies that give preferential treatment to insiders. In this case, the key policies are related to their residence status, which involves not only their migration history but also their legal position. Using data from the Chinese census of 2000 for eight large cities, this study shows how residence status affects access to various pathways to housing. In addition to the well-known marginal housing situation of the recent ‘floating population’, it documents surprising advantages for migrants with urban registration status and persistent disadvantages for rural migrants regardless of how long they have lived in the city. Résumé Comme l’inégalité de revenu, l’inégalité de logement dans les villes chinoises est nettement affectée par les mesures étatiques qui privilégient les résidents en place. En l’occurrence, les politiques déterminantes s’attachent au statut de résidence, ce qui recouvre à la fois l’historique migratoire des individus et leur situation juridique. 08 partir des données du recensement chinois de 2000 dans huit grandes villes, l’étude montre comment le statut de résidence influe sur l’accès aux différents canaux conduisant à un logement. Outre la condition de logement marginale bien connue de la 00population flottante03 récente, sont exposés les surprenants atouts des migrants qui sont enregistrés comme urbains, et les inconvénients persistants que rencontrent les migrants ruraux quelle que soit la durée pendant laquelle ils ont vécu dans la ville.

DOI PMID

[23]
Kim D S, 2007. Location modeling of population and land-use change in rural area by new expressway.Journal of Urban Planning & Development, 133(3): 201-210.

[24]
Kotavaara O, Antikainen H, Mathieu Met al., 2012. Scale in the effect of accessibility on population change: GIS and a statistical approach to road, air and rail accessibility in Finland, 1990-2008.Geographical Journal, 178(4): 366-382.The matter of scale is often ignored when analysing accessibility and its effects on population change. While accessibility has a concentrating effect on the activities of society on a regional scale, it also has a decentralising effect within urban areas in developed countries, including Finland. Population change is the outcome of numerous individual location choices. However, the scale on which these choices form a pattern related to transport accessibility is unclear, because the increasing stochasticity in an accurate resolution forces consideration of the effect of accessibility on population dynamics in the context of local characteristics. The matter of scale on modelling the relationship between transport accessibility and population change is considered in this article by comparing results using six different resolutions: namely side lengths of grid cells involving 2, 4, 8, 12, 16 and 24 kilometres. Road, air and rail accessibility were related to population change with non-linear regression, generalised additive models (GAM). Road accessibility was assessed by potentials originating from a gravity model. For revealing the effect on population change, air and rail accessibility were calculated as travel times to airports and stations. Analyses were based on exact population grid-cell data, an accurate model of road and rail networks and using geographical information systems (GIS). The study shows that population change was strongly related to potential accessibility. Airport accessibility also had high importance, whereas railway accessibility did not have any significant effect. The relevance of modelled relationships was noted to be clearly dependent on geographical scale. The models have good predictive ability at a 24 24-km resolution, but in resolutions more accurate than 12 12 km, much of the predictive power decreases. Our results strongly indicate that scale matters in accessibility analysis, and it should be taken into account in forthcoming population change studies.

DOI

[25]
Kotavaara O, Antikainen H, Rusanen J, 2011. Population change and accessibility by road and rail networks: GIS and statistical approach to Finland 1970-2007.Journal of Transport Geography, 19(4): 926-935.This study analyzes the relation of accessibility by road and railway network to population change between the years 1970–2007 in Finland. Accessibility is evaluated at built-up area unit and municipal levels by potential accessibility analysis and by measuring accessibility to network. Analyses are done in decadal periods by using geographical information systems (GIS) and data about road and railway networks involving digitized speed limits and geometry for each period. Accessibility variables and population change are related by generalized additive models (GAMs). The results indicate that the Finnish population has concentrated to areas with high road-based potential accessibility, especially since the opening in the Finnish economy in the 1990s. The accessibility of railway network was found to have affected the population change in the 1970s, when local level traffic reduced in the entire country, and in 2000–2007, following remarkable investments in long-haul transport.

DOI

[26]
Lau C Y, 2011 Spatial mismatch and the affordability of public transport for the poor in Singapore’s new towns.Cities, 28(3): 230-237.Singapore has redeveloped its Central Area into business districts and relocated the affected population to new towns. Unfortunately, this strong center policy has hindered the development of employment sub-centers. Most jobs are located in the Central Area, resulting in a spatial mismatch that the government is attempting to address by building a world-class public transport system. However, the poor not only face affordability problems and long travel times for employment, but they are also experiencing a shrinking supply of employment due to economic restructuring. Route tests were conducted, and the results indicate that the poor, who generally choose to travel by bus, have to spend up to 9.8% of their household income per month and 70 min per trip from their neighborhoods to the city center. Those who take the hub-and-spoke network have to spend 13.2% of household income and take 60 min for similar trips. To increase the job-seeking range of these people, they should be offered concessions to encourage use of the hub-and-spoke network. The government should also build a light-rail transit line to pass through the Central Catchment Nature Reserve to connect employment sub-centers.Research highlights? Some low-income households in new towns face the accessibility problem of spatial mismatch during the process of suburbanization in Singapore. ? The Government has invested heavily in building a world class mass railway system to resolve this accessibility problem. ? The poor, who travel by bus, spend up to 9.8% of their household income per month and 70 min per trip from their neighborhoods to the city center. ? Those who take the hub-and-spoke network have to spend 13.2% of household income and take 60 min for similar trips. ? This study finds that to increase the job-seeking range of the low-income people in distant new towns, the government should offer concessions to encourage use of the hub-and-spoke network. ? The government should also build a light-rail transit line to pass through the Central Catchment Nature Reserve to connect employment sub-centers..

DOI

[27]
Li Z, Wu F, 2006. Socio-spatial differentiation in transitional Shanghai.Acta Geographica Sinica, 61(2): 199-211. (in Chinese)

[28]
Liu R, 2015. Spatial Mobility of Migrant Workers in Beijing, China. London: Springer.ABSTRACT The great migration of farmers leaving rural China to work and live in big cities as 'floaters' has been an on-going debate in China for the past three decades. This book probes into the spatial mobility of migrant workers in Beijing, and questions the city 'rights' issues beneath the city-making movement in contemporary China. In revealing and explaining the socio-spatial injustice, this volume re-theorizes the 'right to the city' in the Chinese context since Deng Xiaoping's reforms. The policy review, census analysis, and housing survey are conducted to examine the fate of migrant workers, who being the most marginalized group have to move persistently as the city expands and modernizes itself. The study also compares the migrant workers with local Pekinese dislocated by inner city renewals and city expansion activities. Rapid urban growth and land expropriation of peripheral farmlands have also created a by-product of urbanization, an informal property development by local farmers in response to rising low-cost rental housing demand. This is a highly comparable phenomenon with cities in other newly industrialized countries, such as S茫o Paulo. Readers will be provided with a good basis in understanding the interplay as well as conflicts between migrant workers' housing rights and China's globalizing and branding pursuits of its capital city.

DOI

[29]
Liu S, Zhao M, Qi W, 2014. The floating population and its spatial impacts. In: Dunford M, ‎Liu W (eds). The Geographical Transformation of China. Oxon, UK: Routledge.

[30]
Ma Q, Zhang W, 2006 Characteristics and factors analyses of suburbanization in Beijing.Geographical Research, 25(1): 121-130. (in Chinese)Suburbanization in Beijing region appeared in the early 1980s and has been accelerated since the 1990s because of rapid growth of both its socio-economy and its traffic.In an approach of combining microscopic analysis with macroscopic analysis,this paper examines spatial distribution,dynamisms and future trends of suburbanization in Beijing based on the questionnaires of random-selected residents in newly developed residential areas.The locational characteristics of the residential expansions are such as gradual extensions around the city core,arterial roads outwards,and the modern industrial parks.Most of the residential neighbourhoods are dormitory towns that have simple functions although they vary in types and sizes.Many factors collectively lead to residential areas expansions.For example,high land prices and the relatively scarcity of land,industrial development and distribution,development of the city road systems are primary forces of suburbanization in Beijing region.The eastern and southern suburbs that are around the No 5 loop and the No 6 loop within Beijing region are primary locational choices besides suburban towns such as Shunyi,Tongzhou,Yizhuang,and Liangxiang. Overdispered settlements resulted from suburbanization contribute to land waste and energy waste and environmental pollution,and unfavor public transportation construction and operation as well as other supporting facilities construction.So the following measures are proposed to manage and gradually control urban sprawl in Beijing region.First,relative policies and plans must be made and implemented to minimize over-decentralization of suburban residential neighbourhoods.Secondly,more mixed-use land must be practised in suburban settlements to add more functions there and sub-centers must be planned and built to serve suburban residents.Finally,the city's ecological environment must be protected and highlighted and the city greenbelts must be built to hold up the urban sprawl.

DOI

[31]
McDonald J F, 1989. Econometric studies of urban population density: A survey.Journal of Urban Economics, 26(3): 361-385.This paper presents the 1st reasonably comprehensive survey of empirical research of urban population densities since the publication of the book by Edmonston in 1975. The survey summarizes contributions to empirical knowledge that have been made since 1975 and points toward possible areas for additional research. The paper also provides a brief interpretative intellectual history of the topic. It begins with a personal overview of research in the field. The next section discusses econometric issues that arise in the estimation of population density functions in which density is a function only of a distance to the central business district of the urban area. Section 4 summarizes the studies of a single urban area that went beyond the estimation of simple distance-density functions and Section 5 discusses studies that sought to explain the variations across urban areas in population density patterns. McDonald refers to the standard theory of urban population density throughout the paper. This basic model is presented in the textbook by Mills and Hamilton and it is assumed that the reader is familiar with the model.

DOI PMID

[32]
Meyer J R, Gómez-Ibáñez J A, 1981. Autos, Transit, and Cities. Harvard University Press: MA, USA.

[33]
Mills E S, 1967. An aggregative model of resource allocation in a metropolitan area.The American Economic Review, 57(2): 197-210.Results, obtained by means of the ESCA-technique (Electron Spectroscopy for Chemical Analysis), are reported on the correlation between the binding energy of the inner electrons of sulphur and the chemical state and environment, with particular emphasis on the sulphur-oxygen bond. A charge-binding energy correlation is established which can be used for the estimation of charge on sulphur in compounds with uncertain structure or composition.

DOI

[34]
Muller P O, 1981. Contemporary Suburban America. Prentice Hall: New Jersey, USA.

[35]
Muth R F, 1969. Cities and Housing. Chicago, USA: University of Chicago Press.

[36]
Preston V, McLafferty S, Hamilton E, 2013. The impact of family status on black, white, and hispanic women’s commuting.Urban Geography, 14(3): 228-250.The relationship between women's domestic labor and employment in the paid labor force is central to current debates about gender inequities in occupations and incomes. Recent studies of gender differences in commuting argue that women reduce the journey to work to accommodate the demands of family responsibilities. The empirical evidence, however, is mixed. Equal numbers of studies have reported significant andinsignificant relationships between average commuting times and various measures of domestic responsibilities. Few of these studies have examined the implications of parenthood and, particularly, single parenthood, for the commuting patterns of women from various racial and ethnic backgrounds. Women who are single parents may work closer to home than other women because of their substantial domestic responsibilities. On the other hand, as sole wage earners, single parents may travel long times to obtain better paid employment. Using information about a sample of women in the New York Consolidated Metropolitan Area, we compared the average commuting times of black, Hispanic, and white women from single and two-parent households. The presence and ages of children significantly reduced all women's commuting times, although the effects of parenthood were muted for minority women. Single mothers commuted longer than married mothers, but the size of the disparity depended upon a woman's racial/ethnic background and place of residence. All single mothers commuted shorter times in the suburbs than at the center, but the differences were greatest for minority women living in the suburbs.

DOI

[37]
Qin Y, Du W, 2000. The effect of urban rail transportation on the urban structure.Journal of Southwest Jiaotong University, 35: 284-285. (in Chinese)

[38]
Rogalsky J, 2013. Bartering for basics: Using ethnography and travel diaries to understand transportation constraints and social networks among working-poor women.Urban Geography, 31(31): 1018-1038.Working-poor women face many challenges in their quest for economic self-sufficiency. Although welfare reform promises jobs, women do not have equal access to necessary services, including transportation. With the 2010 reauthorization of TANF (Temporary Asssistance for Needy Women), there is a need to develop a methodology that uses qualitative individual-level data to evaluate whether public transportation will serve working-poor single mothers in this quest for self-sufficiency. Using ethnography, travel diaries, and a GIS for a sample of women in the process of leaving welfare in Knoxville, Tennessee, travel behavior is examined both qualitatively and quantitatively in order to understand why they rarely use public transportation. Further research into the ways these women move around in a sprawling, medium-sized city reinforces and seeks to understand the extensive social networks working-poor mothers rely on. These women create communities of spatial necessity, bartering for basic needs to overcome transportation constraints.

DOI

[39]
Starrs M, Perrins C, 1989. The markets for public transport: The poor and the transport disadvantaged.Transport Reviews, 9(1): 59-74.This paper examines the markets for public transport services in the context of the argument that public transport subsidies redistribute income to the less well-off and improve the mobility of the transport disadvantaged. It describes macro- and micro-methodological frameworks for examining the performance of a transit system and for determining the beneficiaries of subsidies. A review of international studies and an examination of Australasian data indicates that public transport subsidies offer only limited support to the objectives of income redistribution to the less well-off and improved mobility to the transport disadvantaged. It argues that better direction to target subsidies to particular user groups could be more successful in meeting social objectives than general subsidies. The implication is that the resultant transit systems would be much different to those currently operating.

DOI

[40]
Sun T, Wang L, Li G, 2012. Distribution of population and employment and evolution of spatial structures in the Beijing Metropolitan Area.Acta Geographica Sinica, 67(6): 829-840. (in Chinese)This study aims to examine the characteristics and changes of the spatial structure in the Beijing Metropolitan Area with the rapid urban growth and decentralization, through analyzing the spatial distributions of urban population and employment. To demonstrate the spatial evolution of population and employment distributions in the Beijing Metropolitan Area, we apply the nonparametric analysis in this study. Our study finds that the significant population and employment subcenters in the suburbs of the Beijing Metropolitan Area, characterized by the polycentric urban spatial structure. Since the 1980s, with the suburbanization of population, the number of population subcenters has increased in the Beijing Metropolitan Area, and the distribution of population subcenters has expanded from the inner suburbs to the outer suburbs. The overall trend toward the decentralization and polycentrification of population is evident, whereas the spatial extent of the decentralization of population is limited in the Beijing Metropolitan Area. Contrary to the decentralization of population, our study finds that the centralization of employment in the Beijing Metropolitan Area from 2004 to 2008 has led to the weakening influences of the outer suburban employment subcenters as well as the decline of the polycentricity of the spatial structure. This implies the spatial pattern of the Beijing Metropolitan Area may still be highly centralized, and the nature of the monocentric urban spatial structure may not be fundamentally changed. Meanwhile, the decentralization of population and the centralization of employment may lead to the overall jobs-housing imbalance. Therefore, to form the polycentric spatial structure, it is necessary to reinforce the agglomeration economies of suburban subcenters and improve the overall jobs-housing balance in the Beijing Metropolitan Area.

DOI

[41]
Sun Y, 1992. Forming mechanism and delimitation of metropolitan area in China: A case study of Beijing.Acta Geographica Sinica, 47(6): 552-560. (in Chinese)Metropolitan area emerged with the process of suburbanization in western contries, so the criteria of commuters can be used to define the arcis. But in China, there aren't the two back-ground conditions of suburbanization in the western contries-land-use and housing market system and popularization of cars, and most cities are still in the stage of agglomeration. Therefore, linkages between core city and its surroundings show rarely commuters. Having investigate the external passenger flow of Beijing core city and chosen 17 affecting variables, stepwise regression method to simulate linear and spatial interaction type between passenger flow index and these variables was used. The results of regression show that the percentage of nonagricultural population and the percentage of rural nonagricultural labor are the determinant of linkages. Of which the former is mainly produced by construction of satellite towns which depend on state investment, and the later counts on transfer of rural labor to realize rural urbanization. They constitute the two kinds of forces in the process of formation of metropolitan area in China. Based on studies of forming mechanism and delimitation of Beijing metropolitan area, the author proposed a general method to delimitate metropolitan area in China and made an experiment study on applying the method to the Yangtze Delta area, the Pearl Delta area, central and south area of Liaoning province and Beijing-Tianjin-Tangshan area, which show that a kind of more extensive region-megalopolis has appeared in China.

DOI

[42]
Sweet M N, Bullivant B, Kanaroglou P S, 2016. Are major Canadian city-regions monocentric, polycentric, or dispersed?Urban Geography: 1-27.2016). Are major canadian city-regions monocentric, polycentric, or dispersed?. Urban Geography. Ahead of Print. doi: 10.1080/02723638.2016.1200279

DOI

[43]
Veneri P, 2010. Urban polycentricity and the costs of commuting: Evidence from Italian metropolitan areas.Growth & Change, 41(3): 403-429.ABSTRACTPolycentricity at the metropolitan scale is perhaps the model of spatial organisation that needs to be investigated more thoroughly as regards its effects on travel. The aim of this paper is to test the role of polycentricity—as well as other spatial characteristics, such as compactness, functional diversification and size—in the costs of commuting, taking into account an external cost component (per-capita CO2 emissions) and a private cost component (time spent on travelling). The degree of urban polycentricity has been measured by adopting a dynamic approach based on commuting flows and on social network analysis tools. The analysis is carried out using a database of 82 Italian metropolitan areas (MAs). Results show that MAs with a higher degree of polycentricity are more virtuous both in terms of private and external costs of mobility, while the degree of compactness is associated with lower environmental costs but with higher private costs. Size is associated with both higher external and private costs, while the role of functional diversification turns out to be statistically insignificant. Socio-demographics also play a role.

DOI

[44]
Wang Y, Wang Y, Wu J, 2010. Housing migrant workers in rapidly urbanizing regions: A study of the Chinese model in Shenzhen.Housing Studies, 25(1): 83-100. (in Chinese)China has experienced a huge wave of rural to urban migration over the last 25 years; however, Chinese cities do not have the large-scale slum settlements found in other developing countries. Has China found a new way to solve the housing problems of migrants and the urban poor? This paper addresses this question and reports the findings of a recent research project carried out in Shenzhen City. In general, Chinese migrants are poor in comparison with official urban residents. The majority of them live in shared rooms or small apartments in the so-called urban villages. Housing poverty, especially overcrowding, is a serious problem. This paper also highlights the positive contributions made by urban villages and private landlords in housing the large number of migrants in cities.

DOI

[45]
Wu J, Li R, Ding Ret al., 2017. City expansion model based on population diffusion and road growth.Applied Mathematical Modelling, 43: 1-14.In this paper, a city expansion model is proposed to capture the coevolution relationship between population diffusion and road growth. In the model, we adopt the physical diffusion process, which considers the influence of the road network topology and random exploration factor, to analyse the population diffusion based on the cellular automata (CA) model. In addition, the growth mechanism of the road network is developed to minimize the construction cost related to the population density and the Euclidean distance. The distribution complexities of the population density and the road network topology in the evolution process are then analysed. Compared with the real Beijing city in 2012, the suggested model can be used to describe the city evolution process.

DOI

[46]
Wu Q, Wu X, Chen Get al., 2013. Social-spatial differentiation and residential segregation of old city of Nanjing, China: Evidence from the community-level census data in 2000.Scientia Geographica Sinica, 33(10): 1196-1205. (in Chinese)The fifth census is now over a decade old and much has changed in the socio-spatial characteristics of Chinese cities in that time. Moreover, many overseas scholars and Chinese researchers have published a substantial number of papers and books using the 2000 census data. However, most of scholars used the data in an aspatial way in sociologically oriented studies or use the data at the larger scale of town or jiedao level.Our study is based on data at the lowest geographic scale possible, the community level or juweihui. We use these data in combination with a carefully developed community level map. These data allow us to exam the socio-spatial structure of old city region of Nanjing. This area included 244 communities with a population of1 358 714. The findings suggest a complex pattern formed by some of the well-known policies of the socialist era and the beginnings of free market processes, particularly in the creation of new elite areas within the old city. Particularly, Nanjing case shows that the complex pattern of urban social space in less developed cities would be consequence of stronger institutional path-dependence, adaptability and emulating capacity. Furthermore, the findings of jiaoyufication and new urban elite rely on small scale data.

[47]
Wu W, 2008. Migrant settlement and spatial distribution in metropolitan Shanghai.The Professional Geographer, 60(1): 101-120.Given the persistence of China's migration trends since the early 1980s, migrants have begun to assert their influence on cities' spatial structure. This article attempts to understand the geography of migrant residence and how it relates to the overall spatial development in metropolitan Shanghai. It explores the key geographical factors underlying migrant spatial distribution. Results are based on spatial analyses and a regression model at the subdistrict level, with data drawn primarily from the 2000 Population Census, 1996 Basic Establishment Census, and a migrant housing survey completed in 1999. The article also shows how intra-urban migrant settlement and mobility patterns in China might be distinctive from those in other developing countries, given China's unique context and institutional factors. In general, migrant distribution in metropolitan Shanghai displayed a strong degree of centrality until the late 1990s when the inner suburb became the main receptor for new arrivals. The geography of migrant residence has shifted in tandem with deconcentration of the local population and, to a lesser degree, industrial relocation. Areas with a large number of manufacturing enterprises but a smaller state sector are likely to see a high share of migrants in total population. New arrivals also are attracted to areas already concentrated with migrants. Housing availability, however, proves to be an insignificant predictor.

DOI

[48]
Zeng Z, Lin F, 2005. The effect of urban rail transition on population migration.Urban Mass Transit, 8(2): 19-22. (in Chinese)Ten years after the opening of urban rail transit service in Shanghai,the influence of rail transit over the distribution of population is getting more and more obvious.Using the population data of Shanghai in the past ten years,this article argues that the central region of the city along the rail line is the main emigrant region,the suburban along the rail line is the main immigrant region.The result is,rail transit can lead the population migration from the high density regions to lower density regions.

Outlines

/