Orginal Article

Contributions of climate change and human activities to ET and GPP trends over North China Plain from 2000 to 2014

  • CHEN Xuejuan , 1, 2, * ,
  • MO Xingguo , 1, 3 ,
  • HU Shi 1 ,
  • LIU Suxia 1, 3
Expand
  • 1. Key Laboratory of Water Cycle and Related Land Surface Processes, Institute of Geographic Sciences and Natural Resources Research, CAS, Beijing 100101, China
  • 2. University of Chinese Academy of Sciences, Beijing 100049, China
  • 3. College of Resources and Environment/Sino-Danish Center, University of Chinese Academy of Sciences, Beijing 100049, China

Author: Chen Xuejuan (1991-), PhD Candidate, specialized in remote sensing and eco-hydrology. E-mail:

*Corresponding author: Mo Xingguo, Professor, specialized in climate and eco-hydrology. E-mail:

Received date: 2016-08-17

  Accepted date: 2016-12-06

  Online published: 2017-06-10

Supported by

National Natural Science Foundation of China, No.41471026

National Key Research and Development Program of China, No.2016YFC0401402

Copyright

Journal of Geographical Sciences, All Rights Reserved

Abstract

Quantifying the contributions of climate change and human activities to ecosystem evapotranspiration (ET) and gross primary productivity (GPP) changes is important for adaptation assessment and sustainable development. Spatiotemporal patterns of ET and GPP were estimated from 2000 to 2014 over North China Plain (NCP) with a physical and remote sensing-based model. The contributions of climate change and human activities to ET and GPP trends were separated and quantified by the first difference de-trending method and multivariate regression. Results showed that annual ET and GPP increased weakly, with climate change and human activities contributing 0.188 mm yr-2 and 0.466 mm yr-2 to ET trend of 0.654 mm yr-2, and -1.321 g C m-2 yr-2 and 7.542 g C m-2 yr-2 to GPP trend of 6.221 g C m-2 yr-2, respectively. In cropland, the increasing trends mainly occurred in wheat growing stage; the contributions of climate change to wheat and maize were both negative. Precipitation and sunshine duration were the major climatic factors regulating ET and GPP trends. It is concluded that human activities are the main drivers to the long term tendencies of water consumption and gross primary productivity in the NCP.

Cite this article

CHEN Xuejuan , MO Xingguo , HU Shi , LIU Suxia . Contributions of climate change and human activities to ET and GPP trends over North China Plain from 2000 to 2014[J]. Journal of Geographical Sciences, 2017 , 27(6) : 661 -680 . DOI: 10.1007/s11442-017-1399-z

1 Introduction

Evapotranspiration (ET) is the key component that couples energy balance and water budget, and represents water consumption. Gross primary production (GPP) is the total carbon sequestration, and is so intertwined with human well-being since it is the source for food and timber production. ET and GPP are sensitive to climate and human interference (Bai et al., 2014; Sun et al., 2016; Zhang et al., 2013). The interactions between climate change and human activities are quite complicated and difficult to segregate, especially in ago-ecosystem (Lobell et al., 2011; Wang et al., 2016), which may affect the implementation of management practices. Separating and quantifying the contributions of climate change and human activities to ET and GPP trends is essential for understanding the impacts of climatic factors on water consumption, carbon sequestration and adaptation strategies.
Trends for ET differ between regions and ecosystems, and the driving factors are generally categorized as climate change and human activities (Li, 2014; Liu Q A et al., 2010; Qiu et al., 2008; Zhang et al., 2011). Studies showed that climate dominates the variability of global ET during 1982-2008, and elevated atmospheric CO2 concentration dominates ET trends over the Asian, South American and North American regions (Shi X Y et al., 2013). In the area with intensive human activities, the contribution of climate change to ET trend is relative small (Bai et al., 2014). For example, the expansion of cropland area and the management practices explain 60.5% and 16.8% of the increased ET, while climate change accounts for 4.7% in cropland of northwest China over the past 50 years (Bai et al., 2014).
Vegetation productivity shows increasing trend in most parts of the world, driven by climate change and human activities (Bai et al., 2016; Dai et al., 2016; Xiao et al., 2015). In China, air warming explains 36.8% of the increasing trend in annual vegetation productivity during 1982-2006, while afforestation and crop yield contribute 25.5% and 15.8%, respectively (Xiao et al., 2015). In the Qinghai-Tibet Plateau, climate change is the main driver of the alpine grassland NPP (net primary production) increasing in the first 20-year and human activities dominate in the last 10 years during 1982-2011 (Chen et al., 2014). For cropland, climate change generally exerts negative effects on crop yield associated with air warming and sunshine duration decline, but these effects are usually compensated for by human activities, such as genetic techniques and crop management (Bai et al., 2016; Guo et al., 2014; Liu Y A et al., 2010; Lobell et al., 2007).
Generally, methods for quantifying the contributions of climatic and human-induced factors are categorized as field experiments (Sun et al., 2016; Zhang et al., 2013), process-based model simulations (Bai et al., 2016; Shi X Y et al., 2013) and statistical methods (Shi W J et al., 2013; Tao et al., 2008; Wang et al., 2016). The experimental studies need series of field measurement in a relative long time (Xiao et al., 2014; Zhang et al., 2013), which are labor-demanding and time-consuming. Process-based models (e.g., crop growth models) have been used to disentangle the contributions of different factors by comparing the results of different simulations, in which input dataset of one factor varied while holding other factors constant (Bai et al., 2016; Shi X Y et al., 2013). Process-based models can reveal mechanisms, but it is debatable that vary one factor while holding other factors constant since factors may have interrelationships with each other. Statistical models, such as multivariate regression, are easy to conduct by using historical data to calibrate relatively simple regression equations (Liu Y A et al., 2010; Shi W J et al., 2013; Wang et al., 2016). Statistical models can be used at site or county level (Tao et al., 2008; Wang et al., 2016), and also can be implemented at each pixel for a whole region. First difference de-trending method has been used to dissolve the issues of non-climatic trend removal when using the statistical method to evaluate the climatic contributions (Nicholls, 1997; Lobell et al., 2007; Tao et al., 2008; Veron et al., 2015). And the contributions of human activities can be estimated by the non-climatic trends, such as the long-term changes in crop management (Lobell et al., 2003).
As one of the main grain production regions of China, there is great challenge for the North China Plain (NCP) to increase or maintain wheat and maize yields because of the water shortage and climate change. Researches regarding to investigating the climatic and human-induced impacts on ET or GPP of the NCP are mainly based on field experiments under specific conditions (Sun et al., 2016; Zhang et al., 2013). To better understand how ET and GPP respond to climate change and human activities at different areas of the NCP, it is imperative to separate the contributions of climatic factors and human activities for each pixel over the whole region.
In this study, a physical and remote sensing-based model (Mo et al., 2015; Mo et al., 2011) is used to estimate ET and GPP of the NCP from 2000 to 2014. By using statistical analysis methods, we aim to (1) find the dominant climatic factors associated with ET and GPP; (2) separate and quantify the contributions of climate change and human activities to ET and GPP trends.

2 Materials and methods

2.1 Study area

The North China Plain (NCP) involves Beijing, Tianjin and other five provinces, extending from latitude 32°09°N to 40°23°N and longitude 112°51°E to 122°41°E (Figure 1) with an area of 4 × 10⁵ km2. 85% of the NCP is cropland (Figure 1a), with a prevailing winter wheat-summer maize rotation system. It produces about 60% of wheat production and 45% of maize production for China (Zhang et al., 2013).
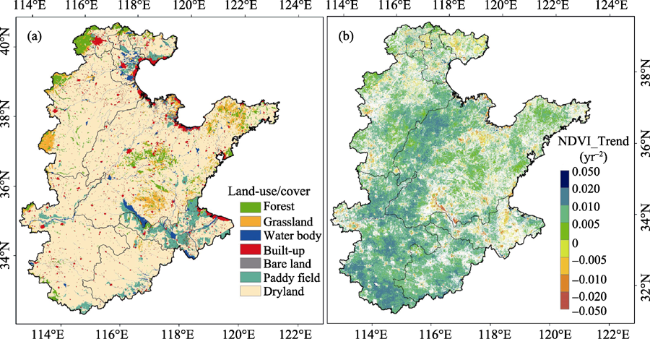
Figure 1 Land-use/cover types (a) and annual NDVI trend (P<0.05) (b) in North China Plain during 2000-2014
The NCP is located in the East Asian Temperate Monsoon climate zone. The mean annual temperature is about 8-15℃ and shows an increasing trend from 2000 to 2014. The annual precipitation is about 500-1000 mm and decreases gradually from the southeast to the northwest. The precipitation, sunshine duration, relative humidity, wind speed and the reference evapotranspiration present decreasing trends (Ma et al., 2012; Wang et al., 2014), while NDVI increases significantly in most parts from 2000 to 2014 (Figure 1 b).

2.2 Model description

The remote sensing ET model used in this paper was developed by Mo et al. (2011, 2015). The total ET is the sum of three separated water vapor fluxes: evaporation of canopy interception, transpiration and soil evaporation. Evaporation of canopy interception equals to the potential evaporation on the wetted surface. Transpiration is estimated based on the potential transpiration and limited by water condition and temperature. Soil evaporation depends on the potential evaporation and soil exfiltration which elapsed since the day following rainfall or irrigation (Choudhury et al., 1998). Irrigation is set as three times in the growing season for dryland. This model uses the fraction of vegetation cover to partition the net radiation flux used for soil evaporation and transpiration. GPP is estimated by the photosynthetic active radiation intercepted by canopy and the light use efficiency which is limited by water condition and air temperature. ET and GPP of the NCP from 2000 to 2014 were simulated at daily scale for each pixel with a spatial resolution of 250 m.

2.3 Data

Land-use/cover data (Figure 1a) was provided by Data Center for Resources and Environmental Sciences, Chinese Academy of Sciences (RESDC) (http://www.resdc.cn), and converted to raster data with 250 m spatial resolution.
Daily meteorological data at 83 stations inside and around the NCP was downloaded from China Meteorological Administration website (http://data.cma.cn/). They were interpolated with the spatial resolution of 250 m by gradient inverse distance square method (Lin et al., 2002; Mo et al., 2015) which considers the effects of topographical factors.
The 16-day composite 250-m NDVI data (MOD13Q1) from 2000 to 2014 was downloaded from MODIS products website (https://lpdaac.usgs.gov/). The missing data at the beginning of 2000 was filled up by that of 2001 since vegetation fraction in winter is small and the inter-annual difference between two adjacent years can be negligible. Data with poor quality was corrected by S-G filter (Savitzky et al., 1964). In order to match the temporal scale of the model, the 16-day NDVI was interpolated to daily data by Lagrange polynomial method.
MODIS monthly ET (MOD16A2) and GPP (MOD17A2) products (https://lpdaac.usgs. gov/) were used to validate the simulated ET and GPP. Considering the difference of the spatial resolutions between MODIS products (1 km) and our results (250 m), simulated ET and GPP were resampled to 1 km by the bilinear interpolation method.
Eddy covariance flux measurements at Yucheng (116°38′1′′E, 36°57′1′′N) (2003-2005), Daxing (116°25′37′′E, 39°37′16′′N) (2008-2010) and Guantao (115°07′38′′E, 36°30′54′′N) (2008-2010) Agro-ecosystem Stations were used for ET validation. The observed ET of Yucheng Agro-ecosystem Station was provided by the Chinese Ecosystem Research Network (CERN, http://www.cerndata.ac.cn/), and that of the other two stations were provided by “Cold and Arid Regions Science Data Center at Lanzhou” (Jia et al., 2012; Liu S M et al., 2013) (http://westdc.westgis.ac.cn). For data quality control, the half-hourly data was linearly interpolated if data gaps in one day were less than 4.5 hours in daytime (Zhu et al., 2015), otherwise the data of that day were rejected.
Considering 85% of the NCP is cropland and crop yield data is available in most counties, the winter wheat and summer maize yields at county level were used as one of the data sources to validate crop GPP. The crop yield data was excerpted from provincial rural statistical yearbooks and then converted to GPP by the equation as follows:
$GPP=\frac{Yield}{F\times R\times HI\times P}$ (1)
where Yield is the census data at county level; F is the proportion of biomass above the ground to total biomass, taken as 0.9; R is the conversion coefficient of biomass to carbon; HI is the harvest index, HI of winter wheat is specific for each administrative district referring to Ji et al. (2010), and HI of summer maize is set as 0.49 over the whole area (Xie et al., 2011); P is the ratio of NPP to GPP (Zhang et al., 2009).

2.4 Analysis methods

The analysis methods include simple linear regression, the first difference de-trending method, partial correlation analysis and multivariate linear regression. These analysis methods are all performed in each grid over the whole region.
The trends of ET, GPP and climatic factors are determined by the slope of the simple linear regression model. To segregate the impacts of climatic factors and human activities, we use the first-difference de-trending method (i.e., the difference of values in one year to the previous year) to get rid of the non-climatic influences (e.g., crop management) on ET and GPP (Nicholls, 1997; Lobell et al., 2007; Tao et al., 2008; Veron et al., 2015).
Since the climatic factors have correlations with each other, the relationships between the de-trending climatic factors and the de-trending ET (or GPP) are quantified by the partial correlation analysis (rather than simple correlation analysis). The partial correlation analysis explores relationship of two variables independent of the influences of other factors (Nicholls, 1997; Xiao et al., 2015; Dass et al., 2016). The factor that has the highest partial correlation coefficient is identified as the dominant climatic factor.
In order to quantify the contributions of climatic factors, multivariate linear regression (Zhang et al., 2010) is conducted with the first differences of climatic factors as the predictor variables and the first difference in ET (or GPP) as the response variable,
${{Y}_{ds}}={{a}_{1}}{{X}_{1ds}}+{{a}_{2}}{{X}_{2ds}}+{{a}_{3}}{{X}_{3ds}}+\cdots \cdots $ (2)
where, Yds is the normalized de-trended ET or GPP; ai is the regression coefficient of each predictor; Xids is the normalized de-trended climatic factor.
With the assumption that the responses of dependent variable to the climate trends and the year-to-year climate variations are similar (Nicholls, 1997; Lobell et al., 2007), the climatic contributions to ET (GPP) trends during 2000-2014 can be quantified by the above regression coefficients and the trends of climatic factors (Nicholls, 1997),
${{Q}_{c}}=\sum\limits_{i=1}^{n}{{{a}_{i}}{{X}_{is\_trend}}}$ (3)
${{Q}_{ac}}=\frac{{{Q}_{c}}}{{{Y}_{s\_trend}}}*{{Y}_{trend}}$ (4)
where Xis_trend is the trend of normalized climatic factor; Qc is the climatic contribution to the trend of normalized ET or GPP; Ys_trend is the trend of normalized ET or GPP; Ytrend is the trend of ET or GPP; Qac is the actual climatic contribution to the trend of ET or GPP.
The surplus of the whole ET (GPP) trend and the trend caused by climatic factors is identified as the trend caused by human activities, and thus the contributions of human activities can be quantified (Lobell et al., 2003),
${{Q}_{h}}={{Y}_{s\_trend}}-{{Q}_{c}}$ (5)
${{Q}_{ah}}=\frac{{{Q}_{h}}}{{{Y}_{s\_trend}}}*{{Y}_{trend}}$ (6)
where Qh is the contribution of human activities to the trend of normalized ET or GPP; Qah is the actual contribution of human activities to the trend of ET or GPP.
In addition, the relative contributions of climate change and human activities are calculated by the equations as follows,
$R{{C}_{c}}=\frac{|{{Q}_{c}}|}{|{{Q}_{c}}|+|{{Q}_{h}}|}$ (7)
$R{{C}_{h}}=\frac{|{{Q}_{h}}\text{ }\!\!|\!\!\text{ }}{\text{ }\!\!|\!\!\text{ }{{Q}_{c}}|+|{{Q}_{h}}|}$ (8)
where RCc and RCh are the relative contributions of climate change and human activities, respectively.

2.5 Selection of climatic predictors

The sunshine duration (or radiation), mean daily temperature, precipitation, vapor pressure deficit (or humidity) and wind speed are the key climatic factors that influencing ET (Ukkola et al., 2013; Cao et al., 2014). In addition to these factors (except for wind speed), diurnal temperature range has also been reported as the driving climatic force of GPP (Roderick et al., 2001; Zhang et al., 2013; Dass et al., 2016). However, due to the strong auto-correlations between some of these factors, it is fallacious to conduct multivariate regression model with all these factors being the predictors. As the simple correlation coefficients of every two de-trended climatic factors for each grid shown in Figure 2, the sunshine duration (SD), diurnal temperature range (DTR) and vapor pressure deficit (VPD) are significantly correlated with each other in more than 95% of the areas of the NCP. We will not consider DTR and VPD as the predictors in our study. The subsequent analysis will focus on the relationships between ET (or GPP) and the screened factors (SD, Ta, PPT and WS). Considering that wind is the aerodynamic demand for evaporation but has no direct effect on GPP, we will take wind speed as one of the main climatic predictors only for ET regression.
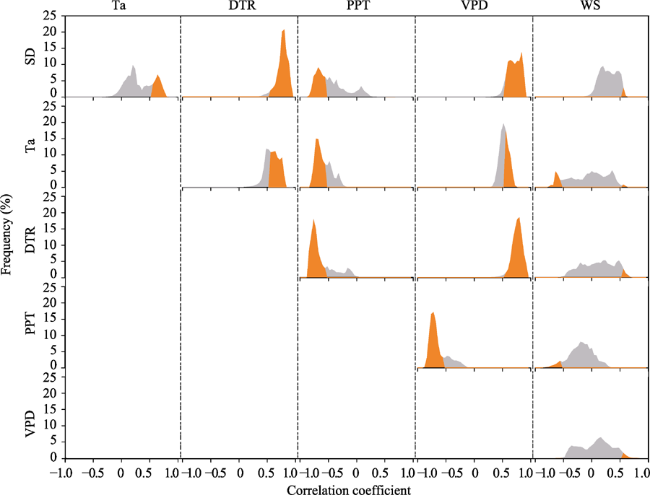
Figure 2 The probability density functions (PDF) of the spatial distributions of simple correlation coefficients between every two de-trended climatic factors. PDF in gray color represents all the grids, and PDF in orange color represents the grids which are under 95% level significant. (SD: sunshine duration; Ta: mean temperature; DTR: diurnal temperature range; PPT: precipitation; VPD: vapor pressure deficit; WS: wind speed.)

3 Results and analysis

3.1 Model validation

Figures 3a, 3b and 3c show the comparisons between daily ET estimations and observations at three eddy covariance flux sites across the NCP. In order to reduce the uncertainty that comes from the effects of flux footprint and geographical accuracy of remote sensing data, the estimated ET were averaged over the 3×3 pixel subsets (250×250 m2) around the flux sites (Wang et al., 2010). In general, the model performed fairly well in estimating ET, with the coefficients of determination (R2) being 0.65 (P<0.05), 0.73 (P<0.05) and 0.67 (P<0.05), and the root mean square errors (RMSE) being 0.71, 0.58 and 0.78 mm day-1 for Yucheng, Daxing and Guantao sites, respectively. This model has also given a reliable results on ET estimations in paddy field (Taoyuan) and grassland (Xilinhot sites) (Mo et al., 2015), and the estimated ET of China were consistent with those estimated by water balance method (Mo et al., 2015). Figures 3d, 3e and 3f show the comparisons between simulated crop GPP and retrieved GPP by statistic grain yields at county level with R2 of 0.61 (P<0.05), 0.56 (P<0.05) and 0.63 (P<0.05), and RMSE of 181, 214 and 188 g C m-2 yr-1 for Hebei, Tianjin and Shandong provinces, respectively. The scatters are all around 1:1 line. These indicate that the simulated GPP is in good agreement with the yield converted GPP.
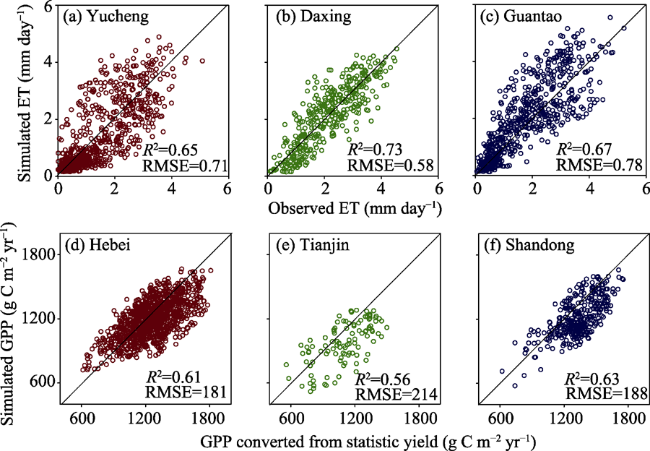
Figure 3 Comparisons between simulated daily ET and measured ET by eddy covariance in three flux towers, Yucheng: 2003-2005 (a), Daxing: 2008-2010 (b), and Guantao: 2008-2010 (c); and comparisons between simulated crop GPP and retrieved GPP by available statistic grain yields at county level during 2000-2014 in three provinces of Hebei (d), Tianjin (e), and Shandong (f)
ET and GPP were compared with MODIS products in forest, grassland and cropland at monthly scale (Figure 4). All correlation coefficients are larger than 0.9, which means that the seasonal patterns of our simulations are consistent with the MODIS products. However, the normalized standard deviations and the RMSE for cropland are relative higher than that of forest and grassland. This is because in cropland, MODIS-ET algorithm did not consider irrigation (Mu et al., 2011), and MODIS-GPP is usually overestimated in non-growth season but underestimated in growth season (Gao et al., 2014; Liu et al., 2015; Liu et al., 2014). Study stated that annual MODIS-GPP over irrigated cropland in the NCP only accounts for about 1/5-1/3 of the ground truth GPP, which is attributed to the underestimations of maximum light use efficiency (LUE) and leaf area index (LAI, MOD15) (Zhang et al., 2008). In our model, we considered irrigation for cropland and parameterized the minimum stomatal resistance for each plant functional type to calculate ET, and optimized the maximum LUE for estimating GPP according to recent study (Zhang et al., 2016). By this way, the accuracy of ET and GPP estimation has been improved.
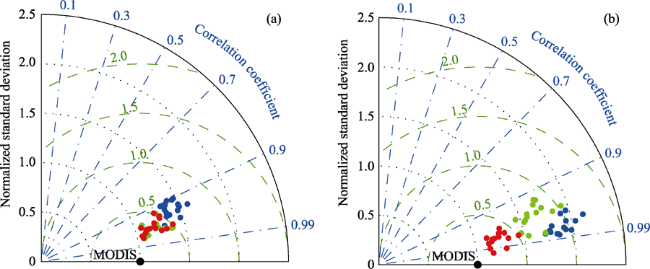
Figure 4 Taylor diagram of the comparisons between monthly simulated ET and MODIS-ET (a); simulated GPP and MODIS-GPP (b) over cropland (blue), forest (green) and grassland (red) during 2000-2014

3.2 Spatiotemporal variations of ET and GPP

Mean annual ET and GPP averaged across the NCP from 2000 to 2014 are 600 mm yr-1 and 1196 g C m-2 yr-1, respectively, and ET and GPP of drought year (2000, 2001, 2002 and 2006) are lower than the multi-year mean value, as shown in Figure 5. Regional averaged ET and GPP increase with the trends of 0.654 mm yr-2 and 6.221 g C m-2 yr-2 (P<0.1) from 2000 to 2014. The PDFs (probability density functions) of ET are symmetrically distributed across the blue line with concentrated variation range, and the coefficients of variation (CV) for the spatial distributions of ET are about 0.2. However, GPP shows relative larger spatial difference with variation range from 0 to 2200 g C m-2 yr-1 and the modes of PDF being larger than the mean values. In addition, the CVs of GPP are larger than 0.3 and show a significantly (P<0.05) increasing trend (Figure 5).
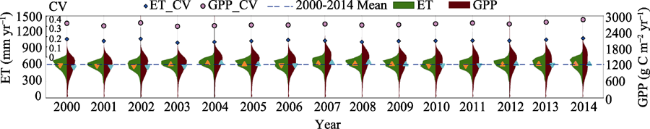
Figure 5 Probability density functions (PDF) and mean values (triangle symbol, upward or downward triangle means larger or smaller than the multi-year mean value) of the spatial distributions of ET and GPP from 2000 to 2014. ET is shown on the left side in green and GPP is shown on the right side in red. The blue horizontal line shows the multi-year mean value averaged over the whole region for ET and GPP. The series of blue rhombus and pink circles represent the variation coefficients of ET and GPP, respectively.
Generally, ET and GPP decrease with latitude and altitude (Figure 6a and 6b). They are high in the southern and central cropland, especially in Jiangsu and Anhui provinces where ET and GPP are higher than 700 mm yr-1 and 1400 g C m-2 yr-1. About 16% (P<0.05) and 29.2% (P<0.05) of the region show significant increasing trends while 9.5% (P<0.05) and 8.8% (P<0.05) show significant decreasing trends for ET and GPP, respectively (Table 1). Decreasing ET and GPP mainly occur in the western and northern parts of the plain and some areas of Shandong province (Figure 6c and 6d). Trends for ET averaged over the significantly decreasing (P<0.05), insignificantly decreasing (P>0.05), insignificantly increasing (P>0.05) and significantly increasing (P<0.05) regions are -6.86, -1.79, 2.03 and 5.71 mm yr-2, while that for GPP are -28.66, -7.29, 8.58, and 24.04 g C m-2 yr-2, respectively (Table 1).
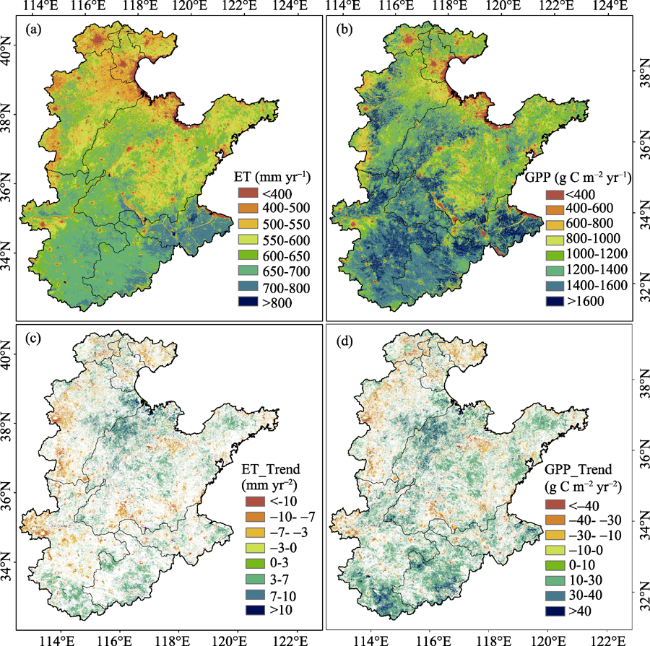
Figure 6 The spatial distributions of annual mean ET (a); annual mean GPP (b); trends of annual ET (P<0.05) (c) and trends of annual GPP (P<0.05) (d) over the North China Plain from 2000 to 2014
Table 1 The area proportions and mean values of ET and GPP trends
Area_ET trend (%) ET_trend (mm yr-2) Area_GPP trend (%) GPP_trend (g C m-2 yr-2)
Decrease (P<0.05) 9.5 -6.864 8.8 -28.655
Decrease (P>0.05) 29.5 -1.794 22.7 -7.289
Increase (P>0.05) 45.1 2.034 39.3 8.579
Increase (P<0.05) 16.0 5.712 29.2 24.041

3.3 Dominant climatic factors of ET and GPP

Based on the de-trending data series which removed the impacts of non-climatic factors, the dominant climatic factors of ET and GPP are identified by the highest partial correlation coefficients for each grid of the NCP (Figure 7). It is shown that annual ET variations have the largest partial correlation coefficients with precipitation variations in about 42.9% of the region which mainly distributes in the central and northern part (Figure 7a). The western piedmont plain and the northern part of Jiangsu province are widely dominated by temperature. Sunshine duration plays the major role in southwest NCP, mainly in central Henan and north Anhui province. Areas discretely dominated by wind speed only accounts for 6.2% of the NCP. In wheat growing stage, precipitation dominates ET in the largest area, followed by temperature, sunshine duration and wind speed (Figure 7b). In maize growing stage, ET is dominated by precipitation and sunshine duration in 60.7% areas of the NCP (Figure 7c). The role of precipitation indicates that water conditions are more critical than energy for evapotranspiration in the water-shortage NCP at annual scale, while in maize growing stage when precipitation is relative abundant, the role of sunshine duration is fairly important.
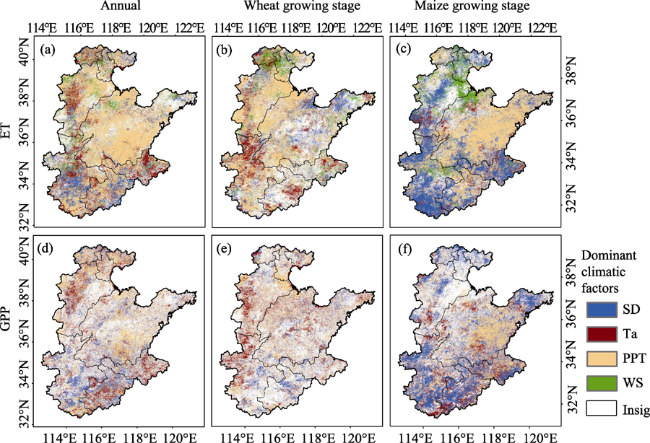
Figure 7 Spatial distributions of dominant climatic variables of annual ET (a), ET in wheat growing stage (b), ET in maize growing stage (c), annual GPP (d), GPP in wheat growing stage (e), and GPP in maize growing stage (f) (P<0.05) from 2000 to 2014 after removing the non-climatic influences. (The white color represents that the partial correlations between ET (or GPP) and climatic factors are insignificant. Wheat growing stage: during Oct, Nov, Dec, Jan, Feb, Mar, Apr and May; Maize growing stage: during Jun, Jul, Aug and Sep.)
In most area, the partial correlation coefficients between de-trended annual GPP, GPP in wheat growing stage and climatic factors (Figures 7d and 7e) are not significant. Annual GPP in 17.1%, 14.4% and 12.2% areas of the NCP is dominated by precipitation, temperature and sunshine duration, respectively. In wheat growing stage, it is conspicuous that temperature dominates GPP, especially in western piedmont region (Figure 7e). In maize growing stage (Figure 7f), the effect of sunshine duration is prominent. SD dominates 26.8% of the NCP discretely, except for the mountain area in south Shandong province in which precipitation plays a major role.
Therefore, precipitation and sunshine duration are the dominant climatic factors of ET and GPP.

3.4 Contributions of climate change and human activities to ET and GPP trends

3.4.1 Relative contributions of climate change and human activities
The relative contributions of climate change and human activities to ET and GPP trends for each grid in the whole region are shown in Figure 8. Generally, human activities contribute more than climate change to both ET and GPP. Averaged over the whole region, the relative contributions of climate change to ET and GPP are 39.5% and 26%, while those of human activities are 60.5% and 74%, respectively. Along the Yellow River and in the forests of northwest NCP, ET trends are obviously dominated by climate change, of which the contributions are greater than 50%. The relative contributions of human activities to GPP are more than 90% in a large part of cropland, which highlights the role of agricultural management practices.
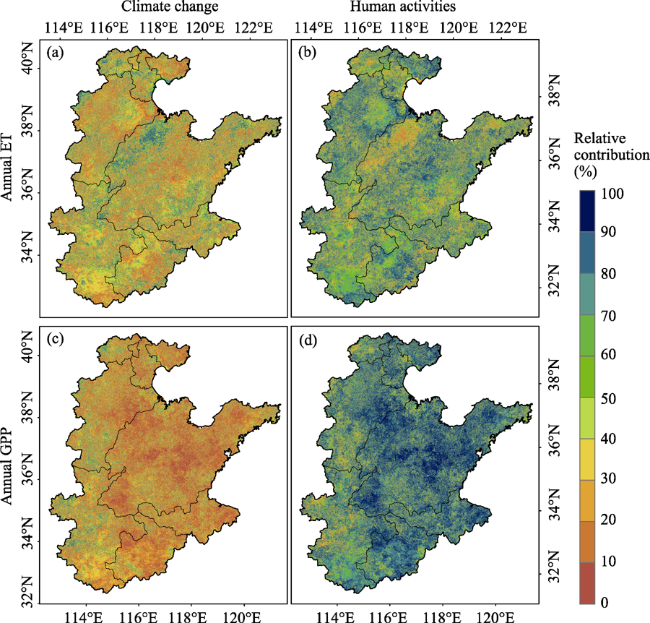
Figure 8 Relative contributions of climate change and human activities to annual ET and GPP trends. (The sum of the relative contributions equals to 100%.)
3.4.2 Actual contributions of climate change and human activities
The actual contributions of climate change and human activities to ET and GPP trends are summarized in Table 2. Climate change contributes 0.188 mm yr-2 (28.8%), and human activities contribute 0.466 mm yr-2 (71.2%) to ET trend of 0.654 mm yr-2. ET trend over the significantly (P<0.05) changing area (as shown in Figure 6c) is 1.045 mm yr-2, of which climate change contributes 0.416 mm yr-2 (39.8%), and human activities contribute 0.630 mm yr-2 (60.2%). In the area ET shows significantly increasing trend (P<0.05), climate change and human activities contribute 0.515 mm yr-2 (9%) and 5.197 mm yr-2 (91.0%), respectively. In the area ET decreases significantly (P<0.05) with the trend of -6.864 mm yr-2, the trends induced by climate change and human activities are 0.247 mm yr-2 and -7.111 mm yr-2, respectively.
Table 2 Mean actual contributions of climate change and human activities to annual ET trends (mm yr-2) and GPP trends (g C m-2 yr-2)
Zones ET trend Qac to ET trend Qah to ET trend GPP trend Qac to GPP trend Qah to GPP trend
A 0.654 0.188 0.466 6.221 -1.321 7.542
B 1.045 0.416 0.630 11.863 -1.876 13.739
C 5.712 0.515 5.197 24.041 -2.169 26.210
D -6.864 0.247 -7.111 -28.655 -0.903 -27.752

Note: A represents the whole area of the NCP; B represents the area where ET or GPP trends are significant; C and D represent the areas that ET (or GPP) shows significantly increasing trend and significantly decreasing trend, respectively. Qac and Qah are the actual contributions of climate change and human activities as defined in section 2.4.

For GPP trend, climate change contributes -1.321 g C m-2 yr-2 and human activities contribute 7.542 g C m-2 yr-2 in the whole region. GPP trend averaged over the significantly (P<0.05) changing region (as shown in Figure 6d) is 11.863 g C m-2 yr-2, of which the changes induced by climate change and human activities are -1.876 g C m-2 yr-2 and 13.739 g C m-2 yr-2, respectively. As for the significantly increasing areas (P<0.05), climate change contributes -2.169 g C m-2 yr-2 and human activities contribute 26.210 g C m-2 yr-2, which prompt the GPP trend of 24.041 g C m-2 yr-2. For the significantly decreasing areas (P<0.05) with the trend of -28.655 g C m-2 yr-2, the contribution of human activities accounts for -27.752 g C m-2 yr-2.
ET trends show difference among land use types (Figure 9a). Areas with decreasing ET trends are mainly occupied by forest and built-up land (Figure 9a). In these two land use types, human activities contribute negatively to ET trends, which offset the increasing trends arose by climate change. Except for these two types, the contributions of human activities to ET trends are all positive. In grassland, annual ET shows increasing trend, climate change and human activities both show positive contributions in which climate change plays a dominant role (Figure 9a). In water body and cropland, human activities have positive contributions to ET while climate change contributes negatively. ET of winter wheat increases 0.802 mm yr-2, in which climate change and human activities contribute -0.110 mm yr-2 and 0.912 mm yr-2, respectively (Figure 9a). However, for summer maize, ET shows decreasing trend of -0.028 mm yr-2 with climate change contributing negatively (-0.163 mm yr-2) and human activities contributing positively (0.135 mm yr-2) (Figure 9a).
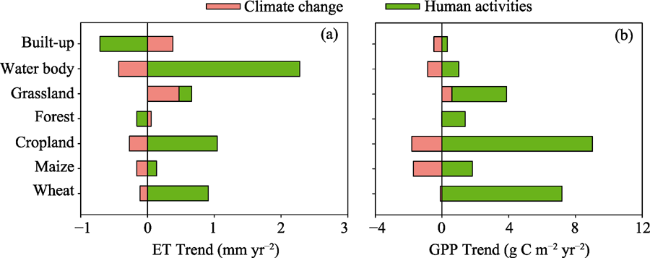
Figure 9 Actual contributions of climate change and human activities to ET and GPP trends in different land use types. (We further distinct the winter wheat and summer maize in cropland; GPP of water body is for the vegetation in wetland and benchland.)
For GPP trends, contributions of climate change are negative and that of human activities are positive except for grassland. In grassland, contributions of climate change and human activities both are positive (Figure 9b). Human activities contribute dominantly to GPP increases in grassland, forest and cropland. For cropland, trend of GPP in maize growing stage is 0.103 g C m-2 yr-2, in which climate change and human activities contribute -1.712 and 1.815 g C m-2 yr-2, respectively (Figure 9b). In wheat growing stage, the negative contribution of climate change is weak and human activities dominate the increase of GPP. GPP of wheat increases with trend of 7.097 g C m-2 yr-2, in which -0.099 g C m-2 yr-2 is attributed to climate change and 7.196 g C m-2 yr-2 is attributed to human activities (Figure 9b).
In general, human activities dominate ET and GPP trends. For the regional average ET, climate change and human activities both have positive impacts, while for the regional average GPP, climate change has negative effect but this effect is eventually offset by the dominant positive impact of human activities. For cropland, the contributions of climate change are negative while that of human activities are positive. The negative climatic contributions on wheat are relative small than that on maize.

4 Discussion

4.1 ET, GPP and their trends

The annual mean ET of the NCP is 600 mm yr-1, which is similar to the result of Lei et al. (2010) in which annual ET over an irrigated cropland in the NCP is 595 mm in the period of 2005-2006 and 609 mm in the period of 2006-2007, respectively. But compared with MODIS-ET whose annual mean value is 485 mm, our result is much higher. The simulated ET that is higher than MODIS-ET mainly distributes in the central and northern parts of the NCP (Figure 10c) where NDVI is larger than 0.25 (Figure 11a). In these areas, crop irrigation is prevailing (Mo et al., 2011). But MODIS-ET algorithm neglects the impact of irrigation. This may be the main reason for the difference between our simulated ET and MODIS-ET.
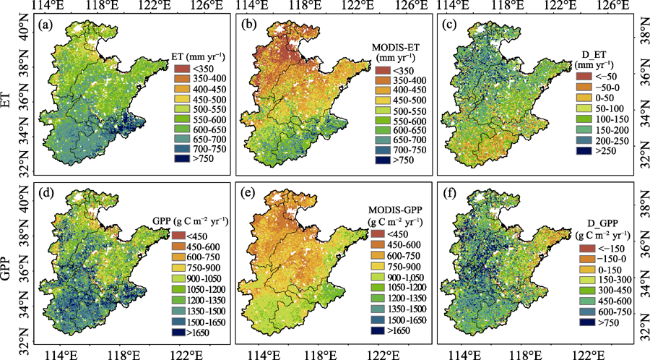
Figure 10 Spatial distributions of annual mean simulated ET (a), annual mean MODIS-ET (b), difference between annual mean simulated ET and annual mean MODIS-ET (c), annual mean simulated GPP (d), annual mean MODIS-GPP (e), difference between annual mean simulated GPP and annual mean MODIS-GPP (f)
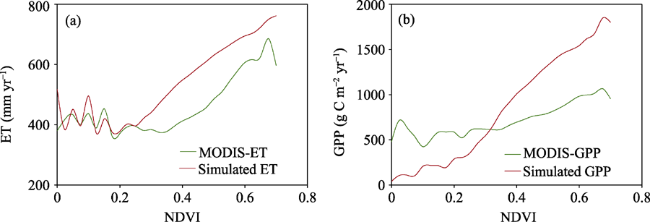
Figure 11 Variations of annual mean ET (a) and GPP (b) with the pattern of NDVI
It is reasonable that simulated annual mean GPP is 1196 g C m-2 yr-1 since GPP in pure cropland approaches about 1500 g C m-2 yr-1 (Wang et al., 2015; Zhang et al., 2008). By contrast, annual mean MODIS-GPP of the NCP is only 800 g C m-2 yr-1. Large difference was also observed between estimated GPP (Xiao et al., 2010) and MODIS-GPP in United States, particularly for croplands in the Midwest, in which estimated annual GPP and MODIS-GPP are ~1200-1500 and ~700 g C m-2 yr-1, respectively. MODIS-GPP that is lower than our simulation mainly distributes in the central and western NCP (Figure 10f) where the land use type is mainly cropland (Figure 1a) and NDVI is larger than 0.3 (Figure 11b). This is mainly because the maximum light use efficiency is underestimated (only 0.68 g C MJ-1) for cropland in MODIS algorithm (Xiao et al., 2010; Zhang et al., 2008). In addition, MODIS-GPP is overestimated when NDVI is lower than 0.3 (Figure 11b). These support the view that MODIS-GPP is underestimated at high productivity and overestimated at low productivity areas (Turner et al., 2006).
In our study, annual ET exhibits increasing trends. Study based on measured data also indicated that actual water use of the NCP increased in recent three decades (Zhang et al., 2011). In the irrigated croplands of America, ET also showed increasing trend (Jaksa et al., 2015). However, trend in annual MODIS-ET of the NCP is negative as shown in Figure 12a, which is mainly due to the ET decline in maize growing stage. The correlation coefficient of our predicted annual ET and the significantly increased NDVI (trend=0.004 (P<0.01)) is 0.51 (P<0.05), but only 0.06 for MODIS-ET and NDVI. Therefore, our estimated ET that shows increasing trend captured the vegetation dynamic preferably compared to MODIS-ET. Although there are discrepancies in GPP magnitudes between our simulations and MODIS product, trends of them are similar as shown in Figure 12b. MODIS-GPP and simulated GPP both have good relationships with NDVI with the correlation coefficients being 0.83 (P<0.01) and 0.75 (P<0.01), respectively.
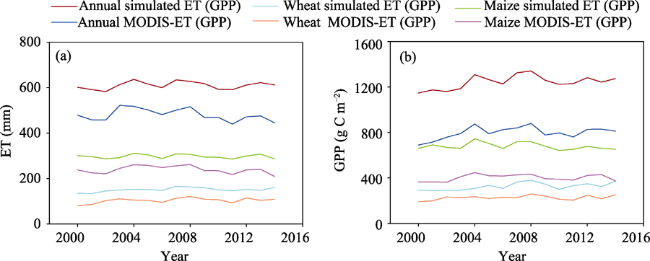
Figure 12 Changes of ET (a) and GPP (b) in the North China Plain from 2000 to 2014 (Mean ET and GPP are all averaged over the areas where MODIS products have valid values.)

4.2 Sensitivities of ET (GPP) to climatic variables

When using the first-difference de-trending method to remove the non-climatic influences and then assessing the contributions of climate change by the linear regression model, there is an assumption that the responses of ET (or GPP) to the trends of climatic factors and the year-to-year variations are similar (Nicholls, 1997; Lobell et al., 2007). That means ET (or GPP) and climatic variables are assumed to be linearly associated, which may introduce some biases.
The sensitivities of ET (or GPP) to climatic factors are analyzed to illustrate this issue. If ET (or GPP) and climatic variables are linearly associated, the sensitivities of ET (or GPP) to climatic factors should be the same before and after climate change. If they are not linearly associated, the sensitivities are different and the differences of the sensitivities indicate the biases arose from the non-linear relationships. By comparing the sensitivities of ET (or GPP) to climatic factors under the present climate condition and the changed climate condition, it was found that the sensitivity of ET to Ta increasing 1℃ when WS decreasing 20% has the largest difference which is shown as the orange circle in the fourth column of Figure 13a. For GPP (Figure 13b), the difference of the sensitivities to SD under different Ta conditions is the largest. Generally, the differences of the sensitivities of ET to SD (or Ta, PPT, WS) under different climatic conditions are all less than 1%, and that of GPP are all less than 1‰, which means that the biases arisen by the non-linear associations are small and negligible. Therefore, the relationships between ET (or GPP) and climatic factors can be assumed linear, and the sum of the effects of climate variables can represent their interactive roles in affecting ET or GPP.
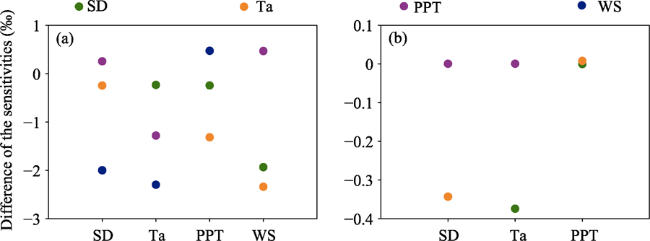
Figure 13 Differences of the sensitivities of ET (a) and GPP (b) to each climate factor under different climatic conditions. (Specifically, assume that the sensitivity of ET to Ta increasing 1℃ is A, and the sensitivity of ET to Ta increasing 1℃ when SD decreases 20% is B. The difference of A and B is shown as the orange circle in the first column of (a). The differences of the sensitivities of ET (or GPP) to other factors are estimated similarly. Changes of SD, PPT and WS are set as decreasing 20%, while change of Ta is set as increasing 1℃ according to the climatic conditions of the North China Plain.)

4.3 Impacts of climate change and human activities on crops

Generally, technology advances and crop management practices adapted by farmers can mitigate and offset the disadvantages of climate change for crop productivity. For example, Lobell et al. (2007) indicated that global yields of wheat and maize response negatively to increased temperatures, but these negative impacts are smaller than the impacts of technology. In China, Guo et al. (2014) demonstrated that technological progress contributes dominantly to maize yield increase during 1981-2010, although climate change has negative effects on maize. In this study, our results support this view that crop productivities increase over the NCP during 2000-2014, which are contributed mainly by human activities.
In the NCP, we find that climate change has negative impacts on both wheat and maize for ET and GPP, but the effects on wheat are relative small. Climate change influences terrestrial eco-hydrological process by altering the spatiotemporal distribution of precipitation, available energy, and air temperature. Positive response of crop yield to sunshine duration has been concluded by the experimental researches (Sun et al., 2016; Zhang et al., 2013). In maize growing stage, sunshine duration decreases significantly (Table 3), which reduces surface available energy, photosysthesis rate and biomass accumulation, and consequently causes water consumption and crop yield decrease (Bai et al., 2016; Liu et al., 2005). Furthermore, temperature in wheat growing stage shows weakly increasing trend (Table 3), which may accelerate evapotranspiration and help winter wheat avoid freezing disaster. In addition, precipitation in wheat growing stage and maize growing stage both show decreasing trend, but the decreasing magnitude of PPT in maize growing stage is larger than that in wheat growing stage (Table 3). These may be the major reasons for the different magnitudes of the negative effects of climate change on wheat and maize.
Table 3 Trends of climatic factors averaged over cropland from 2000 to 2014
Trend SD Ta PPT WS
Wheat growing stage 0.010 0.007 -0.126 -0.046**
Maize growing stage -0.049* -0.001 -0.593 -0.043**

Note: ** indicates P<0.05; * indicates P<0.1

5 Conclusions

Based on a remote sensing and physical model, the spatiotemporal patterns of ET and GPP were estimated from 2000 to 2014 over the NCP with a 250-m resolution. Dominant climatic factors of ET and GPP were identified by the partial correlation analysis, and the contributions of climate change and human activities to ET and GPP trends were separated and quantified by the first-difference de-trending method and multivariate regression.
Annual mean ET and GPP averaged over the NCP from 2000 to 2014 were increasing with trends of 0.654 mm yr-2 and 6.221 g C m-2 yr-2 (P<0.1), respectively. About 16% and 29.2% of the area in the NCP showed significantly increasing trends while 9.5% and 8.8% showed significantly decreasing trends for annual ET and GPP, respectively. The relative contributions of climate change and human activities to ET trends were 39.5% and 60.5%, and those to GPP trends were 26% and 74%, respectively. Climate change and human activities contributed 0.188 mm yr-2 and 0.466 mm yr-2 to ET trend of 0.654 mm yr-2, and -1.321 g C m-2 yr-2 and 7.542 g C m-2 yr-2 to GPP trend of 6.221 g C m-2 yr-2. Thus, human activities dominated ET and GPP trends. As for climatic factors, precipitation and sunshine duration were identified as the major variables regulating ET and GPP trends. For winter wheat-summer maize double cropping system, the increasing trends of ET and GPP mainly occurred in wheat growing stage; the negative effect of climate change on wheat was less than that on maize; at annual scale, the negative contributions of climate change were offset by the positive contributions of human activities.

The authors have declared that no competing interests exist.

[1]
Bai H Z, Tao F L, Xiao D Pet al., 2016. Attribution of yield change for rice-wheat rotation system in China to climate change, cultivars and agronomic management in the past three decades.Climatic Change, 135(3): 539-553.Abstract Using the detailed field experiment data from 1981 to 2009 at four representative agro-meteorological experiment stations in China, along with the Agricultural Production System Simulator (APSIM) rice-wheat model, we evaluated the impact of sowing/transplanting date on phenology and yield of rice-wheat rotation system (RWRS). We also disentangled the contributions of climate change, modern cultivars, sowing/transplanting density and fertilization management, as well as changes in each climate variables, to yield change in RWRS, in the past three decades. We found that change in sowing/transplanting date did not significantly affect rice and wheat yield in RWRS, although alleviated the negative impact of climate change to some extent. From 1981 to 2009, climate change jointly caused rice and wheat yield change by 6117.4 to 1.5 %, of which increase in temperature reduced yield by 0.0–5.8 % and decrease in solar radiation reduced it by 1.5–8.7 %. Cultivars renewal, modern sowing/transplanting density and fertilization management contributed to yield change by 14.4–27.2, 614.7– 610.1 and 2.3–22.2 %, respectively. Our findings highlight that modern cultivars and agronomic management compensated the negative impacts of climate change and played key roles in yield increase in the past three decades.

DOI

[2]
Bai J, Chen X, Li Let al., 2014. Quantifying the contributions of agricultural oasis expansion, management practices and climate change to net primary production and evapotranspiration in croplands in arid northwest China.Journal of Arid Environments, 100: 31-41.61An agricultural module was integrated into the Biome-BGC model.61The updated model performed well in simulating LAI and biometric variables.61The simulated total NPP and ET increased significantly in an Oasis region.61The increased total NPP and ET were mainly attributed from oasis expansion.

DOI

[3]
Cao G L, Han D M, Song X F, 2014. Evaluating actual evapotranspiration and impacts of groundwater storage change in the North China Plain.Hydrological Processes, 28(4): 1797-1808.As a critical water discharge term in basin-scale water balance, accurate estimation of evapotranspiration (ET) is therefore important for sustainable water resources management. The understanding of the relationship between ET and groundwater storage change can improve our knowledge on the hydrological cycle in such regions with intensive agricultural land usage. Since the 1960s, the North China Plain (NCP) has experienced groundwater depletion because of overexploitation of groundwater for agriculture and urban development. Using meteorological data from 23 stations, the complementary relationship areal evapotranspiration model is evaluated against estimates of ET derived from regional water balance in the NCP during the period 1993–2008. The discrepancies between calculated ET and that derived by basin water balance indicate seasonal and interannual variations in model parameters. The monthly actual ET variations during the period from 1960 to 2008 are investigated by the calibrated model and then are used to derive groundwater storage change. The estimated actual ET is positively correlated with precipitation, and the general higher ET than precipitation indicates the contributions of groundwater irrigation to the total water supply. The long term decreasing trend in the actual ET can be explained by declining in precipitation, sunshine duration and wind speed. Over the past ~5065years, the calculated average annual water storage change, represented by the difference between actual ET and precipitation, was approximately 3665mm, or 4.865km3; and the cumulative groundwater storage depletion was approximately 170065mm, or 22065km3 in the NCP. The significantly groundwater storage depletion conversely affects the seasonal and interannual variations of ET. Irrigation especially during spring cause a marked increase in seasonal ET, whereas the rapid increasing of agricultural coverage over the NCP reduces the annual ET and is the primary control factor of the strong linear relationship between actual and potential ET. Copyright 08 2013 John Wiley & Sons, Ltd.

DOI

[4]
Chen B X, Zhang X Z, Tao Jet al., 2014. The impact of climate change and anthropogenic activities on alpine grassland over the Qinghai-Tibet Plateau.Agricultural and Forest Meteorology, 189: 11-18.Climate change and anthropogenic activities are two factors that have important effects on the carbon cycle of terrestrial ecosystems, but it is almost impossible to fully separate them at present. This study used process-based terrestrial ecosystem model to stimulate the potential climate-driven alpine grassland net primary production (NPP), and Carnegie–Ames–Stanford Approach based on remote sensing to stimulate actual alpine grassland NPP influenced by both of climate change and anthropogenic activities over the Qinghai–Tibet plateau (QTP) from 1982 to 2011. After the models were systematically calibrated, the simulations were validated with continuous 3-year paired field sample data, which were separately collected in fenced and open grasslands. We then simulated the human-induced NPP, calculated as the difference between potential and actual NPP, to determine the effect of anthropogenic activities on the alpine grassland ecosystem. The simulation results showed that the climate change and anthropogenic activities mainly drove the actual grassland NPP increasing in the first 20-year and the last 10-year respectively, the area percentage of actual grassland NPP change caused by climate change declined from 79.62% in the period of 1982–2001 to 56.59% over the last 10 years; but the percentage change resulting from human activities doubled from 20.16% to 42.98% in the same periods over the QTP. The effect of human activities on the alpine grassland ecosystem obviously intensified in the latter period compared with the former 20 years, so the negative effect caused by climate change to ecosystem could have been relatively mitigated or offset over the QTP in the last ten years.

DOI

[5]
Choudhury B J, DiGirolamo N E, 1998. A biophysical process-based estimate of global land surface evaporation using satellite and ancillary data: I. Model description and comparison with observations.Journal of Hydrology, 205(3/4): 164-185.A biophysical process-band model is used to estimate transpiration, soil evaporation and interception over the global land surface for a 24-month period (January 1987 to December 1988). The model parameters are determined from published records, and their geographical distribution has been prescribed according to land use and land cover data. Satellite observations are used to obtain fractional vegetation cover, isothermal net and photosynthetically active radiation, air temperature and vapor pressure deficit. Precipitation and friction velocity are derived as blended products (disaggregated and assimilated data). The calculated seasonal and geographical variations of evaporation, net radiation and soil moisture are in good agreement with field observations, catchment water balance data, and atmospheric water budget analysis; explained variances being greater than 75%. Uncertainties in the estimated evaporation are about 15 and 20%, respectively, for annual and monthly values.

DOI

[6]
Dai E F, Huang Y, Wu Zet al., 2016. Analysis of spatio-temporal features of a carbon source/sink and its relationship to climatic factors in the Inner Mongolia grassland ecosystem.Journal of Geographical Sciences, 26(3): 297-312.Global climate change has become a major concern worldwide. The spatio-temporal characteristics of net ecosystem productivity (NEP), which represents carbon sequestration capacity and directly describes the qualitative and quantitative characteristics of carbon sources/sinks (C sources/sinks), are crucial for increasing C sinks and reducing C sources. In this study, field sampling data, remote sensing data, and ground meteorological observation data were used to estimate the net primary productivity (NPP) in the Inner Mongolia grassland ecosystem (IMGE) from 2001 to 2012 using a light use efficiency model. The spatio-temporal distribution of the NEP in the IMGE was then determined by estimating the NPP and soil respiration from 2001 to 2012. This research also investigated the response of the NPP and NEP to the main climatic variables at the spatial and temporal scales from 2001 to 2012. The results showed that most of the grassland area in Inner Mongolia has functioned as a C sink since 2001 and that the annual carbon sequestration rate amounts to 0.046 Pg C/a. The total net C sink of the IMGE over the 12-year research period reached 0.557 Pg C. The carbon sink area accounted for 60.28% of the total grassland area and the sequestered 0.692 Pg C, whereas the C source area accounted for 39.72% of the total grassland area and released 0.135 Pg C. The NPP and NEP of the IMGE were more significantly correlated with precipitation than with temperature, showing great potential for C sequestration.

DOI

[7]
Dass P, Rawlins M A, Kimball J Set al., 2016. Environmental controls on the increasing GPP of terrestrial vegetation across northern Eurasia.Biogeosciences, 13(1): 45-62.Terrestrial ecosystems of northern Eurasia are demonstrating an increasing gross primary productivity (GPP), yet few studies have provided definitive attribution for the changes. While prior studies point to increasing temperatures as the principle environmental control, influences from moisture and other factors are less clear. We assess how changes in temperature, precipitation, cloudiness, and forest fires individually contribute to changes in GPP derived from satellite data across northern Eurasia using a light-use- efficiency-based model, for the period 1982–2010. We find that annual satellite-derived GPP is most sensitive to the temperature, precipitation and cloudiness of summer, which is the peak of the growing season and also the period of the year when the GPP trend is maximum. Considering the regional median, the summer temperature explains as much as 37.762% of the variation in annual GPP, while precipitation and cloudiness explain 20.7 and 19.362%. Warming over the period analysed, even without a sustained increase in precipitation, led to a significant positive impact on GPP for 61.762% of the region. However, a significant negative impact on GPP was also found, for 2.462% of the region, primarily the dryer grasslands in the south-west of the study area. For this region, precipitation positively correlates with GPP, as does cloudiness. This shows that the south-western part of northern Eurasia is relatively more vulnerable to drought than other areas. While our results further advance the notion that air temperature is the dominant environmental control for recent GPP increases across northern Eurasia, the role of precipitation and cloudiness can not be ignored.

DOI

[8]
Gao Y N, Yu G R, Yan H Met al., 2014. A MODIS-based Photosynthetic Capacity Model to estimate gross primary production in northern China and the Tibetan Plateau.Remote Sensing of Environment, 148: 108-118.Accurate quantification of the spatio-temporal variation of gross primary production (GPP) for terrestrial ecosystems is significant for ecosystem management and the study of the global carbon cycle. In this study, we propose a MODIS-based Photosynthetic Capacity Model (PCM) to estimate GPP in Northern China and the Tibetan Plateau. The PCM follows the logic of the light use efficiency model and is only driven by the Enhanced Vegetation Index (EVI) and the Land Surface Water Index (LSWI). Multi-year eddy CO 2 flux data from five vegetation types in North China (temperate mixed forest, temperate steppe) and the Tibetan Plateau (alpine shrubland, alpine marsh and alpine meadow-steppe) were used for model parameterization and validation. In most cases, the seasonal and interannual variation in the simulated GPP agreed well with the observed GPP. Model comparisons showed that the predictive accuracy of the PCM was higher than that of the MODIS GPP products and was comparable with that of the Vegetation Photosynthesis Model (VPM) and the potential PAR-based GPP models. The model parameter ( PC max ) of the PCM represents the maximum photosynthetic capacity, which showed a good linear relationship with the mean annual nighttime Land Surface Temperature (LST an ). With this linear function, the PCM-simulated GPP can explain approximately 93% of the variation in the flux-observed GPP across all five vegetation types. These analyses demonstrated the potential of the PCM as an alternative tool for regional GPP estimation.

DOI

[9]
Guo J P, Zhao J F, Wu D Ret al., 2014. Attribution of maize yield increase in China to climate change and technological advancement between 1980 and 2010.Journal of Meteorological Research, 28(6): 1168-1181.Crop yields are affected by climate change and technological advancement. Objectively and quantitatively evaluating the attribution of crop yield change to climate change and technological advancement will ensure sustainable development of agriculture under climate change. In this study, daily climate variables obtained from 553 meteorological stations in China for the period 1961–2010, detailed observations of maize from 653 agricultural meteorological stations for the period 1981–2010, and results using an Agro-Ecological Zones (AEZ) model, are used to explore the attribution of maize (Zea mays L.) yield change to climate change and technological advancement. In the AEZ model, the climatic potential productivity is examined through three step-by-step levels: photosynthetic potential productivity, photosynthetic thermal potential productivity, and climatic potential productivity. The relative impacts of different climate variables on climatic potential productivity of maize from 1961 to 2010 in China are then evaluated. Combined with the observations of maize, the contributions of climate change and technological advancement to maize yield from 1981 to 2010 in China are separated. The results show that, from 1961 to 2010, climate change had a significant adverse impact on the climatic potential productivity of maize in China. Decreased radiation and increased temperature were the main factors leading to the decrease of climatic potential productivity. However, changes in precipitation had only a small effect. The maize yields of the 14 main planting provinces in China increased obviously over the past 30 years, which was opposite to the decreasing trends of climatic potential productivity. This suggests that technological advancement has offset the negative effects of climate change on maize yield. Technological advancement contributed to maize yield increases by 99.6%–141.6%, while climate change contribution was from 6141.4% to 0.4%. In particular, the actual maize yields in Shandong, Henan, Jilin, and Inner Mongolia increased by 98.4, 90.4, 98.7, and 121.5 kg hm 612 yr 611 over the past 30 years, respectively. Correspondingly, the maize yields affected by technological advancement increased by 113.7, 97.9, 111.5, and 124.8 kg hm 612 yr 611 , respectively. On the contrary, maize yields reduced markedly under climate change, with an average reduction of 619.0 kg hm 612 yr 611 . Our findings highlight that agronomic technological advancement has contributed dominantly to maize yield increases in China in the past three decades.

DOI

[10]
Jaksa W T, Sridhar V, 2015. Effect of irrigation in simulating long-term evapotranspiration climatology in a human-dominated river basin system.Agricultural and Forest Meteorology, 200: 109-118.Evapotranspiration (ET) is highly variable in space and time and its quantification using observations or land surface models aids in irrigation and water management. Using the Noah land surface model, long-term trends of ET and surface energy balance were studied within the Snake River basin for the past 30 years spanning between 1980 and 2010. In this study, changes only due to meteorological factors were considered to capture the patterns of change in surface energy balance components. We employed an irrigation scheme in this simulation study since the agricultural lands in the river basin is irrigated almost entirely. This investigation has implications for water management, hydrology, and sustainability of this ecosystem. Uncoupled land surface modeling showed that the energy budget was altered due to anthropogenic activities in the basin with increased latent heat flux and reduced sensible heat flux. ET generally increased over a thirty year period due to warming climate and boundary layer meteorological variables indicated cooling induced by irrigation.

DOI

[11]
Ji X J, Yu Y Q, Zhang Wet al., 2010. Spatial-temporal patterns of winter wheat harvest index in China in recent twenty years.Scientia Agricultura Sinica, 43(17): 3511-3519. (in Chinese)Objective】 The purpose of the study is to understand the general condition and spatial-temporal patterns of winter wheat harvest index and identify the main factors that contributed to harvest index(HI) changes of winter wheat in China.【Method】 With observed data of winter wheat cultivation at agrometeorological stations between 1982 and 2005,HI of winter wheat and its relevant statistical parameters were calculated in different regions of China.Analysis was conducted on the inter-annual variability of winter wheat HI in Henan,Hebei and Shandong.Partial correlation between HI and three yield components and straw biomass were also statistically analyzed.【Result】 For the recent twenty years,the average HI in China was 0.409(±0.069,n=1 522),with 0.378(±0.061,n=428) in 1980s,0.408(±0.070,n=657) in 1990s and 0.440(±0.062,n=437) at present;it was averagely 0.408,0.417 and 0.410 in Henan,Hebei and Shandong respectively.HI increased temporally in the dominant plantation region of China,at the rate of 0.066/10a(Henan),0.044/10a(Shandong) and 0.032/10a(Hebei) accordingly.Results of partial correlation analysis showed the most significant negative correlation between harvest index and straw biomass.Significant positive correlation between harvest index and the three yield components were also exists but differed spatially.【Conclusion】 Winter wheat harvest index showed spatial-temporal variations in China.Decreasing straw biomass contributed the most to harvest index gain,while 1000-kernel-weight contributed the least;the number of spikes and kernels per spike influenced harvest index in a positive but spatially different way.

DOI

[12]
Jia Z Z, Liu S M, Xu Z Wet al., 2012. Validation of remotely sensed evapotranspiration over the Hai River Basin, China. Journal of Geophysical Research-Atmospheres, 117(D13113): 1-21.Ground-based validation is crucial for ensuring the accuracy of remotely sensed evapotranspiration (RS_ET) and extending its application. This paper proposes an innovative validation method based on multisource evapotranspiration (ET) from ground measurements, with the validation results including the accuracy assessment, error source analysis, and uncertainty analysis of the validation process. It is a potentially useful approach to evaluate the accuracy and analyze the spatiotemporal properties of RS_ET at both the basin and local scales, and is appropriate to validate RS_ET in diverse resolutions at different time-scales. An independent RS_ET validation using such a method was presented over the Hai River Basin in 2002-2009, China. In general, validation at the basin scale showed good agreements between the 1 km annual RS_ET and the validation data such as the water balance ET (root-mean-square error (RMSE): 50.73 mm), MODIS ET products (RMSE: 79.84 mm), precipitation, and land use types. At the local scale, multiscale ET measurements from large aperture scintillometer (LAS) and eddy covariance system (EC) with a footprint model were used for validation over three typical landscapes. In most cases, the 1 km RS_ET resulted in slight overestimation with the LAS measurements (RMSE: 10.75 mm for monthly results, 0.78 mm for daily results), while the 30 m RS_ET was underestimated compared to the EC measurements (RMSE: 16.28 mm for monthly results, 0.99 mm for daily results). Furthermore, error sources of RS_ET and uncertainties of the validation process were investigated in detail. The results showed that the proposed validation method was reasonable and feasible.

DOI

[13]
Lei H M, Yang D W, 2010. Interannual and seasonal variability in evapotranspiration and energy partitioning over an irrigated cropland in the North China Plain.Agricultural and Forest Meteorology, 150(4): 581-589.Using the eddy covariance technique, three years (October 2005–September 2008) of water and energy flux measurements were obtained for a winter wheat/summer maize rotation cropland in the North China Plain. This region is critical for food production in China, and is prone to significant water shortages and drought. Seasonal and interannual variability in evapotranspiration ( ET ) were examined in terms of relevant controlling factors. The annual ET was 595 and 60902mm in the periods of 2005–2006 and 2006–2007, respectively. The average seasonal ET in the wheat and maize field was 401 and 21202mm, respectively. Seasonal variability in ET was primarily explained by the variations in equilibrium evaporation ( ET eq ) and canopy conductance ( G s ). Daily evapotranspiration ranged from 1.0 to 7.802mm02day 611 during the wheat season and reached up to 5.102mm02day 611 during the maize season. The maximum midday average G s was 3202mm02s 611 for wheat and 1702mm02s 611 for maize. During the rapid growth stages, the average midday LE / R n ( LE is latent heat flux, R n is net radiation) was 83% for wheat and 57% for maize, indicating a higher water consumption for wheat than for maize. On an annual basis, latent heat flux accounted for about 59% of the net radiation, suggesting that more energy is partitioned into evapotranspiration in this agroecosystem site. Regional irrigation promoted sensible heat advection from the surrounding drier surface during the wheat seasons. Monthly ET totals enhanced by sensible heat advection accounted for 27% of the ET eq during the rapid growing season of wheat.

DOI

[14]
Li D, 2014. Assessing the impact of interannual variability of precipitation and potential evaporation on evapotranspiration.Advances in Water Resources, 70: 1-11.The impact of interannual variability of precipitation and potential evaporation on the long-term mean annual evapotranspiration as well as on the interannual variability of evapotranspiration is studied using a stochastic soil moisture model within the Budyko framework. Results indicate that given the same long-term mean annual precipitation and potential evaporation, including interannual variability of precipitation and potential evaporation reduces the long-term mean annual evapotranspiration. This reduction effect is mostly prominent when the dryness index (i.e., the ratio of potential evaporation to precipitation) is within the range from 0.5 to 2. The maximum reductions in the evaporation ratio (i.e., the ratio of evapotranspiration to precipitation) can reach 8鈥10% for a range of coefficient of variation (CV) values for precipitation and potential evaporation. The relations between the maximum reductions and the CV values of precipitation and potential evaporation follow power laws. Hence the larger the interannual variability of precipitation and potential evaporation becomes, the larger the reductions in the evaporation ratio will be. The inclusion of interannual variability of precipitation and potential evaporation also increases the interannual variability of evapotranspiration. It is found that the interannual variability of daily rainfall depth and that of the frequency of daily rainfall events have quantitatively different impacts on the interannual variability of evapotranspiration; and they also interact differently with the interannual variability of potential evaporation. The results presented in this study demonstrate the importance of understanding the role of interannual variability of precipitation and potential evaporation in land surface hydrology under a warming climate.

DOI

[15]
Li F Q, Kustas W P, Prueger J Het al., 2005. Utility of remote sensing-based two-source energy balance model under low- and high-vegetation cover conditions.Journal of Hydrometeorology, 6(6): 878-891.Two resistance network formulations used in a two-source model for parameterizing soil and canopy energy exchanges are evaluated for a wide range of soybean and corn crop cover and soil moisture conditions during the Soil Moisture Atmosphere Coupling Experiment (SMACEX). The parallel resistance formulation does not consider interaction between the soil and canopy fluxes whereas the series resistance algorithms provide interaction via the computation of a within-air canopy temperature. Land surface temperatures were derived from high resolution Landsat TM/ETM scenes and aircraft imagery. These data, along with tower-based meteorological data, provided inputs for the two-source energy balance model. Comparison of local model output with tower-based flux observations indicated that both the parallel and series resistance formulations produced basically similar estimates with root-mean-square-differences (RMSD) values ranging from approximately 20 to 50 Wm-2 for net radiation and latent heat fluxes, respectively. The largest relative difference in percentage (mean-absolute-percent-difference, MAPD) was for sensible heat flux, which was ~ 35 %, followed by a MAPD ~ 25% for soil heat flux, ~ 10% for latent heat flux and MAPD < 5 % for net radiation. Although both series and parallel versions gave similar results, the parallel resistance formulation was found to be more sensitive to model parameter specification, particularly in accounting for effects of vegetation clumping due to row crop planting on flux partitioning. A sensitivity and model stability analysis for a key model input variable, fractional vegetation cover, also show that the parallel resistance network is more sensitive to the errors vegetation cover estimates. Furthermore, it is shown that for a much narrower range in vegetation cover fraction, compared to the series resistance network, is the parallel resistance scheme able to achieve a balance in both the radiative temperature and convective heat fluxes between the soil and canopy components. This result appears to be related to the moderating effects of the air temperature in the canopy air space computed in the series resistance scheme, which represents the effective source height for turbulent energy exchange across the soil-canopy-atmosphere system.

DOI

[16]
Lin Z H, Mo X G, Li H Xet al., 2002. Comparison of three spatial interpolation methods for climate variables in China.Acta Geographica Sinica, 57(1): 47-56. (in Chinese)

[17]
Liu B, Sun Y L, Wang Y Cet al., 2013. Monitoring and assessment of vegetation variation in North China based on SPOT/NDVI.Journal of Arid Land Resources and Environment, 27(9): 98-103. (in Chinese)SPOT NDVI data from 1998 to 2011 were adopted to reflect the characteristics of vegetation coverage change in North China.The change was dynamically monitored and assessed from the time and spatial aspects combined with temperature and precipitation data between 1982-2011 of 84 meteorological sites and land cover data.And the change reasons were analyzed in brief.The results showed as follows:(1) In the time dimension,an increase of NDVI was found in the whole North China from 1998 to 2011,which indicated that the vegetation was recovering well in this area.And particularly the NDVI of forest and farmland increased most rapidly.(2) In the spatial dimension,the greening area was larger than the degraded area in the whole North China,and the vegetation of forest and farmland recovered most obviously,while the degrade area of bush,grassland and desert was larger than their greening area,which meant that the degree of water and soil loss and desertification of North China was still serious.(3) There was a positive correlation between NDVI and precipitation under the background of North China whose climate is increasingly warming and drying for a long time.Vegetation change of North China was better correlated with precipitation than temperature,which indicated that the sensitivity of vegetation change to precipitation was higher during these years.Besides climatic factors,human activities were also important factors making the vegetation change.

[18]
Liu Q A, Yang Z F, 2010. Quantitative estimation of the impact of climate change on actual evapotranspiration in the Yellow River Basin, China.Journal of Hydrology, 395(3/4): 226-234.The spatial distribution and temporal trends for actual evapotranspiration (ET a) reflect the combined effects of the climate, soil and vegetation. This study was conducted to investigate the influence of climatic change on ET a. Using the simple two-parameter steady-state model (SPS model), ET a was calculated from precipitation and potential evapotranspiration (ET p) at 89 meteorological stations during 1961–2006 in the Yellow River Basin (YRB), China. The spatial distribution of ET a was performed by means of Kriging method, and the temporal trends of ET a were investigated by the least squares linear model (linear fitted model), the Mann–Kendall method (the M– K method), Kendall τ statistical method (Kendall τ method) and the causes for the variations were discussed by means of the ‘detrended method’ and SPS model. The results presented that: (i) the spatial distribution of ET a, as most of the YRB is water-limited, presented a similar spatial pattern with precipitation, which demonstrates decreasing trends from southeast to northwest; (ii) negative trends for ET a were detected by both the linear fitted model and Kendall τ method, and significant decreasing trends (at 95% confidence level) were detected in all regions of YRB; (iii) the timings of abrupt changes detected by the M– K method was 1991, 1979, 1975 and 1978 in the upper, middle, lower region and whole YRB, respectively, and so the ET a during 1961–2006 was divided into two periods: natural period and changed period (e.g. natural period (1961–1990) and changed period (1991–2006) in the upper region); and (iv) the influence of climatic change on ET a contributed to 613.10 × 10 9 m 3, 614.26 × 10 9 m 3, 6115.68 × 10 9 m 3 and 6116.62 × 10 9 m 3 between natural period and changed period in the upper region, middle region, lower region and whole basin of YRB, respectively. The trends of ET a, ET p and precipitation reflected that ET a is controlled by precipitation rather than ET p, especially the results presented an evidence for the Bouchet’s complementary hypothesis in the middle region of YRB.

DOI

[19]
Liu S M, Xu Z W, Zhu Z Let al., 2013. Measurements of evapotranspiration from eddy-covariance systems and large aperture scintillometers in the Hai River Basin, China.Journal of Hydrology, 487: 24-38.Evapotranspiration (ET) observations were made for 302years (2008–2010), using eddy covariance (EC) systems and large aperture scintillometers (LAS), in typical underlying surfaces across the Hai River Basin: orchards (Miyun, MY), cropland in the suburbs (Daxing, DX), and cropland in the plains (Guantao, GT). Reliable data were obtained after carefully data processing, and the seasonal and interannual variability in ET was quantitatively analyzed. The annual ET during 2008–2010 ranged from 510–73002mm for the EC measurements and 430–56002mm for the LAS measurements. The differences in ET among the years and sites were connected with differences in soil moisture and crop growing conditions. The difference in the source areas of EC and LAS measurements and the heterogeneity in their source areas are the primary causes of the discrepancy between EC and LAS measurements. The EC and LAS measurements are compared to the field water balance method calculation and MOD16 ET (the MODIS ET product from the MODIS Global Evapotranspiration Project), respectively. The average difference was 0.85% (mean relative error) and 33.8002mm (root mean square error) between the EC measurements and field water balance method calculations, and 7.72% and 47.0802mm between LAS measurements and MOD16 ET from 2008 to 2010 at the three sites. We found a decreasing tendency for ET in the past 1502years across the Hai River Basin, especially after the year of 2005.

DOI

[20]
Liu X P, Zhang W J, Yang Fet al., 2012. Changes in vegetation-environment relationships over long-term natural restoration process in Middle Taihang Mountain of North China.Ecological Engineering, 49: 193-200.Understanding relationships between vegetation and environmental variables is very important for ecosystem restoration and management efforts in middle Taihang Mountain of North China, However, information on how environment factors influence the long-term natural restoration process is lacking. The objective of this research is to identity controlling environmental variables over natural restoration process in middle Taihang Mountain of North China using multivariate techniques of detrended correspondence analysis (DCA) and redundancy analysis (RDA). Vegetation and soil surveys were performed in 144 permanent sampling plots in Niujiazhuang Catchment in 1986 and 2008. Vegetation variables include shrub height, shrub coverage, shrub biomass, herb height, herb coverage, herb biomass, species richness (S), Shannon iener's (H), Simpson's predominance index (D), and evenness index (Jsw). Topographic variables include elevation, slope, slope position, and slope aspect. Soil variables include soil thickness, humus thickness, rock content, soil organic matter, and total N, P, and K. Results indicate that the most important factors that influence the composition of vegetation assemblages (diversity, distribution and above-ground biomass) were total K in 1986 and total P in 2008. Also, the results suggest significant correlations among vegetation variables, soil nutrient contents, and topographic variables. For example, total N, P, and K were positively correlated with soil organic matter significantly. Relationships between vegetation and environmental variables over long-term natural restoration provide some valuable implications for regional ecological restoration and land management. To restore the degraded ecosystems, maintain the diversity and structure of ecosystems in middle Taihang Mountain, we should consider the co-evolution of both vegetation and soil, and also natural succession sequence.

DOI

[21]
Liu X Y, Li Y Z, Hao W P, 2005. Trend and causes of water requirement of main crops in North China in recent 50 years.Transactions of the CSAE, 21(10): 155-159. (in Chinese)Information of crop water requirement and its historical change are important for irrigation scheduling,water resources planning,and future decision-making.Crop water requirements of winter wheat and summer corn in North China in recent 50 years were calculated by the FAO approach,which equaled to crop coefficient(multiplied) by reference crop evapotranspiration.Results suggested that water requirements of winter wheat and summer corn in most locations showed a downtrend in the past 50 years except Beijing,which respectively decreased by 0.9~19.2 mm and 8.3~24.3 mm for every 10 years.The decrease for summer corn exceeds that for winter wheat.Zhengzhou,the southern part of North China,ranks the first in terms of decreasing value,19.2~24.3 mm per 10 year.The correlations among crop water requirement and sunlight,wind speed,temperature,humidity and rainfall revealed that the change of crop water requirement and the downtrend of sunlight and wind speed was coincident.Since decreased sunlight resulted in reduced energy reaching earth, and decreased wind may weaken the water and energy exchange between the earth and atmosphere,the downtrend of crop water requirement in North China mainly attributed to the reduction of sunlight hours and wind speed.

[22]
Liu Y A, Wang E L, Yang X Get al., 2010. Contributions of climatic and crop varietal changes to crop production in the North China Plain, since 1980s.Global Change Biology, 16(8): 2287-2299.The North China Plain (NCP) is the most important agricultural production area in China. Crop production in the NCP is sensitive to changes in both climate and management practices. While previous studies showed a negative impact of climatic change on crop yield since 1980s, the confounding effects of climatic and agronomic factors have not been separately investigated. This paper used 25 years of crop data from three locations (Nanyang, Zhengzhou and Luancheng) across the NCP, together with daily weather data and crop modeling, to analyse the contribution of changes in climatic and agronomic factors to changes in grain yields of wheat and maize. The results showed that the changes in climate were not uniform across the NCP and during different crop growth stages. Warming mainly occurred during the vegetative (preflowering) growth stage of wheat and maize, while there was a cooling trend or no significant change in temperatures during the postflowering stage of wheat (spring) or maize (autumn). If varietal effects were excluded, warming during vegetative stages would lead to a reduction in the length of the growing period for both crops, generally leading to a negative impact on crop production. However, autonomous adoption of new crop varieties in the NCP was able to compensate the negative impact of climatic change. For both wheat and maize, the varietal changes helped stabilize the length of preflowering period against the shortening effect of warming and, together with the slightly reduced temperature in the postflowering period, extend the length of the grain-filling period. The combined effect led to increased wheat yield at Zhengzhou and Luancheng; increased maize yield at Nanyang and Luancheng; stabilized wheat yield at Nanyang, and a slight reduction in maize yield at Zhengzhou, compared with the yield change caused entirely by climatic change.

DOI

[23]
Liu Z J, Shao Q Q, Liu J Y, 2015. The performances of MODIS-GPP and -ET products in China and their sensitivity to input data (FPAR/LAI).Remote Sensing, 7(1): 135-152.The aims are to validate and assess the performances of MODIS gross primary production (MODIS-GPP) and evapotranspiration (MODIS-ET) products in China different land cover types and their sensitivity to remote sensing input data. In this study, MODIS-GPP and -ET are evaluated using flux derived/measured data from eight sites of ChinaFLUX. Results show that MODIS-GPP generally underestimates GPP (R2 is 0.58, bias is 6.7 gC/m2/8-day and RMSE is 19.4 gC/m2/8-day) at all sites and MODIS-ET overestimates ET (R2 is 0.36, bias is 6 mm/8-day and RMSE is 11 mm/8-day) when comparing with derived GPP and measured ET, respectively. For evergreen forests, MODIS-GPP gives a poor performance with R2 varying from 0.03 to 0.44; in contrast, MODIS-ET provides more reliable results. In croplands, MODIS-GPP can explain 80% of GPP variance, but it overestimates flux derived GPP in non-growing season and underestimates flux derived GPP in growing season; similar overestimations also presented in MODIS-ET. For grasslands and mixed forests, MODIS-GPP and -ET perform good estimating accuracy. By designing four experimental groups and taking GPP simulation as an example, we suggest that the maximum light use efficiency of croplands should be optimized, and the differences of meteorological data have little impact on GPP estimation, whereas remote sensing leaf area index/fraction of photo-synthetically active radiation (LAI/FPAR) can greatly affect GPP/ET estimations for all land cover types. Thus, accurate remote sensing parameters are important for achieving reliable estimations.

DOI

[24]
Liu Z J, Wang L C, Wang S S, 2014. Comparison of different GPP models in China using MODIS image and ChinaFLUX data.Remote Sensing, 6(10): 10215-10231.Accurate quantification of gross primary production (GPP) at regional and global scales is essential for carbon budgets and climate change studies. Five models, the vegetation photosynthesis model (VPM), the temperature and greenness model (TG), the alpine vegetation model (AVM), the greenness and radiation model (GR), and the MOD17 algorithm, were tested and calibrated at eight sites in China during 2003 2005. Results indicate that the first four models provide more reliable GPP estimation than MOD17 products/algorithm, although MODIS GPP products show better performance in grasslands, croplands, and mixed forest (MF). VPM and AVM produce better estimates in forest sites (R2 = 0.68 and 0.67, respectively); AVM and TG models show satisfactory GPP estimates for grasslands (R2 = 0.91 and 0.9, respectively). In general, the VPM model is the most suitable model for GPP estimation for all kinds of land cover types in China, with R2 higher than 0.34 and root mean square error (RMSE) lower than 48.79%. The relationships between eddy CO2 flux and model parameters (Enhanced Vegetation Index (EVI), photosynthetically active radiation (PAR), land surface temperature (LST), air temperature, and Land Surface Water Index (LSWI)) are further analyzed to investigate the model application to various land cover types, which will be of great importance for studying the effects of climatic factors on ecosystem performances.

DOI

[25]
Lobell D B, Asner G P, 2003. Climate and management contributions to recent trends in US agricultural yields.Science, 299(5609): 1032-1032.ABSTRACT An abstract is not available.

DOI PMID

[26]
Lobell D B, Field C B, 2007. Global scale climate-crop yield relationships and the impacts of recent warming.Environmental Research Letters, 2(1): 014002.

DOI

[27]
Lobell D B, Schlenker W, Costa-Roberts J, 2011. Climate trends and global crop production since 1980.Science, 333(6042): 616-620.Efforts to anticipate how climate change will affect future food availability can benefit from understanding the impacts of changes to date. We found that in the cropping regions and growing seasons of most countries, with the important exception of the United States, temperature trends from 1980 to 2008 exceeded one standard deviation of historic year-to-year variability. Models that link yields of the four largest commodity crops to weather indicate that global maize and wheat production declined by 3.8 and 5.5%, respectively, relative to a counterfactual without climate trends. For soybeans and rice, winners and losers largely balanced out. Climate trends were large enough in some countries to offset a significant portion of the increases in average yields that arose from technology, carbon dioxide fertilization, and other factors.

DOI PMID

[28]
Ma X N, Zhang M J, Li Y Jet al., 2012. Decreasing potential evapotranspiration in the Huanghe River Watershed in climate warming during 1960-2010.Journal of Geographical Sciences, 22(6): 977-988.According to the meteorological observation data of 72 stations from 1960 to 2010 in the Huanghe (Yellow) River Watershed, China, the long-term variations of potential evapotranspiration, calculated in the modified Penman-Monteith model of Food and Agriculture Organization of the United Nations, were presented, as well as the meteorological causes for the decrease of potential evapotranspiration were discussed. Since 1960, temperature has risen significantly and potential evapotranspiration a decreasing trend, which indicated the existence of "Evaporation paradox" in the Huanghe River Watershed. This phenomenon was not consistent spatially or temporally with the increase of temperature, potential evapotranspiration decreased in spring, summer and winter, mainly over most parts of Shanxi and Henan, and some parts of Gansu, Ningxia, Inner Mongolia, and Shaanxi. During the recent half century, the trends of temperature and potential evapotranspiration were negatively correlated at most of the stations, while precipitation and potential evapotranspiration exhibited a contrary trend. Calculated in multiple regressions, the contribution to potential evapotranspiration change of related meteorological factors was discussed, including mean pressure, maximum and minimum temperature, sunshine hours, relative humidity and average wind speed. The decrease of wind speed in the Huanghe River Watershed may be the dominating factor causing potential evapotranspiration decreasing.

DOI

[29]
Mo X G, Liu S X, Lin Z Het al., 2011. Patterns of evapotranspiration and GPP and their responses to climate variations over the North China Plain.Acta Geographica Sinica, 66(5): 589-598. (in Chinese)Insufficient water resources is a major constraint on sustainable development of agriculture and socio-economy, and an imminent threat to national food security. Present situation attached particular importance to assurance of water supply for agriculture and ecology, which was on the basis of effective predication for regional evapotranspiration and water use efficiency (WUE). In this paper, an evapotranspiration and gross primary production (GPP) model based on vegetation index from Terra-MODIS was developed, and evapotranspiration and GPP in the North China Plain (NCP) during the period 2000-2009 were simulated. Results indicated that longitudinal trend was noticeable for both evapotranspiration and GPP distribution, especially in winter wheat growing season. With respect to water balance, it is concluded that regions with higher evapotranspiration than precipitation were mainly distributed to the north of the Yellow River, while the southern NCP showed a rainfall surplus. Affected and regulated by both climatic fluctuation and dynamic response of vegetation, both evapotranspiration and GPP illustrated considerable inter-annual variation. The research results can provide guidance to assessment of water consumption for ecological environment and water use efficacy.

DOI

[30]
Mo X, Liu S, Lin Zet al., 2015. Trends in land surface evapotranspiration across China with remotely sensed NDVI and climatological data for 1981-2010.Hydrological Sciences Journal-Journal Des Sciences Hydrologiques, 60(12): 2163-2177.Using satellite observations of Normalized Difference Vegetation Index (NDVI) from NOAA-AVHRR and Terra-MODIS, together with climatic data in a physical evapotranspiration (ET) model, the spatio-temporal variability of ET is investigated in terrestrial China from 1981 to 2010. The model predictions of actual ET (ETa) are validated with ET values fromin situeddy covariance flux measurements and from basin water balance calculations. The national averaged crop reference ET (ETp) and ETavalues are 91602±0221 and 41502±021202mm year-1, respectively. The annual ETapattern is closely associated with vegetation conditions in the eastern part of China, whereas ETais low in the sparsely-vegetated areas and deserts in the northwestern region, corresponding to scarce rainfall events and amounts. The trends of ETpand ETaare remarkably different over the country, and the complementary relationship between ETpand ETais revealed for the study period. Averaged over the whole country, ETashowed an increasing trend from the 1980s to the mid-1990s, followed by a decreasing trend, consistent with the precipitation anomaly. Across the main vegetation types, annual ETaamounts are found to correspond clearly with the bands of precipitation and ETp.

DOI

[31]
Mu Q Z, Zhao M S, Running S W, 2011. Improvements to a MODIS global terrestrial evapotranspiration algorithm.Remote Sensing of Environment, 115(8): 1781-1800.78 Improving the MODIS ET algorithm (Mu et al., 2007a, old algorithm). 78 Global terrestrial annual total ET (62.8 × 10 3 km 3) agrees with reported 65.5 × 10 3 km 3. 78 MAE of 24.6% and 24.1% are in the 10–30% range of the accuracy of ET measurements.

DOI

[32]
Nicholls N, 1997. Increased Australian wheat yield due to recent climate trends.Nature, 387(6632): 484-485.The possibility that future climate change may affect agriculture has attracted considerable attention. As a step towards evaluating such influences, the effect of climate trends over the past few decadesneeds to be assessed. Here I estimate the contribution of climate trends in Australiato the substantial increase in Australian wheat yields since 1952. Non-climatic influences- such as new cultivars and changes in crop management practices-are removed by detrending the wheat yield and climate variables and using the residuals to calculate quantitative relationships between variations in climate and yield. Climate trends appear to be responsible for 30-50% of the observed increase in wheat yields, with increases in minimum temperatures being the dominant influence. This approach should be applicable in other regions for which sufficient data exist.

DOI

[33]
Qiu G Y, Wang L M, He X Het al., 2008. Water use efficiency and evapotranspiration of winter wheat and its response to irrigation regime in the North China Plain.Agricultural and Forest Meteorology, 148(11): 1848-1859.Improvement of water use efficiency (WUE) in crops is important for almost all agricultural practices around the world. Numerous studies have addressed WUE on a grain yield basis, but few on a photosynthesis basis and a biomass basis. Based on a 2-year field experiment (2002–2004), we analyzed wheat WUE not only on grain yield basis, but also on photosynthesis basis and biomass basis, and then discussed the effects of irrigation regimes on wheat WUE. We found that: (1) irrigation regimes had considerable effects on wheat transpiration, total evapotranspiration, and canopy temperature; (2) wheat WUE ranged 2.1–3.3 μmol CO 2/mmol H 2O on a photosynthesis basis, 1.0–2.6 kg m 613 and 1.1–2.1 kg m 613 on a biomass and a grain yield basis, respectively. The maximum WUE appeared during the jointing and the milking stage, when suitable water management could be crucial to improve wheat WUE; (3) it was hypothesized by farmers and local water managers that more water supply over the conventional irrigation regime during the growing season could significantly increase both WUE and grain yield of the winter wheat in the north China plain (NCP). However, our results showed that with the increase of irrigation times and amount of irrigation water per growing season, wheat WUE was generally decreased and grain yield was not increased, although the evapotranspiration was significantly increased. Reduction in irrigation times and amount of irrigation water could be considered for saving water in the NCP; (4) WUE of winter wheat at photosynthesis and biomass levels were positively related with WUE at grain yield level.

DOI

[34]
Savitzky A, Golay M J E, 1964. Smoothing and differentiation of data by simplified least squares procedures.Analytical Chemistry, 36(8): 1627-1639.

DOI

[35]
Shi W J, Tao F L, Zhang Z, 2013. A review on statistical models for identifying climate contributions to crop yields.Journal of Geographical Sciences, 23(3): 567-576.Statistical models using historical data on crop yields and weather to calibrate relatively simple regression equations have been widely and extensively applied in previous studies, and have provided a common alternative to process-based models, which require extensive input data on cultivar, management, and soil conditions. However, very few studies had been conducted to review systematically the previous statistical models for indentifying climate contributions to crop yields. This paper introduces three main statistical methods, i.e., time-series model, cross-section model and panel model, which have been used to identify such issues in the field of agrometeorology. Generally, research spatial scale could be categorized into two types using statistical models, including site scale and regional scale (e.g. global scale, national scale, provincial scale and county scale). Four issues exist in identifying response sensitivity of crop yields to climate change by statistical models. The issues include the extent of spatial and temporal scale, non-climatic trend removal, colinearity existing in climate variables and non-consideration of adaptations. Respective resolutions for the above four issues have been put forward in the section of perspective on the future of statistical models finally.

DOI

[36]
Shi X Y, Mao J F, Thornton P Eet al., 2013. Spatiotemporal patterns of evapotranspiration in response to multiple environmental factors simulated by the community land model.Environmental Research Letters, 8(2): 024012.Spatiotemporal patterns of evapotranspiration (ET) over the period from 1982 to 2008 are investigated and attributed to multiple environmental factors using the Community Land Model version 4 (CLM4). Our results show that CLM4 captures the spatial distribution and interannual variability of ET well when compared to observation-based estimates. We find that climate dominates the predicted variability in ET. Elevated atmospheric COconcentration also plays an important role in modulating the trend of predicted ET over most land areas, and replaces climate to function as the dominant factor controlling ET changes over the North America, South America and Asia regions. Compared to the effect of climate and COconcentration, the roles of other factors such as nitrogen deposition, land use change and aerosol deposition are less pronounced and regionally dependent. The aerosol deposition contribution is the third most important factor for trends of ET over Europe, while it has the smallest impact over other regions. As ET is a dominant component of the terrestrial water cycle, our results suggest that environmental factors like elevated CO, nitrogen and aerosol depositions, and land use change, in addition to climate, could have significant impact on future projections of water resources and water cycle dynamics at global and regional scales. (letter)

DOI

[37]
Sun H Y, Liu C M, Zhang X Yet al., 2006. Effects of irrigation on water balance, yield and WUE of winter wheat in the North China Plain.Agricultural Water Management, 85(1/2): 211-218.Limited precipitation restricts yield of winter wheat grown in the North China Plain (NCP). Irrigation experiments were conducted during different growing stages of winter wheat ( Triticum aestivum L.) at Luancheng agro-ecology systems station of the Chinese Academy of Sciences during 1999/2000, 2000/2001 and 2001/2002 to identify suitable irrigation schedules for winter wheat. The aim was also to develop relationships between seasonal amounts of irrigation and yield, water-use efficiency (WUE), irrigation water-use efficiency (WUEi), net water-use efficiency (WUEet) and evapotranspiration (ET). A comparison of irrigation schedules for wheat suggested that for maximum yield in the NCP, 300 mm is an optimal amount of irrigation, corresponding to an ET value of 426 mm. Results showed that with increasing ET, the irrigation requirements of winter wheat increase as do soil evaporation but excessive amounts of irrigation can decrease grain yield, WUE, and WUEi. These results indicate that excessive irrigation might not produce greater yield or optimal economic benefit, thus, suitable irrigation schedules must be established.

DOI

[38]
Sun H Y, Zhang X Y, Wang E Let al., 2016. Assessing the contribution of weather and management to the annual yield variation of summer maize using APSIM in the North China Plain.Field Crops Research, 194: 94-102.Long-term field experimental data provides a good opportunity to evaluate the effects of different management practices and weather factors on maize yield. An 11-year field experiment (2003 2013) with the same maize cultivar and two short-term experiments including different sowing dates and plant densities were conducted at Luancheng Agro-ecological Experimental Station in the North China Plain (NCP). The measured pheonological development, biomass and grain yield were used to calibrate and validate the APSIM-maize model. The results showed that APSIM-maize model could capture the biomass and grain yield of summer maize under the various management practices and weather conditions. After calibration and validation, five scenarios were simulated using the APSIM model. The simulated results showed that weather factors including sunshine hours and the diurnal temperature range during the grain fill stage had the positive effects on maize yield. For different management practices, plant density was the most important factor which affected the maize yield. The optimal plant density was approximate 8.6plants/m2. Maize yield would be decreased with the sowing dates delayed after the middle of June. Meanwhile, earlier sowing before the end of May also reduced the grain production. The optimized sowing date and plant density could reduce the seasonal yield variation of maize caused by the weather factors. The findings of this study suggest that the maize plant density should be properly increased and sowing time should be optimized according to the harvesting of its previous crop.

DOI

[39]
Tao F L, Yokozawa M, Liu J Yet al., 2008. Climate-crop yield relationships at provincial scales in China and the impacts of recent climate trends.Climate Research, 38(1): 83-94.中国科学院机构知识库(中国科学院机构知识库网格(CAS IR GRID))以发展机构知识能力和知识管理能力为目标,快速实现对本机构知识资产的收集、长期保存、合理传播利用,积极建设对知识内容进行捕获、转化、传播、利用和审计的能力,逐步建设包括知识内容分析、关系分析和能力审计在内的知识服务能力,开展综合知识管理。

DOI

[40]
Tao F L, Zhang Z, 2013. Climate change, wheat productivity and water use in the North China Plain: A new super-ensemble-based probabilistic projection.Agricultural and Forest Meteorology, 170: 146-165.Ensemble-based probabilistic projection is an effective approach to deal with the uncertainties in climate change impact assessments and to inform adaptations. Here, the crop model MCWLA-Wheat was firstly developed by adapting the process-based general crop model, MCWLA [Tao, F., Yokozawa, M., Zhang, Z., 2009a. Modelling the impacts of weather and climate variability on crop productivity over a large area: a new process-based model development, optimization, and uncertainties analysis. Agric. For. Meteorol. 149, 831–850], to winter wheat. Then the Bayesian probability inversion and a Markov chain Monte Carlo (MCMC) technique were applied to the MCWLA-Wheat to analyse uncertainties in parameters estimations, and to optimize parameters. Ensemble hindcasts showed that the MCWLA-Wheat could capture the interannual variability of detrended historical yield series fairly well, especially over a large area. Finally, based on the MCWLA-Wheat, a super-ensemble-based probabilistic projection system was developed and applied to project the probabilistic responses of wheat productivity and water use in the North China Plain (NCP) to future climate change. The system used 10 climate scenarios consisting of the combinations of five global climate models and two greenhouse gases emission scenarios (A1FI and B1), the corresponding atmospheric CO2 concentration range, and multiple sets of crop model parameters representing the biophysical uncertainties from crop models. The results showed that winter wheat yields in the NCP could increase with high probability in future due to climate change. During 2020s, 2050s, and 2080s, with (without) CO2 fertilization effects, relative to 1961–1990 level, simulated wheat yields would increase averagely by up to 37.7% (18.6%), 67.8% (23.1%), and 87.2% (34.4%), respectively, across 80% of the study area; simulated changes in evaportranspiration during wheat growing period would range generally from 616% to 6% (610.6% to 10%), from 6110% to 8% (611.0% to 17%), and from 6117% to 4% (7–12%), respectively, across the study area. Further analyses suggested that the improvements in heat and water resources and rising atmospheric CO2 concentration ([CO2]) could contribute notably to wheat productivity increase in future. Climate change could enhance the development and photosynthesis rate; however the duration of reproductive period could be less affected than that of vegetative period, and wheat productivity could benefit from enhanced photosynthesis due to climate change and rising [CO2]. Furthermore, wheat could become mature earlier, which could prevent it from severe high temperature stress. Our study parameterized explicitly the effects of high temperature stress on productivity, accounted for a wide range of crop cultivars with contrasting phenological and thermal characteristics, and presented new findings on the probabilistic responses of wheat productivity and water use to climate change in the NCP.

DOI

[41]
Turner D P, Ritts W D, Cohen W Bet al., 2006. Evaluation of MODIS NPP and GPP products across multiple biomes.Remote Sensing of Environment, 102(3/4): 282-292.Estimates of daily gross primary production (GPP) and annual net primary production (NPP) at the 1km spatial resolution are now produced operationally for the global terrestrial surface using imagery from the MODIS (Moderate Resolution Imaging Spectroradiometer) sensor. Ecosystem-level measurements of GPP at eddy covariance flux towers and plot-level measurements of NPP over the surrounding landscape offer opportunities for validating the MODIS NPP and GPP products, but these flux measurements must be scaled over areas on the order of 25km 2 to make effective comparisons to the MODIS products. Here, we report results for such comparisons at 9 sites varying widely in biome type and land use. The sites included arctic tundra, boreal forest, temperate hardwood forest, temperate conifer forest, tropical rain forest, tallgrass prairie, desert grassland, and cropland. The ground-based NPP and GPP surfaces were generated by application of the Biome-BGC carbon cycle process model in a spatially-distributed mode. Model inputs of land cover and leaf area index were derived from Landsat data. The MODIS NPP and GPP products showed no overall bias. They tended to be overestimates at low productivity sites often because of artificially high values of MODIS FPAR (fraction of photosynthetically active radiation absorbed by the canopy), a critical input to the MODIS GPP algorithm. In contrast, the MODIS products tended to be underestimates in high productivity sites often a function of relatively low values for vegetation light use efficiency in the MODIS GPP algorithm. A global network of sites where both NPP and GPP are measured and scaled over the local landscape is needed to more comprehensively validate the MODIS NPP and GPP products and to potentially calibrate the MODIS NPP/GPP algorithm parameters.

DOI

[42]
Ukkola A M, Prentice I C, 2013. A worldwide analysis of trends in water-balance evapotranspiration.Hydrology and Earth System Sciences, 17(10): 4177-4187.Climate change is expected to alter the global hydrological cycle, with inevitable consequences for freshwater availability to people and ecosystems. But the attribution of recent trends in the terrestrial water balance remains disputed. This study attempts to account statistically for both trends and interannual variability in water-balance evapotranspiration (ET), estimated from the annual observed streamflow in 109 river basins during "water years" 19611999 and two gridded precipitation data sets. The basins were chosen based on the availability of streamflow time-series data in the Dai et al. (2009) synthesis. They were divided into water-limited "dry" and energy-limited "wet" basins following the Budyko framework. We investigated the potential roles of precipitation, aerosol-corrected solar radiation, land use change, wind speed, air temperature, and atmospheric CO2. Both trends and variability in ET show strong control by precipitation. There is some additional control of ET trends by vegetation processes, but little evidence for control by other factors. Interannual variability in ET was overwhelmingly dominated by precipitation, which accounted on average for 54-55% of the variation in wet basins (ranging from 0 to 100 %) and 94-95% in dry basins (ranging from 69 to 100 %). Precipitation accounted for 45-46% of ET trends in wet basins and 80-84% in dry basins. Net atmospheric CO2 effects on transpiration, estimated using the Land-surface Processes and eXchanges (LPX) model, did not contribute to observed trends in ET because declining stomatal conductance was counteracted by slightly but significantly increasing foliage cover.

DOI

[43]
Veron S R, de Abelleyra D, Lobell D B, 2015. Impacts of precipitation and temperature on crop yields in the Pampas.Climatic Change, 130(2): 235-245.Understanding regional impacts of recent climate trends can help anticipate how further climate change will affect agricultural productivity. We here used panel models to estimate the contribution of

DOI

[44]
Wang H S, Jia G S, Fu C Bet al., 2010. Deriving maximal light use efficiency from coordinated flux measurements and satellite data for regional gross primary production modeling.Remote Sensing of Environment, 114(10): 2248-2258.Remote sensing models based on light use efficiency (LUE) provide promising tools for monitoring spatial and temporal variation of gross primary production (GPP) at regional scale. In most of current LUE-based models, maximal LUE ( ε max) heavily relies on land cover types and is considered as a constant, rather than a variable for a certain vegetation type or even entire eco-region. However, species composition and plant functional types are often highly heterogeneous in a given land cover class; therefore, spatial heterogeneity of ε max must be fully considered in GPP modeling, so that a single cover type does not equate to a single ε max value. A spatial dataset of ε max accurately represents the spatial heterogeneity of maximal light use would be of significant beneficial to regional GPP models. Here, we developed a spatial dataset of ε max by integrating eddy covariance flux measurements from 14 field sites in a network of coordinated observation across northern China and satellite derived indices such as enhanced vegetation index (EVI) and visible albedo to simulate regional distribution of GPP. This dynamic modeling method recognizes the spatial heterogeneity of ε max and reduces the uncertainties in mixed pixels. Further, we simulated GPP with the spatial dataset of ε max generated above. Both ε max and growing season GPP show complex patterns over northern China that reflect influences of humidity, green vegetation fractions, and land use intensity. “Green spots” such as oasis meadow and alpine forests in dryland and “brown spots” such as build-up and heavily degraded vegetation in the east are clearly captured by the simulation. The correlation between simulated GPP and EC measured GPP indicate that the simulated GPP from this new approach is well matched with flux-measured GPP. Those results have demonstrated the importance of considering ε max as both a spatially and temporally variable values in GPP modeling.

DOI

[45]
Wang P T, Yan J P, Jiang Cet al., 2014. Spatial and temporal variations of reference crop evapotranspiration and its influencing factors in the North China Plain.Acta Ecologica Sinica, 34(19): 5589-5599. (in Chinese)On the Distributions of Dusts from Chimneys in the Neighbourhood of a Factory Sakagami Jiro , Kimura Yoshiko , Kato Makiko Natural science report of the Ochanomizu University 14(1), 17-"36-1", 1963-07

DOI

[46]
Wang S S, Mo X G, 2015. Comparison of multiple models for estimating gross primary production using remote sensing data and fluxnet observations.Remote Sensing and GIS for Hydrology and Water Resources, 368: 75-80.In this study, gross primary production (GPP) estimated from a temperature and greenness (TG) model, a greenness and radiation (GR) model, a vegetation photosynthesis model (VPM), and a MODIS product have been compared with eddy covariance measurements in cropland during 2003-2005. Results showed that the determination coefficients (R) between fluxnet GPP and estimated GPP were all greater than 0.74, indicating that all these models offered reliable estimates of GPP. We also found that the VPM-based GPP estimates performed a bit better (Ris 0.82, and RMSE is 16.75 gC m(8 day)) than other models, mainly due to its comprehensive consideration of the stresses from light, temperature and water. The actual GPP was overestimated in the non-growing season and underestimated in the growing season by MOD_GPP. The validation confirms that the above three models may be used to estimate crop production in the North China Plain, but there are still significant uncertainties.

DOI

[47]
Wang Z, Ye T, Wang Jet al., 2016. Contribution of climatic and technological factors to crop yield: Empirical evidence from late paddy rice in Hunan Province, China.Stochastic Environmental Research and Risk Assessment, 30(7): 2019-2030.Climatic and technological factors are two remarkable aspects that are thought to contribute to crop yield change. However, the most significant factors and their contribution rate remain debatable. S

DOI

[48]
Xiao D P, Tao F L, 2014. Contributions of cultivars, management and climate change to winter wheat yield in the North China Plain in the past three decades.European Journal of Agronomy, 52: 112-122.The detailed field experiment data from 1980 to 2009 at four stations in the North China Plain (NCP), together with a crop simulation model, were used to disentangle the relative contributions of cultivars renewal, fertilization management and climate change to winter wheat yield, as well as the relative impacts of different climate variables on winter wheat yield, in the past three decades. We found that during 1980–2009 cultivars renewal contributed to yield increase by 12.2–22.6%; fertilization management contributed to yield increase by 2.1–3.6%; and climate change contributed to yield generally by 613.0–3.0%, however by 6115.0% for rainfed wheat in southern part of the NCP. Modern cultivars and agronomic management played dominant roles in yield increase in the past three decades, nevertheless the estimated impacts of climate change on yield accounted for as large as 6123.8–25.0% of observed yield trends. During the study period, increase in temperature increased winter wheat yield by 3.0–6.0% in northern part of the NCP, however reduced rainfed winter wheat yield by 9.0–12.0% in southern part of the NCP. Decrease in solar radiation reduced wheat yield by 3.0–12.0% across the stations. The impact of precipitation change on winter wheat yield was slight because there were no pronounced trends in precipitation. Our findings highlight that modern cultivars and agronomic management contributed dominantly to yield increase in the past three decades, nevertheless the impacts of climate change were large enough in some areas to affect a significant portion of observed yield trends in the NCP.

DOI

[49]
Xiao J F, Zhou Y, Zhang L, 2015. Contributions of natural and human factors to increases in vegetation productivity in China.Ecosphere, 6(11): 1-20.Abstract Here we draw attention to the potential for pelagic bloom-forming cyanobacteria to have substantial effects on nutrient cycling and ecosystem resilience across a wide range of lakes. Specifically, we hypothesize that cyanobacterial blooms can influence lake nutrient cycling, resilience, and regime shifts by tapping into pools of nitrogen (N) and phosphorus (P) not usually accessible to phytoplankton. The ability of many cyanobacterial taxa to fix dissolved N2 gas is a well-known potential source of N, but some taxa can also access pools of P in sediments and bottom waters. Both of these nutrients can be released to the water column via leakage or mortality, thereby increasing nutrient availability for other phytoplankton and microbes. Moreover, cyanobacterial blooms are not restricted to high nutrient (eutrophic) lakes: blooms also occur in lakes with low nutrient concentrations, suggesting that changes in nutrient cycling and ecosystem resilience mediated by cyanobacteria could affect lakes across a gradient of nutrient concentrations. We used a simple model of coupled N and P cycles to explore the effects of cyanobacteria on nutrient dynamics and resilience. Consistent with our hypothesis, parameters reflecting cyanobacterial modification of N and P cycling alter the number, location, and/or stability of model equilibria. In particular, the model demonstrates that blooms of cyanobacteria in low-nutrient conditions can facilitate a shift to the high-nutrient state by reducing the resilience of the low-nutrient state. This suggests that cyanobacterial blooms warrant attention as potential drivers of the transition from a low-nutrient, clear-water regime to a high-nutrient, turbid-water regime, a prediction of particular concern given that such blooms are reported to be increasing in many regions of the world due in part to global climate change.

DOI

[50]
Xiao J F, Zhuang Q L, Law B Eet al., 2010. A continuous measure of gross primary production for the conterminous United States derived from MODIS and AmeriFlux data.Remote Sensing of Environment, 114(3): 576-591.The quantification of carbon fluxes between the terrestrial biosphere and the atmosphere is of scientific importance and also relevant to climate-policy making. Eddy covariance flux towers provide continuous measurements of ecosystem-level exchange of carbon dioxide spanning diurnal, synoptic, seasonal, and interannual time scales. However, these measurements only represent the fluxes at the scale of the tower footprint. Here we used remotely sensed data from the Moderate Resolution Imaging Spectroradiometer (MODIS) to upscale gross primary productivity (GPP) data from eddy covariance flux towers to the continental scale. We first combined GPP and MODIS data for 42 AmeriFlux towers encompassing a wide range of ecosystem and climate types to develop a predictive GPP model using a regression tree approach. The predictive model was trained using observed GPP over the period 2000–2004, and was validated using observed GPP over the period 2005–2006 and leave-one-out cross-validation. Our model predicted GPP fairly well at the site level. We then used the model to estimate GPP for each 1 km × 1 km cell across the U.S. for each 8-day interval over the period from February 2000 to December 2006 using MODIS data. Our GPP estimates provide a spatially and temporally continuous measure of gross primary production for the U.S. that is a highly constrained by eddy covariance flux data. Our study demonstrated that our empirical approach is effective for upscaling eddy flux GPP data to the continental scale and producing continuous GPP estimates across multiple biomes. With these estimates, we then examined the patterns, magnitude, and interannual variability of GPP. We estimated a gross carbon uptake between 6.91 and 7.33 Pg C yr 61 1 for the conterminous U.S. Drought, fires, and hurricanes reduced annual GPP at regional scales and could have a significant impact on the U.S. net ecosystem carbon exchange. The sources of the interannual variability of U.S. GPP were dominated by these extreme climate events and disturbances.

DOI

[51]
Xie G H, Han D Q, Wang X Yet al., 2011. Harvest index and residue factor of cereal crops in China.Journal of China Agricultural University, 16(1): 1-8. (in Chinese)Harvest index(HI) and residue factor(RF) are essentially significant for crop production research and crop residue quantity assessment.Data in this research were collected from original papers on cereals which were mainly published between 2006 and 2010 in the main production provinces of mainland China.Results indicated the average of HI and RF of rice were 0.50 and 1.00,respectively.In 16 provinces,HI of rice varied between 0.43 and 0.54 and RF between 0.85 and 1.33.The average of HI and RF of maize were 0.49 and 1.04,respectively.HI of maize varied between 0.42 and 0.53 and RF between 0.89 and 1.38 in 12 provinces.The average of HI and RF of wheat were 0.46 and 1.17,respectively.Wheat had HI with the range of 0.42 and 0.50 and RF 1.00 and 1.38 in 11 provinces.For the other cereal crops,the range of HI was 0.17 and 0.49,and RF 1.04 and 4.88.The HI of the cereals was significantly improved during the past 20 years.In the near future grain yield of cereals will be improved mainly through a substantial increase in biomass,instead of HI.

[52]
Zhang S H, Liu S X, Mo X Get al., 2010. Assessing the Impact of Climate Change on Reference Evapotranspiration in Aksu River Basin.Acta Geographica Sinica, 65(11): 1363-1370. (in Chinese)Evapotranspiration is one of the key components of hydrological processes.Assessing the impact of climate factors on reference evapotranspiration(RET) is helpful in understanding the impact of climate change on hydrological processes.In this paper,based on the daily meteorological data from 1960 to 2007 within and around Aksu River basin,RET was estimated with the FAO Penman-Monteith Method.The temporal and spatial variations of PET were analyzed by using ARCGIS.Multiple Regression Analysis was employed to differentiate the effects of the variations of air temperature,solar radiation,relative humidity,vapor pressure and wind speed on PET.The results showed that RET in the eastern plain area of Aksu River Basin was about 1100 mm,which was nearly twice as much as that in the western mountain area.

DOI

[53]
Zhang X Y, Chen S Y, Sun H Yet al., 2011. Changes in evapotranspiration over irrigated winter wheat and maize in North China Plain over three decades.Agricultural Water Management, 98(6): 1097-1104.Evapotranspiration (ET) is an important component of the water cycle at field, regional and global scales. This study used measured data from a 30-year irrigation experiment (1979–2009) in the North China Plain (NCP) on winter wheat ( Triticum aestivum L.) and summer maize ( Zea mays L.) to analyze the impacts of climatic factors and crop yield on ET. The results showed that grass reference evapotranspiration (ET o, calculated by FAO Penmen–Monteith method) was relatively constant from 1979 to 2009. However, the actual seasonal ET of winter wheat and maize under well-watered condition gradually increased from the 1980s to the 2000s. The mean seasonal ET was 401.4 mm, 417.3 mm and 458.6 mm for winter wheat, and 375.7 mm, 381.1 mm and 396.2 mm for maize in 1980s, 1990s and 2000s, respectively. The crop coefficient ( K c) was not constant and changed with the yield of the crops. The seasonal average K c of winter wheat was 0.75 in the 1980s, 0.81 in the 1990s and 0.85 in the 2000s, and the corresponding average grain yield (GY) was 4790 kg ha 611, 5501 kg ha 611 and 6685 kg ha 611. The average K c of maize was 0.88 in the 1980s, 0.88 in the 1990s and 0.94 in the 2000s, with a GY of 5054 kg ha 611, 7041 kg ha 611 and 7874 kg ha 611, respectively, for the three decades. The increase in ET was not in proportion to the increase in GY, resulting improved water use efficiency (WUE). The increase in ET was possibly related to the increase in leaf stomatal conductance with renewing in cultivars. The less increase in water use with more increase in grain production could be partly attributed to the significant increase in harvest index. The results showed that with new cultivars and improved management practices it was possible to further increase grain production without much increase in water use.

DOI

[54]
Zhang X Y, Wang S F, Sun H Yet al., 2013. Contribution of cultivar, fertilizer and weather to yield variation of winter wheat over three decades: A case study in the North China Plain.European Journal of Agronomy, 50: 52-59.Long-term field measured yield data provides good opportunity to assess the impacts of climate and management on crop production. This study used the yield results from a long-term field experiment (1979-2012) at Luancheng Experimental Station in the central part of the North China Plain (NCP) to analyze the seasonal yield variation of winter wheat (Triticum aestivum L.) under the condition of sufficient water supply. The yield change of winter wheat over the last 33 growing seasons was divided into three time periods: the 1980s, the 1990s, and the years of 2001-2012. The grain yield of winter wheat during the 1980s was relative stable. During the 1990s, the annual yield of this crop was continuously increased by 193 kg/ha/year (P < 0.01). While for the past 12 years, yield of winter wheat was maintained at relative higher level, but with larger seasonal yield variation than that back in 1980s. CERES-Wheat model was calibrated and was used to verify the effects of management practices on grain yield. Seven scenarios were simulated with and without improvements in management. The simulated results show that the yield of winter wheat was decreased by 5.3% during 1990s and by 9.2% during the recent 12 seasons, compared with that during 1980s, under the scenario that the yield of winter wheat was solely affected by weather. Seasonal yield variation caused by weather factors was around -39% to 20%, indicating the great effects of weather on yearly yield variation. Yield improvement by cultivars was around 24.7% during 1990s and 52.0% during the recent 12 seasons compared with that during 1980s. The yield improvement by the increase in soil fertility and chemical fertilizer input was 7.4% and 6.8% during the two periods, respectively. The initial higher soil fertility and chemical fertilizer input might be the reasons that the responses of crop production to the further increase in chemical fertilizer were small during the simulation period. Correlation analysis of the grain yield from the field measured data with weather factors showed that sunshine hours and diurnal temperature difference (DTR) were positively, and relative humidity was negatively related to grain yield of winter wheat. The climatic change trends in this area showed that the DTR and sunshine hours were declining. This type of climatic change trend might further negatively affect winter wheat production in the future. (c) 2013 Elsevier B.V. All rights reserved.

DOI

[55]
Zhang Y J, Xu M, Chen Het al., 2009. Global pattern of NPP to GPP ratio derived from MODIS data: Effects of ecosystem type, geographical location and climate.Global Ecology and Biogeography, 18(3): 280-290.ABSTRACT Aim68 To examine the global pattern of the net primary production (NPP)/gross primary production (GPP) ratio of the Earth's land area along geographical and climatic gradients. Location68 The global planetary ecosystem. Methods68 The 4-year average annual NPP/GPP ratio of the Earth's land area was calculated using 2000–03 Moderate Resolution Imaging Spectroradiometer (MODIS) data. The global pattern of the NPP/GPP ratio was investigated by comparing it among each typical terrestrial ecosystem and plotting it along a geographical and climatic gradient, including latitude, altitude, temperature and precipitation. Results68 The global terrestrial ecosystem had an average NPP/GPP ratio value of 0.52 with minor variation from 2000 to 2003. However, the NPP/GPP ratio showed considerable spatial variation associated with ecosystem type, geographical location and climate. Densely vegetated ecosystems had a lower NPP/GPP ratio than sparsely vegetated ecosystems. Forest ecosystems had a lower NPP/GPP ratio than shrub and herbaceous ecosystems. Geographically, the NPP/GPP ratio increased with altitude. In the Southern Hemisphere, the NPP/GPP ratio decreased along latitude from 30° to 10° and it exhibited high fluctuation in the Northern Hemisphere. Climatically, the NPP/GPP ratio exhibited a decreasing trend along enhanced precipitation when it was less than 2300mm year 611 and a static trend when the annual precipitation was over 2300mm. The NPP/GPP ratio showed a decreasing trend along temperature when it was between –20°C and 10°C, and showed an increasing trend along rising temperature when it was between –10°C and 20°C. Within each ecosystem, the NPP/GPP ratio revealed a similar trend to the global trend along temperature and precipitation. Conclusions68 The NPP/GPP ratio exhibited a pattern depending on the main climatic characteristics such as temperature and precipitation and geographical factors such as latitude and altitude. The findings of this research challenge the widely held assumption that the NPP/GPP ratio is consistent regardless of ecosystem type.

DOI

[56]
Zhang Y L, Song C H, Sun Get al., 2016. Development of a coupled carbon and water model for estimating global gross primary productivity and evapotranspiration based on eddy flux and remote sensing data.Agricultural and Forest Meteorology, 223: 116-131.Terrestrial gross primary productivity (GPP) and evapotranspiration (ET) are two key ecosystem fluxes in the global carbon and water cycles. As carbon and water fluxes are inherently linked, knowing one provides information for the other. However, tightly coupled and easy to use ecosystem models are rare and there are still large uncertainties in global carbon and water flux estimates. In this study, we developed a new monthly coupled carbon and water (CCW) model. GPP was estimated based on the light-use efficiency (LUE) theory that considered the effect of diffuse radiation, while ET was modeled based on GPP and water-use efficiency (WUE). We evaluated the non-linear effect of single (GPPOR) or combined (GPPAND) limitations of temperature and vapor pressure deficit on GPP. We further compared the effects of three types of WUE (i.e., WUE, inherent WUE, and underlying WUE) on ET (i.e., ETWUE, ETIWUEand ETUWUE). CCW was calibrated and validated using global eddy covariance measurement from FLUXNET and remote sensing data from Moderate Resolution Imaging Spectroradiometer (MODIS) from 2000 to 2007. Modeled GPPANDand GPPORexplained 67.3% and 66.8% of variations of tower-derived GPP, respectively, while ETUWUE, ETIWUEand ETWUEexplained 65.7%, 59.9% and 58.1% of tower-measured ET, respectively. Consequently, we chose GPPANDand ETUWUEas the best modeling framework for CCW, and estimated global GPP as 134.2PgCyr611and ET as 57.0×10³km3for vegetated areas in 2001. Global ET estimated by CCW compared favorably with MODIS ET (60.5×10³km3) and ET derived from global precipitation (56.5×10³km3). However, global GPP estimated by CCW was about 19% higher than MODIS GPP (109.0PgCyr611). The mean global WUE value estimated by CCW (2.35gCkg611H2O) was close to the mean tower-based WUE (2.60gCkg611H2O), but was much higher than the WUE derived from MODIS products (1.80gCkg611H2O). We concluded that the new simple CCW model provided improved estimates of GPP and ET. The biome-specific parameters derived in this study allow CCW to be further linked with land use change models to project human impacts on terrestrial ecosystem functions.

DOI

[57]
Zhang Y Q, Yu Q, Jiang Jet al., 2008. Calibration of Terra/MODIS gross primary production over an irrigated cropland on the North China Plain and an alpine meadow on the Tibetan Plateau.Global Change Biology, 14(4): 757-767.This paper evaluated the MODerate resolution Imaging Spectroradiometer (MODIS) gross primary production (GPP) product (MOD17) by using estimated GPP from eddy-covariance flux measurements over an irrigated winter wheat and maize double-cropping field on the North China Plain in 2003-2004, and an alpine meadow on the Tibetan Plateau in 2002-2003. The mean annual GPP from MOD17 accounted for 1/2-2/3 of the surface estimated mean annual GPP for the alpine meadow, but only about 1/5-1/3 for the cropland. This underestimation was partly attributed to low estimates of leaf area index by a MODIS product (MOD15) because it is used to calculate absorbed photosynthetically active radiation in the MOD17 algorithm. The main reason is that the parameter maximum light use efficiency (epsilon(max)) in the MOD17 algorithm was underestimated for the two biomes, especially for the cropland. Contrasted to the default, epsilon(max) was optimized using surface measurements. The optimized epsilon(max) for winter wheat, maize and meadow was 1.18, 1.81 and 0.73 g C/MJ, respectively. By using the surface measurements and optimized epsilon(max) , the MOD17 algorithm significantly improved the accuracy of GPP estimates. The optimum MOD17 algorithm explained about 82%, 68%, and 79% of GPP variance for winter wheat, maize, and meadow, respectively. These results suggest that it is necessary to adjust the MOD17 parameters for the estimation of cropland and meadow GPP, particularly over cropland.

DOI

[58]
Zhu X J, Yu G R, Hu Z Met al., 2015. Spatiotemporal variations of T/ET (the ratio of transpiration to evapotranspiration) in three forests of eastern China.Ecological Indicators, 52: 411-421.Evapotranspiration (ET), which is comprised by evaporation from soil surface (E), transpiration (T) and evaporation from the intercepted water by canopy (EI), plays an important role in maintaining global energy balance and regulating climate. Quantifying the spatiotemporal variations of T/ET (the ratio of T to ET) can improve our understandings on the role of vegetation ecophysiological processes in climate regulation. Using eddy covariance measurements at three forest ecosystems (Changbaishan temperate broad-leaved Korean pine mixed forest (CBS), Qianyanzhou subtropical coniferous plantation (QYZ) and Dinghushan subtropical evergreen mixed forest (DHS)) in north–south transect of Eastern China (NSTEC), we run the revised Shuttleworth–Wallace model (S–W model), validated its performance with the water vapor fluxes measured at two layers, and quantified the spatiotemporal variations of T/ET. The S–W model performed well in simulating ET and T/ET. The mean value of annual T/ET at three forests during the observation period all exceeded 0.6. The diurnal variation of canopy stomal conductance (Gc) dominated that of T/ET. The seasonal dynamics of T/ET was mainly shaped by that of leaf area index (LAI), vapor pressure deficit (VPD) and air temperature (Ta) through altering Gc and the portion that the energy absorbed by canopy (PEC) at temperate forest (CBS), while the seasonal dynamics of T/ET at subtropical forests (QYZ and DHS) were mainly affected by Ta, net radiation, VPD, and soil water content through altering Gc and soil surface conductance (Gs). The variation of mean annual Gc governed the interannual varaition and spatial variation of T/ET. Therefore, forests in Eastern China played an important role in regulating climate through T and Gc primarily affected the spatial and temproal variations of the role of forest T in regulating climate.

DOI

Outlines

/