Orginal Article

Evolution and spatial characteristics of tourism field strength of cities linked by high-speed rail (HSR) network in China

  • WANG Degen , 1 ,
  • NIU Yu 2 ,
  • SUN Feng 3, * ,
  • WANG Kaiyong , 4 ,
  • QIAN Jia 3 ,
  • LI Feng 3
Expand
  • 1. School of Architecture, Soochow University, Suzhou 215123, Jiangsu, China
  • 2. Department of Tourism, Recreation and Sport Management, University of Florida, Gainesville Florida 32611,USA
  • 3. Tourism Department of Soochow University, Suzhou 215123, Jiangsu, China
  • 4. Institute of Geographic Sciences and Natural Resources Research, CAS, Beijing 100101, China

Author: Wang Degen (1973-), PhD and Professor, specialized in high-speed rail tourism and urban tourism. E-mail:

*Corresponding author: Wang Kaiyong (1980-), E-mail:

Received date: 2016-11-03

  Accepted date: 2016-12-23

  Online published: 2017-07-10

Supported by

National Natural Science Foundation of China, No.41271134

Copyright

Journal of Geographical Sciences, All Rights Reserved

Abstract

Traffic is an indispensable prerequisite for a tourism system. The “four vertical and four horizontal” HSR network represents an important milestone of the “traffic revolution” in China. It will affect the spatial pattern of tourism accessibility in Chinese cities, thus substantially increasing their power to attract tourists and their radiation force. This paper examines the evolution and spatial characteristics of the power to attract tourism of cities linked by China’s HSR network by measuring the influence of accessibility of 338 HSR-linked cities using GIS analysis. The results show the following. (1) The accessibility of Chinese cities is optimized by the HSR network, whose spatial pattern of accessibility exhibits an obvious traffic direction and causes a high-speed rail-corridor effect. (2) The spatial pattern of tourism field strength in Chinese cities exhibits the dual characteristics of multi-center annular divergence and dendritic diffusion. Dendritic diffusion is particularly more obvious along the HSR line. The change rate of urban tourism field strength forms a high-value corridor along the HSR line and exhibits a spatial pattern of decreasing area from the center to the outer limit along the HSR line. (3) The influence of the higher and highest tourism field strength areas along the HSR line is most significant, and the number of cities that distribute into these two types of tourism field strengths significantly increases: their area expands by more than 100%. HSR enhances the tourism field strength value of regional central cities, and the radiation range of tourism attraction extends along the HSR line.

Cite this article

WANG Degen , NIU Yu , SUN Feng , WANG Kaiyong , QIAN Jia , LI Feng . Evolution and spatial characteristics of tourism field strength of cities linked by high-speed rail (HSR) network in China[J]. Journal of Geographical Sciences, 2017 , 27(7) : 835 -856 . DOI: 10. 1007/s11442-017-1409-1

1 Introduction

Traffic determines the strength and breadth of the spatial interaction of the society and economy and is one of the most important factors that can change social and economic activities. Fully grasping the impact of traffic factors on economic activities is of substantial significance for understanding the spatial pattern of economic phenomena (Li, 1999). Traffic is an indispensable prerequisite for tourism economic activities and plays an important role in the development of new and existing tourism areas (Prideaux, 2000; Kaul, 1985). Thus, traffic has become an important part of the tourism system, similar to a bridge between a tourist destination and a tourist origin area (Leiper, 1900). Transportation technology breakthroughs and transportation mode reform always profoundly affect the development of regional tourism and the evolution of the tourism spatial pattern. From the avenues and carriages of the Roman era, to steam-driven trains and cars, to the aircraft of the present, tourists have always found means to move faster and further and can now reach any corner of the earth. Technological advances of this nature have promoted the development of international and domestic tourism as well as both land and island tourism (Gilbert, 1939; Nelson and Wall, 1986; Prideaux, 1993).
High-speed rail (HSR) is fast, safe, comfortable and efficient and produces a significant space-time compression effect. They represent the most effective way of providing rapid transport for large numbers of passengers in large channels and have become an important symbol of the traffic revolution in modern times. Generally, spatial distance and traffic accessibility are the primary factors that influence the tourist’s choice of destination, whereby spatial distance represents the main obstacle (Chew, 1987; Abeyratne, 1993). Because of the HSR space-time compression effect, the spatial distance between a tourist’s destination and the origin or his or her journey has been substantially decreased. It is no longer the most important factor that affects the tourist’s travel choices (Wang et al., 2015). Under a constant temporal distance, spatial distance has gradually increased. Subsequently, the tourist travel radius has gradually increased, which has promoted the growth of tourist traffic. The opening of the European Perpignan-Barcelona HSR link significantly decreased travel time and increased the number of mutual short-distance tourist visits between the two cities (Sophie and Romain, 2009). Since the high-speed Sanyo Shinkansen in Japan opened, the number of tourists to Okayama has increased at a steady rate every year. The opening of the Nagano Shinkansen substantially increased the flow of tourists to Karuizawa Station. During the first year of the service, tourism traffic increased by 50% over the previous year (Chen, 2011). After the Beijing-Shanghai HSR and the Wuhan-Guangzhou HSR opened, the AR value of the tourist market radius in Wuhan, Jinan, and other cities expanded by 265.84 km and 325.39 km, respectively, compared to the pre-HSR period. The respective expansion rates were 56.79% and 60.48% (Wang, 2013a). The Zhouzhong-Xi’an HSR has expanded the scale of the Xi’an tourism market and optimized the market’s structure (Yin, 2012). Clearly, the HSR space-time compression effect improves the attractiveness of the tourism market and plays a significant role in promoting the growth of tourism market demand. It also exerts a clustering effect on HSR passengers (Wang et al., 2014). Additionally, HSR has strengthened the polarization effect of passenger flow in the core region while simultaneously enhancing the traffic diffusion effect from the core region to the edge area, which is termed the passenger spillover effect (Wang and Zou, 2010). The Wuhan-Guangzhou HSR has improved the core status of Wuhan in Hubei, strengthened the diffusion of the core cities, and enhanced the links between the core cities and the edge cities. A substantial flow of HSR tourists has spread from the core city Wuhan to edge cities, including Yichang and Shiyan, and narrowed the tourism development gap in the edge region (Wang, 2013b). After the Beijing-Shanghai HSR opened, endpoint cities, such as Beijing and Shanghai, and transit cities, such as Jinan and Nanjing, have benefited from the advantages of regional conditions, the tourism resources endowment, tourism reception capacity, traffic network density and the obvious space-time compression. All of these factors have combined to strengthen the attraction of these destinations in tourist origin areas and increased the tourism flow. The HSR tourist flow has yet to spread to edge tourist destinations, which indicates the existence of a concentration-diffusion pattern (Wang, 2015).
HSR plays an important role not only in promoting the tourism attractiveness of individual cities but also in expanding the radiation range of metropolitan areas and urban agglomerations. Since the opening of the Wuhan-Guangzhou HSR, more than half of the cities served by the line are in the range of one-day tours from core cities in Wuhan, Changsha- Zhuzhou-Xiangtan (Chang-Zhu-Tan) and the Pearl River Delta metropolitan area. Before the HSR, fewer than half these cities were accessible for one-day visitors. The core cities are only 4-5 h from the farthest city in the 3 metropolitan areas in the HSR network. Thus, compared with the 10 or more hours required pre-HSR, space-time compression has been realized (Wang, 2014). The “Hour tourism circle” has created the regional One City and the Guangzhou-Changsha-Wuhan tourism economic zone (Liang, 2010). With the HSR network, the one-day communication circle of 5 major metropolitan cities (e.g., Shanghai, Hangzhou, Nanjing, Xuzhou and Hefei) covers nearly 100% of the Yangtze River Delta (Wang and Zhang, 2015). Particularly in the Beijing-Tianjin-Hebei metropolitan area, the number of the “flowing” (i.e., visiting) urban population is increasing and displays a significant One-City effect (Wu and Fang, 2013). Therefore, the HSR space-time compression effect shortens the time distance among the core cities and the inner cities of metropolitan areas, and the radiation range of metropolitan areas is expanded. HSR has strengthened the development of social, economic, and cultural exchanges and tourism activities in the various metropolitan areas, the core cities, between core cities and edge cities and within edge cities. In addition, it has improved the core-edge development model and realized the integration of metropolitan areas and the goal of balanced development.
In sum, HSR’s space-time compression effect has enhanced the tourism attractiveness and radiation force of urban areas. However, the cited research only examines single high-speed lines (such as the Beijing-Shanghai HSR, the Wuhan-Guangzhou HSR and the Zhengzhou-Xi’an HSR) or regional intercity HSR networks (such as that of the Yangtze River Delta region) that belong to the micro or middle level. There is no in-depth study on the characteristics and evolution of the spatial pattern of national urban tourism attraction on the macro level. China’s HSR has developed rapidly. Since the opening of the Beijing-Tianjin line in August 2008, which marked China’s entry into the HSR era, China’s HSR mileage had reached 12,000 kilometers by the end of 2014, which ranks the world’s first. By 2020, the HSR mileage that can be traveled at speeds of 200 kilometers per hour and more will exceed 18,000 kilometers and account for more than 50% of such mileage worldwide. According to the new HSR construction target of the 13th Five-Year Development Plan, China’s national HSR mileage will reach 30,000 kilometers by 2020 and link more than 80% of the nation’s large cities. By then, China will have completed the “four vertical and four horizontal” HSR network of rapid passenger trains and 5 intercity passenger transport systems. China will have fully entered the HSR network era. In such an era, what will be the impact of HSR on urban accessibility and the spatial pattern of isochronous rings on the national level? In addition, what impact will HSR have on the spatial pattern of national urban tourism attractiveness? To investigate these questions, this paper adopts China’s 338 prefecture administrative units as objects. First, principal component analysis and ArcGIS spatial analysis are used to measure the comprehensive scale value and the spatial characteristics and evolution of urban accessibility and the isochronous rings of the HSR and non-HSR networks. Second, the field strength model is used to calculate the spatial pattern characteristics and the evolution of national urban tourism attraction under non-HSR and HSR network scenarios. Finally, using ArcGIS’s zonal statistics analysis and the natural fracture point method, national urban tourism attraction is divided into 5 major categories of tourism field strength, whose spatial pattern characteristics and evolution with non-HSR and HSR networks are analyzed. Thus, in this paper, we can clarify the characteristics and changing rules of national urban tourism attraction under the effect of the HSR network and establish a foundation for constructing the urban tourism level system in a manner that 1) optimizes tourism resource distribution; 2) creates new products, formats and models; and 3) achieves the goal of China’s transformation while raising tourism development to a new level. Second, the paper will provide a meaningful reference for the study of HSR’s impact on the spatial pattern of tourism in a large-scale (e.g., international) region.

2 Research and design

2.1 Definition of research object

The research object of this paper is primarily China’s local-level administrative units, including prefecture-level cities, prefectures, autonomous prefectures and leagues. Because the four municipalities of Beijing, Tianjin, Shanghai and Chongqing are administrative units, they are also included as research objects. Prefectures (such as Aksu Prefecture), autonomous prefectures (such as Qiandongnan Miao and Dong Autonomous Prefecture) and leagues (such as Xilin Gol League) where prefectural governments are seated are considered research objects. Only Haikou and Sanya in Hainan Province are prefecture-level cities. The remainder are counties under the jurisdiction of the province, for which exclusive data are difficult to obtain. Therefore, they are merged into an area directly under the province in this study, and its regional center is taken as a node. Similarly, the cities of Tianmen, Qianjiang and Xiantao in Hubei Province are actually counties under the jurisdiction of the province and are thus merged into an area directly under the province, whose regional center is taken as a node. Although the Shennongjia forest region is a county under the jurisdiction of the province, it is distant from the abovementioned three 3 cities and is thus incorporated into the nearby city of Shiyan. Sansha in Hainan Province lacks corresponding data because it was established only in 2012. Therefore, it is not included in the study. Because the research objects include municipalities, prefecture-level cities, prefectures, autonomous prefectures and leagues, to simplify the presentation, all are referred to as “city” in the analysis. In addition, this study only considers the mainland of China. Hong Kong, Macao and Taiwan are excluded. Therefore, the research object of this paper consists of 338 cities.

2.2 Data sources and processing

2.2.1 Economic data
The economic attribute data are from the 2013 China Regional Economic Statistical Yearbook, China Tourism Statistical Yearbook and the statistical yearbooks of various provinces and cities. A small number of statistical data are from the urban statistical bulletins of national economic and social development.
2.2.2 Graphic data
In this study, the Desktop9.3 ArcGIS software is used. The vector data for spatial administrative boundaries are based on the 1:4,000,000 basic geographic information data provided by the National Foundation Geographic Information Center. The city point locations are marked on an ArcMap working map. Their exact coordinates were determined using Google Earth. Stream and road data (including ordinary railways, highways, and national and provincial roads) are drawn from the Ministry of Communications 1:4,000,000 Road Traffic Edition map and the 1:4,000,000 Basic Elements Edition map. The HSR data are in accordance with the opening of the HSR system and Middle and Long-Term Railway Network Planning (2020) and stored in the geographic information database through manual digitization (using the Beijing 1954 coordinate projection system) to create a base map of the HSR and national transportation network (Figure 1).
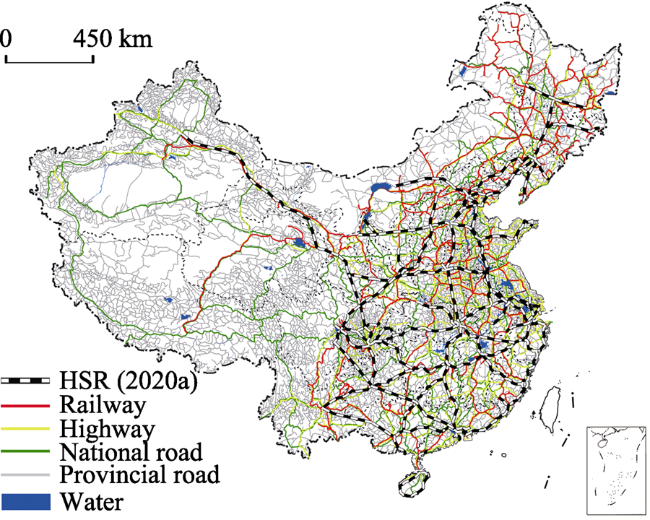
Figure 1 Traffic network distribution with the HSR network in China

2.3 Research method

2.3.1 Calculation of the comprehensive scale index of urban tourism
This paper uses principal component analysis to calculate a comprehensive scale index of urban tourism. First, we create a comprehensive evaluation index of urban tourism. Based on the principles of systematicality, comparability, comprehensiveness and operability, 16 indicators were selected to measure the comprehensive scale index of the national prefecture-level cities based on the cities’ tourism economic development (i.e., tourism resources endowment-X1, the number of inbound tourists-X2/104 persons, the number of domestic tourists-X3/104 persons, foreign exchange income of inbound tourists-X4/104 dollars, domestic tourism revenue-X5/108 yuan), tourism reception capacity (i.e., the number of starred hotels-X6, industry turnover for accommodation and catering-X7/108 yuan, the number of tertiary-industry employees-X8/104 persons, total passenger volume-X9/104 persons), urban economic development (i.e., GDP-X10/108 yuan, tertiary industry GDP-X11/108 yuan, regional fiscal revenue-X12/108 yuan, gross fixed asset investment-X13/108 yuan) and urban social development (i.e., population-X14/104 persons, disposable income per capita-X15/yuan, highway mileage-X16/km). Among these indicators, tourism resource endowment is a statistic that expresses each city’s world-heritage status, the number of national-level scenic spots and places of tourist interest as well as that of 5A and 4A-level scenic spots. A city is assigned 10 points, 8 points, 6 points or 4 points according to its resource level. When the resource has more than one level definition, the highest rank is awarded. Finally, the total tourism resource score is obtained. To ensure that the data of the entire index system are accurate and simple and to optimize the measurement analysis, the two indicators disposable income per capita and total passenger volume were excluded. Ultimately, the 14 indicators were determined by measuring the indexes’ correlation.
Second, regarding data standardization, to overcome the influence of quantities and dimensions and avoid the negative value of the standardization, the original data were normalized using the average standard method:
${{M}_{ij}}=\frac{{{X}_{ij}}}{\frac{1}{n}\sum\limits_{i=1}^{n}{{{X}_{ij}}}}$ (1)
where Mij and Xij represent the new value after standardization and the original statistical value, of index j of city i (n=14).
Third, regarding the measurement of comprehensive scale, SPSS21. 0 statistical software was used to analyze the main components of the standardization data. Using the Bartlett ball test, the free degree is 91, the chi square approximation is 8506.371 and the accompanying probability is 0 and less than 0.001. These outcomes indicate that the selected factors have a correlation, and the KMO coefficient is 0.856. Therefore, the data in this study are suitable for factor analysis. After extracting principal component factors with eigenvalues greater than 1, the variance contribution rate of the first 3 principal components were 62.93%, 12.56% and 9.70%, respectively, and the cumulative contribution rate reached 85.19%, which means that 85.19% of the information of the original indicators is retained. The three eigenvalues were 8.810, 1.758 and 1.358, respectively. Therefore, 3 common factors are extracted.
Finally, the following formula was used to calculate the comprehensive scale value of urban tourism:
${{Z}_{i}}=\sum\limits_{k=1}^{m}{\left[ {{A}_{k}}\times \left( {{C}_{kj}}\times {{M}_{ij}} \right) \right]}$ (2)
where Zi is the comprehensive strength value of city i, m is the main component whose eigenvalue is greater than 1, m=3 in this paper, and K is the principal component number and equal to 3. Ak is the contribution rate of the main component K, Ckj is the load of principal component K on index j. N is the index number used, in the evaluation and Mij is the standardization value of index j of city i.
2.3.2 Estimation of urban accessibility and extraction of the shortest time distance
(1) Evaluation index selection
Spatial distance and temporal distance are the two elements of transportation cost, and the time required to reach the same spatial unit can differ based on the real geographic environment. Therefore, temporal distance is more suitable to reflect the degree of traffic convenience. In the study of the influence of the evolution of transportation infrastructure on regional accessibility, the weighted average travel-time index is used by many scholars both in China and abroad to evaluate the importance of destination nodes (Dodgson, 1974; Javier, 2001; Zhang and Yang, 1991). Therefore, this paper uses the weighted average travel time based on the shortest travel time to measure the characteristics of the development of national cities under non-HSR and HSR network scenarios.
The calculation formula for weighted average travel time Ai is as follows:
${{A}_{i}}=\frac{\sum\limits_{j=1}^{n}{\left( {{T}_{ij}}\times {{M}_{j}} \right)}}{\sum\limits_{j=1}^{n}{{{M}_{j}}}}$ (3)
where Ai is the reachability of node i, Tij is the shortest travel time from node i to node j, Mj is the center quality of node j, ${{M}_{j}}=\sqrt{GDP\times POUP}$, GDP is regional gross domestic product and POUP is population.
(2) Data processing
The cost-weighted distance method based on raster data is used in this study. Using the ArcGIS spatial analysis module to measure accessibility, the spatial pattern visualization of accessibility is achieved through the reclassification and raster calculator. The selected grid size is 1 km*1 km of the original vector raster map, and the entire research area is divided into 9,450,543 homogeneous grids.
The traffic speed of all types of traffic mode in HSR and non-HSR networks is established, and the corresponding time cost value is assigned for each grid. “Highway” includes freeway, national roads and provincial roads. The road speed is set according to People’s Republic of China Highway Engineering Technical Standards (JTGB01-2003) in combination with the density and quality of the national road network as follows: freeway, 120 km/h; national road, 80 km/h; provincial road, 60 km/h. The land is assumed to be homogeneous, and its speed is set at 5 km/h based on the walking pattern. Water transport requires more time than land, and its average speed is set at 1 km/h (Pan et al., 2014). Railways are divided into ordinary railway and HSR. Motor train units and express trains are unified as ordinary railway, and their speed is set at 160 km/h. The speed of HSR is set based on the different train levels and ranges from 200-300 km/h (Table 1).
Table 1 Time cost of different types of transportation mode and land use
Spatial object Highway National road Provincial road Water Railway HSR Land
Speed (km/h) 120 80 60 1 160 200 250 300 5
Time cost (min) 0.5 0.75 1 60 0.375 0.3 0.24 0.2 12
According to the cost value, after extracting the spatial elements from the basic database, a cost field is added in the attribute table of each vector layer to storage time cost. Time cost is the average time required to travel 1 km (in minutes). The formula is as follows:
$\cos t=\frac{1}{v}\times 60$ (4)
After vector data are converted to raster data, the cost value is the value of the raster data. The raster data time cost is added to obtain the time cost raster map of a spatial object for the HSR and non-HSR networks (Figure 2).
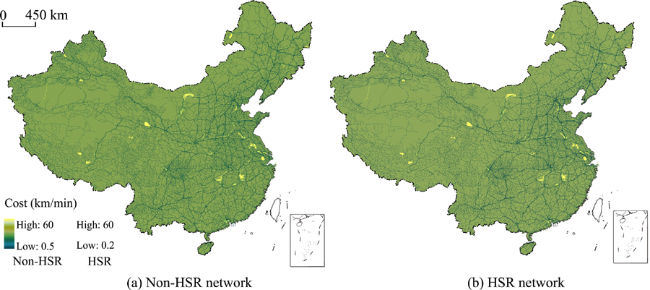
Figure 2 Cost grid of roads with and without the HSR network in China
Taking 338 cities as source points, the cost-weighted distance of the ArcGIS spatial analysis module is used to obtain the spatial diffusion pattern of urban accessibility for the HSR and non-HSR networks. Then, the accessibility value between cities is extracted. The specific methods and steps are as follows: a single city + accessibility cost map → accessibility spatial distribution map → temporal distance of the city from other cities.
2.3.3 Urban tourism field strength measurement based on improved field model
A city’s strength is measured by a single indicator in the traditional field strength model, whereby the ideal space should be considered. Thus, it is difficult to fully reflect the pattern of the urban hinterland of a central city using the spatial distance measurement (Yang, 2011). Therefore, this paper uses the improved field strength model to calculate a national city’s tourism field strength for the HSR and non-HSR networks. Instead of the traditional field model, an improved field strength model is used to calculate the tourism field strength by constructing a comprehensive scale value of urban tourism and measuring regional accessibility. The formula is as follows:
${{F}_{ki}}={{{Z}_{k}}}/{D_{ki}^{\alpha }}\;$ (5)
where Fki is the tourism field strength of point i of city k, Zk is the tourism influence index of city k, Dki is the Euclidean distance from city k to i and α is the coefficient of distance friction and generally equal to 1 (Wang et al., 2011). Dki is calculated using the GIS cost- weighted distance method to calculate the shortest distance.
The ArcGIS9.3 raster calculator is used to calculate the comprehensive scale parameters of urban tourism and the corresponding shortest distances of the raster map for the HSR and non-HSR networks. According to the principle of adopting the larger field strength, the method of spatial overlay analysis is used to add the maximum value and then to obtain the overall spatial pattern of urban tourism field strength for the HSR and non-HSR networks.

3 Research results

3.1 Urban tourism comprehensive scale characteristics

The range of the tourism comprehensive scale is significant. The maximum and minimum sizes of the tourism comprehensive scale are represented by Beijing (161.06) and Guoluo (0.07). The former is 160.99 greater than and 2301 times of the latter. If the urban tourism comprehensive scale top 20 and bottom 20 entries are analyzed, we find the following (Table 2). The top 20 cities primarily include municipalities (e.g., Shanghai, Chongqing and Beijing), capital cities (e.g., Guangzhou, Hangzhou, Chengdu, Wuhan, Nanjing, Tianjin, Shenyang, Xi’an, Changsha and Zhengzhou), and the economically developed cities of the Yangtze River Delta and the Pearl River Delta. The cities ranked in the last 20 positions are primarily cities in the northwest region, including Tibet, Gansu, Qinghai, Ningxia and Xinjiang, and cities of Inner Mongolia and Heilongjiang.
Table 2 First and last 20 cities of the tourism comprehensive scale
First 20 Last 20
City Zi City Zi City Zi City Zi
Beijing 161.06 Wuhan 25.15 Guoluo 0.07 Ali 0.52
Shanghai 76.62 Nanjing 23.72 Huangnan 0.20 Shannan 0.65
Guangzhou 56.23 Qingdao 19.84 Yushu 0.21 Nujiang River 0.65
Shenzhen 53.58 Dalian 19.32 Kertz 0.24 Alashan 0.68
Chongqing 50.20 Shenyang 18.44 Haibei 0.33 Wuzhong 0.69
Tianjin 35.26 Ningbo 18.42 Jinchang 0.37 Hotan 0.71
Suzhou 32.90 Xian 18.06 Qitaihe 0.47 Zhongwei 0.74
Hangzhou 32.79 Changsha 18.03 Greater Hinggan Range 0.47 Guyuan 0.74
Zhuhai 29.28 Wuxi 18.01 Hainan(zhou) 0.49 Jiayuguan 0.75
Chengdu 26.41 Zhengzhou 16.35 Changdu 0.50 Bortala 0.76

3.2 Characteristics and evolution of urban accessibility in China with the HSR network

3.2.1 Characteristics and evolution of the spatial pattern of urban accessibility in China with the HSR network
Figure 3a shows that the spatial pattern of urban accessibility in China with a non-HSR network presents a core-periphery model centered on the Central Plains region, which gradually decreases in regular circles to the west and northeast. The regional weighted average travel time of prefecture-level cities is 21. 23 h. Most areas of Henan, Hubei, Anhui, and Shandong provinces and a small part of Shanxi, Jiangsu and Hebei provinces constitute the country’s central region, where the weighted average travel time value is less than 10 h. A weighted average travel time of over 40 h occurs in the edge region, primarily in southwest Xinjiang and northwest Tibet.
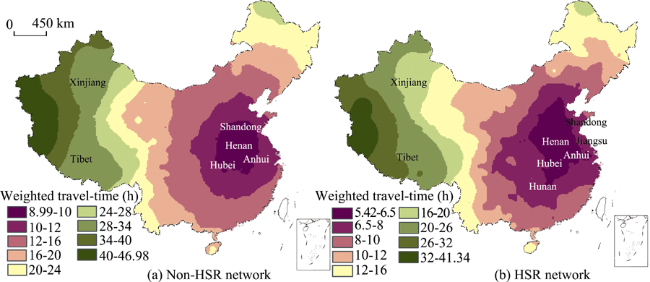
Figure 3 Overall spatial pattern of accessibility of cities with and without the HSR network in China
With the HSR network, the national spatial pattern of urban accessibility continues to present a core-periphery model. The accessibility value gradually increases from the central area to the periphery. However, the spatial pattern of urban accessibility exhibits an obvious
traffic direction under the HSR network scenario. The spatial pattern extends along the HSR line and forms a high-speed rail-corridor effect, which is visible as an irregular ring pattern (Figure 3b). National urban accessibility is optimized, and the overall weighted average time is 14.37 h, which is optimized by 6.86 h compared to that of the non-HSR network. Here, the low-value region of accessibility is significantly increased. In addition to the low-value region with the HSR network, certain areas of Hunan and Jiangsu expand into the central part of the country, where the weighted travel time values are less than 6.5 h. The spatial distribution pattern of highly weighted travel time is similar with and without HSR, primarily in southwest Xinjiang and northwest Tibet, where the weighted travel time value is over 32 h and only slightly less than without HSR.
3.2.2 Characteristics and evolution of the spatial pattern of urban isochronous rings with the HSR network
The isochronous rings reflect the close relationship of central cities and adjacent areas. The 338 cities are used as the source points, and the spatial diffusion pattern of isochronous rings of cities with and without the HSR network is obtained using the cost-weighted distance module of ArcGIS spatial analysis. The isochronous rings of the cities are divided into 13 fragments of 0.5 h, 1 h, 1.5 h, 2 h, 2.5 h, 3 h, 6 h, 10 h, 15 h, 20 h, 25 h, 30 h and >30 h (Figure 4). Figure 4 shows that the spatial pattern of national isochronous rings is point-axis progressive and extends radially from a city’s center to the outer traffic line. The traffic line includes railways, highways, and national and provincial roads. Based on the spatial distribution, the spatial pattern of the urban isochronous rings is highly consistent with the with-HSR and without-HSR scenarios. Good urban accessibility is primarily distributed in Northeast China, southern North China, Central China, East China, eastern Southwest China and South China. Cities in the north of North China, most of Southwest China and Northwest China have poor accessibility.
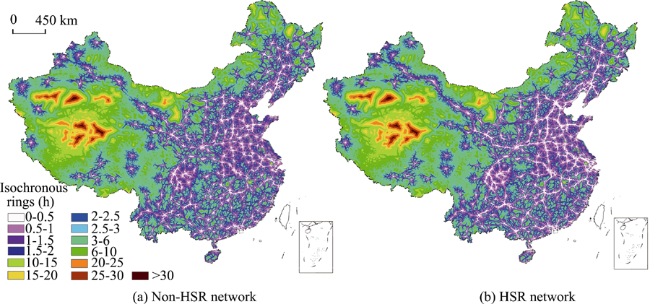
Figure 4 Distribution of isochronous ringsof cities with and without the HSR network in China
To further analyze the influence of HSR on the isochronous rings, the area and change rate of the isochronous rings for the HSR and non-HSR networks were calculated (Table 3). First, with HSR, the isochronous ring of 0-1 h increases, where the 0-0. 5 h area is most significant, expanding from 470,327 km2 to 345,868 km2 (35.98%). The degree of change of the 0.5-1 h area is also obvious, expanding from 950, 462 km2 to 884396 km2. The change rate is 7.47%. Second, the 1.5-10 h area decreases 24.07%. HSR decreases the isochronous ring area of 1.5-10 h, and the degree of reduction is larger. The isochronous rings of 1.5-2 h, 2-2.5 h, 2.5-3 h, 3-6 h and 6-10 h are reduced by 2.61%, 3.66%, 3.57%, 2.91% and 1.39%, respectively. Third, the isochronous rings of 1-1.5 h and 12 h or more are slightly but not significantly reduced. The decrease in the isochronous ring areas of 1-1. 5 h, 10-15 h, 15-20 h, 20-25 h and 25-30 h are unremarkable, only decreasing by 0.64%, 0.78%, 0.72%, 0.47% and 0.48%, respectively, and all less than 1%. Finally, there is no change in the area of 30 h or more.
Table 3 Area and change rate of isochronous rings with and without the HSR network
Isochronous rings (h) Non-HSR
(km2)
HSR
(km2)
Change rate
(%)
Isochronous rings (h) Non-HSR
(km2)
HSR
(km2)
Change rate
(%)
0-0.5 345868 470327 35.98 6-10 1278643 1260835 -1.39
0.5-1 884396 950462 7.47 10-15 582401 577868 -0.78
1-1.5 1003070 998255 -0.48 15-20 265217 263301 -0.72
1.5-2 929261 904988 -2.61 20-25 135743 135100 -0.47
2-2.5 824206 794014 -3.66 25-30 51301 50975 -0.64
2.5-3 723282 697495 -3.57 >30 8692 8692 0.00
3-6 2748062 2667989 -2.91

3.3 Spatial characteristics and evolution of the national urban tourism field strength with the HSR network

3.3.1 Spatial pattern of urban tourism field strength with and without the HSR network in China
The overall distribution of urban tourism field strength in China presents the characteristics of multi-center annular divergence with the HSR network (Figure 5a). The Beijing-Tianjin- Hebei urban agglomeration with the centers of Beijing and Tianjin is a primary core area of national tourism field strength. Its tourism field strength is the largest and has a far-reaching influence whose high-value area forms an interconnected region that extends to Inner Mongolia, Liaoning, Shanxi, Henan and Shandong provinces and beyond. The Yangtze River Delta urban agglomeration with centers at Shanghai, Hangzhou and Nanjing and the Pearl River Delta urban agglomeration with centers at Guangzhou and Shenzhen are secondary core areas of national tourism field strength. In both areas, the tourism field strength value and influence range are relatively large but are less than those of the Beijing-Tianjin-Hebei urban agglomeration. These 3 urban agglomerations represent the 3 largest radiation centers of tourism field strength under the non-HSR network scenario. In other areas, the influence of tourism field strength is primarily concentrated around the city center and diffuses concentrically from the center to the outer circumference, forming a core-periphery structure. However, its traffic direction is not obvious. Among other cities, the Chengdu-Chongqing urban agglomeration forms two high field strength areas around the centers of Chengdu and Chongqing, whose radiation ranges do not overlap. A high field strength area is also formed in each small area of Xi’an, Wuhan and Changsha. The tourism attraction to the surrounding cities that these areas generate displays a unipolar growth trend. In addition, from the national perspective, a high field strength area only forms in the city itself and the surrounding area to create an “island” pattern in the following cities: Harbin in Heilongjiang; Shenyang in Liaoning; Qingdao and Jinan in Shandong Province; Changchun in Jilin; Luoyang in Henan; Taiyuan in Shanxi; Wenzhou, Lishui and Jinhua in Zhejiang Province; Hefei and Mount Huangshan in Anhui Province; Xuzhou in Jiangsu; Fuzhou, Quanzhou and Xiamen in Fujian Province; Nanning, Guilin and Liuzhou in Guangxi; Kunming in Yunnan; Guiyang in Guizhou; Hohhot in Inner Mongolia; and Urumqi in Xinjiang.
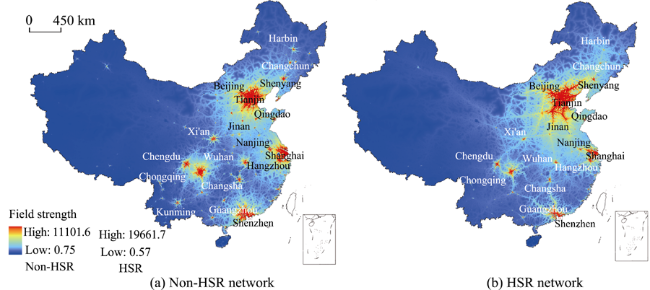
Figure 5 Spatial pattern of tourism field strength of cities with and without the HSR network in China
With the HSR network, the spatial pattern of urban tourism field strength in China exhibits the dual characteristics of multi-center annular divergence and dendritic diffusion. The latter is more obvious along HSR corridors. The change in tourism field strength is primarily concentrated in the area of intersection between the Beijing-Tianjin-Hebei urban agglomeration and the Liaodong Peninsula urban agglomeration, in the region between the Beijing-Tianjin-Hebei urban agglomeration and the Yangtze River Delta urban agglomeration, in the central plains urban agglomeration between the Beijing-Tianjin-Hebei urban agglomeration and the Wuhan urban agglomeration, the area of intersection between the Jinzhong urban agglomeration and the Guanzhong urban agglomeration, the areas between the Chengdu-Chongqing urban agglomeration and the Jinzhong urban agglomeration, in the areas between the Pearl River Delta urban agglomeration and the Chang-Zhu-Tan urban agglomeration and in other areas along the high-speed line. Due to the influence of dendritic diffusion, the high field strength regions are tending to connect with one another. In the remaining areas, the radiation range of high field strength value continues to exhibit the “isolated island” appearance. However, the number of cities is significantly decreased (Figure 5b). The radiation range of the high field strength area centered in the Beijing-Tianjin-Hebei urban agglomeration is significant and remains a core area of national tourist attraction. The Yangtze River Delta urban agglomeration with the centers of Shanghai, Hangzhou and Nanjing and the Pearl River Delta urban agglomeration with the centers of Guangzhou and Shenzhen represent secondary core areas of national tourist attraction. Shenyang, Changchun and Harbin have connected into a beads-on-a-string pattern along the HSR line. Wuhan and Changsha have connected into a beaded pattern along the Wuhan-Guangzhou HSR line, which will eventually connect the Wuhan urban agglomeration, the Chang-Zhu-Tan urban agglomeration and the Pearl River Delta urban agglomeration. Xi’an and Chengdu form a middle-low corridor pattern of tourism field strength along the Xi’an-Chengdu HSR line, while Zhengzhou and Wuhan form a middle-high corridor pattern of tourism field strength along the Beijing-Guangzhou HSR. The tourism field strength increases slightly but not significantly along the Lanzhou-Xinjiang HSR in the northwest.
3.3.2 Evolution of the spatial pattern of urban tourism field strength with the HSR network in China
From a national perspective, the mean tourism field strength of the 338 cities was 13.03 with the non-HSR network. The overall average travel field strength increased to 18.37 with the HSR network, an increase of 40.98%. Using the Spatial Analyst Tools Zonal Statistics software, the average value of provincial tourism field strength was classified. The mean values were 32.65 and 44.29 for the non-HSR and the HSR network, respectively (an increase of 35.65%). On the city level, tourism field strength increased from 13 with the non-HSR network to 18.5 with the HSR network, an increase of 41.15%.
From the perspective of China’s province belts (Table 4), the tourism field strengths of the three regions are 37.37, 15.33 and 7.25 with the non-HSR network and 51.82, 22.07 and 10. 18 with the HSR network. Each of the latter values represents a significant improvement over the former values, and the change rate is between 38%-44%. The provincial and urban tourism field strength of the three belt areas for both network types can be ranked as follows: Eastern>Central>Western. Clearly, the level of China’s urban tourism attraction and the three belt areas have a significant coupling relationship. That is, the economic strength and potential of the eastern coastal areas are the largest, followed by the central region and, finally, the western region. However, the availability of HSR travel significantly enhances the attractiveness of the national tourist cities. The average field strength of the HSR network is higher than that with the non-HSR network, and the change range is relatively large. The smallest change rate (31.51%) was found for the eastern provinces, and the largest change rate (close to 56%) was found for the central cities.
Table 4 Change rate of tourism field strength with different scales
Zone Zone Province City
Non-HSR HSR Change rate (%) Non-HSR HSR Change rate (%) Non-HSR HSR Change rate (%)
Eastern 37.37 51.82 38.67 59.06 77.67 31.51 33.35 46.93 40.72
Central 15.33 22.07 43.97 18.19 28.36 55.91 19.11 30.40 59.08
Western 7.25 10.18 40.41 11.27 16.09 42.77 11.79 16.84 42.83
From a single-city perspective, the largest and smallest tourism field strengths were those of Beijing and the cities under the jurisdiction of Hainan Province, respectively, for both network types with enhanced field strength values. The tourism field strength of Beijing increases from 276.69 with the non-HSR network to 346.31 with the HSR network, while that of the cities under the jurisdiction of Hainan Province increases from 2.50 to 3.29 (Table 5). In addition, in the national urban tourism field strength ranking, the tourism field strength of both the top 10 and bottom 10 areas improved. The largest increase is that of Dongguan (from 75.30 to 114.33), followed by Shenzhen (from 191.91 to 290.03), increases of 51.83% and 51.13%, respectively. The tourism field strength increases of Tianjin, Suzhou and Baoding are also significant. Their change rates reach 46.08%, 45.87% and 37.47%, respectively. In contrast, an increase in tourism field strength for most of the 10 bottom-ranked cities with the HSR network was not obvious.
Table 5 The first and last 10 cities in tourism field strength with and without the HSR network
First 10 Non-HSR HSR Last 10 Non-HSR HSR
City Field strength City Field strength City Field strength City Field strength
1 Beijing 276.69 Beijing 346.31 1 Baying 4.55 Akesu 5.93
2 Shenzhen 191.91 Shenzhen 290.03 2 Naqu 4.38 Bayingolin 5.93
3 Langfang 128.84 Tianjin 176.30 3 Shannan 4.36 Naqu 5.21
4 Shanghai 125.14 Langfang 171.56 4 Akesu 4.34 Shannan 5.21
5 Tianjin 120.69 Shanghai 136.36 5 Shigatse 4.22 Kertz 5.05
6 Guangzhou 108.18 Baoding 118.83 6 Kertz 3.87 Shigatse 4.95
7 Baoding 86.44 Guangzhou 115.35 7 Kashgar 3.69 Kashgar 4.75
8 Tangshan 79.05 Dongguan 114.33 8 Ali 3.48 Hotan 4.17
9 Dongguan 75.30 Tangshan 105.97 9 Hotan 3.44 Ali 3.99
10 Foshan 67.11 Suzhou 93.11 10 Cities under the jurisdiction of Hainan Province 2.50 Cities under the jurisdiction of Hainan Province 3.29
Based on the spatial pattern of the change rate of tourism field strength, the pattern of urban tourism field strength in China exhibits a high degree of coupling with the HSR network (Figure 6). The change rate of tourism field strength forms a high value corridor along the HSR line such that the denser the HSR network is, the greater the change rate of tourism field strength. In certain areas, the change rate surpasses 100%, and the largest change rate is 141. 33%. Figure 6 shows that the regional spatial pattern of tourism field strength change is consistent with the “Four Vertical Four horizontal” pattern of the national HSR network. “Four Vertical” refers to the Beijing-Shanghai, Beijing-Guangzhou, Beijing-Harbin and Shanghai-Shenzhen lines. “Four Horizontal” refers to Qingdao-Tai yuan, Xuzhou-Lanzhou- Urumqi, Shanghai-Wuhan-Chengdu and Hangzhou-Kunming lines. The 8 main high-speed lines correspond to the 8 black lines, which indicate high change rates. In addition, when the high-speed lines are combined with other transportation means as general railways, highways, national roads, and provincial roads, urban tourism field strength exhibits an obvious high-speed line direction similar to the dendritic branches pattern of external diffusion. Here, the farther that a city is from the axis of the HSR line, the more the change rate of urban tourism field strength decreases. In sum, the change rate of urban tourism field strength in China displays an overall spatial pattern of decrease from the core area of the HSR network to the peripheral area.
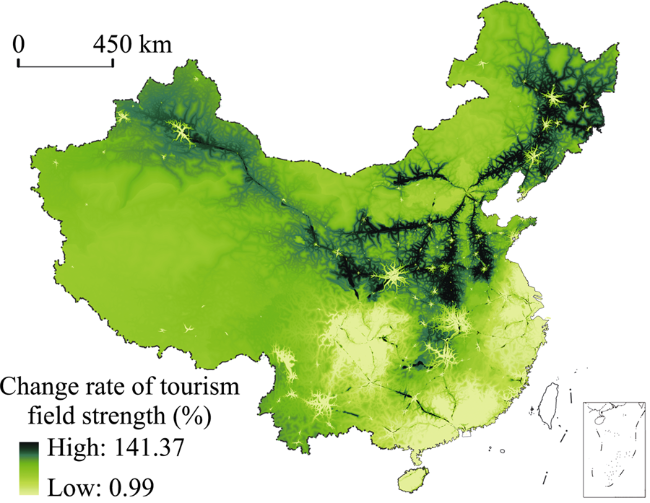
Figure 6 Change rate of tourism field strength spatial pattern for cities with and without the HSR network in China

3.4 Characteristics and evolution of the spatial pattern of various tourism field strength types with the HSR Network

3.4.1 Spatial pattern characteristics of various tourism field strength types with and without the HSR network
To further analyze the impact of HSR on city tourism attraction, the average value of urban tourism field strength is classified and summarized using Spatial Analyst Tools Zonal Statistics software. The regional tourism field strength is divided into 5 types using the natural break point method: highest tourism field strength area, higher tourism field strength area, central tourism field strength area, lower tourism field strength area and lowest tourism field strength area (Figure 7).
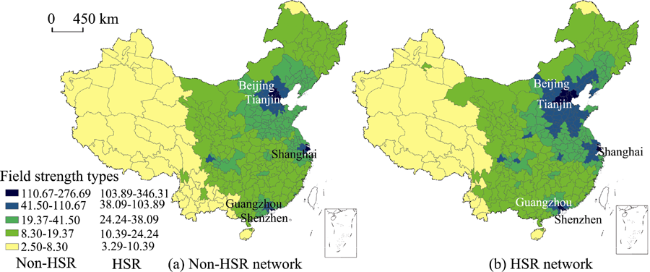
Figure 7 Spatial pattern of average tourism field strength of cities with and without the HSR network in China
(1) Highest tourism field strength area. With the non-HSR network, the highest tourism field strength area is 43, 930 km2, the mean value of which is 168.66. The scope includes the 5 cities of Beijing, Tianjin, Langfang, Shanghai and Shenzhen. Other than Langfang, the other cities are the central cities of Beijing-Tianjin, the Yangtze River Delta and the Pearl River Delta, regions in which the national economy and traffic is most developed (Figure 7a). With the HSR network, the highest tourism field strength area increases to 90,442 km2, the mean value of which is 175. If, in addition to the cities without the HSR network, Baoding and Tangshan in Hebei Province, Guangzhou and Dongguan in Guangdong Province are included in the highest field strength tourism area, the number of cities increases to 9 (Figure 7b).
(2) Higher tourism field strength area. With the non-HSR network, the higher tourism field strength area is 241,772 km2, the mean value of which is 60. 89. The specific areas include 17 cities of 5 provinces: 4 cities in the eastern region of Guangdong Province, including Guangzhou; 8 cities in Hebei, including Shijiazhuang; Suzhou and Wuxi in Jiangsu Province; Dezhou and Binzhou in Shandong Province; and Jiaxing in Zhejiang. The central and western regions only include Datong in Shanxi and Chengdu in Sichuan (Figure 7a). With the HSR network, the higher tourism field strength area increases to 733,017 km2 (203.19%), the mean value of which is 53.36. The primary reason for the decrease is that only 2 cities in the west and the other cities in the east are connected by the non-HSR network. The number of cities in the central and western regions increases to 23 with the HSR network, whereby the urban tourism field strength is relatively lower than that of the eastern cities. In conclusion, the increased number of cities of the lower value will inevitably lower the average tourism field strength. The specific areas include 45 cities of 6 provinces in the eastern region: 5 cities in Guangdong, including Zhuhai; 8 cities in Hebei, including Shijiazhuang; 7 cities in Jiangsu, including Nanjing, 8 cities in Liaoning, including Shenyang; 13 cities in Shandong, including Jinan; and 4 cities in Zhejiang, including Hangzhou. Nineteen cities in 4 provinces in the central regions are also included: Huaibei and Suzhou in Anhui Province; 9 cities in Henan, including Zhengzhou, Wuhan in Hubei; and 7 cities in Shanxi, including Taiyuan. In addition, 4 cities in 3 provinces in the western region are included: Xi’an in Shaanxi, Chengdu and Nanchong in Sichuan and Wulanqab in Inner Mongolia (Figure 7b).
(3) Moderate tourism field strength area. With the non-HSR network, the central tourism field strength area is 1,276,551 km2, whereby the mean field strength value is 27.38. The specific areas include 56 cities in 7 provinces in the east region: 10 cities in Jiangsu, including Nanjing; 6 cities in Zhejiang, including Hangzhou; 8 cities in Guangdong, including Zhuhai; 15 cities in Shandong, including Jinan; 14 cities in Liaoning, including Shenyang; Xingtai and Handan in Hebei; and Xiamen in Fujian. Thirty-three cities in 5 provinces in the central region are also included: 7 cities in Anhui, including Wuhu; 12 cities in Henan, including Zhengzhou; 3 cities in Hubei, including Wuhan; Changsha in Hunan; and 10 cities in Shanxi, including Taiyuan. In addition, 13 cities in 4 provinces in the western region are included: Chongqing; 5 cities in Inner Mongolia, including Hohhot; 5 cities in Sichuan, including Nanchong; and Xi’an and Yulin in Shaanxi province (Figure 7a). With the HSR network, the area of central tourism field strength increases to 1,228,514 km2, and the mean field strength is 30.69. The specific scope includes 29 cities in 5 provinces in the eastern region: 6 cities in Liaoning, including Anshan; 6 cities in Guangdong, including Shantou; Xiamen in Fujian Province, 6 cities in Jiangsu, including Yangzhou, 4 cities in Shandong, including Yantai; and 6 cities in Zhejiang, including Ningbo. Forty cities in 6 provinces in the central region are also included: 14 cities in Anhui, including Hefei; 8 cities in Henan, including Luoyang; 6 cities in Hubei, including Xiaogan; Changsha and Xiangtan in Hunan province; 6 cities in Jilin, including Changchun; and 4 cities in Shanxi, including Jincheng. Additionally, 18 cities in 7 provinces in the western region are included: Chongqing; 5 cities in Shaanxi, including Xianyang; 5 cities in Sichuan, including Deyang; Hezhou in Guangxi; Guiyang in Guizhou; 4 cities in Inner Mongolia, including Hohhot; and Yinchuan in Ningxia.
(4) Lower tourism field strength area. With the non-HSR network, the lower tourism field strength area is 3736555 km2, whereby the mean lower field strength value is 13.45. The specific areas include a total of 22 cities in 5 provinces in the eastern region: 8 cities in Guangdong, including Shantou; 8 cities in Fujian, including Fuzhou; Huai’an in Jiangsu; Haikou in Hainan; and 4 cities in Zhejiang, including Taizhou. Seventy cities in 7 provinces in the central region are also included: 9 cities in Anhui, including Hefei; 5 cities in Henan, including Luoyang; 12 cities in Heilongjiang, including Harbin; 11 cities in Hubei, including Yichang, 13 cities in Hunan, including Xiangtan, 9 cities in Jilin, including Changchun; and 11 cities in Jiangxi, including Nanchang. Additionally, 70 cities in 9 provinces in the western region are included: 13 cities in Gansu, including Lanzhou; 10 cities in Guangxi, including Nanning; 7 cities in Guizhou, including Guiyang; 7 cities in Inner Mongolia, including Hulun Buir, 5 cities in Ningxia, including Yinchuan, 5 cities in Qinghai, including Xining, 8 cities in Shaanxi, including Xianyang, 12 cities in Sichuan, including Leshan; and 3 cities in Yunnan, including Kunming (Figure 7a). With the HSR network, the lower tourism field strength area increases to 3,796,044 km2, whereby the mean lower field strength is 17.29. The specific areas include 17 cities in 4 provinces in the eastern region: 7 cities in Guangdong, including Yangjiang; 8 cities in Fujian, including Fuzhou; Haikou in Hainan; and 4 cities in Zhejiang, including Lishui. Forty-five cities in 5 provinces in the central region are also included: 12 cities in Heilongjiang, including Harbin; 7 cities in Hubei, including Xianning; 12 cities in Hunan, including Yueyang; 3 cities in Jilin, including Baicheng; and 11 cities in Jiangxi, including Nanchang. Additionally, 78 cities in 10 provinces in the western region are included: 14 cities in Gansu, including Lanzhou; 13 cities in Guangxi, including Nanning; 8 cities in Guizhou, including Zunyi; 7 cities in Inner Mongolia, including Hulun Buir; 4 cities in Ningxia, including Wuzhong; 5 cities in Qinghai, including Xining; 4 cities in Shaanxi, including Baoji; 13 cities in Sichuan, including Leshan; 9 cities in Yunnan, including Kunming; and Urumqi in Xinjiang (Figure 7b).
(5) Lowest tourism field strength area. With the non-HSR network, the lowest tourism field strength area is 4,481,679 km2, which is most extensive and mainly located in the northwest and southwest regions west of the Heihe-Tengchong line. The mean lowest field strength value is 6.06. The specific areas only include Hainan Province in the eastern region. All areas of Hainan except Haikou belong to the lowest tourism area. In the central region, we only find the Greater Hinggan Range in Heilongjiang. Forty-seven cities in 8 provinces in the western region are also included: Jiuquan in Gansu; 4 cities in Guangxi, including Baise; Liupanshui in Guizhou and southwestern part of the province; 3 cities in Qinghai, including Yushu; 3 cities in Sichuan, including Panzhihua; 7 cities in Tibet, including Lhasa; 14 cities in Xinjiang, including Urumqi; and 13 cities in Yunnan, including Lijiang (Figure 7a). With the HSR network, the lowest tourism field strength area decreases to 3,932,470 km2 and is primarily concentrated in the northwest and southwest regions west of the Heihe-Tengchong line. The mean value is 7.45. Regarding the specific scope, the eastern and central cities are the same as with the non-HSR and HSR networks. Thirty-one cities in 5 provinces in the western region are included: 3 cities in Qinghai, including Yushu; Ganzi in Sichuan; 7 cities in Tibet, including Lhasa; 13 cities in Xinjiang, including Karamay; and 7 cities in Yunnan, including Lijiang (Figure 7b).
3.4.2 Spatial pattern evolution of tourism field strength of cities with the HSR network
(1) Regarding the highest tourism field strength area, compared with the non-HSR network scenario, the highest tourism field strength area with the HSR network increases 105.88%, and the field strength value increases by 3.76%. Based on the evolution of the provincial spatial distribution, with the non-HSR and HSR networks, the highest tourism field strength area is concentrated in the eastern provinces of Beijing, Tianjin, Hebei, Shanghai and Guangdong. However, based on the evolution of urban spatial distribution, the highest tourist field area extends to Baoding city along the Beijing-Guangzhou line and to Tangshan city along the Qinhuangdao-Shenyang line. Affected by the HSR line, Baoding and Tangshan are influenced by Beijing and Tianjin in the Beijing-Tianjin-Hebei region, whose tourism field strength is enhanced. Dongguan and Guangzhou are the core and major cities of the Pearl River Delta urban agglomeration. Both are economically developed and possess complete tourism infrastructure and service facilities. The HSR network has increased the tourism attractiveness of Dongguan and Guangzhou, which rose from the higher tourism field strength area with the non-HSR network to the highest field strength area with the HSR network (Figure 7 and Table 6).
(2) Regarding the higher tourism field strength area, compared with the non-HSR network scenario, the higher tourism field strength area increases 203.19%, and the field strength value decreases by 12.37%. With the HSR network, the high tourism field strength area primarily expands outward along the rail line as follows: from the center of the Beijing-Tianjin-Hebei metropolitan area to the central area along the Beijing-Guangzhou line; to northeast China along the Beijing-Shenyang and Qinhuangdao-Shenyang lines; in the direction of the Shandong Peninsula along the Jinan-Qingdao line; from the center of the Yangtze River Delta to the upper reaches of the Yangtze River and the Wanjiang region along the Shanghai-Wuhan-Chengdu line; and from the center of Guangzhou to northern China along the Beijing-Guangzhou line. Regarding the specific distribution changes of the provinces, with the HSR network, the higher tourism field strength area is in the provinces of the eastern, central and western regions, to which 1, 3 and 2 provinces, respectively, are added compared with the non-HSR network scenario. The growth rates are 20%, 300% and 200%, respectively. Regarding the city distribution, the higher tourism field strength area increased 18, 18 and 3 cities in the eastern, central and western regions, respectively. The increase in the eastern and central regions is particularly evident, with increase rates of 105.88%, 1800% and 300% (Figure 7 and Table 6).
Table 6 Spatial change of various urban tourism field strengths with the HSR network in China
Field strength type Non-HSR Network HSR Network Area change
rate (%)
Field value
change rate
(%)
East Central West East Central West
Highest area Province 5 0 0 5 0 0 105.88 3.76
City 5 0 0 9 0 0
Higher area Province 5 1 1 6 4 3 203.19 -12.37
City 17 1 1 45 19 4
Moderate area Province 7 5 4 5 6 6 -3.76 12.09
City 56 33 13 29 40 18
Lower area Province 5 7 9 4 5 10 1.59 28.55
City 22 70 70 17 45 78
Lowest area Province 1 1 8 1 1 5 -12.25 22.94
City 2 1 47 2 1 31
(3) Regarding the moderate tourism field strength area, compared with the non-HSR network scenario, the central tourism field strength area decreases by 3.76%, and the field strength value increases by 12.09%. With the HSR network, the central tourist field area expands in the direction of Northeast China as follows: toward Changchun in Jilin along the Harbin-Dalian line; toward Wuhan in Hubei along the Beijing-Guangzhou and Shanghai-Wuhan-Chengdu lines; and to Fuzhou in Fujian along the Shanghai-Wenzhou-Fuzhou line. Part of the tourism field strength area of cities under the HSR network scenario increases from central to higher tourism field strength. Therefore, the central tourism field strength area decreases compared with the non-HSR network scenario. Regarding the specific provincial and urban distribution, with the HSR network, the area of tourism field strength in the eastern region significantly decreases. The number of provinces decreases from 7 to 5 when the non-HSR network is augmented by HSR, a decrease of 28. 57%. Similarly, the number of cities decreases from 56 to 29 when the non-HSR network is augmented by HSR, a decrease of 48. 21%. Influenced by the high-speed line, the number of provinces of the tourism field strength area in the central and western regions increases by 1 and 2 (20% and 50%), respectively. Similarly, the number of cities increases by 7 and 5 (21.21% and 38.46%), respectively (Figure 7 and Table 6).
(4) Regarding the lower tourism field strength area, compared with the non-HSR network scenario, the lower tourism field strength area with the HSR network increases by 1.59%, and the field strength value increases by 28.55%. With the HSR network, the lower field strength area extends to Harbin in Heilongjiang and other cities along the Harbin-Dalian line; to the northwest region along the Lanzhou-Urumqi line; and to Kunming in Yunnan and other cities along the Shanghai-Kunming and Yunnan-Guilin lines. Regarding the specific province and city distribution, under the HSR network scenario, many areas are upgraded from lower tourism field strength areas with the non-HSR network to central field strength areas with the HSR network. The number of provinces of the tourism field strength area in the central and western regions decreases by 1 and 2, respectively, when the non-HSR network is augmented by HSR, decreases of 20% and 28. 5%, respectively. Similarly, the number of cities decreases by 5 and 25 (13.64% and 35.71%), respectively. When the HSR is extended to the western region, the number of provinces and cities in the lower tourism field strength area increases by 1 and 8 (11.11% and 11.43%), respectively (Figure 7 and Table 6).
(5) Regarding the lowest tourism field strength area, compared with the non-HSR network scenario, the lowest tourism field strength area with the HSR network decreases by 12.25%, and the field strength value increases by 22.94%. Regarding the specific province and city distribution, there is no change in the eastern and central regions. However, obvious changes occur in the western region. Affected by the HSR, provinces and cities are upgraded from the lowest tourism field strength area under the non-HSR network scenario to the lower field strength area under the HSR network scenario. The number of provinces and cities in the lowest tourism field strength area decreases by 3 and 16 (37.5% and 34. 04%), respectively. Thus, the area of lowest field strength is significantly reduced (Figure 7 and Table 6).

4 Conclusions and discussion

With the non-HSR and HSR networks, the national spatial pattern of urban accessibility in China exhibits a core-periphery pattern. The weighted average travel time gradually increases from the eastern coast to the western inland area. Overall urban accessibility is optimized with the HSR network. The spatial pattern of accessibility exhibits an obvious traffic direction and forms the high-speed rail-corridor effect. The low-value area (0-1 h) of isochronous rings is expanded with the HSR network. The median region (1-10 h) is reduced and replaced by the high accessibility area. A change in the low accessibility area (>10 h) is not obvious. In addition, because of the HSR pattern in the central and eastern regions, HSR in the vast western region is sparse, and overall urban accessibility in China, particularly in the central and western regions, does not significantly improve (Table 7).
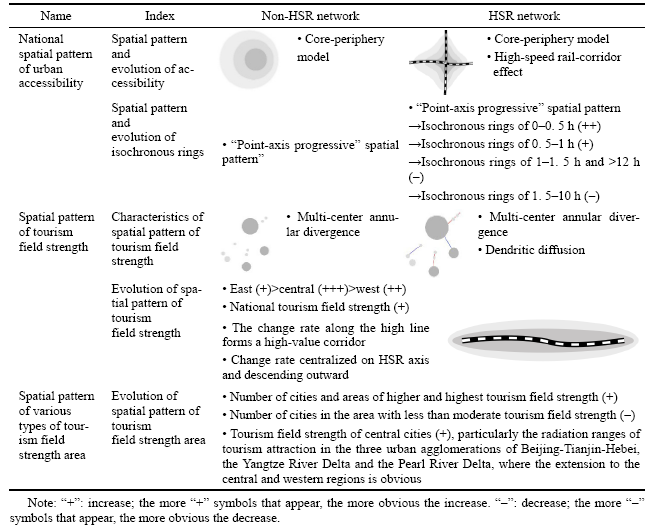
Table 7 Main conclusions of the spatial pattern and evolution of the urban tourism field strength in China with the HSR network
Regarding the national spatial pattern, the spatial pattern of urban tourism field strength in China exhibits the characteristics of multi-center annular divergence with the non-HSR network and the dual characteristics of multi-center annular divergence and dendritic diffusion with the HSR network. Dendritic diffusion is particularly more obvious along the hsr. Compared with the national region, the urban tourism field strength of the three belt regions is ranked Eastern > Central > West under the HSR and non-HSR networks. Each belt region is significantly improved under the HSR network scenario. Regarding the spatial pattern of the urban tourism field strength change rate, a high value corridor is formed along the HSR line that decreases from the center to the outer limit along the line.
The impact of the HSR on the highest and higher tourism field areas is the most significant. The area of these two types of tourism field strength expands more than 100%. The number of cities in highest and higher tourism field areas increases significantly, while the number of cities with lower than central tourism field strength decreases to varying degrees. This outcome indicates that HSR transport plays a significant role in enhancing the attractiveness of urban space. In addition, HSR enhances the tourism field strength value of regional central cities, and the radiation range of tourism attraction extends along the HSR lines. Specifically, the extension of the radiation ranges of tourism attraction of the three urban agglomerations of Beijing-Tianjin-Hebei, the Yangtze River Delta and the Pearl River Delta to the central and western regions is obvious (Table 7).
With increasing globalization, China is promoting the important development strategy termed The Belt and Road, which is China’s new model of regional economic cooperation with foreign countries. As China steadily increases the development of HSR links to international destinations, HSR has become an attractive symbol for China. The HSR diplomacy gained world notice following General Secretary Xi Jinping and Premier Li Keqiang’s state visits in 2015. General Secretary Xi Jinping announced that China, Peru and Brazil will construct HSR lines across the South American continent to connect the Atlantic and the Pacific when he visited 4 Latin America countries. During General Secretary Xi Jinping’s visit to Britain, the two sides reached a consensus on promoting cooperation in the field of HSR. Prime Minister Li Keqiang stated that China would establish a HSR R&D center in Africa at the AU Conference Center. When Premier Li Keqiang attended the nineteenth regular meeting with the Russian Prime Minister, the two sides signed a memorandum of cooperation on the development of a HSR link between Moscow and Kazan that will eventually be extended to Beijing. An intergovernmental framework agreement on HSR cooperation has been signed by China and Thailand. Construction is scheduled to start at the end of October and expected to be completed in 3 years. This cooperation will establish a solid foundation for the implementation of The Belt and Road Initiative in Southeast Asia. Thus, the Chinese HSR diplomacy has strengthened international cooperation, which is an important guarantee for the implementation of The Belt and Road Initiative. The international HSR is an important step for China’s HSR and will promote China’s regional tourism cooperation with Europe, Southeast Asia and other countries. The international HSR will have a far-reaching impact on the spatial pattern of international regional tourism. The distribution pattern of international regional tourism resources, the international tourism market structure and the industrial structure of international tourism will be changed. This paper studied the impact of HSR on the national large-scale spatial pattern of regional tourism. Thus, it can be used as a reference in studies on the influence of HSR on the international spatial pattern of regional tourism from a global perspective.

The authors have declared that no competing interests exist.

[1]
Abeyratne R I R, 1993. Air transport tax and its consequences on tourism.Annals of Tourism Research, 20(2): 450-460.Les taxes sur le transport aérien et ses conséquences pour le tourisme. Depuis 1990 une prolifération au niveau mondial de taxes imposées à l'aviation civile a produit de nombreuses protestations de la part de l'industrie aérienne. L'imposition d'une charge de facilitation proposée par l'USTTA, laquelle exige des compagnies aériennes et des compagnies maritimes de transport de passagers de payer une “redevance d'usage” pour les ressortissants étrangers, en est un exemple typique. Cette imposition fut per04ue comme étant “discriminatoire” étant donné qu'elle exige des étrangers qu'ils supportent les co04ts de promotion du tourisme aux 07tats-Unis. Ce document définit les termes “taxes” et “frais”, souléve les questions qui ressortent suite à de telles charges, discute des réactions internationales à ce sujet, et conclut que le transport aérien international et le tourisme sont tous les deux liées de facon inextricable et que le fait d'en taxer un afin de développer l'autre serait une mesure vouée à l'échec.

DOI

[2]
Chen Cai, 2011. The effect of Shinkansen to tourism in Japan.Journal of Chinese Tourism, 3-4. (in Chinese)

[3]
Chew J, 1987. Transport and tourism in the year 2000.Tourism Management, 8(2): 83-85.Tourism continues to increase with the aid of improved transport and communications facilities. Air transport in particular has brought the Asia-Pacific region within reach of Americans and Europeans, and this region is predicted to become the boom area for tourism by the year 2000. This trend will not be seriously affected by economic recession but could be reduced by travel restrictions and the threat of terrorism.

DOI

[4]
Dodgson J S, 1974. Motorway investment and sub-regional growth: The case of the M62.Regional Studies, 8: 75-91.THIS PAPER IS CONCERNED WITH THE EFFECTS OF MOTORWAY INVESTMENT ON RIGIONAL ECONOMIC GROWTH. THE ROLE OF REGIONAL DEVELOPMENT BENEFITS IN COST-BENEFIT APPRAISALS OF HIGHWAY INVESTMENTS IS BRIEFLY REVIEWED. A MODEL RELATING AREAL EMPLOYMENT GORWTH RATES TO TRANSPORT COSTS AND TO OTHER VARIABLES IS DEVELOPED, AND THEN TESTED FOR A 30-ZONE AREA OF THE NORTH OF ENGLAND USING MULTIPLE REGRESSION TECHNIQUES. TRANSPORT COSTS INDICES OF ACCESSIBILITY DEVELOPED IN THIS MODEL ARE THEN USED TO CALCULATE THE EFFECT OF A PARTICULAR MOTORWAY, THE M62, ON INDUSTRIAL TRANSPORT COSTS IN THE AREAS THROUGH WHICH IT PASSES. THESE RESULTS ARE USED TO GIVE A VERY TENTATIVE INDICATION OF THE EMPLOYMENT CHANGES IN THESE AREAS WHICH MIGHT FOLLOW THE HIGHWAY'S CONSTRUCTION.

DOI

[5]
Gilbert E W, 1939. The growth of inland and seaside health resorts in England.The Scottish Geographical Magazine, 55(1): 16-35.

DOI

[6]
Javier Gutiérrez, 2001. Location, economic potential and daily accessibility: An analysis of the accessibility impact of the high-speed line Madrid-Barcelona-French border.Journal of Transport Geography, 9(4): 229-242.This paper evaluates the accessibility impact of the future Madrid–Barcelona–French border high-speed line. Accessibility impact of the new infrastructure is measured by means of three indicators: weighted average travel times, economic potential and daily accessibility. These indicators respond to different conceptualizations and offer complementary information about the issue accessibility. The results are quite different: very concentrated effects in the daily accessibility indicator, less concentrated in the economic potential one and more dispersal in the location indicator. The sign (polarizing/balancing) of these effects depend on the geographic scale: polarizing effects at the national level and balancing effects at both corridor and European levels are identified. A geographic information system (GIS) was used to carry out this study.

DOI

[7]
Kaul R N, 1985. Dynamics of Tourism: A Trilogy Transportation and Marketing. New Delhi: Sterling Publishers.

[8]
Leiper N, 1990. Tourist attraction systems.Annals of Tourism Research, 17(4): 33-45.

[9]
Li Xiaojian, 1999. Economic Geography. Beijing: Higher Education Press, 200-214. (in Chinese)

[10]
Liang Xuesong, 2010. Discussion on the development opportunity of tourism industry in Hunan province based on the dual location space.Economic Geography, 30(5): 859-864. (in Chinese)

[11]
Nelson R, Wall G, 1986. Transport and accommodation changing interrelation ships on Vancouver Island.Annals of Tourism Research, 13(2): 239-260.Le nombre d'établissements était au minimum en 1940 et a atteint son maximum en 1959. Bien qu'il ait eu récomment une réduction dans le nombre d'établissements, à cause d'une croissance dans l'importance moyenne, la quantité du logement n'a pas cessé de s'accro06tre. Pourtant, les touristes aisés de la période d'avant la Deuxième guerre mondiale, qui sont souvent restés sur l'06le pendant plusieurs semaines et qui ont participé aux sports et aux activités sociales, ont été remplacés par des touristes moins fortunés qui ont plut00t tendance à séjourne et à visiter pendant seulement quelques jours. Une plus grande facilité d'accès à l'06le et à l'intérieur de l'06le et un plus grand nombre de propriétaires d'automobiles ont été deux raisons importantes pour ces changements.

DOI

[12]
Pan Jinghu, Liu Weisheng, Yin Jun, 2014. Evolution and urban hinterland area of cities at prefecture level or above in China.Urban Problems, (6): 37-45. (in Chinese)This essay improves the traditional field models from two aspects of"composite nodality index"and"regional accessibility"in order to delineate urban hinterland area more reasonably. The principal components analysis method is used to calculate urban nodality index with the indicators system. With the application of raster cost weighted distance method and k- order data fields,this essay measures the regional accessibility and the spatial field of 287 cities at prefecture level or above in China. Furthermore,this essay delimits urban hinterlands in 1991 and 2010 in accordance with the principle of"maximal field- strength choice"by using GIS software. The results indicate that the accessibility condition continues to be improved and the average accessibility is 246. 98 min and 193.43 in 1991 and 2010 respectively. Spatial filed have been increasing significantly,and the small and medium- sized cities expanded its hinterland but big cities ' hinterland areas are shrink. Drift rate of urban hinterland is more advanced in north- western region than that in southeastern region.

DOI

[13]
Prideaux B, 1993. Possible elects of new transport technologies on the tourism industry in the 21st century. Papers of the Australasian Transport Research Forum, Graduate School of Management. The University of Queensland, 18: 245-258.

[14]
Prideaux B, 2000. The role of the transport system in destination development.Tourism Management, 21(3): 53-63.Although the transport industry provides the link between tourism generating and destination regions the industry's role as an agent in destination development has been largely overlooked. If the ability of tourists to travel to preferred destinations is inhibited by inefficiencies in the transport system there is some likelihood that they will seek alternative destinations. This paper outlines a transport cost model that identifies the significance of transport as a factor in destination development as well as in the selection of destinations by intending tourists. The model demonstrates the dynamic relationship between categories of holiday expenditure and tourists point of origin. Increased distance generally leads to increased transport access costs and represents a significant factor in total holiday cost. The model is tested by analyzing the role of transport in the development of Cairns as a destination by examining the effect of distance, transport access costs and competing destinations.

DOI

[15]
Sophie Masson, Romain Petiot, 2009. Can the high speed rail reinforce tourism attractiveness? The case of the high speed rail between Perpignan (France) and Barcelona (Spain).Technovation, 29: 611-617.The transport system plays an important role in tourism destination development. A high speed railway authorizes a reduction in transportation costs and can be a tool for tourism destination development by allowing accessibility improvement. Nevertheless, this improvement is often synonymous with reinforcement of spatial competition between tourism destinations. New economic geography (NEG) models show that agglomeration and dispersion forces determine the spatial structure of economy. These two opposing forces are influenced by transportation costs. A decrease in transport costs can reinforce the concentration of economic activities. A prospective analysis investigating the case of the forthcoming South European HSR lines between Perpignan and Barcelona shows that the resulting increased spatial competition may reinforce the phenomenon of the tourism activities agglomeration around Barcelona to the detriment of Perpignan. Tourism product differentiation is one solution for Perpignan to confront agglomeration forces.

DOI

[16]
Wang Degen, 2013a. Spatial structure impacts of HSR on domestic tourism market in China.Scientia Geographica Sinica, 33(7): 797-805. (in Chinese)Transportation infrastructure is an indispensable prerequisite for developing tourism resources and constructing resorts, every new breakthrough in traffic technology allows the tourists to travel at a faster speed to a remoter destination. High speed rail (HSR) is a significant symbol of the worldwide “transportation revolution”, producing the remarkable effect of “space compression”. The “space compression” effect of HSR plays a significant role on the tourists’ travel space, thereby affecting the spatial structure of tourist source markets. On the basis of the case, Jinan, Taishan on Beijing-Shanghai HSR, and Wuhan, Hengshan on Wuhan-Guangzhou High speed rail, this article proves the impacts on the spatial structure of domestic source market by HSR from the point of attraction of spatial extent, spatial use curves of resorts, and spatial attractiveness of destination to source region, and concludes the new regularities of the tourist behaviors and spatial distribution of tourists in the age of HSR, laying the “cornerstone” for further study on the HSR’s impacts on the spatial pattern of regional tourism. The results show that: 1) the attractiveness radius of Jinan, Taishan, Wuhan, and Hengshan’s tourist market has been extended after the open of HSR. Therefore the number of source markets which may make large impacts on destination has increased, in particular, the number of major source markets that more significantly impact on the destinations, and the market share by remarkable margin. 2) The share of short-range source market has decreased obviously, while the medium, specifically the distance between 750 and 1 000 km, and long-range source market share have increased to different degrees. The 60% spatial extent of tourist markets have shown a trend of a significant expansion. 3) The “space compression” effect of HSR has improved the growth of attractiveness to tourist market, and the more remote of the distance, the more remarkable of the changes. The variability of attractiveness values and tourist demand have shown a significant correlation relationship. The change rate of spatial attractiveness value of destinations to tourist source and the change of tourist market demand are remarkably correlative, i.e. the more change of attractiveness, the more change of tourist market demand. It can also be seen that the effect of space compression produced by HSR exerts a significant accelerating function in the improvement of the attractiveness of destinations to tourist source markets, correspondingly promoting the significant growth of tourist market demand.

[17]
Wang Degen, 2013b. The impact of Wuguang HSR on regional tourism spatial pattern in Hubei province.Geographical Research, 32(8): 1555-1564. (in Chinese)This article analyzes the impact of Wuhan-Guangzhou HSR on regional tourism spatial pattern in Hubei province in three aspects: firstly,using urban primacy index and rank-size rule we analyze the impact mentioned above;then we compare the structural differences of tourist flow network between before and after the operation of HSR in Hubei by using SNA method,which is a further validation for this impact;finally,we study the impact of HSR on spatial differences in regional tourism development by Theil coefficient and Differentiation index.The results show that:(1) Wuhan-Guangzhou HSR has strengthened the primacy distribution trend in Hubei,and plays a "catalyst" role in the formation of centralization of tourist spatial structure in this province.(2) The impact of Wuhan-Guangzhou HSR on the evolution of regional tourism spatial pattern in Hubei shows a "double-edged effect".On one hand,the HSR strengthens the role of polarization of the core region,and it exacerbates the differences of the overall regional tourism development,which shows a negative effect on the regional balance development.On the other hand,it strengthens the diffusion effect of the core region,and it exerts influence on the edge region to a certain degree.Therefore it minimizes the differences of tourism development within the edge region,and has a positive effect on the regional balance development.As the diffusion effect is less visible than the polarization effect,it will further widen the gap of tourism development level that is affected by HSR within the province.

DOI

[18]
Wang Degen, 2014. Optimizing of tourist space and effect on accessibility of along metropolitan circles under Wuhan-Guangzhou HSR.Urban Development Studies, 21(9): 110-117. (in Chinese)

[19]
Wang Degen, Chen Tian, Lu Linet al., 2015. Mechanism and HSR effect of spatial structure of regional tourist flow: Case study of Beijing-Shanghai HSR in China.Acta Geographica Sinica, 70(2): 213-232. (in Chinese)Transportation is one of the most important factors affecting spatial structure of tourist flow. Taking Beijing-Shanghai High-speed Rail (Hereinafter referred to as the HSR) as an example, the paper firstly explores the features and HSR effects of spatial structure of regional tourist flow with the help of social network analysis method. And then it points out the changes of the accessibility in regional transportation. After analyzing the following various influencing factors, e.g. the initial endowment of regional tourist resources, the hospitality facilities, the density of regional tourism transportation network, the location, etc., the paper discusses about the mechanism of HSR effect of spatial structure in regional tourist flow. The results are shown as follows: (1) The HSR effects of spatial structure in regional tourist flow are manifested as the "Matthew effect", the "filtering effect", the "diffusion effect" and the "overlying effect"; (2) The "Matthew effect" of HSR is manifested under the obvious interaction of the location condition, the initial endowment of tourist resources, hospitality capacity, tourist transportation network density and the "time-space compression"; the "filtering effect" of HSR is manifested in those tourism nodes without favorable location condition, endowment of tourist resources, hospitality capacity, tourist transportation network density, and obvious "time-space compression"; For those tourist nodes that boast favorable advantages in terms of location condition, endowment of tourist resources, hospitality capacity, tourist transportation network density and obvious "time-space compression", they will become diffusion sources. HSR will strengthen the aggregation effects of tourist flow in those diffusion sources, and thereafter, will diffuse to the peripheral tourist areas, manifesting the mode of "aggregation-diffusion"; HSR has resulted in the multiplicity phenomenon in terms of tourists' traveling spatial range for those from large-scale spaces. However, the "overlying effect" is only generated in those tourist nodes with favorable location condition, endowment of tourist resources, hospitality capacity, tourist transportation network density, and obvious "time-space compression".

DOI

[20]
Wang Degen, Niu Yu, Wang Li, 2015. Influence of high-speed rail on choices of tourist destination based on the gravity model: Case study of Beijing-Shanghai high-speed rail in China.Geographical Research, 34(9): 1770-1780. (in Chinese)The goal of this study was to identify the primary factors affecting choices of tourism destination through factor analysis and to measure the degree of change in the influence of primary factors on tourism destination choices under the high-speed rail condition by constructing a tourism supply-demand gravity model. The results showed that travel time, tourism resource endowment, reception ability and traffic accessibility were the four primary influencing factors. The spatial distance from the tourist origin to the destination was the most important factor influencing the choice of tourist destination before the high-speed rail opened, and distance promoted resistance to travel. However, the situation significantly changed after the opening of the high-speed rail. The resistance to travel associated with distance tended to be weak, and the traffic network density, the endowed resources and the reception ability of the tourist site have become the most important factors influencing the choice of destination. This study provided a theoretical framework for constructing tourism destination in the era of the high-speed rail, which will enable the development of a scientific and reasonable system incorporating tourism elements under high-speed rail conditions that will optimize and improve the tourism destination.

[21]
Wang Degen, Qian Jia, Chen Tianet al., 2014. Influence of the high-speed rail on the regional tourism spatial pattern.Asia Pacific Journal of Tourism Research, 19(8): 890-912.This paper compares volumes, flows, and spatial patterns of traffic before and after the opening of the high-speed rail (HSR) link between Beijing and Shanghai. Evidence emerges of a significant change in the shape of isochrones within the region. Under the influence, the temporal and spatial distance between the source region and tourist destination is greatly reduced. Equally, multiple contact modes are more apparent and the overall structure of tourism flow network is closer after the opening of the HSR service. As can be seen from the above, the HSR has a significant impact on regional tourism traffic accessibility and then has a significant on the temporal and spatial distribution of regional tourism resource. The tourism flow will respond positively to the “space compression” effect.

DOI

[22]
Wang Degen, Zhang Yun, 2015. The influence of high-speed railways on accessibility of Yangtze River Delta region’s metropolitans.Economic Geography, 35(2): 54-61. (in Chinese)This paper integrated method of cost weighted raster analysis was designed and applied to generate five metropolitans' daily communication rings with and with the operation of high- speed railways in Yangtze River Delta region. The valuation of accessibility was conducted with a coefficient based on the shortest travel time. After the valuation, differences between accessibility patterns with scenarios with and without high-speed railways were analyzed,and influences of the high-speed railways on five metropolitans' accessibility were discussed. The results indicated that cities along the high- speed railways became the biggest beneficiaries of time convergence, the accessibility of none station cities also promoted while in minutely. The isochronous rings of five metropolitans evolved outward along the high-speed railways, and the spatial scope showing the extend trend along the high-speed railways. High-speed railways would expand the isochronous ring, and the coverage of five metropolitans' daily communication ring almost attained one hundred percent in scenario of high- speed railway. The coverage of 1 and 2 hour- isochronous rings extended in varying degrees. This indicated that daily flow across the cities, and"City effect"can be achieved with the closer time distance among main cities inside or outside the metropolitans.

[23]
Wang Li, Deng Yu, Liu Shengheet al., 2011. The study of urban spheres of influence based on improved field model and its applications: Case study of Central China.Acta Geographca Sinica, 66(2): 189-198. (in Chinese)Due to unique advantages in a clear understanding of the interrelationship between city and its hinterland,as well as city and city,the study on urban spheres of influence is becoming a highlight in regional research.This paper improves traditional field models in two aspects:the composite indicator and regional accessibility,in order to delineate urban spheres of influence more reasonably.Taking three years of central China as a case study,this paper investigates dynamic evolution of urban spheres of influence.Focusing on the evolution of spatial pattern,we abstract three stages and its corresponding five types theoretically.Finally,recommendation of development has been made for each stage.This study undertakes certain exploration in the study of urban spheres of influence from the perspective of theory and practice,which can provide some references for the studies in this field and other regional research.

DOI

[24]
Wang Xin, Zou Tongqian, 2010. Impact of the high speed network on the development and distribution of Chinese area’s tourism industry.Economic Geography, 30(7): 1189-1194. (in Chinese)The high speed network means a sudden change on communication condition,and also a sudden change on space relation of tourism systerm factors.It will bring great change on Chinese tourism industry.Based on the mechanism of time to replace space,the grid-space mode has been investigated in this paper.The impact of the high speed network on the development and distribution of Chinese area’s tourism industry includes:the enlargement and deformation of market space,the larger circumscription of market competition,the node effect,the terminal point effect,the blank point effect,the spring up of huge centre cities,the adjustment of industry structure and the relocation on area’s tourism,the climbing of time sill.It’s necessary to do more study on the reaction tactics.

[25]
Wu Kang, Fang Chuanglin, 2013. The intercity space of flow influenced by high-speed rail: A case study for the rail transit passenger behavior between Beijing and Tianjin.Acta Geographca Sinica, 68(2): 159-174. (in Chinese)In the perspective of space of flows, the passenger flow of high-speed rail has become an important representation of functional linkage between the city-regions. Based on the interviews and questionnaires from the passengers of high-speed rail of Beijing and Tianjin, this paper analyzes the intercity space of flows and the spatial integration indicated by the individual micro behavior choice. The findings include: (1) Both of the metropolitan areas of Beijing and Tianjin are the dense areas of intercity passenger flow while suburban counties and districts are the sparse areas, which indicates the spatial polarization of HSR in the aspect of passengers' characteristics; The central city of Beijing-Tianjin is the dominant spatial association, while Beijing-Tanggu, Beijing-Wuqing and Tianjin-Wuqing corridors are the secondary spatial association axes, which presents a hub-and-spoke pattern. (2) Leisure activities, such as tourism, shopping, enhance the cross-city flows. Although intercity high-speed rail reduces the temporal and spatial distance to a certain extent, the effects on changing place of housing or work to another city are not obvious. (3) The frequency of cross-city activities is not very high, commuters across cities generally take 7 days as a cycle; Currently, passenger flows of intercity by HSR are mainly business travel and leisure tourism, which reflects HSR as the material foundation for the spaces of flows; the respondents who take the HSR are mostly male, business people with high education and prospective occupation, and the business travelers who have a higher cross-city frequency are more sensitive to travel time, which demonstrates the intercity space of flow has represented some of the elite space characteristics. (4) There is spatial asymmetry in the cross-city space of flow between Beijing and Tianjin, which could be found from the uneven distribution of O-D passenger flows, the differences on the proportion of the business travel flows and the unbalanced function linkage directions.

DOI

[26]
Yang Ben, 2011. Study on the influence to regional development under HSR [D]. Shanghai: East China Normal University. (in Chinese)

[27]
Yin Ping, 2012. HSR and establishment of new pattern of regional tourism: Case study of the HSR between Zhengzhou and Xi’an.Tourism Tribune, 27(12): 47-53. (in Chinese)

[28]
Zhang Chao, Yang Binggen, 1991. Quantitative Geography Foundation. Beijing: Higher Education Press. (in Chinese)

Outlines

/