
Journal of Geographical Sciences >
Applicability evaluation of the SWIM at river basins of the black soil region in Northeast China: A case study of the upper and middle Wuyuer River basin
Author: Yang Zhiyuan, PhD Candidate, specialized in land use, regional environment modeling and evaluation. E-mail: yzybsz@163.com
*Corresponding author: Zang Shuying, Professor, E-mail: zsy6311@163.com
Received date: 2016-11-15
Accepted date: 2017-01-20
Online published: 2017-07-10
Supported by
National Natural Science Foundation of China, No.41571199, No.41571105
Natural Science Foundation of Heilongjiang Province, No.ZD201308
Copyright
In this paper, we selected the middle and upper reaches of the Wuyuer River basin in the black soil region of Northeast China as the study area. We adopted the soil and water integrated model (SWIM) and evaluated the parameter sensitivity using partial correlation coefficient. We calibrated and validated our simulation results based on the daily runoff data from Yi’an hydrological station at the outlet of the river basin and the evaporation data recorded by various weather stations from 1961 to 1997. Following evaluation of the modeling data against the observed data, we present the applicability of SWIM in the river basin of the black soil region, and discuss the resulting errors and their probable causes. Results show that in the periods of calibration and validation, the Nash-Sutcliffe efficiency (NSE) coefficients of the monthly and daily runoffs were not less than 0.71 and 0.55, and the relative errors were less than 6.0%. Compared to daily runoffs, the simulation result of monthly runoffs was better. Additionally, the NSE coefficients of the potential monthly evaporation were not less than 0.81. Together, the results suggest that the calibrated SWIM can be utilized in various simulation analyses of runoffs on a monthly scale in the black soil region of Northeast China. On the contrary, the model had some limitations in simulating runoffs from snowmelt and frozen soil. Meanwhile, the stimulation data deviated from the measured data largely when applied to the years with spring and summer floods. The simulated annual runoffs were considerably higher than the measured data in the years with abrupt increases in annual precipitation. However, the model is capable of reproducing the changes in runoffs during flood seasons. In summary, this model can provide fundamental hydrological information for comprehensive management of the Wuyuer River basin water environment, and its application can be potentially extended to other river basins in the black soil region.
YANG Zhiyuan , GAO Chao , ZANG Shuying , YANG Xiuchun . Applicability evaluation of the SWIM at river basins of the black soil region in Northeast China: A case study of the upper and middle Wuyuer River basin[J]. Journal of Geographical Sciences, 2017 , 27(7) : 817 -834 . DOI: 10.1007/s11442-017-1408-2
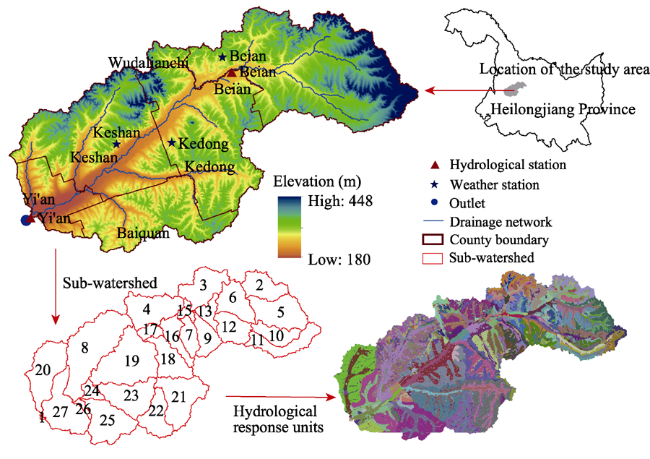
Figure 1 Sketch map of the geographic location and spatial division of the study area |
Table 1 The characteristic parameters of sub-basins and the simulation accuracy of runoffs with different drainage area thresholds |
| Drainage area threshold (km2) | Number of sub-basin | Number of hydrologic response unit (HRU) | Average annual runoff (m3/s) | R value | Efficiency coefficient (E) |
|---|---|---|---|---|---|
| 90 | 93 | 1206 | 29.88 | 0.834 | 0.39 |
| 100 | 37 | 653 | 29.27 | 0.896 | 0.43 |
| 140 | 29 | 577 | 27.69 | 0.898 | 0.47 |
| 150 | 27 | 556 | 27.73 | 0.899 | 0.48 |
| 160 | 27 | 556 | 27.67 | 0.898 | 0.48 |
| 170 | 25 | 525 | 29.30 | 0.898 | 0.46 |
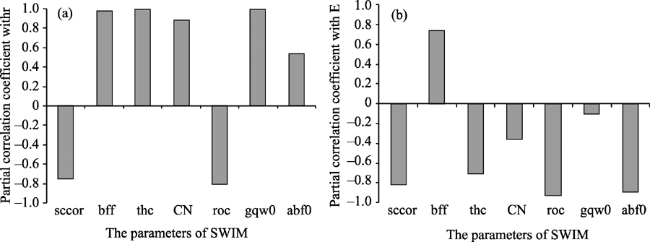
Figure 2 Results of the sensitivity analysis |
Table 2 Calibrated values of the key parameters |
| Parameter code | Parameter meaning | Range of value | Parameter value | Parameter value of the upstream Jinghe River |
|---|---|---|---|---|
| thc CN | Correction factor for potential evapotranspiration on sky emissivity SCS curve number | 0.5-1.5 10-100 | 0.7 CN=70 | 1.6 - |
| bff | Baseflow factor for basin | 0.2-1.0 | 0.7 | 0.01 |
| gwq0 | Initial groundwater flow contribution to streamflow | 0.01-1.0 | 0.03 | 0.5 |
| abf0 | Alpha factor for groundwater | 0.001-1.0 | 0.001 | 0.001 |
| roc2 | Routing coefficient | 1-100 | roc2=1.5 | roc2=0.5 |
| roc4 | Routing coefficient | 1-100 | roc4=3 | roc4=2 |
| sccor | Correction factor for soil saturated conductivity | 0.01-10 | 1.8 | 5 |
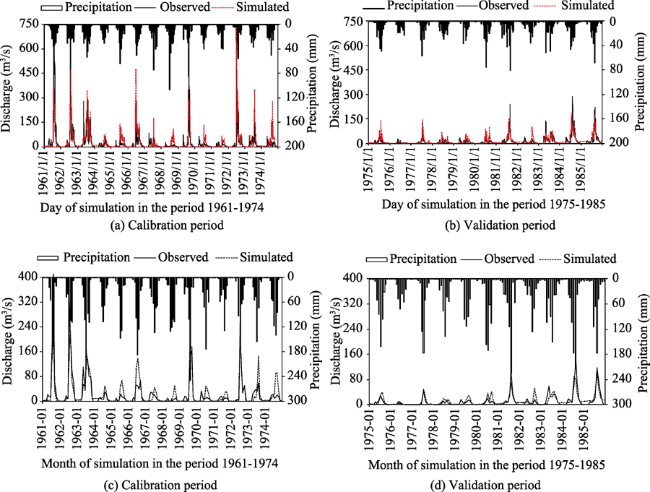
Figure 3 The comparisons between the simulated and observed daily and monthly runoffs of Yi’an Station from 1961 to 1985 |
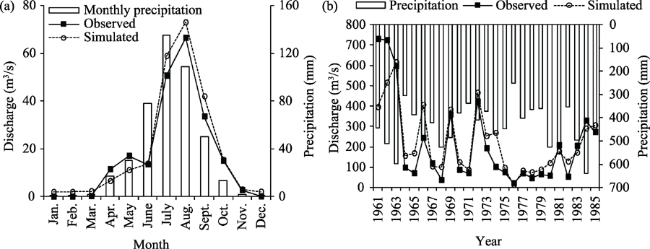
Figure 4 The change in average monthly flows and annual runoffs of Yi’an Station from 1961 to 1985 |
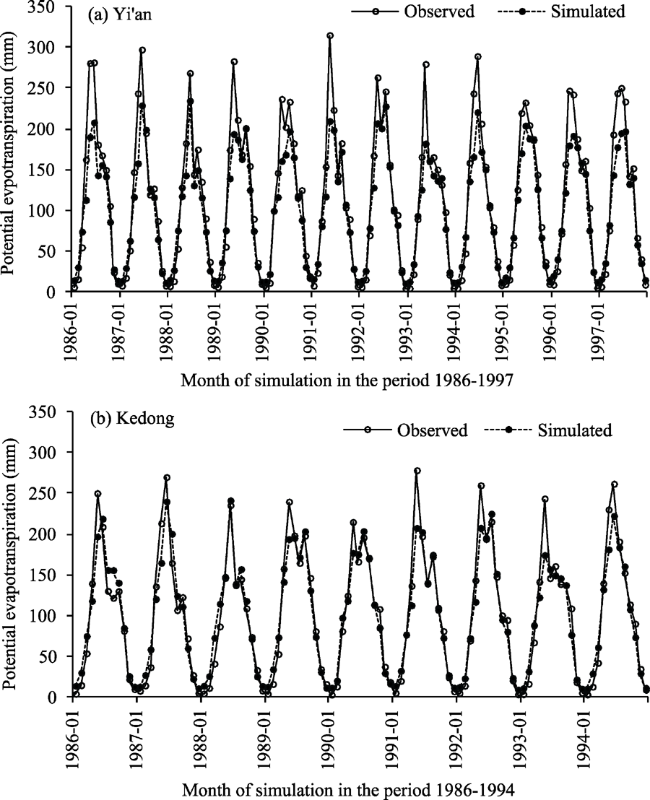
Figure 5 Comparison between the simulated monthly potential evapotranspiration and the measured monthly evaporation of small evaporating dish at Yi’an and Kedong weather stations from 1986 to 1997 |
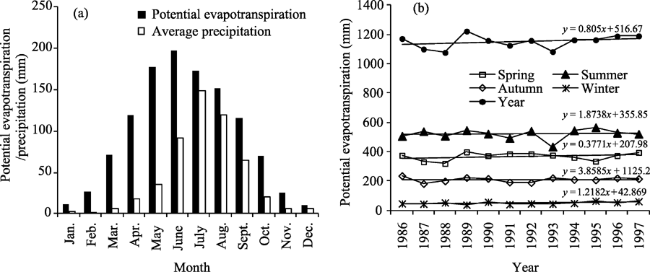
Figure 6 The distribution of monthly potential evapotranspiration and the change in annual potential evapotranspiration over years from 1986 to 1997 |
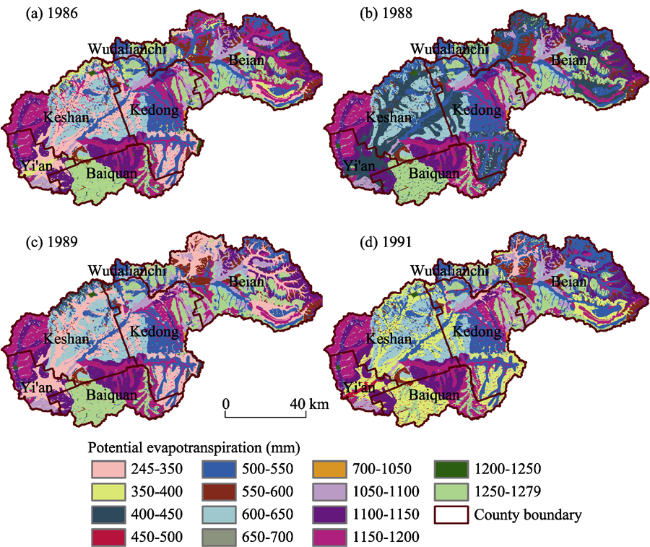
Figure 7 The spatial distribution of potential evapotranspiration in the study area |
The authors have declared that no competing interests exist.
| [1] |
|
| [2] |
|
| [3] |
|
| [4] |
|
| [5] |
|
| [6] |
|
| [7] |
|
| [8] |
|
| [9] |
|
| [10] |
|
| [11] |
|
| [12] |
|
| [13] |
|
| [14] |
|
| [15] |
|
| [16] |
|
| [17] |
|
| [18] |
|
| [19] |
|
| [20] |
|
| [21] |
|
| [22] |
|
| [23] |
|
| [24] |
|
| [25] |
|
| [26] |
|
| [27] |
|
| [28] |
|
| [29] |
|
| [30] |
|
| [31] |
|
| [32] |
|
| [33] |
|
| [34] |
|
| [35] |
|
| [36] |
|
| [37] |
|
| [38] |
|
| [39] |
|
| [40] |
|
| [41] |
|
| [42] |
|
/
| 〈 |
|
〉 |