Orginal Article

The response of vegetation growth to shifts in trend of temperature in China

  • HE Bin , 1 ,
  • CHEN Aifang 2 ,
  • JIANG Weiguo 3 ,
  • CHEN Ziyue 1
Expand
  • 1. State Key Laboratory of Earth Surface Processes and Resource Ecology, College of Global Change and Earth System Science, Beijing Normal University, Beijing 100875, China
  • 2. Regional Climate Group, Department of Earth Sciences, University of Gothenburg, Box 460, 40530 Gothenburg, Sweden
  • 3. Academy of Disaster Reduction and Emergency Management, Beijing Normal University, Beijing 100875, China

Author: He Bin (1981-), Associate Professor, specialized in studies on impacts of climate extremes. E-mail:

Received date: 2016-09-02

  Accepted date: 2017-01-20

  Online published: 2017-07-10

Supported by

National Natural Science Foundation of China, No.41671083, No.41301076

Copyright

Journal of Geographical Sciences, All Rights Reserved

Abstract

Though many studies have focused on the causes of shifts in trend of temperature, whether the response of vegetation growth to temperature has changed is still not very clear. In this study, we analyzed the spatial features of the trend changes of temperature during the growing season and the response of vegetation growth in China based on observed climatic data and the normalized difference vegetation index (NDVI) from 1984 to 2011. An obvious warming to cooling shift during growing season from the period 1984-1997 to the period 1998-2011 was identified in the northern and northeastern regions of China, whereas a totally converse shift was observed in the southern and western regions, suggesting large spatial heterogeneity of changes of the trend of growing season temperature throughout China. China as a whole, a significant positive relationship between vegetation growth and temperature during 1984 to 1997 has been greatly weakened during 1998-2011. This change of response of vegetation growth to temperature has also been confirmed by Granger causality test. On regional scales, obvious shifts in relationship between vegetation growth and temperature were identified in temperate desert region and rainforest region. Furthermore, by comprehensively analyzing of the relationship between NDVI and climate variables, an overall reduction of impacts of climate factors on vegetation growth was identified over China during recent years, indicating enhanced influences from human associated activities.

Cite this article

HE Bin , CHEN Aifang , JIANG Weiguo , CHEN Ziyue . The response of vegetation growth to shifts in trend of temperature in China[J]. Journal of Geographical Sciences, 2017 , 27(7) : 801 -816 . DOI: 10.1007/s11442-017-1407-3

1 Introduction

Shifts of temperature trends during the 21st century, despite continued increases in atmospheric greenhouse gas concentrations, have been discussed by many recent studies (Boykoff, 2014; Kosaka and Xie, 2013; Trenberth et al., 2014). Many research efforts have concentrated on exploring the causes of these unexpected shifts (Chen and Tung, 2014; Meehl et al., 2014; Thompson et al., 2014); however, whether and how the influence of temperature on terrestrial ecosystems has changed is still poorly understood. Over the past several decades, climate warming has been considered to be the main driving force for vegetation growth in northern terrestrial ecosystems (Nemani et al., 2003). Hence, this raises the question of whether the temperature trend shifts will reduce the positive effect of increased temperature on vegetation growth.
Evidence of the temperature trend shifts have been observed in China (Li et al., 2015). Specifically, from 1998 to 2012, the annual mean maximum and minimum temperature decreased by-0.39°C decade-1 and -0.13°C decade-1 but increased by 0.08°C decade-1 and 0.33°C decade-1 from 1961 to 1997, respectively (Li et al., 2015). Over the past three decades, climate change, especially increasing temperatures, which boosted vegetation growth by enhancing photosynthesis and prolonging the growing season (Ge et al., 2015; Peng et al., 2011; Ding et al., 2015; Li et al., 2013; Liu et al., 2014; Yin et al., 2016; Zhang et al., 2013), has greatly influenced vegetation growth in China. A large body of studies has investigated the dynamics of vegetation growth and their response to climate change based on time series of remote sensing vegetation data (Fang et al., 2004; Peng et al., 2011; Piao et al., 2014; Xu et al., 2012; Zhang et al., 2012; Ding et al., 2007; Zhang et al., 2009). A recent study has suggested a reduction in vegetation growth in China since the late 1990s (Peng et al., 2011), raising the question of whether this trend is associated with the change of the temperature trend beginning from 1998.
Although many studies have explored the response of vegetation growth to temperature in China, the majority of them are static assessment and ignore the nonlinear response of vegetation growth to temperature. Few scholars have focused on the dynamic features of this response over time. Variations in the effects of temperature on vegetation growth have been observed by some biome and region specific studies (Piao et al., 2014; Wu et al., 2012). For example, Piao et al. (2014) suggested a weakened positive relationship between temperature and vegetation activity in northern ecosystems. Understanding the dynamic response of vegetation activity to temperature change is crucial for predicting future vegetation growth. The recent warming shift provides us with an opportunity to investigate variations in plant growth under accelerated and decelerated warming conditions. Hence, the goals of this study are to (1) examine whether the relationship between vegetation growth and temperature has changed before and after temperature shift, and (2) explore the potential mechanism behind the change response of vegetation growth to temperature variation.

2 Data and methods

2.1 Data

The normalized difference vegetation index (NDVI) is a widely used indicator of vegetation growth. In this study, we used the NOAA/AVHRR NDVI GIMMS3g dataset with a spatial resolution of 0.083° and a temporal resolution of 15 days from 1982 through 2011, produced by Global Inventory Monitoring and Modeling Studies (GIMMS) (Tucker et al., 2005). This new GIMMS3g dataset is an improved version of GIMMSg with longer time series and higher accuracy. Comparing to the old one, a main improvement is the use of Sea-viewing Wide Field-of view Sensor (SeaWIFS) for calibrating between sensors and validating the accuracy and consistency of the AVHRR time series (Bhatt et al., 2013; Bhatt et al., 2010; Pinzon and Tucker, 2010). Discontinuities existing in the GIMMSg (Brown et al., 2006; Tucker et al., 2005) had been effectively corrected, and the new dataset was considered to be comparable to the NASA’s Moderate Resolution Imaging Spectroradiometer (MODIS) data with high resolution but shorter time length (Zeng et al., 2013). In line with previous studies, we confined the investigation period to the growing season, from April to October (GS) (Peng et al., 2011; Piao et al., 2011; Tucker et al., 2005; Zhou et al., 2001). The raw NDVI dataset was processed with the following methods. Pixels with an average NDVI value of less than 0.05 from April to October were considered as non-vegetated areas and removed to minimize the impact of soil variations in bare and sparsely vegetated regions (Piao et al., 2011; Zhou et al., 2001). Monthly NDVI datasets were composed using the maximum value composite (MVC) method (Holben, 1986) to further reduce residual cloud contamination and atmospheric and bidirectional effects. The growing season NDVI (GS-NDVI) dataset was obtained by averaging the monthly datasets (Holben, 1986; Fang, 2004). To match with the station observed climate data, we interpolated the grid NDVI to the station locations using the Inverse Distance Weight (IDW) method (Dong et al., 2015). Four grid points surrounding the station were used for interpolating, and the weight is defined as inversely proportional to the distance between the grid point and the station (Wu et al., 2005). Then, the monthly and GS-NDVI sequence data were generated.
The station-based climatic data from 1984 to 2011, including temperature and precipitation, were obtained from China’s Meteorological Data Sharing Service System website (http://cdc.nmic.cn/home.do). This dataset was quality controlled prior to publication. Growing season temperature (GS-T) was averaged from the monthly data (April to October), and growing season precipitation (GS-P) was evaluated as the sum of the monthly precipitation over the same period. The climatic data from 518 out of 726 meteorological stations, which were of high quality and covered the study period from 1984 to 2011, were used in the analysis (Figure 1). The other 208 stations were excluded owing to missing data during the growing season. The monthly radiation dataset with a spatial resolution of 0.5°×0.5° used in this study was obtained from the CRU NCEP (Climate Research Unit and National Centers for Environmental Prediction), version 5.2 (ftp://nacp.ornl.gov/synthesis/2009/ frescati/). Similar to NDVI data, the grid radiation data were also interpolated to stations using IDW method. Monthly atmospheric CO2 concentration records for the period 1984 to 2011 observed at the Mauna Loa station were collected from National Oceanic and Atmospheric Administration, USA (http://www.esrl.noaa.gov/gmd/ccgg/trends/). We ignored the regional differences of CO2 concentration, and used a unified value over China as previous studies (Ukkola et al., 2015; Wang et al., 2014).
To explore the differences in the response of vegetation growth to temperature change, the study period was divided into two time periods: before and after the warming shift since 1998. This division of study period was defined according to a recent analysis of China temperature trend, which found an obvious trend shift since 1998 (Li et al., 2015). This abrupt change of GS-T may be related to the strong 1997/1998 ENSO event caused tropical sea surface temperature anomalous (Qi and Wang, 2012; Wu et al., 2010). As only 14 years (1998-2011) of NDVI data during warming shift were obtained, only the pre-warming shift data from 1984 to 1997 were used in the comparative analysis. Finally, the two selected periods were 1984-1997 and 1998-2011.

2.2 Methods

The relationships between GS-NDVI and corresponding GS-T were examined on national and regional scales using Kendall-tau correlation analysis. The Kendall-tau has advantages over other correlation analysis methods (e.g., Pearson’s correlation analysis) in respect of the smoothness of its distribution and the rapidity with which it approaches normality, thus facilitating significance testing, and in being readily adapted to cases of partial rank correlation (Sillitto, 1947). To explore how the response of vegetation growth to GS-T changed over time, the averaged correlation coefficients between GS-NDVI and GS-T over different periods were calculated by employing 14-year moving windows. The correlation coefficient of a 14-year window was assigned to the year after the central year. For example, 1990 represents the moving window from 1984 to 1997. To further examine the variations in the response of vegetation growth to temperature among regions, the whole country was divided into eight sub-regions according to the distribution of regional representative vegetation type based on Chinese vegetation type division map obtained from the Institute of Botany at the Chinese Academy of Sciences (Figure 1): coniferous forest region (R1), broadleaf-coniferous mixed forest region (R2), deciduous broadleaf forest region (R3), evergreen broadleaf forest region (R4), rainforest region (R5), temperate grassland region (R6), temperate desert region (R7), and Qinghai-Tibet Plateau alpine meadow region (R8). The 518 selected climate stations were classified into eight regions, and the correlations in each region were analyzed. The NDVI trends were tested using Sen’s slope method (Sen, 1968), and climatic variable trends were evaluated with the Mann-Kendall (MK) test (Kendall, 1948). Correlations and trends were considered statistically significant at p < 0.01, p < 0.05 and p < 0.1. Correlations over 10-year and 18-year moving windows were also investigated to examine the sensitivity of correlations to window widths. The data processing and calculations were conducted with the Interactive Data Language (IDL) program, ArcGIS10.1 software, SPSS, and R software.
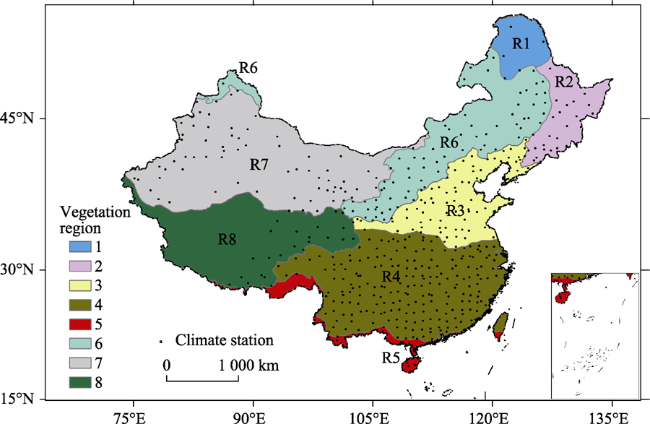
Figure 1 Spatial distribution of studied sub-regions and selected climate stations across China: (1) coniferous forest region, (2) broadleaf-coniferous mixed forest region, (3) deciduous broadleaf forest region, (4) evergreen broadleaf forest region, (5) rainforest region, (6) temperate grassland region, (7) temperate desert region, and (8) Qinghai-Tibet Plateau alpine meadow region
To support the exploring of the potential mechanisms of impact of GS-T and other climate variables eg growing season precipitation (GS-P), solar radiation (GS-R), CO2 concentration (GS-C) on vegetation growth, Granger causality test was employed here to test the causal links between GS-climate variables and GS-NDVI at national and regional scale. Granger causality test is based on the notion of predictability, and was put forward by Granger in 1969 (Granger, 1969; Mosedale and Stephenson, 2005). This test has been widely applied in the study of interactions between atmosphere and biosphere (Kaufmann et al., 2003; Wang et al., 2004). It has been proved to be an effective technique to detect the causal relationship exclusively between climate factors and vegetation growth (Jiang et al., 2015).

3 Results

3.1 Shifts in trend of temperature over China

Figure 2 shows the spatial patterns of trends in GS-T across China during 1984-1997 and 1998-2011. High spatial heterogeneity existed during the two periods. From 1984 to 1997 (Figure 2a), most parts of China experienced significant warming, except for some areas in southern China, where negative trends were observed. The average national annual warming rate was 0.25°C decade-1. From 1998 to 2011 (Figure 2b), an obvious cooling occurred in the northern and northeastern regions of China, whereas the southern and southwestern regions experienced rapid warming. The average national annual warming rate was 0.07°C decade-1 in this period. The above analysis suggests that obvious shifts in trend of growing season temperature indeed happened in China over above two periods. Since 1998, a shift from warming to cooling was observed in northern regions of China, but a reverse shift was found in southern regions.
Figure 2 Changes in growing season annual surface air temperature during 1984-1997 (a) and 1998-2011(b). Red triangles indicate warming trends, and blue ones indicate cooling trends.

3.2 Responses of vegetation growth to shifts of trend of temperature

Figures 3a and 3b illustrate inter-annual variations in GS-NDVI and corresponding GS-T averaged across 518 stations. Although the overall GS-NDVI (R2=0.27, p < 0.01) and GS-T (R2=0.67, p < 0.01) significantly increased over the entire study period, two clear trends for both variables were observed before and after 1998. From 1984 to 1997, GS-NDVI and GS-T both continually increased. In contrast, from 1998 to 2011, GS-NDVI decreased rapidly, rebounded until 2001, and increased sharply in recent years. An obvious slowing down warming during 1998 to 2011 was identified. Interestingly, an accelerated increase in GS-NDVI occurred during the decelerating warming period.
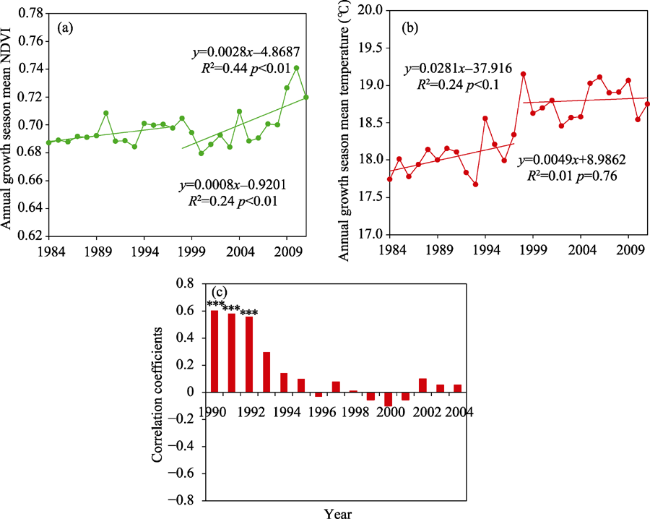
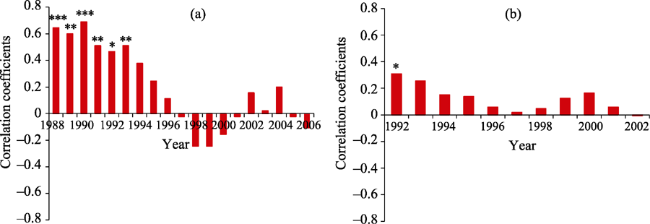
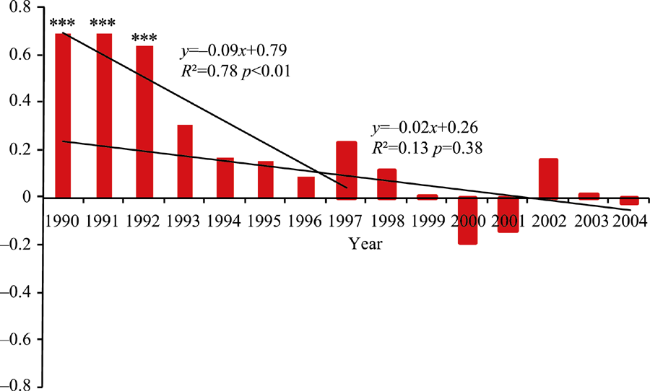
Figure 3 Linear tends of growing season NDVI (a) and corresponding temperature during 1984 to 2011(b); variation of correlation coefficient between growing season NDVI and responding temperature during 1984 to 2011 with 14-year moving windows (c). Correlations with p-values<0.1, <0.05 and <0.01 are marked with asterisks.
Figure 3c shows variations in the correlation coefficient between GS-NDVI and GS-T from 1984 to 2011. Surprisingly, the coefficient significantly decreased (p < 0.01) over total 15 windows, in contrast to the significant positive relationship evidenced during earlier years. From 1984 to 1997, there was a significant positive correlation between GS-NDVI and GS-T (p < 0.01). However, from 1998 to 2011, a negative correlation was observed between the two variables, although it was not statistically significant (p > 0.05). This indicates the sensitivity of vegetation growth to temperature change. The high positive relationship before the warming shift illustrates that increasing temperature promotes vegetation growth, whereas the weak positive relationship during the warming shift indicates a reduced influence of temperature on vegetation growth. The variations in correlation coefficient between GS-NDVI and GS-T calculated based on 10-year and 18-year moving windows (Figure S1) presented similar trends with that based on 14-year windows, suggesting that the width of the moving windows did not affect the trends.
The spatial distribution of the correlation coefficients between GS-NDVI and GS-T during the warming shift (1998-2011) (Figure 4b) changed greatly compared with that during 1984-1997 (Figure 4a). From 1984 to 1997, a positive relationship existed between GS- NDVI and GS-T at 241 stations mainly located in the northeastern, central, and southern regions of China. Negative relationships were mainly identified in western areas. From 1998 to 2011, the negative relationships expanded from northern to southern China, and the positive relationships decreased in southern but expanded in western China.
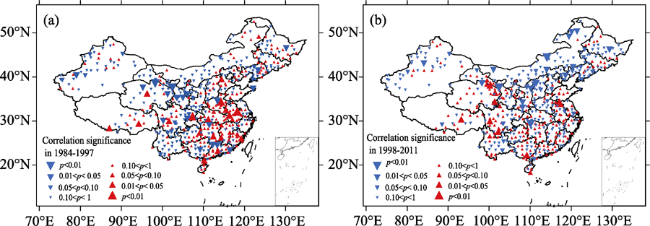
Figure 4 Spatial patterns of correlation coefficient between growing season NDVI and corresponding temperature from 1984 to 1997 (a) and 1998 to 2011 (b). Red triangles indicate positive relationships, and blue ones indicate negative relationships.
In contrast with Figure 2, in the northern and northeastern regions of China, where the warming to cooling shifts occurred, many positive relationships between GS-NDVI and GS-T became negative, indicating the great sensitivity of vegetation growth to temperature change. However, in southern regions of China, where cooling to warming shift occurred, the positive relationships weakened, suggesting a decreased benefit of increasing temperature on vegetation growth. It is interesting that many negative relationships existed during 1984-1998, whereas many positive relationships were evident during 1998-2011 in the Qinghai Tibet Plateau, which experienced accelerated warming during the later period. This suggests that accelerated warming will likely continue to promote vegetation growth. The above analysis suggests that changed responses of vegetation growth to temperature truly happened over two periods at both national and regional scales. In addition, these changes have large spatial differences.

3.3 Response of growth of different vegetation regions to temperature

To further explore the response of vegetation growth to temperature variation, the relationships between vegetation growth and temperature were examined in each sub-region. As shown in Figure 5, except for three obvious continuous warming regions, namely, evergreen broadleaf forest region (R4), temperate grassland region (R7) and Qinghai-Tibet Plateau alpine meadow region (R8), all the other regions experienced slowing warming, among which the broadleaf-coniferous mixed forest region (R2), deciduous broadleaf forest region (R3), and temperate grassland region (R6) and rainforests region (R5) experienced the most prominent shift from warming to cooling. Meanwhile, dramatic increases in vegetation growth occurred in the majority of regions from 1998 to 2011, with the exception of temperate desert region (R7). The finding of the weak increase in vegetation growth in R7 is consistent with previous studies (Peng et al., 2011; Zhao et al., 2011), but uncertainty still exists. Vegetation here is sparsely distributed, and its changes may not be sensitive enough to be detected by remote sensors.
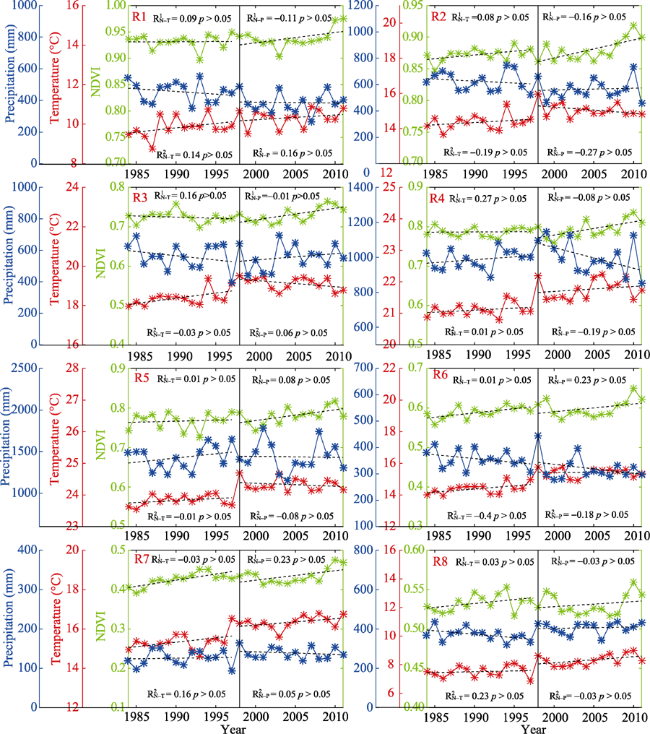
Figure 5 Inter-annual variations of growing season NDVI (green line), mean temperature (red line) and mean precipitation (blue line) in eight sub-regions over the past 28 years. Trend lines denote linear time trends. “R1N-T”, “R1N-P”, “R2N-T” and “R2N-P” are the correlation coefficients between NDVI and temperature and NDVI and precipitation in 1984-1997 and 1998-2011, respectively.
Notable changes in correlations between GS-NDVI and GS-T happened in each vegetation type region, suggesting great sensitivity of vegetation growth to temperature change. Significant relationships were found in R6 and R2. As mentioned above, these two regions both experienced slowing warming shifts. In R2, the relationship changed little between the two periods, and significant negative relationship occurred during the period 1992-2006 and 1993 to 2007 (Figure 6). In R6, the significant positive effects of temperature on vegetation growth that existed during early periods became significant negative in later periods. The variations in trends of correlation coefficients between GS-NDVI and GS-T calculated based on 10-year and 18-year moving windows (Figure S2-S3) were similar to those based on 14-year windows, suggesting the widths of the moving window has no obvious effects on trends of correlations.
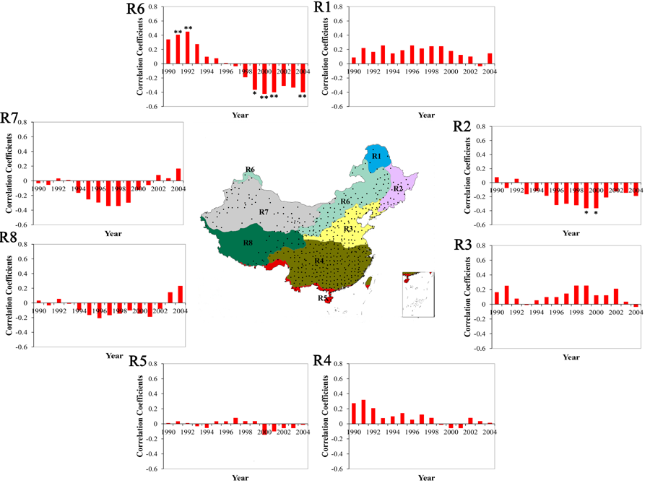
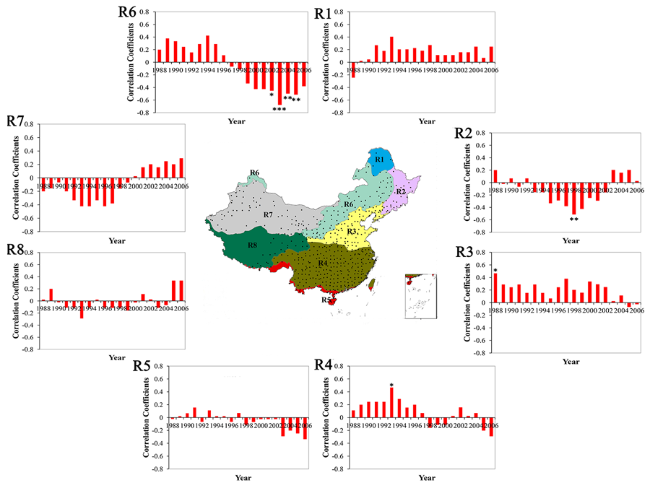
Figure 6 Variations of the relationship between NDVI and temperature with 14-year moving windows in eight sub-regions over the past 28 years. Correlations between NDVI and temperature are spatially heterogeneous. Correlations with p<0.1, <0.05 and <0.01 are marked with asterisks.

3.4 Granger causality cause of temperature to vegetation growth

To investigate the potential mechanism of impacts of temperature to vegetation growth, Granger causality links between GS-T and GS-NDVI were examined during two periods, as shown in Figure 7. GS-T was the positive granger cause of GS-NDVI in 1984-1997 and negative in the later 14 years (Figure 7a1). Despite the negative effect of GS-T on GS-NDVI during 1998-2011 had not been observed by Kendall-tau correlation analysis, it could be detected by Pearson’s correlation analysis, as shown in Figure S4. The significant positive relationship between GS-T and GS-NDVI during 1984-1997 has been converted to weak negative relationship during 1998-2011. The Granger causality test further evidences the changing response of growing season vegetation growth to temperature shifts.
Regionally, during the period 1984-1997, GS-T was the granger cause of GS-NDVI in R5 and R7, with positive and negative correlations, respectively (Figure 7b1). During the period 1998-2011, significant causal link was only found for R5 with negative relationship (Figure 7c1). The above results indicate that, the positive effects of growing season temperature on vegetation growth for rainforests during the first period has been converted to negative impacts in later period, and the negative impacts from temperature observed in temperate deserts in the first period has disappeared in the later period.
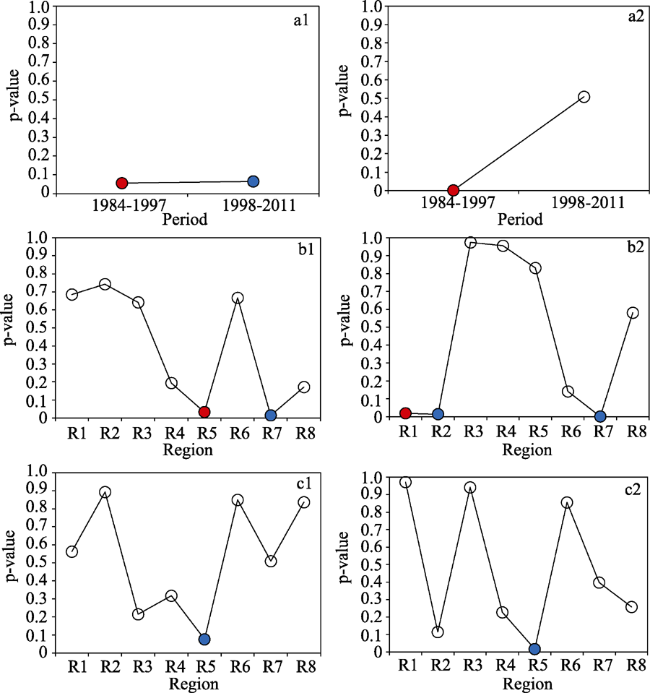
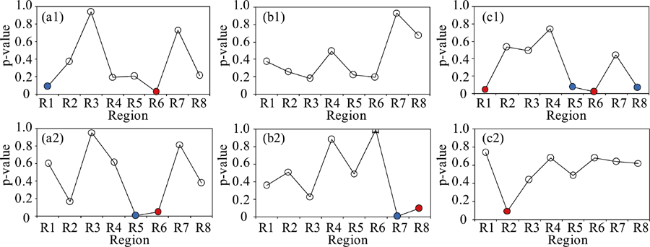
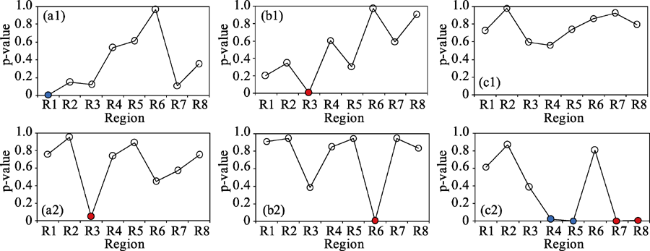
Figure 7 Granger causality tests between growing season NDVI and responding temperature during periods of 1984-1997 and 1998-2011 on national (a) and regional scale (b-c). (a1) GS-T granger cause GS-NDVI and (a2) vice versa; (b1) GS-T granger cause GS-NDVI in 1984-1997 and (b2) vice versa; (c1) GS-T granger cause GS-NDVI in 1998-2011 and (c2) vice versa. Color-circles indicate the p-value below 0.1 which means a significant causal link between variables, and red color means a positive correlation between GS-NDVI and GS-T, while the blue one indicates a negative correlation.
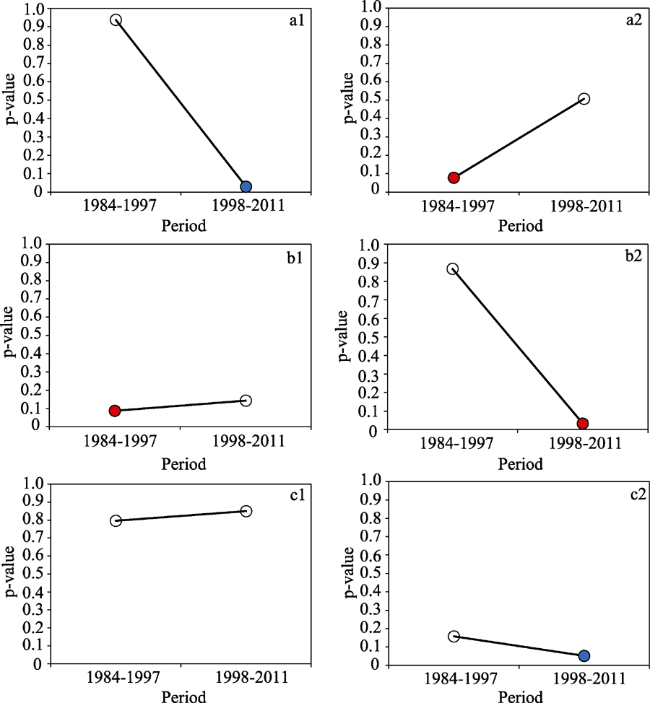
Figure 8 Granger causality tests between growing season NDVI and responding precipitation (a), radiation (b) and CO2 concentration (c) during the periods 1984-1997 and 1998-2011 on national scale. (a1) GS-P granger cause GS-NDVI and (a2) vice versa; (b1) GS-R granger cause GS-NDVI and (b2) vice versa; and (c1) GS-CO2 granger cause GS-NDVI and (c2) vice versa. Color-circles indicated the p-value below 0.1, and red color means a positive correlation between GS-NDVI and GS-climate variables, while the blue one indicates a negative correlation.

4 Discussion

Though the annual and seasonal warming shifts have been investigated by several studies, few of them have focused on its effects during the growing season. According to Wang et al.’s (2010) study, the temperature shift in China was not obvious, and temperature continued to increase from 1998 to 2008. In contrast, Li et al.’s (2015) study reported the opposite result, suggesting that the decrease in the annual mean maximum temperature caused a decrease in the overall mean temperature. This study provides evidence of a reduction in the rate of warming during the growing season in some regions of China over recent decades. A warming to cooling shift was obvious during the growing season in northern and northeastern regions of China, but in southern regions and the Qinghai-Tibet Plateau, an opposite shift was identified. The positive relationship between GS-NDVI and GS-T during 1984-2007 had been greatly weakened during 1998-2011 on national scale. This declined relationship was further verified by Granger causality test, suggesting the high sensitivity of vegetation growth to temperature change.
The results of this study confirm Piao et al.’s (2014) finding that the positive effects of GS-T on vegetation growth above 30°N are weakening. They attributed this phenomenon to increasing drought conditions (Piao et al., 2014). Here, to explore whether the change of response of GS-NDVI to GS-T was caused by the sensitivity of vegetation growth to other climate variables, such as precipitation, solar radiation, CO2 concentration etc. Causal links between GS-NDVI and GS-P, GS-R and GS-CO2 were also detected by Granger causality test to identify the main climate driver of vegetation growth, as shown in Figure 8, Figure S5-S6 and Table 1. The causal relationships between GS climate variables and GS-NDVI vary by periods and by vegetation regions. China as a whole, both GS-T and GS-R were the positive granger causes of GS-NDVI in the period 1984-1997, while the granger causes of GS-NDVI in the latter 14 years (1998-2011) were GS-T and GS-P, with negative correlation. Despite the precipitation experienced little change over China during the past 3 decades, drought extremes increased dramatically. Peng et al.’s (2011) study suggested that enhanced drought stress in north China limited the vegetation growth since the 1990s. Furthermore, comparing to the early period, the weakened impacts from climate variables were found for the later period, indicating increasing influences from other factors, such as human associated activities. Hence, we speculate that the reduced impacts from solar radiation and enhanced influences from precipitation and human activities should be responsible for the shift in response of vegetation growth to recent temperature change on national scale.
Table 1 Results of Granger causality tests from GS-climate variables to GS-NDVI for whole China and eight vegetation type regions
Regions Periods
1984-1997 1998-2011
China as a whole T(+), R(+) T(-), P(-)
R1 (Coniferous forest region) P(-), C(+) P(-)
R2 (Broadleaf-coniferous mixed forest region)
R3 (Deciduous broadleaf forest region) R(+)
R4 (Evergreen broadleaf forest region)
R5 (Rainforest region) T(+), C(-) T(-)
R6 (Temperate grasslands region) P(+), C(+)
R7 (Temperate desert region) T(-)
R8 (Qinghai-Tibet Plateau alpine meadow region) C(-)
Controlling climate factors of vegetation growth were also identified in each vegetation type region. As reported by previous studies (Fang et al., 2004; Peng et al., 2011; Zhou et al., 2014), driving forces of vegetation growth differ greatly over China. For example, GS-T was the granger causes of GS-NDVI in R5 and R7, whereas GS-P and GS-CO2 were granger causes of GS-NDVI in R1 and R6 during 1984-1997. In light of previous knowledge, R5 is temperature constrained vegetation growth region (Fang et al., 2004; Peng et al., 2011), the shift of GS-T effect on GS-NDVI from positive to negative can be explained as follows: a certain degree of temperature rise is advantageous to the growth and development; however, with the continuous warming over the past centuries, the high temperature may reach and exceed a threshold for current vegetation and will be harmful for vegetation growth (Shaver et al., 2000). For example, a study on the response of grassland to climate change in North Arizona indicated a nonlinear response of vegetation growth to warming during initial stages; but after a certain time period, the positive effects of warming on vegetation growth declined progressively due to warming related plant community alteration, soil nitrogen turnover, etc. (Wu et al., 2012). In addition, vegetation growth should also be depressed by warming related increasing drought stress (Peng et al., 2011; Xu et al., 2012). R7 is a typical water limited vegetation growth area. The disappeared negative influence of temperature on vegetation growth in this region should be attributed to the releasing warming condition, which should alleviate warming-induced drought stress.
The above analysis also indicates the increase impacts from human associated activities. Even in the early period, vegetation activities in R2, R3 and R4 seem not to be driven by studied climate variable. This can be supported by a recent investigation that claimed socioeconomic factors, such as population and GDP, were main driving forces of vegetation growth in China during 2000-2010 ( et al., 2015). Other human activities such as ecological restoration projects, land-use changes, and agricultural activities may also influence the relationship between vegetation growth and climate variables. Over the past several decades, Chinese government carried out a series of ecological engineering programs (e.g. Three-North Shelter Forest Program, Grain for Green Program, Beijing-Tianjin Sand Source Control Program), and a majority of them was launched since 2000. Their positive effects on vegetation growth have been confirmed by monitoring studies (Piao et al., 2005; Xiao, 2014). Urban expansion should also be a reason for regional vegetation change. During the past 20 years, urban areas increased by approximately 2-fold, and most rapid expansion was observed in coastal provinces (Wang et al., 2012). The Yangtze River Delta is one of the areas experienced most rapid urbanization, but the incomplete urbanization increased vegetation degradation in this region (Hou et al., 2014). Monitoring study showed that urbanization had caused deterioration of urban vegetation across most large cities in China (Sun et al., 2011). It needs to be noted that impacts from urbanization on vegetation growth were usually confined in local scales, but could not be a major driver of national level vegetation change.
In addition, strong impacts of vegetation conditions on climate were also observed based on Granger causality test, suggesting interactions between climate factors and vegetation growth (Figures 7 and 8, and Figure S5-S6). Taking GS-T as an example, during 1984-1997, GS-NDVI was a significant positive granger cause of GS-T, illustrating enhanced vegetation activities should also be responsible for the surface temperature increase during this period. They can be explained by the stronger warming effect caused by decreased surface albedo associated with enhanced vegetation than the cooling effect of increased evapotranspiration (Loarie et al., 2011). However, a stronger cooling effect of surface greening had been also observed in the Qinghai-Tibet Plateau and north China (Shen et al., 2015; Jiang et al., 2015). This inverse NDVI-T relationship should partly contribute to the observed weakening relationship between two variables, especially for growing season (Ge et al., 2015; Shen et al., 2015).

5 Conclusions

Over the past three decades, China has experienced significant warming, which was considered as a great contribution to China’s greening. However, this warming trend is nonlinear with great shifts, and how vegetation growth response to temperature trend shift is unclear. This study comprehensively examined the response of vegetation growth to shift in temperature trend and explored the potential mechanism under the changed correlation between temperature and vegetation growth. The main results are listed as follows:
1) Obvious shifts in growing season temperature trends were observed over China between periods of 1984-1997 and 1998-2011. Warming to cooling shifts were found in north and northeast China, with cooling to warming shifts in south and west China.
2) China as a whole, the positive correlation between growing season temperature and vegetation had been significantly weakened over the past three decades, suggesting declined sensitivities of vegetation growth to temperature.
3) Through the comprehensive analysis of growing season vegetation growth and corresponding climatic variables between periods of 1984-1997 and 1998-2011, the reduced impacts from solar radiation and enhanced influences from precipitation and human activities should be responsible for the shift in response of vegetation growth to recent temperature change on national scale.
Uncertainties remain in results from this study, which may be caused by following reasons: firstly, despite the reliability of AVHRR NDVI3g dataset used here has been validated by comparing with other remote sensing based dataset (eg. MODIS) by many studies (Zeng et al., 2013), satellite-based data always includes uncertainty due to data processing algorithm, sun-sensor-surface viewing geometries, atmospheric conditions, and sensor performance (Jiang et al., 2013). Further validations relying on field observed vegetation conditions (e.g., NPP) are still needed. Secondly, uncertainties may also be produced by methods used, for example, errors associated with divergence data sources, grid data interpolation, the choice of study windows etc. Thirdly, in this study, we only considered responses of NDVI to growing season climate change, and ignored influences from pre-growing season climate conditions (Wu et al., 2015). Fourthly, the complex mechanisms behind the vegetation-climate interconnections have not been fully understood which leads to the difficulty in distinguishing and quantifying this bi-direction effect. Considering the above-mentioned issues, more in-depth investigations are still needed.

Additional information

Supplementary information accompanies this paper online.

Supporting Information (SI)

Figure S1 Variation of correlation coefficient between growing season NDVI and responding temperature during 1984 to 2011 with 10-year moving windows (a) 18-year moving windows (b). Correlations with p-values<0.1, <0.05 and <0.01 are marked with asterisks.
Figure S2 Variation of the relationship between NDVI and temperature with 10-year moving windows in eight sub-regions over the past 28 years. The correlations between NDVI and temperature are spatially heterogeneous. Correlations with p-values<0.1, <0.05 and <0.01 are marked with asterisks.
Figure S3 Variation of the relationship between NDVI and temperature with 18-year moving windows in eight sub-regions over the past 28 years. The correlations between NDVI and temperature are spatially heterogeneous. Correlations with p-values<0.1, <0.05 and <0.01 are marked with asterisks.
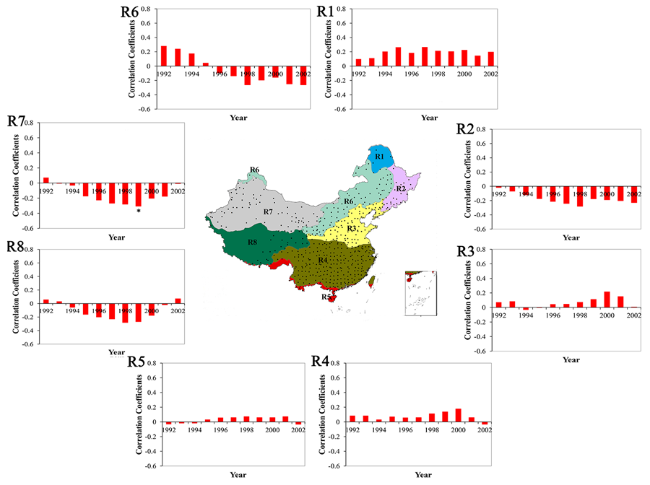
Figure S4 Variation of the relationship between NDVI and precipitation with 14-year moving windows in eight sub-regions over the past 28 years. The correlations between NDVI and precipitation are spatially heterogeneous. Correlations with p-values<0.1, <0.05 and <0.01 are marked with asterisks.
Figure S5 Granger causality tests between growing season NDVI and responding precipitation (a), radiation (b) and CO2 concentration (c) in 1984-1997 on regional scale. (a1) GS-P granger cause GS-NDVI and (a2) vice versa; (b1) GS-R granger cause GS-NDVI and (b2) vice versa; and (c1) GS-CO2 granger cause GS-NDVI and (c2) vice versa. Color-circles indicated the p-value below 0.1, and red color means a positive correlation between GS-NDVI and GS- climate variables, while the blue one indicates a negative correlation.
Figure S6 Granger causality tests between growing season NDVI and responding precipitation (a), radiation (b) and CO2 concentration (c) in 1998-2011 on regional scale. (a1) GS-P granger cause GS-NDVI and (a2) vice versa; (b1) GS-R granger cause GS-NDVI and (b2) vice versa; and (c1) GS-CO2 granger cause GS-NDVI and (c2) vice versa. Color-circles indicated the p-value below 0.1, and red color means a positive correlation between GS-NDVI and GS- climate variables, while the blue one indicates a negative correlation.

The authors have declared that no competing interests exist.

[1]
Bhatt U S, Walker D A, Raynolds M Ket al., 2010. Circumpolar Arctic tundra vegetation change is linked to sea ice decline.Earth Interactions, 14(8): 1-20.

[2]
Bhatt U S, Walker D A, Raynolds M Ket al., 2013. Recent declines in warming and vegetation greening trends over Pan-Arctic Tundra.Remote Sensing, 5(9): 4229-4254.Vegetation productivity trends for the Arctic tundra are updated for the 1982-2011 period and examined in the context of land surface temperatures and coastal sea ice. Understanding mechanistic links between vegetation and climate parameters contributes to model advancements that are necessary for improving climate projections. This study employs remote sensing data: Global Inventory Modeling and Mapping Studies (GIMMS) Maximum Normalized Difference Vegetation Index (MaxNDVI), Special Sensor Microwave Imager (SSM/I) sea-ice concentrations, and Advanced Very High Resolution Radiometer (AVHRR) radiometric surface temperatures. Spring sea ice is declining everywhere except in the Bering Sea, while summer open water area is increasing throughout the Arctic. Summer Warmth Index (SWIsum of degree months above freezing) trends from 1982 to 2011 are positive around Beringia but are negative over Eurasia from the Barents to the Laptev Seas and in parts of northern Canada. Eastern North America continues to show increased summer warmth and a corresponding steady increase in MaxNDVI. Positive MaxNDVI trends from 1982 to 2011 are generally weaker compared to trends from 1982-2008. So to better understand the changing trends, break points in the time series were quantified using the Breakfit algorithm. The most notable break points identify declines in SWI since 2003 in Eurasia and 1998 in Western North America. The Time Integrated NDVI (TI-NDVI, sum of the biweekly growing season values of MaxNDVI) has declined since 2005 in Eurasia, consistent with SWI declines. Summer (June-August) sea level pressure (slp) averages from 1999-2011 were compared to those from 1982-1998 to reveal higher slp over Greenland and the western Arctic and generally lower pressure over the continental Arctic in the recent period. This suggests that the large-scale circulation is likely a key contributor to the cooler temperatures over Eurasia through increased summer cloud cover and warming in Eastern North America from more cloud-free skies.

DOI

[3]
Boykoff M T, 2014. Media discourse on the climate slowdown.Nature Climate Change, 4(3): 156-158.The article discusses media discourses regarding the slowdown of global warming. Topics discussed include the effects of framing processes on marginalizing some media discourses that sought to explain the slowdown, such as an opinion-editorial by Bob Carter in "The Telegraph" newspaper, the increase of media coverage regarding the slowdown, and the differences in the definitions of climate change and global warming.

DOI

[4]
Brown M T, Pinzón J E, Didan Ket al., 2006. Evaluation of the consistency of long-term NDVI time series derived from AVHRR, SPOT-vegetation, SeaWiFS, MODIS, and Landsat ETM+ sensors.IEEE Transactions on Geoscience and Remote Sensing, 44(7): 1787-1793.This paper evaluates the consistency of the Normalized Difference Vegetation Index (NDVI) records derived from Advanced Very High Resolution Radiometer (AVHRR), SPOT-Vegetation, SeaWiFS, Moderate Resolution Imaging Spectroradiometer, and Landsat ETM+. We used independently derived NDVI from atmospherically corrected ETM+ data at 13 Earth Observation System Land Validation core sites, eight locations of drought, and globally aggregated one-degree data from the four coarse resolution sensors to assess the NDVI records agreement. The objectives of this paper are to: 1) compare the absolute and relative differences of the vegetation signal across these sensors from a user perspective, and, to a lesser degree, 2) evaluate the possibility of merging the AVHRR historical data record with that of the more modern sensors in order to provide historical perspective on current vegetation activities. The statistical and correlation analyses demonstrate that due to the similarity in their overall variance, it is not necessary to choose between the longer time series of AVHRR and the higher quality of the more modern sensors. The long-term AVHRR-NDVI record provides a critical historical perspective on vegetation activities necessary for global change research and, thus, should be the basis of an intercalibrated, sensor-independent NDVI data record. This paper suggests that continuity is achievable given the similarity between these datasets

DOI

[5]
Chen X Y, Tung K K, 2014. Varying planetary heat sink led to global-warming slowdown and acceleration.Science, 345(6199): 897-903.A vacillating global heat sink at intermediate ocean depths is associated with different climate regimes of surface warming under anthropogenic forcing: The latter part of the 20th century saw rapid global warming as more heat stayed near the surface. In the 21st century, surface warming slowed as more heat moved into deeper oceans. In situ and reanalyzed data are used to trace the pathways of ocean heat uptake. In addition to the shallow La Ni09a–like patterns in the Pacific that were the previous focus, we found that the slowdown is mainly caused by heat transported to deeper layers in the Atlantic and the Southern oceans, initiated by a recurrent salinity anomaly in the subpolar North Atlantic. Cooling periods associated with the latter deeper heat-sequestration mechanism historically lasted 20 to 35 years.

DOI PMID

[6]
Ding M J, Li L H, Zhang Y Let al., 2015. Start of vegetation growing season on the Tibetan Plateau inferred from multiple methods based on GIMMS and SPOT NDVI data.Journal of Geographical Sciences, 25(2): 131-148.In this study, we have used four methods to investigate the start of the growing season (SGS) on the Tibetan Plateau (TP) from 1982 to 2012, using Normalized Difference Vegetation Index (NDVI) data obtained from Global Inventory Modeling and Mapping Studies (GIMSS, 1982–2006) and SPOT VEGETATION (SPOT-VGT, 1999–2012). SGS values estimated using the four methods show similar spatial patterns along latitudinal or altitudinal gradients, but with significant variations in the SGS dates. The largest discrepancies are mainly found in the regions with the highest or the lowest vegetation coverage. Between 1982 and 1998, the SGS values derived from the four methods all display an advancing trend, however, according to the more recent SPOT VGT data (1999–2012), there is no continuously advancing trend of SGS on the TP. Analysis of the correlation between the SGS values derived from GIMMS and SPOT between 1999 and 2006 demonstrates consistency in the tendency with regard both to the data sources and to the four analysis methods used. Compared with other methods, the greatest consistency between the in situ data and the SGS values retrieved is obtained with Method 3 (Threshold of NDVI ratio). To avoid error, in a vast region with diverse vegetation types and physical environments, it is critical to know the seasonal change characteristics of the different vegetation types, particularly in areas with sparse grassland or evergreen forest.

DOI

[7]
Ding M J, Zhang Y L, Liu L Set al., 2007. The relationship between NDVI and precipitation on the Tibetan Plateau.Journal of Geographical Sciences, 17(3): 259-268.The temporal and spatial changes of NDVI on the Tibetan Plateau, as well as the relationship between NDVI and precipitation, were discussed in this paper, by using 8-km resolution multi-temporal NOAA AVHRR-NDVI data from 1982 to 1999. Monthly maximum NDVI and monthly rainfall were used to analyze the seasonal changes, and annual maximum NDVI, annual effective precipitation and growing season precipitation (from April to August) were used to discuss the interannual changes. The dynamic change of NDVI and the corre- lation coefficients between NDVI and rainfall were computed for each pixel. The results are as follows: (1) The NDVI reached the peak in growing season (from July to September) on the Tibetan Plateau. In the northern and western parts of the plateau, the growing season was very short (about two or three months); but in the southern, vegetation grew almost all the year round. The correlation of monthly maximum NDVI and monthly rainfall varied in different areas. It was weak in the western, northern and southern parts, but strong in the central and eastern parts. (2) The spatial distribution of NDVI interannual dynamic change was different too. The increase areas were mainly distributed in southern Tibet montane shrub-steppe zone, western part of western Sichuan-eastern Tibet montane coniferous forest zone, western part of northern slopes of Kunlun montane desert zone and southeastern part of southern slopes of Himalaya montane evergreen broad-leaved forest zone; the decrease areas were mainly distributed in the Qaidam montane desert zone, the western and northern parts of eastern Qinghai-Qilian montane steppe zone, southern Qinghai high cold meadow steppe zone and Ngari montane desert-steppe and desert zone. The spatial distribution of correlation coeffi- cient between annual effective rainfall and annual maximum NDVI was similar to the growing season rainfall and annual maximum NDVI, and there was good relationship between NDVI and rainfall in the meadow and grassland with medium vegetation cover, and the effect of rainfall on vegetation was small in the forest and desert area.

DOI

[8]
Dong L, Zhang M, Wang S, et al., 2015. The freezing level height in the Qilian Mountains, northeast Tibetan Plateau based on reanalysis data and observations, 1979-2012.Quaternary International, 380: 60-67.The long-term changes of summer freezing level heights in the Qilian Mountains, northeast Tibetan Plateau from 1979 to 2012 is analyzed by using radiosonde data and two global analysis datasets including European Centre for Medium-Range Weather Forecasts re-analysis-Interim (ERA) and National Centers for Environmental Prediction/Department of Energy Reanalysis 2 (NCEP). The freezing level heights in the Qilian Mountains generally show an increasing trend from high latitude to low latitude as well as from low altitude to high altitude. The trend magnitude of ERA during 1979 2012 is approximately 54m per decade ( p <0.01) which is slightly larger than that derived from radiosonde-based series (51m per decade, p <0.01), and NCEP shows a relatively lower trend by 40m per decade ( p <0.05). The correlation between free-air freezing level height and surface air temperature is greatly related with the altitude of stations, and the correlation coefficients are generally larger in alpine station than those in plain stations. Glaciers in the Hexi drainage basin at the northern slope have experienced larger increasing trend magnitudes, which may significantly impact the regional hydrological process.

DOI

[9]
Fang J Y, Piao S L, He J Set al., 2004. Increasing terrestrial vegetation activity in China, 1982-1999. Science in China Series C: Life Sciences, 47(3): 229-240.Variations in vegetation activity during the past 18 years in China were investigated using the normalized difference vegetation index (NDVI) derived from the 3rd generation time series dataset of NOAA-AVHRR from 1982 to 1999. In order to eliminate the effects of non-vegetation factors, we characterized areas with NDVI < 0.1 as “sparsely vegetated areas” and areas with NDVI ≥0.1 as “vegetated areas”. The results showed that increasing NDVI trends were evident, to varying extents, in almost all regions in China in the 18 years, indicating that vegetation activity has been rising in recent years in these regions. Compared to the early 1980s, the vegetated area increased by 3.5% by the late 1990s, while the sparsely vegetated area declined by 18.1% in the same period. The national total mean annual NDVI increased by 7.4% during the study period. Extended growing seasons and increased plant growth rates accounted for the bulk of these increases, while increases in temperature and summer rainfall, and strengthening agricultural activity were also likely important factors. NDVI changes in China exhibited relatively large spatial heterogeneity; the eastern coastal regions experienced declining or indiscernibly rising trends, while agricultural regions and western China experienced marked increases. Such a pattern was due primarily to urbanization, agricultural activity, regional climate characteristics, and different vegetation responses to regional climate changes.

DOI PMID

[10]
Ge Q S, Wang H J, Dai J H, 2015. Phenological response to climate change in China: A meta-analysis.Global Change Biology, 21(1): 265-274.Abstract <p>The change in the phenology of plants or animals reflects the response of living systems to climate change. Numerous studies have reported a consistent earlier spring phenophases in many parts of middle and high latitudes reflecting increasing temperatures with the exception of China. A systematic analysis of Chinese phenological response could complement the assessment of climate change impact for the whole Northern Hemisphere. Here, we analyze 1263 phenological time series (1960–2011, with 20+ years data) of 112 species extracted from 48 studies across 145 sites in China. Taxonomic groups include trees, shrubs, herbs, birds, amphibians and insects. Results demonstrate that 90.8% of the spring/summer phenophases time series show earlier trends and 69.0% of the autumn phenophases records show later trends. For spring/summer phenophases, the mean advance across all the taxonomic groups was 2.7502days decade611 ranging between 2.11 and 6.1102days decade611 for insects and amphibians, respectively. Herbs and amphibians show significantly stronger advancement than trees, shrubs and insect. The response of phenophases of different taxonomic groups in autumn is more complex: trees, shrubs, herbs and insects show a delay between 1.93 and 4.8402days decade611, while other groups reveal an advancement ranging from 1.10 to 2.1102days decade611. For woody plants (including trees and shrubs), the stronger shifts toward earlier spring/summer were detected from the data series starting from more recent decades (1980s–2000s). The geographic factors (latitude, longitude and altitude) could only explain 9% and 3% of the overall variance in spring/summer and autumn phenological trends, respectively. The rate of change in spring/summer phenophase of woody plants (1960s–2000s) generally matches measured local warming across 49 sites in China ( R02 = 02 610.33, P

DOI PMID

[11]
Granger C W J, 1969. Investigating causal relations by econometric models and crossspectral methods.Econometrica, 37(3): 424-438.There occurs on some occasions a difficulty in deciding the direction of causality between two related variables and also whether or not feedback is occurring. Testable definitions of causality and feedback are proposed and illustrated by use of simple two-variable models. The important problem of apparent instantaneous causality is discussed and it is suggested that the problem often arises due to slowness in recording information or because a sufficiently wide class of possible causal variables has not been used. It can be shown that the cross spectrum between two variables can be decomposed into two parts, each relating to a single causal arm of a feedback situation. Measures of causal lag and causal strength can then be constructed. A generalisation of this result with the partial cross spectrum is suggested.

DOI

[12]
Holben B N, 1986. Characteristics of maximum-value composite images from temporal AVHRR data.International Journal of Remote Sensing, 7(11): 1417-1434.ABSTRACT Red and near-infrared satellite data from the Advanced Very High Resolution Radiometer sensor have been processed over several days and combined to produce spatially continuous cloud-free imagery over large areas with sufficient temporal resolution to study green-vegetation dynamics. The technique minimizes cloud contamination, reduces directional reflectance and off-nadir viewing effects, minimizes sun-angle and shadow effects, and minimizes aerosol and water-vapor effects. The improvement is highly dependent on the state of the atmosphere, surface-cover type, and the viewing and illumination geometry of the sun, target and sensor. An example from southern Africa showed an increase of 40 percent from individual image values tothe final composite image. Limitations associated with the technique are discussed, and recommendations are given to improve this approach.

DOI

[13]
Hou M T, Hu Y H, He Y T, 2014. Modifications in vegetation cover and surface albedo during rapid urbanization: A case study from South China.Environmental Earth Sciences, 72(5): 1659-1666.The green vegetation fraction (GVF) and surface albedo are important land surface parameters often used for validation of climate and land surface models that are influenced largely by environmental gradients and human activities. In this study, fine resolution GVF and albedo values derived from Landsat Thematic Mapper/Enhanced Thematic Mapper Plus images from 1990 to 2000 were used to examine the relationship of both GVF and albedo values to the spatial gradients of parameters related to dramatic urbanization in the Greater Guangzhou metropolitan area, Guangdong Province, in South China. Moderate resolution GVF and albedo datasets derived from the MODIS Collection 5 product were used to analyze the seasonal variation of GVF and albedo with rapid urban expansion from 2001 to 2007. The results show that the shortwave albedo had a clear declining trend from the urban center to natural land in 1990. However, no obvious trend in shortwave albedo change was observed along urban ural gradients caused by the expansion of low-albedo urban buildings and more heterogeneous land cover patterns in 2000. A threshold of GVF (~0.21) was estimated for determining the change of albedo associated with vegetation fraction. Vegetation cover modified by urban expansion changed surface reflectance and influenced the surface energy balance. It is suggested that a large portion of energy absorbed in an urban area is likely to be converted to thermal energy that heating up is near the surface and emitted as longwave radiation.

DOI

[14]
Jiang B, Liang S L, Yuan W P, 2015. Observational evidence for impacts of vegetation change on local surface climate over northern China using the Granger causality test. Journal of Geophysical Research: Biogeosciences, 120(1): 1-12.Abstract The three-north region in China (northeastern, northwestern, and northern China) is one of the most environmentally vulnerable regions in the country. To improve the local natural environment, the Chinese government launched the Three-North Shelter Forest Program, one of the largest afforestation/reforestation programs in the world. This program has led to significant changes in vegetation. Although many studies have evaluated the impacts of vegetation changes on local climate in this region, their results are highly inconsistent. In this study, evidence for local monthly climate impacts of vegetation change was investigated using remotely sensed data and ground meteorological measurements during the growing season (May to September) from 1982 to 2011 using the bivariate Granger causality test. The results showed that the local near-surface climate is sensitive mostly to vegetation changes characterized by the normalized difference vegetation index (NDVI) in arid and semiarid regions and that vegetation plays a more important role in influencing hydroclimate in the arid/semiarid zones than in other zones, which has great implications for water resources in this dry region. Moreover, NDVI changes in northeastern China have a significantly negative influence on air tembut no other climatic variables, whereas the test results in northern China is not as objective as the other zones due to the rapid urbanization. All these results suggest that the local climate is very sensitive to the variations in vegetation in arid and semiarid regions, so extra caution should be taken when planting trees in this area.

DOI

[15]
Jiang N, Zhu W Q, Zheng Z Tet al., 2013. A comparative analysis between GIMSS NDVIg and NDVI3g for monitoring vegetation activity change in the Northern Hemisphere during 1982-2008.Remote Sensing, 5(8): 4031-4044.The long-term Normalized Difference Vegetation Index (NDVI) time-series data set generated from the Advanced Very High Resolution Radiometers (AVHRR) has been widely used to monitor vegetation activity change. The third version of NDVI (NDVI3g) produced by the Global Inventory Modeling and Mapping Studies (GIMMS) group was released recently. The comparisons between the new and old versions should be conducted for linking existing studies with future applications of NDVI3g in monitoring vegetation activity change. Based on simple and piecewise linear regression methods, this study made a comparative analysis between NDVIg and NDVI3g for monitoring vegetation activity change and its responses to climate change in the middle and high latitudes of the Northern Hemisphere during 1982-2008. Our results indicated that there were large differences between NDVIg and NDVI3g in the spatial patterns for both the overall changing trends and the timing of Turning Points (TP) in NDVI time series, which spread over almost the entire study region. The average NDVI trend from NDVI3g was almost twice as great as that from NDVIg and the detected average timing of TP from NDVI3g was about one year later. Although the general spatial patterns were consistent between two data sets for detecting the responses of growing-season NDVI to temperature and precipitation changes, there were large differences in the response magnitude, with a higher response magnitude to temperature in NDVI3g and an opposite response to precipitation change for the two data sets. These results demonstrated that the NDVIg data set may underestimate the vegetation activity change trend and its response to climate change in the middle and high latitudes of the Northern Hemisphere during the past three decades.

DOI

[16]
Kaufmann R K, Zhou L, Myneni Ret al., 2003. The effect of vegetation on surface temperature: A statistical analysis of NDVI and climate data.Geophysical Research Letters, 30(22): 2147.We use statistical techniques to quantify the effect of interannual variations in vegetation within land covers on surface temperature in North America and Eurasia from satellite measures of surface greenness and ground based meteorological observations. During the winter, reductions in the extent of snow cover cause (in a statistical sense) temperature to rise. During the summer, increases in terrestrial vegetation within land covers cause (in a statistical sense) temperature to fall. Temperature-induced increases in vegetation have slowed increases in surface temperature, but this feedback may be limited by the range over which temperature has a positive effect on vegetation.

DOI

[17]
Kendall M G, 1948. Rank Correlation Methods. London, UK: Charles Griffin, 108.

[18]
Kosaka K, Xie S P, 2013. Recent global-warming hiatus tied to equatorial Pacific surface cooling.Nature, 501(7467): 403-407.Abstract Despite the continued increase in atmospheric greenhouse gas concentrations, the annual-mean global temperature has not risen in the twenty-first century, challenging the prevailing view that anthropogenic forcing causes climate warming. Various mechanisms have been proposed for this hiatus in global warming, but their relative importance has not been quantified, hampering observational estimates of climate sensitivity. Here we show that accounting for recent cooling in the eastern equatorial Pacific reconciles climate simulations and observations. We present a novel method of uncovering mechanisms for global temperature change by prescribing, in addition to radiative forcing, the observed history of sea surface temperature over the central to eastern tropical Pacific in a climate model. Although the surface temperature prescription is limited to only 8.2% of the global surface, our model reproduces the annual-mean global temperature remarkably well with correlation coefficient r = 0.97 for 1970-2012 (which includes the current hiatus and a period of accelerated global warming). Moreover, our simulation captures major seasonal and regional characteristics of the hiatus, including the intensified Walker circulation, the winter cooling in northwestern North America and the prolonged drought in the southern USA. Our results show that the current hiatus is part of natural climate variability, tied specifically to a La-Ni a-like decadal cooling. Although similar decadal hiatus events may occur in the future, the multi-decadal warming trend is very likely to continue with greenhouse gas increase.

DOI PMID

[19]
Lü Y H, Zhang L W, Feng X Met al., 2015. Recent ecological transitions in China: Greening, browning, and influential factors. Scientific Reports, 5.

[20]
Li Q X, Yang S, Xu W Het al., 2015. China experiences the recent warming hiatus.Geophysical Research Letters, 42(3): 889-898.Abstract Based on the homogenized data set, we analyze changes in mean temperature and some extreme temperature indices over China since 1961 and especially during the recent warming hiatus period (1998–2012) in a global average context. The result shows that the decrease of annual mean maximum has contributed most to the decreases in overall mean temperature and in diurnal temperature range (DTR) during the warming hiatus period. In most parts of China except the southwest, the summer mean maximum temperature ( T xS) shows the largest increase, while the winter mean minimum temperature ( T nW) indicates slight cooling trends. These changes have augmented the seasonal cycle and increased the likelihood of extreme warm and cold events. Further analyses reveal that the increases in T xS are significantly correlated with concurrent increases in solar radiation. In southwest China, the annual mean temperature, T xS, T nW, and DTR increased during 1998–2012, possibly related to increased dryness in this region during the hiatus period.

DOI

[21]
Li S S, Yan J P, Liu X Yet al., 2013. Response of vegetation restoration to climate change and human activities in Shaanxi-Gansu-Ningxia Region.Journal of Geographical Sciences, 23(1): 98-112.

DOI

[22]
Liu X F, Zhang J S, Zhu X Fet al., 2014. Spatiotemporal changes in vegetation coverage and its driving factors in the Three-River Headwaters Region during 2000-2011.Journal of Geographical Sciences, 24(2): 288-302.The Three-River Headwaters Region(TRHR), which is the source area of the Yangtze River, Yellow River, and Lancang River, is of key importance to the ecological security of China. Because of climate changes and human activities, ecological degradation occurred in this region. Therefore, "The nature reserve of Three-River Source Regions" was established, and "The project of ecological protection and construction for the Three-River Headwaters Nature Reserve" was implemented by the Chinese government. This study, based on MODIS-NDVI and climate data, aims to analyze the spatiotemporal changes in vegetation coverage and its driving factors in the TRHR between 2000 and 2011, from three dimensions. Linear regression, Hurst index analysis, and partial correlation analysis were employed. The results showed the following:(1) In the past 12 years(2000 2011), the NDVI of the study area increased, with a linear tendency being 1.2%/10a, of which the Yangtze and Yellow River source regions presented an increasing trend, while the Lancang River source region showed a decreasing trend.(2) Vegetation coverage presented an obvious spatial difference in the TRHR, and the NDVI frequency was featured by a bimodal structure.(3) The area with improved vegetation coverage was larger than the degraded area, being 64.06% and 35.94%, respectively during the study period, and presented an increasing trend in the north and a decreasing trend in the south.(4) The reverse characteristics of vegetation coverage change are significant. In the future, degradation trends will be mainly found in the Yangtze River Basin and to the north of the Yellow River, while areas with improving trends are mainly distributed in the Lancang River Basin.(5) The response of vegetation coverage to precipitation and potential evapotranspiration has a time lag, while there is no such lag in the case of temperature.(6) The increased vegetation coverage is mainly attributed to the warm-wet climate change and the implementation of the ecological protection project.

DOI

[23]
Loarie S R, Lobell D B, Asner G Pet al., 2011. Direct impacts on local climate of sugar-cane expansion in Brazil. Nature Climate Change, 1(2): 105-109.The increasing global demand for biofuels will require conversion of conventional agricultural or natural ecosystems. Expanding biofuel production into areas now used for agriculture reduces the need to clear natural ecosystems, leading to indirect climate benefits through reduced greenhouse-gas emissions and faster payback of carbon debts. Biofuel expansion may also cause direct, local climate changes by altering surface albedo and evapotranspiration, but these effects have been poorly documented. Here we quantify the direct climate effects of sugar-cane expansion in the Brazilian Cerrado, on the basis of maps of recent sugar-cane expansion and natural-vegetation clearance combined with remotely sensed temperature, albedo and evapotranspiration over a 1.9millionkmarea. On a regional basis for clear-sky daytime conditions, conversion of natural vegetation to a crop/pasture mosaic warms the cerrado by an average of 1.55 (1.45-1.65) C, but subsequent conversion of that mosaic to sugar cane cools the region by an average of 0.93 (0.78-1.07) C, resulting in a mean net increase of 0.6 C. Our results indicate that expanding sugar cane into existing crop and pasture land has a direct local cooling effect that reinforces the indirect climate benefits of this land-use option.

DOI

[24]
Meehl G A, Teng H, Arblaster J M, 2014. Climate model simulations of the observed early-2000s hiatus of global warming.Nature Climate Change, 4(10): 898-902.The slowdown in the rate of global warming in the early 2000s is not evident in the multi-model ensemble average of traditional climate change projection simulations. However, a number of individual ensemble members from that set of models successfully simulate the early-2000s hiatus when naturally-occurring climate variability involving the Interdecadal Pacific Oscillation (IPO) coincided, by chance, with the observed negative phase of the IPO that contributed to the early-2000s hiatus. If the recent methodology of initialized decadal climate prediction could have been applied in the mid-1990s using the Coupled Model Intercomparison Project Phase 5 multi-models, both the negative phase of the IPO in the early 2000s as well as the hiatus could have been simulated, with the multi-model average performing better than most of the individual models. The loss of predictive skill for six initial years before the mid-1990s points to the need for consistent hindcast skill to establish reliability of an operational decadal climate prediction system.

DOI

[25]
Mosedale J T, Stephenson B D, 2005. Granger causality of coupled climate processes ocean feedback on the North Atlantic Oscillation. Journal of Climate (Special Section), 19: 1182-1194.ABSTRACT This study uses a Granger causality time series modeling approach to quantitatively diagnose the feedback of daily sea surface temperatures (SSTs) on daily values of the North Atlantic Oscillation (NAO) as simulated by a realistic coupled general circulation model (GCM). Bivariate vector autoregressive time series models are carefully fitted to daily wintertime SST and NAO time series produced by a 50-yr simulation of the Third Hadley Centre Coupled Ocean-Atmosphere GCM (HadCM3). The approach demonstrates that there is a small yet statistically significant feedback of SSTs oil the NAO. The SST tripole index is found to provide additional predictive information for the NAO than that available by using only past values of NAO-the SST tripole is Granger causal for the NAO. Careful examination of local SSTs reveals that much of this effect is due to the effect of SSTs in the region of the Gulf Steam, especially south of Cape Hatteras. The effect of SSTs on NAO is responsible for the slower-than-exponential decay in lag-autocorrelations of NAO notable at lags longer than 10 days. The persistence induced in daily NAO by SSTs causes long-term means of NAO to have more variance than expected from averaging NAO noise if there is no feedback of the ocean on the atmosphere. There are greater long-term trends in NAO than can be expected from aggregating just short-term atmospheric noise, and NAO is potentially predictable provided that future SSTs are known. For example, there is about 10%-30% more variance in seasonal wintertime means of NAO and almost 70% more variance in annual means of NAO due to SST effects than one would expect if NAO were a purely atmospheric process.

DOI

[26]
Nemani R R, Keeling C D, Hashimoto Het al., 2003. Climate-driven increases in global terrestrial net primary production from 1982 to 1999.Science, 300(5625): 1560-1563.

DOI

[27]
Peng S S, Chen A P, Xu Let al., 2011. Recent change of vegetation growth trend in China.Environmental Research Letters, 6(4): 044027.Using satellite-derived normalized difference vegetation index (NDVI) data, several previous studies have indicated that vegetation growth significantly increased in most areas of China during the period 1982-99. In this letter, we extended the study period to 2010. We found that at the national scale the growing season (April-October) NDVI significantly increased by 0.0007 yrfrom 1982 to 2010, but the increasing trend in NDVI over the last decade decreased in comparison to that of the 1982-99 period. The trends in NDVI show significant seasonal and spatial variances. The increasing trend in April and May (AM) NDVI (0.0013 yr) is larger than those in June, July and August (JJA) (0.0003 yr) and September and October (SO) (0.0008 yr). This relatively small increasing trend of JJA NDVI during 1982-2010 compared with that during 1982-99 (0.0012 yr) (Piao et al 2003 J. Geophys. Res. tmos. 108 4401) implies a change in the JJA vegetation growth trend, which significantly turned from increasing (0.0039 yr) to slightly decreasing ( - 0.0002 yr) in 1988. Regarding the spatial pattern of changes in NDVI, the growing season NDVI increased (over 0.0020 yr) from 1982 to 2010 in southern China, while its change was close to zero in northern China, as a result of a significant changing trend reversal that occurred in the 1990s and early 2000s. In northern China, the growing season NDVI significantly increased before the 1990s as a result of warming and enhanced precipitation, but decreased after the 1990s due to drought stress strengthened by warming and reduced precipitation. Our results also show that the responses of vegetation growth to climate change vary across different seasons and ecosystems.

DOI

[28]
Piao S L, Cui M D, Chen A Pet al., 2011. Altitude and temperature dependence of change in the spring vegetation green-up date from 1982 to 2006 in the Qinghai-Xizang Plateau.Agricultural and Forest Meteorology, 151(12): 1599-1608.Research in phenology change has been one heated topic of current ecological and climate change study. In this study, we use satellite derived NDVI (Normalized Difference Vegetation Index) data to explore the spatio-temporal changes in the timing of spring vegetation green-up in the Qinghai-Xizang (Tibetan) Plateau from 1982 to 2006 and to characterize their relationship with elevation and temperature using concurrent satellite and climate data sets. At the regional scale, no statistically significant trend of the vegetation green-up date is observed during the whole study period ( R 2 02=020.00, P 02=020.95). Two distinct periods of green-up changes are identified. From 1982 to 1999, the vegetation green-up significantly advanced by 0.8802days02year 611 ( R 2 02=020.56, P 02<020.001). In contrast, from 1999 to 2006, a marginal delaying trend is evidenced ( R 2 02=020.44, P 02=020.07), suggesting that the persistent trend towards earlier vegetation green-up in spring between 1980s and 1990s was stalled during the first decade of this century. This shift in the tendency of the vegetation green-up seems to be related to differing temperature trends between these two periods. Statistical analysis shows that the average onset of vegetation green-up over the Qinghai-Xizang Plateau would advance by about 4.1 days in response to 102°C increase of spring temperature. In addition, results from our analysis indicate that the spatial patterns of the vegetation green-up date and its change since 1982 are altitude dependent. The magnitude of the vegetation green-up advancement during 1982–1999, and of its postponement from 1999 to 2006 significantly increases along an increasing elevation gradient.

DOI

[29]
Piao S L, Fang J Y, Liu H Yet al., 2005. NDVI-indicated decline in desertification in China in the past two decades. Geophysical Research Letters, 32: L06402. doi: 10.1029/2004GL021764.In this study, we explore the trend in desertification in China from 1982 to 1999 by investigating the changes in area and normalized difference vegetation index (NDVI) of arid and semiarid regions, using NDVI time series data sets and climatic variables. We use Thornthwaite moisture index (I) to define the arid and semiarid region as I<= -40 and -40 < I<= -20, respectively. Rainy season NDVI (May to October NDVI) increased in most areas of arid and semiarid regions over the past two decades, accounting for 72.3% and 88.2% of total area of arid and semiarid regions, respectively. Compared to that in the early 1980s, the area of arid and semiarid regions decreased by 23 10km(6.9%) and 7 10km(7.9%) by the end of the 1990s, suggesting a reversal of desertification processes in these two climate regions. Transformation from warm-arid to warm-wet climate and weakened disturbance from human activities may be the major causes of this declined trend.

DOI

[30]
Piao S L, Nan H J, Huntingford Cet al., 2014. Evidence for a weakening relationship between interannual temperature variability and northern vegetation activity.Nature Communications, 5: 5018. doi:10.1038/ncomms6018Abstract Satellite-derived Normalized Difference Vegetation Index (NDVI), a proxy of vegetation productivity, is known to be correlated with temperature in northern ecosystems. This relationship, however, may change over time following alternations in other environmental factors. Here we show that above 30 N, the strength of the relationship between the interannual variability of growing season NDVI and temperature (partial correlation coefficient RNDVI-GT) declined substantially between 1982 and 2011. This decrease in RNDVI-GT is mainly observed in temperate and arctic ecosystems, and is also partly reproduced by process-based ecosystem model results. In the temperate ecosystem, the decrease in RNDVI-GT coincides with an increase in drought. In the arctic ecosystem, it may be related to a nonlinear response of photosynthesis to temperature, increase of hot extreme days and shrub expansion over grass-dominated tundra. Our results caution the use of results from interannual time scales to constrain the decadal response of plants to ongoing warming.

DOI PMID

[31]
Qi L,Wang Y, 2012. Changes in the observed trends in extreme temperatures over China around 1990.Journal of Climate, 25(15): 5208-5222.ABSTRACT Based on the daily temperature data from weather stations in China, linear trends of the seasonal mean and extreme temperatures in summer and winter are analyzed and compared for the periods of 1960-89 and 1990- 2009. The results show prominent changes in those trends since the early 1990s, in particular in winter-a signal of climate shift as previously identified. The changes, however, are found to be strongly region dependent. In summer, both seasonal mean and extreme temperatures show a considerable cooling trend in central China and a warming trend in north and south China before 1990. After 1990 all temperature indices show significant warming trends throughout China with the largest trend up to 4.478C (10 yr)21 in north China. In winter in north China, with the most prominent warming trend during 1960-89, there is a significant cooling trend in both the seasonal mean temperature and the cold temperature indices after 1990. The warming trends over the Tibetan Plateau are substantially enhanced since 1990. All indices for the diurnal temperature range (DTR) show consistent decreasing trends in both summer and winter throughout China before 1990 while they turn to increasing trends in northeast China in summer and over the Tibetan Plateau in winter after 1990. The annual temperature range displays a decreasing trend throughout China before 1990 while it is dominated by an increasing trend after 1990 except over the Tibetan Plateau and in a narrow band along the Yangtze River. Possible mechanisms for the observed trend changes are discussed.

DOI

[32]
Pinzon J E, Tucker C J, 2010. GIMMS 3g NDVI set and global NDVI trends. Second Yamal Land-Cover Land-Use Change Workshop Arctic Centre (Rovaniemi, March).

[33]
Sen P K, 1968. Estimates of the regression coefficient based on Kendall's tau.Journal of the American Statistical Association, 63(324): 1379-1389.

DOI

[34]
Shaver G R, Canadell J, Chapin F Set al., 2000. Global warming and terrestrial ecosystems.BioScience, 50(10): 871-882.Focuses on the study of the effects global warming will have on ecosystems. Importance of accounting for increased temperature and carbon dioxide in the studies; Direct and indirect effects of warming; Different rates at which various ecosystems will be affected; Case studies of warming responses.

DOI

[35]
Shen M, Piao S, Jeong S J, et al., 2015. Evaporative cooling over the Tibetan Plateau induced by vegetation growth.Proceedings of the National Academy of Sciences, 112(30): 9299-9304.Abstract In the Arctic, climate warming enhances vegetation activity by extending the length of the growing season and intensifying maximum rates of productivity. In turn, increased vegetation productivity reduces albedo, which causes a positive feedback on temperature. Over the Tibetan Plateau (TP), regional vegetation greening has also been observed in response to recent warming. Here, we show that in contrast to arctic regions, increased growing season vegetation activity over the TP may have attenuated surface warming. This negative feedback on growing season vegetation temperature is attributed to enhanced evapotranspiration (ET). The extra energy available at the surface, which results from lower albedo, is efficiently dissipated by evaporative cooling. The net effect is a decrease in daily maximum temperature and the diurnal temperature range, which is supported by statistical analyses of in situ observations and by decomposition of the surface energy budget. A daytime cooling effect from increased vegetation activity is also modeled from a set of regional weather research and forecasting (WRF) mesoscale model simulations, but with a magnitude smaller than observed, likely because the WRF model simulates a weaker ET enhancement. Our results suggest that actions to restore native grasslands in degraded areas, roughly one-third of the plateau, will both facilitate a sustainable ecological development in this region and have local climate cobenefits. More accurate simulations of the biophysical coupling between the land surface and the atmosphere are needed to help understand regional climate change over the TP, and possible larger scale feedbacks between climate in the TP and the Asian monsoon system.

DOI PMID

[36]
Sillitto G, 1947. The distribution of Kendall's τ coefficient of rank correlation in rankings containing tie.Biometrika, 36-40.Herskovitz PI, Sendovski U.

DOI PMID

[37]
Sun J Y, Wang X H, Chen A Pet al., 2011. NDVI indicated characteristics of vegetation cover change in China’s metropolises over the last three decades.Environmental Monitoring and Assessment, 179(1-4): 1-14.Abstract How urban vegetation was influenced by three decades of intensive urbanization in China is of great interest but rarely studied. In this paper, we used satellite derived Normalized Difference Vegetation Index (NDVI) and socioeconomic data to evaluate effects of urbanization on vegetation cover in China's 117 metropolises over the last three decades. Our results suggest that current urbanization has caused deterioration of urban vegetation across most cities in China, particularly in East China. At the national scale, average urban area NDVI (NDVI(u)) significantly decreased during the last three decades (P < 0.01), and two distinct periods with different trends can be identified, 1982-1990 and 1990-2006. NDVI(u) did not show statistically significant trend before 1990 but decrease remarkably after 1990 (P < 0.01). Different regions also showed difference in the timing of NDVI(u) turning point. The year when NDVI(u) started to decline significantly for Central China and East China was 1987 and 1990, respectively, while NDVI(u) in West China remained relatively constant until 1998. NDVI(u) changes in the Yangtze River Delta and the Pearl River Delta, two regions which has been undergoing the most rapid urbanization in China, also show different characteristics. The Pearl River Delta experienced a rapid decline in NDVI(u) from the early 1980s to the mid-1990s; while in the Yangtze River Delta, NDVI(u) did not decline significantly until the early 1990s. Such different patterns of NDVI(u) changes are closely linked with policy-oriented difference in urbanization dynamics of these regions, which highlights the importance of implementing a sustainable urban development policy.

DOI PMID

[38]
Thompson D M, Cole J E, Shen G Tet al., 2014. Early twentieth-century warming linked to tropical Pacific wind strength.Nature Geoscience, 8(2): 117-121.Of the rise in global atmospheric temperature over the past century, nearly 30% occurred between 1910 and 1940 when anthropogenic forcings were relatively weak. This early warming has been attributed to internal factors, such as natural climate variability in the Atlantic region, and external factors, such as solar variability and greenhouse gas emissions. However, the warming is too large to be explained by external factors alone and it precedes Atlantic warming by over a decade. For the late twentieth century, observations and climate model simulations suggest that Pacific trade winds can modulate global temperatures, but instrumental data are scarce in the early twentieth century. Here we present a westerly wind reconstruction (1894-1982) from seasonally resolved measurements of Mn/Ca ratios in a western Pacific coral that tracks interannual to multidecadal Pacific climate variability. We then reconstruct central Pacific temperatures using Sr/Ca ratios in a coral from Jarvis Island, and find that weak trade winds and warm temperatures coincide with rapid global warming from 1910 to 1940. In contrast, winds are stronger and temperatures cooler between 1940 and 1970, when global temperature rise slowed down. We suggest that variations in Pacific wind strength at decadal timescales significantly influence the rate of surface air temperature change.

DOI

[39]
Tucker C, Pinzon J, Brown Met al., 2005. An extended AVHRR 8-km NDVI dataset compatible with MODIS and SPOT vegetation NDVI data.International Journal of Remote Sensing, 26(20): 4485-4498.Daily daytime Advanced Very High Resolution Radiometer (AVHRR) 4‐km global area coverage data have been processed to produce a Normalized Difference Vegetation Index (NDVI) 8‐km equal‐area dataset from July 1981 through December 2004 for all continents except Antarctica. New features of this dataset include bimonthly composites, NOAA‐9 descending node data from August 1994 to January 1995, volcanic stratospheric aerosol correction for 1982–1984 and 1991–1993, NDVI normalization using empirical mode decomposition/reconstruction to minimize varying solar zenith angle effects introduced by orbital drift, inclusion of data from NOAA‐16 for 2000–2003 and NOAA‐17 for 2003–2004, and a similar dynamic range with the MODIS NDVI. Two NDVI compositing intervals have been produced: a bimonthly global dataset and a 10‐day Africa‐only dataset. Post‐processing review corrected the majority of dropped scan lines, navigation errors, data drop outs, edge‐of‐orbit composite discontinuities, and other artefacts in the composite NDVI data. All data are available from the University of Maryland Global Land Cover Facility (http://glcf.umiacs.umd.edu/data/gimms/).

DOI

[40]
Ukkola A M, Prentice I C, Keenan T Fet al., 2015. Reduced streamflow in water-stressed climates consistent with CO2 effects on vegetation.Nature Climate Change, 6: 75-78. doi: 10.1038/nclimate2831.Remotely sensed vegetation and water-balance measurements from 190 river basins across Australia show that sub-humid and semi-arid basins are /`greening[rsquor][mdash]as expected under CO2 fertilization[mdash]increasing water consumption and reducing streamflow.

DOI

[41]
Wang L, Li C C, Ying Qet al., 2012. China’s urban expansion from 1990 to 2010 determined with satellite remote sensing.Chinese Science Bulletin, 57(22): 2802-2812.Based on the same data source of Landsat TM/ETM+ in 1990s,2000s and 2010s,all urban built-up areas in China are mapped mainly by human interpretation.Mapping results were checked and refined by the same analyst with the same set of criteria.The results show during the last 20 years urban areas in China have increased exponentially more than 2 times.The greatest area of urbanization changed from Northeastern provinces in 1990s to the Southeast coast of China in Jiangsu,Guangdong,Shandong,and Zhejiang in 2010s.Urban areas are mostly converted from croplands in China.Approximately 17750 km 2 croplands were converted into urban lands.Furthermore,the conversion from 2000 to 2010 doubled that from 1990 to 2000.During the 20 years,the most urbanized provinces are Jiangsu,Guangdong,Shandong and Zhejiang.We also analyzed built-up areas,gross domestic production (GDP) and population of 147 cities with a population of greater than 500000 in 2009.The result shows coastal cities and resource-based cities are with high economic efficiency per unit of built-up areas,resource-based cities have the highest population density,and the economic efficiency of most coastal provinces are lower than central provinces and Guangdong.The newly created urban expansion dataset is useful in many fields including trend analysis of urbanization in China;simulation of urban development dynamics;analysis of the relationship among urbanization,population growth and migration;studies of carbon emissions and climate change;adaptation of climate change;as well as land use and urban planning and management.

DOI

[42]
Wang S W, Wen X Y, Luo Yet al., 2010. Does the global warming pause in the last decade: 1999-2008.Advances in Climate Change Research, 6: 95-99.

DOI

[43]
Wang W, Anderson B T, Kaufmann R Ket al., 2004. The relation between the North Atlantic Oscillation and SSTs in the North Atlantic Basin.Journal of Climate, 17: 4752-4759.The authors use the notion of Granger causality to investigate the relationship between the North Atlantic Oscillation (NAO) index and the sea surface temperatures (SSTs) over the Northern Hemisphere. The Granger causality analysis ensures that any apparent oceanic influence upon the atmosphere (as measured by the NAO) is provided by the ocean and is not related to preexisting conditions within the NAO itself (and vice versa when looking at the atmospheric influence upon the ocean). Although this statistical technique does not imply physical forcing of one field on the other, it is generally more reliable compared to the simple lead/lagged correlation. Using this technique, the authors find that on seasonal time scales, the preceding NAO anomalies' influence on the wintertime SST field is rather restricted. Conversely, preceding SST anomalies have a statistically significant causal effect on the wintertime NAO. However, the causal relation between preceding SSTs and the wintertime NAO is limited to the Gulf Stream extension; in contrast to the canonical tripole SST pattern typically associated with the NAO, the authors do not find that SST anomalies in either the Greenland or subtropical regions have a significant causal effect on the NAO. These results suggest that the Gulf Stream SSTs have an important influence in initiating disturbances of the atmospheric circulation over the wintertime North Atlantic.

DOI

[44]
Wang X H, Piao S L, Ciais Pet al., 2014. A two-fold increase of carbon cycle sensitivity to tropical temperature variations.Nature, 506(7487): 212-215.Earth system models project that the tropical land carbon sink will decrease in size in response to an increase in warming and drought during this century, probably causing a positive climate feedback. But available data are too limited at present to test the predicted changes in the tropical carbon balance in response to climate change. Long-term atmospheric carbon dioxide data provide a global record that integrates the interannual variability of the global carbon balance. Multiple lines of evidence demonstrate that most of this variability originates in the terrestrial biosphere. In particular, the year-to-year variations in the atmospheric carbon dioxide growth rate (CGR) are thought to be the result of fluctuations in the carbon fluxes of tropical land areas. Recently, the response of CGR to tropical climate interannual variability was used to put a constraint on the sensitivity of tropical land carbon to climate change. Here we use the long-term CGR record from Mauna Loa and the South Pole to show that the sensitivity of CGR to tropical temperature interannual variability has increased by a factor of 1.9 0.3 in the past five decades. We find that this sensitivity was greater when tropical land regions experienced drier conditions. This suggests that the sensitivity of CGR to interannual temperature variations is regulated by moisture conditions, even though the direct correlation between CGR and tropical precipitation is weak. We also find that present terrestrial carbon cycle models do not capture the observed enhancement in CGR sensitivity in the past five decades. More realistic model predictions of future carbon cycle and climate feedbacks require a better understanding of the processes driving the response of tropical ecosystems to drought and warming.

DOI PMID

[45]
Wu D H, Zhao X, Liang S Let al., 2015. Time-lag effects of global vegetation responses to climate change.Global Change Biology, 21(9): 3520-3531.Abstract <p>Climate conditions significantly affect vegetation growth in terrestrial ecosystems. Due to the spatial heterogeneity of ecosystems, the vegetation responses to climate vary considerably with the diverse spatial patterns and the time-lag effects, which are the most important mechanism of climate–vegetation interactive effects. Extensive studies focused on large-scale vegetation–climate interactions use the simultaneous meteorological and vegetation indicators to develop models; however, the time-lag effects are less considered, which tends to increase uncertainty. In this study, we aim to quantitatively determine the time-lag effects of global vegetation responses to different climatic factors using the GIMMS3g NDVI time series and the CRU temperature, precipitation, and solar radiation datasets. First, this study analyzed the time-lag effects of global vegetation responses to different climatic factors. Then, a multiple linear regression model and partial correlation model were established to statistically analyze the roles of different climatic factors on vegetation responses, from which the primary climate-driving factors for different vegetation types were determined. The results showed that (i) both the time-lag effects of the vegetation responses and the major climate-driving factors that significantly affect vegetation growth varied significantly at the global scale, which was related to the diverse vegetation and climate characteristics; (ii) regarding the time-lag effects, the climatic factors explained 64% variation of the global vegetation growth, which was 11% relatively higher than the model ignoring the time-lag effects; (iii) for the area with a significant change trend (for the period 1982–2008) in the global GIMMS3g NDVI ( P

DOI PMID

[46]
Wu R, Kinter III J, Kirtman B P, 2005. Discrepancy of interdecadal changes in the Asian region among the NCEP-NCAR reanalysis, objective analyses, and observations.Journal of Climate, 18(15): 3048-3067.This study compares decadal means and interdecadal changes of surface and sea level pressures, tropospheric heights, and winds in the National Centers for Environmental Prediction09“National Center for Atmospheric Research (NCEP09“NCAR) reanalysis with objective analyses and observations. It is found that over Asia the NCEP09“NCAR reanalysis pressures and heights are systematically lower than objective analyses and observations before the late 1970s. The magnitude of the differences changes from one decade to another and shows obvious seasonal dependence. The nonuniform spatial distribution of pressure and height differences is consistent with the discrepancy in lower-level meridional winds along the east Asian coast. The seasonal dependence of pressure differences affects the strength of the seasonal cycle over Asia. More importantly, large changes in the discrepancies from one decade to another lead to inconsistent interdecadal changes between the reanalysis and objective analyses or observations in the Asian region. While the reanalysis displays a large increase of pressure around 1977 and in the mid-1960s and an obvious decrease in the late 1950s, the changes are small in objective analyses and observations. Inconsistent interdecadal changes are also present in tropospheric heights and winds. The results indicate that the reanalysis may overestimate interdecadal changes over Asia. This calls for caution in utilizing the reanalysis output to study the interdecadal variability or the interannual variability without removal of interdecadal variations in the Asian region.

DOI

[47]
Wu R, Yang S, Liu S, et al., 2010. Changes in the relationship between Northeast China summer temperature and ENSO. Journal of Geophysical Research: Atmospheres, 115(D21).Northeast China (NEC) summer temperature tends to be lower (higher) than normal in El Ni o (La Ni a) developing years during 1950s through mid-1970s. The relationship between the NEC summer temperature and El Ni o-Southern Oscillation (ENSO) is weakened or even becomes opposite in 1980s and 1990s. The present study documents this interdecadal change and investigates plausible reasons for this change. Before the late 1970s, ENSO affects the NEC summer temperature through modulating the South Asian heating and consequently the midlatitude Asian circulation. After the late 1970s, the connection between ENSO and the Indian summer monsoon and that between the South Asian heating and the midlatitude Asian circulation have been weakened. This leads to a weakening of ENSO impacts on the NEC summer temperature. It is found that the NEC summer temperature variations are closely related to the North Atlantic sea surface temperature (SST) and circulation changes in 1980s and 1990s. In particular, a tripole North Atlantic SST anomaly pattern in boreal spring is a good precursory for the NEC summer temperature anomalies. The NEC summer temperature displays a negative correlation with the summer SST surrounding the Maritime Continent in 1980s and 1990s. In many years, the tropical North Pacific and the North Atlantic SST anomalies can contribute in concert to the midlatitude Asian circulation changes and the NEC summer temperature anomalies. These effects overcome those of the central and eastern equatorial Pacific SST anomalies, leading to a same-sign relationship between the NEC summer temperature and the central and eastern equatorial Pacific SST anomalies.

DOI

[48]
Wu Z, Dijkstra P, Koch G Wet al., 2012. Biogeochemical and ecological feedbacks in grassland responses to warming.Nature Climate Change, 2(6): 458-461.Feedbacks can modulate the way plants respond to warming, but difficulties in detecting long-acting feedbacks complicate understanding of the climatic effects on community structure and function beyond initial responses. Now a mesocosm experiment shows that although warming initially increased aboveground net primary productivity in grassland ecosystems, the response diminished progressively over time.

DOI

[49]
Xiao J F, 2014. Satellite evidence for significant biophysical consequences of the “Grain for Green” Program on the Loess Plateau in China. Journal of Geophysical Research: Biogeosciences, 119(12): 2261-2275.Abstract Afforestation has been implemented worldwide as regional and national policies to address environmental problems and to improve ecosystem services. China's central government launched the rain for Green Program (GGP) in 1999 to increase forest cover and to control soil erosion by converting agricultural lands on steep slopes to forests and grasslands. Here a variety of satellite data products from the Moderate Resolution Imaging Spectroradiometer were used to assess the biophysical consequences of the GGP for the Loess Plateau, the pilot region of the program. The average tree cover of the plateau substantially increased because of the GGP, with a relative increase of 41.0%. The GGP led to significant increases in enhanced vegetation index (EVI), leaf area index, and the fraction of photosynthetically active radiation absorbed by canopies. The increase in forest productivity as approximated by EVI was not driven by elevated air temperature, changing precipitation, or rising atmospheric carbon dioxide concentrations. Moreover, the afforestation significantly reduced surface albedo, leading to a positive radiative forcing and a warming effect on the climate. The GGP also led to a significant decline in daytime land surface temperature and exerted a cooling effect on the climate. The GGP therefore has significant biophysical consequences by altering carbon cycling, hydrologic processes, and surface energy exchange and has significant feedbacks to the regional climate. The net radiative forcing on the climate depends on the offsetting of the negative forcing from carbon sequestration and higher evapotranspiration and the positive forcing from lower albedo.

DOI

[50]
Xu X T, Piao S L, Wang X Het al., 2012. Spatio-temporal patterns of the area experiencing negative vegetation growth anomalies in China over the last three decades.Environmental Research Letters, 7(3): 035701.Extreme climatic events like droughts, floods, heat waves and ice storms impact ecosystems as well as human societies. There is wide concern about how terrestrial ecosystems respond to extreme climatic events in the context of global warming. In this study, we used satellite-derived vegetation greenness data (Normalized Difference Vegetation Index; NDVI), in situ weather station data (temperature and precipitation) and the Palmer Drought Severity Index (PDSI) to analyze the spatio-temporal change of the area experiencing vegetation greenness anomalies and extreme climatic events in China from 1982 to 2009. At the national scale, we found that China experienced an increasing trend in heat waves and drought events during the study period. The average fraction of climate stations with drought events (defined by growing season PDSI < 2) detected increased from 8% in the 1980s, to nearly 20% in the 2000s, at a rate of 0.6% yr(R= 0.61, P < 0.001). In contrast, the area showing negative anomalies of vegetation greenness decreased at the rate of 0.9% yrfrom 1982 to 2009 (R= 0.29, P = 0.003), although this trend stalled or reversed during the 2000s, particularly in northern China. The decrease in vegetation growth during the last decade over northern China was accompanied by the increase in extreme drought events in the 2000s. In southern China, although both precipitation and PDSI data suggest a greater area experiencing drought events during the 2000s than in the 1980s, the area showing negative vegetation greenness decreased consistently during the whole study period. (letter)

DOI

[51]
Yin G, Hu Z Y, Chen Xet al., 2016. Vegetation dynamics and its response to climate change in Central Asia.Journal of Arid Land, 8(3): 375-388.

DOI

[52]
Zeng F W, Collatz G J, Pinzon J Eet al., 2013. Evaluating and quantifying the climate-driven interannual variability in Global Inventory Modeling and Mapping Studies (GIMMS) Normalized Difference Vegetation Index (NDVI3g) at global scales.Remote Sensing, 5(8): 3918-3950.Satellite observations of surface reflected solar radiation contain information about variability in the absorption of solar radiation by vegetation. Understanding the causes of variability is important for models that use these data to drive land surface fluxes or for benchmarking prognostic vegetation models. Here we evaluated the interannual variability in the new 30.5-year long global satellite-derived surface reflectance index data, Global Inventory Modeling and Mapping Studies normalized difference vegetation index (GIMMS NDVI3g). Pearson's correlation and multiple linear stepwise regression analyses were applied to quantify the NDVI interannual variability driven by climate anomalies, and to evaluate the effects of potential interference (snow, aerosols and clouds) on the NDVI signal. We found ecologically plausible strong controls on NDVI variability by antecedent precipitation and current monthly temperature with distinct spatial patterns. Precipitation correlations were strongest for temperate to tropical water limited herbaceous systems where in some regions and seasons > 40% of the NDVI variance could be explained by precipitation anomalies. Temperature correlations were strongest in northern mid- to high-latitudes in the spring and early summer where up to 70% of the NDVI variance was explained by temperature anomalies. We find that, in western and central North America, winter-spring precipitation determines early summer growth while more recent precipitation controls NDVI variability in late summer. In contrast, current or prior wet season precipitation anomalies were correlated with all months of NDVI in sub-tropical herbaceous vegetation. Snow, aerosols and clouds as well as unexplained phenomena still account for part of the NDVI variance despite corrections. Nevertheless, this study demonstrates that GIMMS NDVI3g represents real responses of vegetation to climate variability that are useful for global models.

DOI

[53]
Zhang L, Xiao J F, Li Jet al., 2012. The 2010 spring drought reduced primary productivity in southwestern China.Environmental Research Letters, 7(4): 045706.

DOI

[54]
Zhang X Y, Hu Y F, Zhuang D Fet al., 2009. NDVI spatial pattern and its differentiation on the Mongolian Plateau.Journal of Geographical Sciences, 19(4): 403-415.

DOI

[55]
Zhang X Z, Dai J H, Ge Q S, 2013. Variation in vegetation greenness in spring across eastern China during 1982-2006. Journal of Geographical Sciences, 23(1): 45-56.中国科学院机构知识库(中国科学院机构知识库网格(CAS IR GRID))以发展机构知识能力和知识管理能力为目标,快速实现对本机构知识资产的收集、长期保存、合理传播利用,积极建设对知识内容进行捕获、转化、传播、利用和审计的能力,逐步建设包括知识内容分析、关系分析和能力审计在内的知识服务能力,开展综合知识管理。

DOI

[56]
Zhao X, Tan K, Zhao Set al., 2011. Changing climate affects vegetation growth in the arid region of the northwestern China.Journal of Arid Environments, 75(10): 946-952.The northwestern China is a typical dry-land region of Inner Asia, where significant climate change has been observed over the past several decades. How the regional vegetation, particularly the grassland-oasis-desert complex, responds to such climatic change is poorly understood. To address this question, we investigated spatio-temporal changes in vegetation growth and their responses to a changing climate by biome and bioregion, using satellite-sensed Normalized Difference Vegetation Index (NDVI) data from 1982 to 2003, along with corresponding climate data. Over the past 22 years, about 30% of the total vegetated area showed an annual increase of 0.7% in growing season NDVI. This trend occurred in all biomes and all bioregions except Sawuer, a subregion of the study area with no significant climate change. Further analyses indicated that NDVI change was highly correlated with the current precipitation and evapotranspiration in growing season but was not associated with temperature. We also found that NDVI was positively correlated with the preceding winter precipitation. These findings suggest that precipitation may be the key cause of vegetation growth in this area, even for mountain forests and grasslands, whose growth are often regarded to be limited by low temperate in winter and early spring.Highlights? We proposed that significant climate change may lead to changes in vegetation growth in arid northwestern China. ? NDVI-indicated vegetation growth shows an overall increase in the whole area, all biomes and most bioregions. ? Precipitation may be the key cause of vegetation growth in this area, even for mountain forests and grasslands.

DOI

[57]
Zhou L M, Tucker C J, Kaufmann R Ket al., 2001. Variations in northern vegetation activity inferred from satellite data of vegetation index during 1981 to 1999. Journal of Geophysical Research: Atmospheres, 106(D17): 20069-20083.

DOI

[58]
Zhou W, Gang C C, Chen Y Zet al., 2014. Grassland coverage inter-annual variation and its coupling relation with hydrothermal factors in China during 1982-2010.Journal of Geographical Sciences, 24(4): 593-611.GIMMS(Global Inventory Modeling and Mapping Studies) NDVI(Normalised Difference Vegetation Index) from 1982 to 2006 and MODIS(Moderate Resolution Imaging Spectroradiometer) NDVI from 2001 to 2010 were blended to extract the grass coverage and analyze its spatial pattern. The response of grass coverage to climatic variations at annual and monthly time scales was analyzed. Grass coverage distribution had increased from northwest to southeast across China. During 1982 2010, the mean nationwide grass coverage was 34% but exhibited apparent spatial heterogeneity, being the highest(61.4%) in slope grasslands and the lowest(17.1%) in desert grasslands. There was a slight increase of the grass coverage with a rate of 0.17% per year. Increase in slope grasslands coverage was as high as 0.27% per year, while in the plain grasslands and meadows the grass coverage increase was the lowest(being 0.11% per year and 0.1% per year, respectively). Across China, the grass coverage with extremely significant increase(P0.01) and significant increase(P0.05) accounted for 46.03% and 11% of the total grassland area, respectively, while those with extremely significant and significant decrease accounted for only 4.1% and 3.24%, respectively. At the annual time scale, there are no significant correlations between grass coverage and annual mean temperature and precipitation. However, the grass coverage was somewhat affected by temperature in alpine and sub-alpine grassland, alpine and sub-alpine meadow, slope grassland and meadow, while grass coverage in desert grassland and plain grassland was more affected by precipitation. At the monthly time-scale, there are significant correlations between grass coverage with both temperature and precipitation, indicating that the grass coverage is more affected by seasonal fluctuations of hydrothermal conditions. Additionally, there is one-month time lag-effect between grass coverage and climate factors for each grassland types.

DOI

Outlines

/