
Journal of Geographical Sciences >
Crop cover reconstruction and its effects on sediment retention in the Tibetan Plateau for 1900-2000
Author: Li Shicheng (1989-), PhD, specialized in historical land use and cover change reconstruction and its ecological effects assessment. E-mail: lisc.10s@igsnrr.ac.cn; lisc@cug.edu.cn
*Corresponding author: Zhang Yili and Wang Zhaofeng. E-mail: zhangyl@igsnrr.ac.cn; wangzf@igsnrr.ac.cn
Received date: 2016-11-05
Accepted date: 2017-02-06
Online published: 2017-07-10
Supported by
Strategic Priority Research Program of the Chinese Academy of Sciences, No.XDB03030500
National Natural Science Foundation of China, No.41371120
The Key Foundation Project of Basic Work of the Ministry of Science and Technology of China, No.2012FY111400
Copyright
Geographically explicit historical land use and land cover datasets are increasingly required in studies of climatic and ecological effects of human activities. In this study, using historical population data as a proxy, the provincial cropland areas of Qinghai province and the Tibet Autonomous Region (TAR) for 1900, 1930, and 1950 were estimated. The cropland areas of Qinghai and the TAR for 1980 and 2000 were obtained from published statistical data with revisions. Using a land suitability for cultivation model, the provincial cropland areas for the 20th century were converted into crop cover datasets with a resolution of 1 × 1 km. Finally, changes of sediment retention due to crop cover change were assessed using the sediment delivery ratio module of the Integrated Valuation of Ecosystem Services and Trade-offs (InVEST) model (version 3.3.1). There were two main results. (1) For 1950-1980 the fractional cropland area increased from 0.32% to 0.48% and land use clearly intensified in the Tibetan Plateau (TP), especially in the Yellow River-Huangshui River Valley (YHRV) and the midstream of the Yarlung Zangbo River and its two tributaries valley (YRTT). For other periods of the 20th century, stability was the main trend. (2) For 1950-1980, sediment export increased rapidly in the Minhe autonomous county of the YHRV, and in the Nianchu River and Lhasa River basins of the YRTT, which means that sediment retention clearly decreased in these regions over this period. The results of this assessment provide scientific support for conservation planning, development planning, or restoration activities.
LI Shicheng , WANG Zhaofeng , ZHANG Yili . Crop cover reconstruction and its effects on sediment retention in the Tibetan Plateau for 1900-2000[J]. Journal of Geographical Sciences, 2017 , 27(7) : 786 -800 . DOI: 10.1007/s11442-017-1406-4
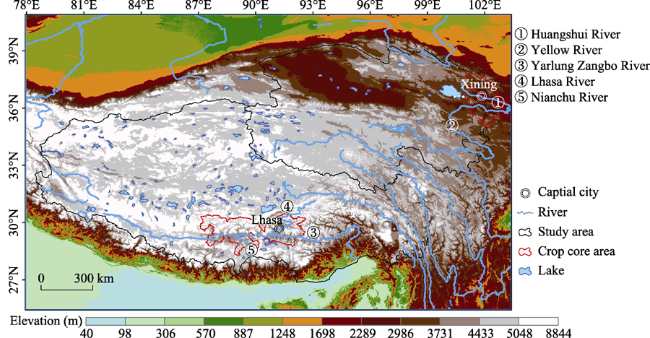
Figure 1 Location of the study area. The two red polygons are the main crop distribution areas in the Tibetan Plateau (TP). The right-top polygon is the Yellow-Huangshui River valley (YHRV), and the middle-bottom polygon is the midstream Yarlung Zangbo River and its two tributaries valley in Tibet Autonomous Region (YRTT). |
Table 1 Population of Qinghai province and the Tibet Autonomous Region (TAR) for 1880, 1910, and 1953 (Cao and Ge, 2001) (104 person) |
| Province name | 1880 | 1910 | 1953 |
|---|---|---|---|
| Qinghai province | 32.9 | 34.4 | 36.7 |
| Tibet Autonomous Region | 127 | 131.2 | 137.4 |
Table 2 Inputs to the sediment delivery ratio module of the Integrated Valuation of Ecosystem Services and Trade-offs (InVEST) model (version 3.3.1) and data sources |
| Input | Descriptions | Data sources |
|---|---|---|
| Digital elevation model (DEM) | Digital elevation model, reflecting topography properties | Geospatial data cloud (http://www.gscloud.cn/) |
| R | Rainfall erosivity index, reflecting climate properties | National earth system science data sharing infrastructure (http://www.geodata.cn/) |
| K | Soil erodibility index, reflecting soil properties | Liu et al., 2014a |
| Watersheds | A shapefile of polygons. The calculation is also at watershed scale | Institute of Geography, Chinese Academy of Sciences, 1997 |
| P and C | P is the support practice factor and C is crop-management factor, reflecting vegetation and anthropogenic factors | RUSLE handbook (Renard et al., 1997) and the TP related studies (Wang et al., 2004) |
| Threshold flow accumulation | The number of upstream cells that must flow into a cell before it is considered part of a stream | Default |
| kb and IC0 | Calibration parameters that determine the shape of the relationship between hydrologic connectivity and the SDR | Default |
| SDRmax | The maximum sediment delivery ratio (SDR) that a pixel can reach | Default |
Table 3 Biophysical values of the cover-management factor C and support practice factor P |
| Land use/ cover categories | Cover-management factor C | Support practice factor P |
|---|---|---|
| Cropland | 0.3 | 0.4 |
| Forestland | 0.003 | 0.2 |
| Shrubland | 0.02 | 0.2 |
| Grassland | 0.01 | 0.25 |
| Waterbody | 0 | 0 |
| Snow | 0 | 0.001 |
| Wetland | 0 | 0.001 |
| Built-ups | 0 | 0.001 |
| Unused land | 1 | 0.01 |
Table 4 Cropland area in the Tibetan Plateau (TP) for 1900-2000. (Units: km2.) |
| Province | 1900 | 1930 | 1950 | 1980 | 2000 |
|---|---|---|---|---|---|
| Qinghai | 4272 (0.597) | 4497 (0.628) | 4527 (0.632) | 6850 (0.957) | 6875 (0.960) |
| Tibet Autonomous Region | 1510 (0.126) | 1590 (0.132) | 1620 (0.135) | 2350 (0.196) | 2308 (0.192) |
| Entire study area | 5782 (0.301) | 6087 (0.317) | 6147 (0.320) | 9200 (0.479) | 9183 (0.478) |
Note: The fractional cropland area (FCA) is provided in the brackets (%). |
Figure 2 Crop cover of Qinghai Province and the Tibet Autonomous Region (TAR) with a resolution of 1 × 1 km for 1900, 1930, 1950, 1980, and 2000. The right subfigure is the Yellow River-Huangshui River Valley (YHRV) and the bottom subfigure is Yarlung Zangbo River and its two tributaries valley (YRTT). |
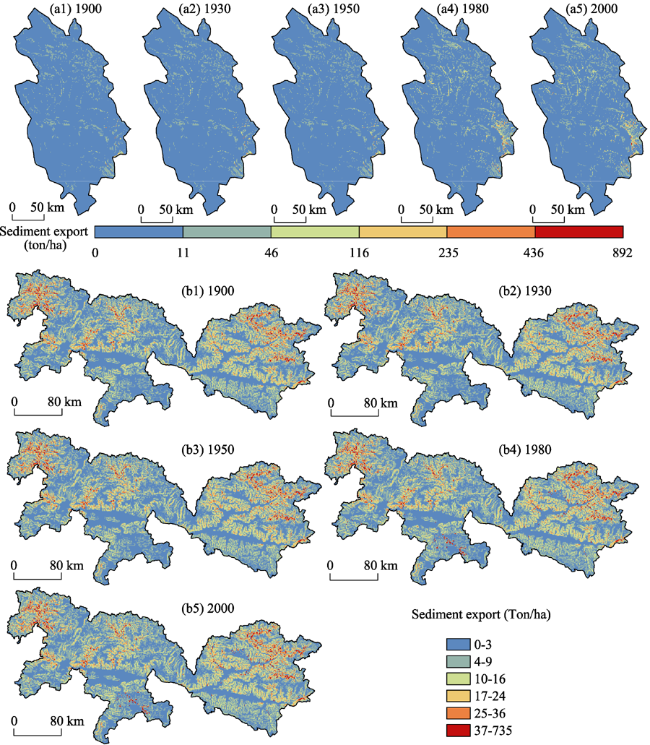
Figure 3 Sediment export induced by crop cover change in the Yellow River-Huangshui River Valley (YHRV) (Nos. a1-a5) and Yarlung Zangbo River and its two tributaries valley (YRTT) (Nos. b1-b5) for 1900, 1930, 1950, 1980, and 2000 |
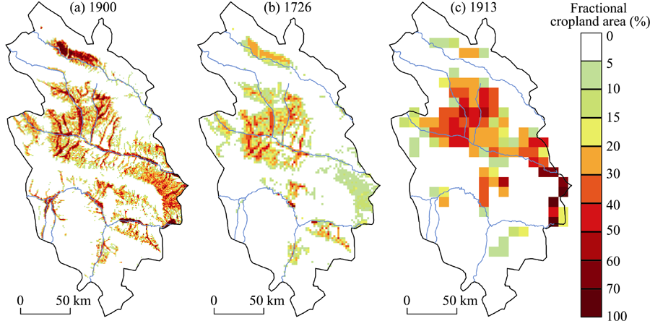
Figure 4 Comparison of spatial patterns among three datasets. (a) This study with a 1 × 1 km resolution; (b) Luo et al. (2014) with a 2 × 2 km resolution; (c) Li et al. (2016) with a 10 × 10 km resolution |
Table 5 A comparison of the inputs, methods, and results among the three datasets |
| Reconstruction | Resolution of input | Factors considered | Resolution | The percentage cropland area in each slope interval (°) | The percentage cropland area in each elevation interval (km) | ||||||
|---|---|---|---|---|---|---|---|---|---|---|---|
| ≤2 | 2-6 | 6-15 | >15 | ≤2 | 2-3 | 3-4 | >4 | ||||
| This study | Province | Elevation, slope | 1 km | 24.1 | 60.7 | 15.0 | 0.1 | 8.3 | 79.2 | 12.5 | 0.0 |
| Luo et al. (2014) | County | Elevation, slope, climate, population | 2 km | 23.0 | 62.1 | 14.8 | 0.2 | 3.2 | 85.6 | 11.2 | 0.0 |
| Li et al. (2016) | Province | Elevation, slope, climate | 10 km | 14.4 | 59.0 | 26.3 | 0.4 | 5.5 | 69.7 | 24.1 | 0.8 |
The authors have declared that no competing interests exist.
| [1] |
|
| [2] |
|
| [3] |
|
| [4] |
|
| [5] |
|
| [6] |
|
| [7] |
|
| [8] |
|
| [9] |
|
| [10] |
|
| [11] |
|
| [12] |
|
| [13] |
|
| [14] |
|
| [15] |
|
| [16] |
|
| [17] |
Institute of Geography, Chinese Academy of Sciences, 1997. Atlas of the Tibetan Plateau. (in Chinese)
|
| [18] |
|
| [19] |
|
| [20] |
|
| [21] |
|
| [22] |
|
| [23] |
|
| [24] |
|
| [25] |
|
| [26] |
|
| [27] |
|
| [28] |
|
| [29] |
|
| [30] |
|
| [31] |
|
| [32] |
|
| [33] |
|
| [34] |
|
| [35] |
|
| [36] |
|
| [37] |
|
| [38] |
|
| [39] |
|
| [40] |
|
| [41] |
|
| [42] |
|
| [43] |
|
| [44] |
|
| [45] |
|
| [46] |
|
| [47] |
|
| [48] |
|
| [49] |
|
| [50] |
|
| [51] |
|
| [52] |
|
| [53] |
|
| [54] |
|
| [55] |
|
| [56] |
|
/
| 〈 |
|
〉 |
