Orginal Article

The basic characteristics and spatial patterns of global cultivated land change since the 1980s

  • YAO Ziyan , 1, * ,
  • ZHANG Lijuan , 1 ,
  • TANG Shihao 2 ,
  • LI Xiaxiang 1 ,
  • HAO Tiantian 1
Expand
  • 1. Key Laboratory of Remote Sensing Monitoring of Geographic Environment, Harbin Normal University, Harbin 150025, China
  • 2. Key Laboratory of Radiometric Calibration and Validation for Environmental Satellites, National Satellite Meteorological Center, CMA, Beijing 100081, China

Author: Yao Ziyan, Master, specialized in studies of changes in land use and land cover. E-mail:

*Corresponding author: Zhang Lijuan, Professor, E-mail:

Received date: 2016-12-28

  Accepted date: 2017-01-20

  Online published: 2017-07-10

Supported by

National Natural Science Foundation of China, No.42171217

Copyright

Journal of Geographical Sciences, All Rights Reserved

Abstract

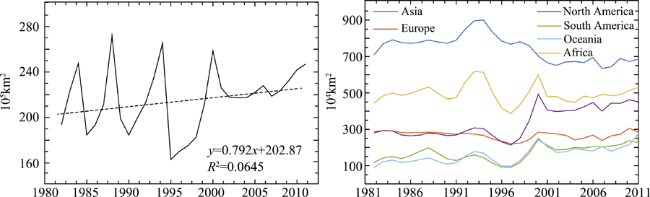
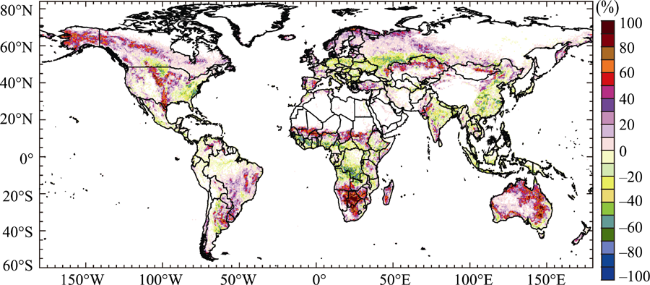
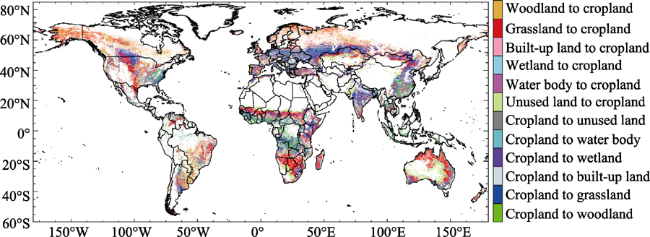
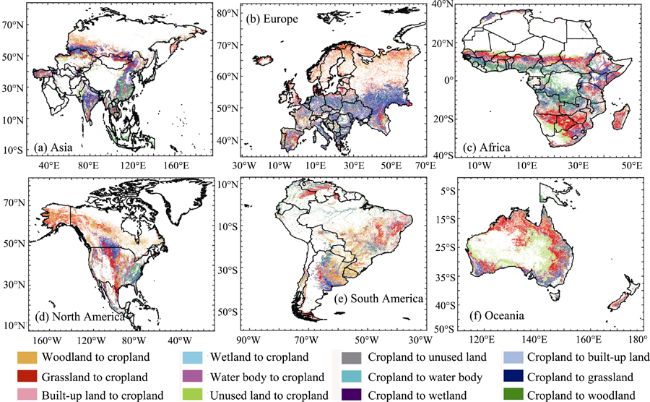
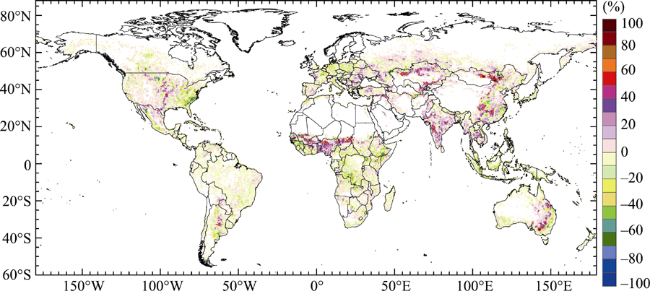
In this paper, we analyzed the spatial patterns of cultivated land change between 1982 and 2011 using global vector-based land use/land cover data. (1) Our analysis showed that the total global cultivated land area increased by 528.768×10⁴ km2 with a rate of 7.920×10⁴ km2/a, although this increasing trend was not significant. The global cultivated land increased fastest in the 1980s. Since the 1980s, the cultivated land area in North America, South America and Oceania increased by 170.854×10⁴ km2, 107.890×10⁴ km2, and 186.492×10⁴ km2, respectively. In contrast, that in Asia, Europe and Africa decreased by 23.769×10⁴ km2, 4.035×10⁴ km2 and 86.76×10⁴ km2, respectively. Furthermore, the cultivated land area in North America, South America and Oceania exhibited significant increasing trends of 7.236× 10⁴ km2/a, 2.780×10⁴ km2/a and 3.758×10⁴ km2/a, respectively. On the other hand, that of Asia, Europe and Africa exhibited decreasing trend rates of -5.641×10⁴ km2/a, -0.831×10⁴ km2/a and -0.595×10⁴ km2/a, respectively. Moreover, the decreasing trend in Asia was significant. (2) Since the 1980s, the increase in global cultivated lands was mainly due to converted grasslands and woodlands, which accounted for 53.536% and 26.148% of the total increase, respectively. The increase was found in southern and central Africa, eastern and northern Australia, southeastern South America, central US and Alaska, central Canada, western Russia, northern Finland and northern Mongolia. Among them, Botswana in southern Africa experienced an 80%-90% increase, making it the country with the highest increase worldwide. (3) Since the 1980s, the total area of cultivated lands converted to other types of land was 1071.946×104 km2. The reduction was mainly converted to grasslands and woodlands, which accounted for 57.482% and 36.000%, respectively. The reduction occurred mainly in southern Sudan in central Africa, southern and central US, southern Russia, and southern European countries including Bulgaria, Romania, Serbia and Hungary. The greatest reduction occurred in southern Africa with a 60% reduction. (4) The cultivated lands in all the continents analyzed exhibited a trend of expansion to high latitudes. Additionally, most countries displayed an expansion of newly increased cultivated lands and the reduction of the original cultivated lands.

Cite this article

YAO Ziyan , ZHANG Lijuan , TANG Shihao , LI Xiaxiang , HAO Tiantian . The basic characteristics and spatial patterns of global cultivated land change since the 1980s[J]. Journal of Geographical Sciences, 2017 , 27(7) : 771 -785 . DOI: 10.1007/s11442-017-1405-5

1 Introduction

The change of ecosystem and land cover due to human activities is one of the most important factors affecting the natural ecosystem of the Earth (Ramankutty et al., 2006; Tian et al., 2012; Tao et al., 2013; He et al., 2016). Since the 20th century, the land cover change caused by human activities has gradually become a “global” phenomenon associated with the Earth system (Chhabra et al., 2006; Liu et al., 2014). Land use and cover change (LUCC) not only affects regional sustainable development, but also impacts global change to the same extent as natural elements. LUCC has become the main contributor to the change in ecosystem in some regions (Shi et al., 2006; Findell et al., 2009; Forster et al., 2007). Agriculture, one of the most important human activities affecting land use, so far has involved 1/3 of the Earth’s terrestrial surface, which has replaced most of the vegetation on the same surface (Ramankutty et al., 2005; Godfray et al., 2010; Goldewijk et al., 2011). Although humans have used land resources to satisfy their survival needs through farming activities, this type of land change affects the Earth°s surface-atmosphere system (Ramankutty et al., 2006). In response, the feedback between agriculture and climate will change the capabilities of the ecosystem to meet human needs (Ye et al., 2009). Therefore, cultivated land change has become the most important content of LUCC research.
Both domestic and foreign scientists have conducted many studies on cultivated land change at different spatial and temporal scales. Although ample data exists, not much research has been conducted examining cultivated land on a global scale. Ramankutty and Foley combined satellite data with national and subnational agricultural inventory data and created the global 10 km spatial resolution dataset of the early 1990s. They determined that the global cultivated land area in the early 1990s was 18 million km2 and then analyzed the spatial change of the global cultivated lands (Ramankutty and Foley et al., 1998). In 1999, Ramankutty and Foley reconstructed a historical cropland dataset from 1700 to 1992 using the “hindcast” modeling technique. They reported that the global cultivated land area had increased throughout the past three centuries. Moreover, after 1700, Europe had the most rapid cultivated land expansion, followed by North America and the former Soviet Union; the largest increase in cultivated lands was at the cost of sacrificing woodlands and grasslands (Ramankutty and Foley, 1999). Based on global agricultural inventory data and satellite data, Ramankutty et al. reconstructed the global cropland vector map for the year 2000 and concluded that the global cultivated land area was approximately 15 million km2. The larger proportion of croplands was found in South and Southeast Asia, Europe, and the eastern part of the Mississippi River basin in the United States, while a smaller proportion of croplands was found in Canada and the northern part of South America (Ramankutty et al., 2008). According to the History Database of the Global Environment (HYDE), Goldewijk et al. (2011) determined that the global cultivated land area had increased by 5.5-fold in the past three centuries, with the increase in cultivated lands mainly due to converted woodlands and grasslands. Through the calibration and analysis of cultivated land data from multiple sources, in 2005 Lepers et al. found that the cultivated lands increased in all of the continents analyzed between 1981 and 1990. The increased area was mainly located in the southeastern part of Asia, Bangladesh, the Indus River Basin, the Middle East, Central Asia and the Great Plains of the United States, and the decrease in cultivated lands occurred more in the southeastern United States and eastern China (Lepers et al., 2005). Additionally, based on the statistical databases from the World Food and Agriculture Organization (FAO) of the United Nations and the World Bank Zhao (2012) analyzed the dynamic changes of cultivated lands in the 17 countries whose population was expected to exceed 100 million by 2050 and the top 10 countries with the largest cultivated land area. The results showed that most of the countries studied showed a decreasing trend of cultivated lands, and more than 90% of the countries exhibited a reduction in cultivated land area per capita (Zhao, 2012). In summary, although these studies on the spatiotemporal change of cultivated land were conducted on a global scale, most of them focused on the changes occurring before the 1990s. However, with global warming and the continuous update of global cultivated land data, people are paying more attention to the recent spatiotemporal change of global cultivated land.
In this study, we analyzed the change of global cultivated land area and the characteristics of spatial pattern change since the 1980s using the global land cover dataset CG-LTDR which has been jointly developed by the Institute of Geographic Sciences and Natural Resources Research, Chinese Academy of Sciences and the National Satellite Meteorological Center. Our data could provide the basis for investigating the effect of human activities on the Earth’s lands, ensuring the sustainable development and use of cultivated land resources and guaranteeing world crop safety.

2 Data sources and processing

2.1 Global data of cultivated land and validation

With the rapid development of satellite data and remote sensing technologies, there are a few sets of global land cover data products available internationally. In recent years, China has released several sets of global land cover data products with high resolution, such as FROM-GLC and GlobeLand30. Nevertheless, the global cultivated land usage data in each year after the 1980s are still very limited. In this study, we used the global land cover data product CG-LTDR. CG-LTDR has the following features: (1) Achieves quantitative assimilation on the pixel level by assimilating the MODIS data with a resolution of 500 m into AVEHRR data of 0.05° resolution and creates a long time series of land cover category data of the same spatial resolution in the time scale of 1982 to 2011. (2) Uses a new algorithm for land cover classification, which is known as hierarchy classification. It divides the region into major categories based on their geographic features, and then is further divided into subcategories based on subtle geographic features. It is characterized by simplifying the classification features and filtering the noise information, greatly reducing the number of classification features, and converting implicit information into explicit information. (3) CG-LTDR divides the underlying surface into 15 types of land use, including water (lake), ice and snow, wasteland, sparse vegetation, city, wetland, evergreen coniferous forest, deciduous coniferous forest, evergreen broadleaf forest, deciduous broadleaf forest, shrub, cultivated land, grassland, mixed grassland and woodland, and moss and lichens.
The spatial distribution maps of global land use in 1982, 1990, 2000 and 2011 are shown in Figure 1.
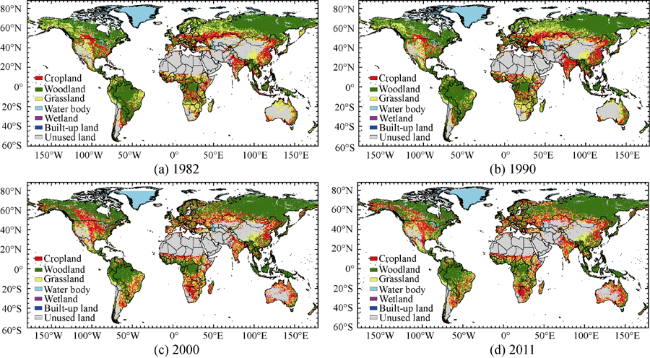
Figure 1 The spatial distribution maps of global land use in 1982, 1990, 2000 and 2011
This data product has been used as basic data in multiple studies and is validated. Shi et al. (2015) validated the classification accuracy of CG-LTDR in China. Its overall classification accuracy was as high as 65.57%, which was similar or even higher compared with other global land use data (IGBP DISCOVER, UMD, GLC2000 and MODIS LAND COVER). Based on the above study, Shang et al. (2015) and Liu et al. (2015) generated the global surface albedo product and leaf area index data, which have been used in the resource library of global and regional climate models multiple times.
To further validate the data accuracy of CG-LTDR in the regions outside of China, we compared the CG-LTDR data product with three other global land use data products including ESA-GlobCover from the European Space Agency, food and agriculture database from FAO and NASA-MCD12Q1 from the National Aeronautics and Space Administration (NASA). We downloaded three sets of data after 2010 from http://www.esa-landcover-cci.org, http://www.fao.org, and https://ladsweb.nascom.nasa.gov/data/search.html. We employed the Kappa coefficient to evaluate the spatial agreement between CG-LTDR and the other three sets of data. Due to the slight difference in land use classification from different data products, we combined some types of land use in the current study and focused on the degree of agreement for the spatial distribution of the major types of land use among different data products. The Kappa coefficient is a parameter used to compare the degree of spatial agreement between two images (Hudson, 1987). A Kappa coefficient with a value of 0-0.20 indicates the agreement as none to slight, 0.21-0.40 as fair, 0.41-0.60 as moderate, 0.61-0.80 as substantial, and 0.81-1 as almost perfect. Our results showed that CG-LTDR had substantial agreement with ESA-GlobCover data and the FAO database and had almost perfect agreement with the NASA-MCD12Q1 data (Table 1).
Table 1 The Kappa values for global land use data between different data products
Global land use dataset ESA-GlobCover FAO food and agriculture database NASA-MCD12Q1
Kappa value 0.6147 0.7104 0.8184
Agreement Substantial Substantial Almost perfect

2.2 Average annual global temperature data

Average annual global temperature data come from the meteorological elements database of the Climatic Research Unit (CRU) of the University of East Anglia in the United Kingdom. It is a comprehensive, high-resolution and continuous surface meteorological elements database, which includes data for temperature, precipitation, wind speed, evaporation and dates of frost. The data begins in 1901 and has a time resolution of one month. It covers all the lands in the world, and all the deserts and plateaus have been measured. In this paper, we chose the high-resolution gridded dataset of surface climatic variables CRU-TS3.22, and downloaded the monthly average data of global temperature between 1982 and 2011 from http://www.cru.uea.ac.uk/data. In order to analyze the spatial distributions and changes of global land temperature, we used the “To Raster” tool in the module of Spatial Analyst Tools in ArcGIS software to convert the original data into raster data. The reference coordinate system we adopted was WGS84.

3 Methods of analyses

3.1 Tendency rate

We conducted a trend analysis of the time series data of certain meteorological elements by linear trend estimation. For a series of data y(x) (x=1, 2, …, n), the original series was fitted by a linear function (Ma et al., 1993):
Y=ax+b(1)
The positive or negative value of a represents the direction of the data series over time. Its absolute value represents the rate of change, and b is the intercept.

3.2 Land use dynamic degree model

Land use change rate can be measured by using a land use dynamic model. It can not only characterize the time series change of a single type of land use, but can also analyze the overall status of the regional land use dynamics and the intra-regional difference (Liu, 2000). The formula is as follows.
$K=\frac{{{U}_{a}}-{{U}_{b}}}{{{U}_{a}}}\times \frac{1}{T}\times 100%$ (2)
where K is the dynamic degree of the type of land use during the study period. Ua and Ub are the quantities of the type of land use in the first year and last year of the study period, respectively. T is the length of study time. When T is set as years, K is the annual change rate for the type of land use in the study area. In the calculations of this paper, the unit was 0.05°×0.05°. Ua and Ub corresponded to year 1982 and year 2011, respectively.

4 Results and analyses

4.1 The spatiotemporal pattern change of global cultivated lands since the 1980s

Since the 1980s, the global cultivated land area exhibited an increasing trend at a rate of 7.920×10⁴ km2/a, although this increase was not statistically significant (p > 0.05). In 1982, the area was 1939.573×104 km2, which increased by 528.768×10⁴ km2 to 2468.340×104 km2 in 2011. The global cultivated land area exhibited the change characteristics of increase-decrease-increase over the three decades. In particular, the area increased in the 1980s and the 2000s, but decreased in the 1990s. In addition, the increasing rate in the 1980s was 3.7-fold higher than that of the 2000s. From here, we can see that the global cultivated land area increased most rapidly in the 1980s (Figure 2 and Table 2).
Figure 2 The interannual change curve of cultivated land area in different continents since the 1980s
Table 2 The characteristics of cultivated land change in different continents since the 1980s
Year Asia Europe Africa North America South America Oceania Global
Cultivated land area
(104 km2)
1982 710.016 287.521 444.869 280.407 118.850 89.331 1939.573
2011 686.247 283.486 531.629 451.261 226.740 275.823 2468.340
Average annual
cultivated
land area
749.801 267.166 494.680 333.512 167.752 158.975 2171.886
Cultivate land
area change
(1982-2011)
-23.769 -4.035 86.760 170.854 107.89 186.492 528.767
Tendency rate 1982-2011 -5.641* -0.813 -0.595 7.236** 2.780* 3.758* 6.852
1982-1989 2.382 -1.136 9.812 -2.277 10.080 2.226 20.650
1990-1999 -1.335 -8.769* -9.050 -6.821 -3.073 -0.209 -29.780
2000-2011 -0.266 0.702 -0.320 2.057 1.297 2.039 5.553
Since the 1980s, the area of other types of land use converted into cultivated lands was 1599.753×104 km2 globally, while 1071.946×104 km2 of cultivated land were converted to other types of land use globally (Table 3). The area converted into cultivated lands was larger than that converted from cultivated lands. The global increase in cultivated lands was mainly due to converted grasslands, woodlands and unused lands, accounting for 53.536%, 26.148% and 18.403% of the total increase, respectively. That is to say that half of the global increased cultivated lands were converted from grasslands. On the other hand, since the 1980s, the global decrease in cultivated lands was principally due to converted grasslands, woodlands and unused lands, which accounted for a decrease of 57.482%, 36.000% and 4.072%, respectively. The global decrease in cultivated lands was mainly due to conversion into grasslands and woodlands.
Table 3 The conversion of global cultivated lands and other types of land use (104 km2)
Asia Europe Africa North America South America Oceania Global
Land area converted
into cultivated lands
325.826 135.203 407.844 299.867 189.500 230.331 1599.753
Land area converted
from cultivated lands
349.725 139.325 321.317 129.452 81.599 43.089 1071.946
Since the 1980s, the global increase in cultivated lands was mainly distributed in southern and central Africa, with a concentration in Botswana, Sudan and Mali, mid-eastern and northern Australia, southeastern South America, with a concentration in eastern Brazil and northern Argentina, Central America and Alaska, central Canada, western Russia, northern Finland, and northern Mongolia. The highest percentage increase in cultivated land worldwide occurred in Botswana in southern Africa where there was an 80%-90% increase. Eastern Australia and Alaska in the United States also had a significant increase of 50%-60% in cultivated lands while part of southeastern South America increased by 40%-50%. On the other hand, the areas with a decrease in cultivated lands became concentrated. The decrease occurred mainly in central Africa with a concentration in southern Sudan, South and Southeast Asia, mid-southern United States, southern Russia, and Bulgaria, Romania, Serbia and Hungary in southern Europe. In addition, the largest decrease in cultivated lands occurred in southern Africa, southeastern United States and southwestern Russia with a 30%-50% reduction, while some regions had a reduction of more than 60% (Figure 3).
Figure 3 The spatial change of global cultivated lands and the rate of change since the 1980s
The conversion of global cultivated lands had a distinct spatial feature, showing a relatively concentrated regional characteristic. The conversion of grasslands to cultivated lands mostly occurred in the Southern Hemisphere and mid-latitude regions of the Northern Hemisphere. The high latitude regions of the Northern Hemisphere and the eastern part of South America had more woodlands converted to cultivated lands. On the contrary, the conversion of cultivated lands to grasslands occurred in low latitude areas. India, China, Russia and central North America all had concentrated regions of grasslands converted from cultivated lands (Figure 4).
Figure 4 The spatial distribution of global cultivated land conversion since the 1980s

4.2 The spatial pattern change of cultivated lands in different continents analyzed since the 1980s

Since the 1980s, the cultivated land areas in North America, South America and Oceania showed increasing trends, while the cultivated land areas in Asia, Europe and Africa showed decreasing trends. Compared to the data from 1982, in 2011 the cultivated land areas in North America, South America and Oceania increased by 170.854×10⁴ km2, 107.890×10⁴ km2, and 186.492×10⁴ km2, respectively. In contrast, in 2011 the cultivated land areas in Asia, Europe and Africa had a respective decrease of 23.769×10⁴ km2, 4.035×10⁴ km2 and 86.76×10⁴ km2 (Table 3). Among them, the cultivated land areas in North America and South America showed a significant increasing trend with North America experiencing the fastest rate of increase of 7.236×10⁴ km2/a. On the other hand, the cultivated land areas of Asia experienced a significant decrease at a rate of 5.641×10⁴ km2/a. The change of cultivated land area in each continent exhibited different characteristics over the years. South America and Oceania showed the same characteristics as the rest of the world. In Asia and Africa, cultivated land area increased in the 1980s and decreased thereafter. In Europe and North America, the area decreased in the 1980s and 1990s, but increased in the 2000s (Figure 2 and Table 2). The increase in cultivated lands in each continent was mainly converted from grasslands, woodlands and unused lands. In Asia, North America, Africa, South America and Oceania, the highest conversion percentages were from grasslands into cultivated lands, while the highest percentage was due to the conversion of woodlands into cultivated lands in Europe. The second largest percentage was the conversion of the unused lands into cultivated lands in Asia, Africa and Oceania, while the conversion of woodlands into cultivated lands occurred in Europe, North America and South America (Table 4). Regarding the conversion of cultivated lands into other lands, grasslands were the leading type in each continent, followed by woodlands. The sum of these two types accounted for more than 90% of the total conversion. The percentage of conversion from cultivated lands into grasslands was above 50% in each continent, with Europe reaching a conversion rate of more than 70% (Table 5).
Table 4 The area matrix of cultivated lands converted from other types of land use in different continents analyzed and the world since the 1980s (km2)
Area of cultivated lands converted from other types of land use (km2)
Asia Europe Africa North America South America Oceania Global
Woodland 587044.033 538977.272 497117.371 1295193.574 1049514.128 210610.092 4183030.965
Grassland 1685071.620 700578.490 2693786.908 1527020.934 768167.250 1168947.585 8564519.048
Construction
land
8745.380 3418.037 852.623 2675.515 1455.492 125.654 17290.898
Wetland 53106.836 29938.381 24623.822 27727.065 16697.013 18878.816 231618.103
Water area 12878.212 4244.370 4824.171 7055.778 3649.667 3989.419 57099.131
Unused land 911410.987 74871.195 857230.925 138995.122 55494.096 900758.834 2943976.114
Area percentages of cultivated lands converted from other types of land use (%)
Woodland 18.017 39.864 12.189 43.192 55.384 9.144 26.148
Grassland 51.717 51.817 66.050 50.923 40.537 50.751 53.536
Construction
land
0.268 0.253 0.021 0.089 0.077 0.005 0.108
Wetland 1.630 2.214 0.604 0.925 0.881 0.820 1.448
Water area 0.395 0.314 0.118 0.235 0.193 0.173 0.357
Unused land 27.972 5.538 21.019 4.635 2.928 39.107 18.403
Table 5 The area matrix of cultivated lands converted into other types of land use in different continents analyzed and globally since the 1980s (km2)
Area of cultivated lands converted into other types of land use (km2)
Asia Europe Africa North America South America Oceania Global
Woodland 1217276.742 300777.368 1410706.162 399259.025 341994.955 141504.896 3859019.347
Grassland 2017539.664 1065004.971 1647566.868 788780.992 373549.898 258183.988 6161722.976
Construction
land
15804.035 10816.968 1370.660 4030.622 723.119 151.457 33117.082
Wetland 57448.359 6470.664 17104.849 25935.501 41131.877 6184.790 166437.848
Water area 19388.005 2573.700 7587.074 8548.657 15530.140 6160.882 62663.411
Unused land 169794.097 7604.133 128833.594 67964.712 43064.184 18703.268 436504.043
Area percentages of cultivated lands converted into other types of land use (%)
Woodland 34.807 21.588 43.904 30.842 41.911 32.840 36.000
Grassland 57.689 76.440 51.275 60.932 45.779 59.919 57.482
Construction
land
0.452 0.776 0.043 0.311 0.089 0.035 0.309
Wetland 1.643 0.464 0.532 2.003 5.041 1.435 1.553
Water area 0.554 0.185 0.236 0.660 1.903 1.430 0.585
Unused land 4.855 0.546 4.010 5.250 5.278 4.341 4.072
Since the 1980s, the newly increased cultivated lands in Asia had been mainly distributed in southern and northwestern India, northern Kazakhstan, northern Mongolia, southwestern Russia, northeastern China, and mid-western Turkey. Among them, in Asia, northern Kazakhstan, northern Mongolia and northwestern India had the greatest percentages of cultivated land increase, being 50%-60%. In southern India and mid-western Turkey, the percentages were 40%-50%. In contrast, Japan, North Korea, Malaysia and Indonesia had notable decreases in cultivated lands, with a 40%-50% decrease observed in some regions. In addition, central India, southeastern China and the southwestern border of Russia all had reductions in cultivated lands. On the other hand, the increase in cultivated lands was mostly due to the conversion of woodlands in Russia and grasslands in Kazakhstan, Mongolia, India and Turkey. The northern boundary of cultivated lands in Asia moved from a latitude of 66°N in 1982 to 68°N in 2011 (Figures 3 and 5a).
Figure 5 The spatial distribution of cultivated land conversions in different continents since the 1980s
In Europe, the cultivated lands increased in northern Europe and decreased in southern Europe since the 1980s. Several countries in northern Europe, including Norway, Sweden, Finland, Iceland and the United Kingdom had obvious increases of cultivated lands. In particular, northern Finland had the largest increase of 50%-60%. Some countries in southern Europe, including Germany, Italy, Ukraine and Romania had notable decreases in cultivated lands of 20%-30% in most regions. In Russia, France, Spain and Portugal, there were both increases and decreases in cultivated lands occurring at the same time. Among these countries, cultivated lands had expanded to mid-northern Russia, while the original cultivated lands were converted into other types of lands in southern Russia. In France, the expansion of cultivated lands was observed in mid-southern areas, and the decrease in northern areas. In Spain, cultivated lands had been expanded to eastern areas and decreased in southwestern areas. In Portugal, the expansion of cultivated lands was seen in mid-northern areas, and the reduction in southern areas. The northern boundary of cultivated lands in Europe moved from a latitude of 55°N in 1982 to 71°N in 2011 (Figures 3 and 5b).
In Africa, the increase in cultivated lands was mainly distributed in the area of 10°-15°N and the southern area of 15°S, and the decrease in cultivated land was mainly located in the area between 10°N and 15°S since the 1980s. Overall, the cultivated lands in Africa moved to higher latitude and also decreased to a great extent. Additionally, the southern African Botswana showed the largest percentage increase in cultivated land with a 90%-100% increase. Southeastern Angola, northeastern Namibia, mid-northern South Africa, Zimbabwe, Burkina Faso, southern Chad and southern Sudan also showed a relatively high percentage increase of 50%-70%. The percentage increase in cultivated lands in Madagascar was 40%-60%. On the other hand, southern areas of the Democratic Republic of the Congo and northeastern Angola showed the highest percentage decrease in cultivated lands, which was 60%-70%. With respect to land conversion, the increase in cultivated lands in Africa was primarily due to a conversion into grasslands, while the decrease in cultivated lands was mainly due to conversion of grasslands and woodlands. The northern boundary of African cultivated lands, located south of the Sahara, moved from a latitude of 16°N to 17°N (Figures 3 and 5c).
In North America, the central United States and Alaska, and central Canada showed the highest percentage increase in cultivated land of 50%-70%. In the United States, Canada and Mexico, both an increase and decrease in cultivated lands took place. In the United States, the increase in cultivated lands was primarily located in central areas, western areas and Alaska; the increase in Alaska was remarkable. In Canada, the cultivated lands expanded towards the north, while there was a reduction in cultivated lands in the mid-southern areas. The increased cultivated land in Mexico is mainly located in the northeast, while the cultivated land along the west border shows a declining trend. The northern boundary of cultivated land in North America moved from 67°N in 1982 to 70°N in 2011 (Figures 3 and 5d).
In South America, Uruguay, southeastern Brazil, northeastern Argentina, and northern Columbia, cultivated lands increased by 50%-60% in some areas. In contrast, the cultivated lands in central and northern Argentina reduced significantly by 40%-60%. The decrease in cultivated lands in western Brazil and Venezuela was approximately 20%. The cultivated land area in western and eastern Columbia also declined. The cultivated lands showed an expansion in the east and a reduction in the west in many South American countries. The northern boundary of cultivated land in South America moved from 53°S in 1982 to 55°S in 2011 (Figures 3 and 5e).
In Oceania, Australia showed the greatest increase in cultivated lands of 189.165×10⁴ km2. The increased cultivated lands extended from the north, east and south to the inland and were more pronounced in northern and eastern areas with a percentage of 60%-70%. In addition, there was a relatively great increase in cultivated lands in the South Island of New Zealand which increased by 2904.572 km2, most of which were converted from grasslands. The northern boundary of cultivated land in Oceania moved from 46°S in 1982 to 47°S in 2011 (Figures 3 and 5f).

5 Discussion

In this paper, we used the CG-LTDR global cultivated lands data and analyzed the spatiotemporal characteristics of global cultivated land change since the 1980s. Compared to existing studies, we focused on the time series characteristics and spatial patterns of land area change and revealed the spatial patterns of global cultivated land changes in the past 30 years.
(1) We verified our results by comparing our findings with those from other relevant studies. According to the study periods used in existing studies, we calculated the results of the same periods using CG-LTDR data. The comparison results are shown in Table 6. It can be seen that although we used source data and research methods that are different from other researchers, our results were consistent with the conclusions made by others. This verified the credibility of our research conclusions. In addition, because we combined the spatial vector data, our results were more quantitative than other studies conducted to date. For example, Xie and Cheng (1999) reported that the global cultivated lands showed an increasing trend before 1985 and a decreasing trend between 1985 and 1995. Our data are consistent with these data as we also found that the global cultivated lands had a decreasing trend between 1985 and 1995. Also, we further pointed out that the reduction was not significant at a rate of 19.772×10⁴ km2/a. Abbas et al. (2009) found that from 1975 to 2005, the cultivated lands in Nigeria expanded towards the southern forest areas, while the original cultivated lands were reduced. With similar findings as Abbas, we further calculated that the expanded area was 214,197.544 km2 towards the southern forest areas, while the original cultivated lands reduced by 187,354.798 km2 (Figure 7d). On the contrary, some of our conclusions were different from others. For example, Ramankutty and Foley (1998, 1999) determined that the global cultivated land area was 1800×104 km2 in the early 1990s and that the lands were mainly located in Eurasia, followed by North America and Africa. However, our study showed that the global cultivated land area was 1845.761×104 km2 in the early 1990s, and that the lands were primarily located in southern Europe, northeastern Mongolia, eastern China, the Great Lakes area and the Mississippi River basin in the United States, sub-Saharan Africa, southern Congo and the southern Democratic Republic of the Congo. In addition, because the study period in this paper included the most recent 30 years, the study period and some of our conclusions were different from other research.
Table 6 Comparisons between our results and the results of previous studies
The results of previous studies Our results
1 Xie and Cheng (1999) reported that the global cultivated lands showed an increasing trend before 1985 and a decreasing trend between 1985 and 1995. We found that the global cultivated lands showed a decreasing trend between 1985 and 1995. We further pointed out that the reduction was not significant at a rate of 19.772×10⁴ km2/a.
2 Lepers et al. (2005) found that the global cultivated land increased from 1981 to 1990 in all the continents analyzed, and that the main areas that increased were in southeastern Asia, Bangladesh, the Indus River basin, Middle East, Central Asia and the Great Plains of the United States. The cultivated lands had an increasing trend in Asia and South America from 1982 to 1990, but the cultivated lands had a decreasing trend in other continents. The areas with increased cultivated lands were mainly located in southeastern Asia and sub-Saharan Africa, and the areas with reduced cultivated lands were primarily distributed in the areas near the equator in Africa, southeastern United States and eastern China (Figure 6).
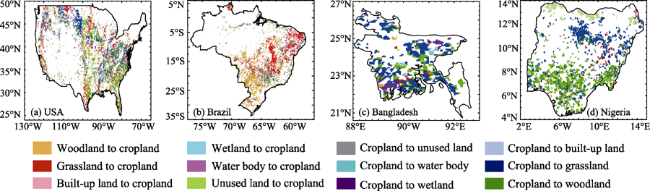
3 Waisanen and Bliss (2002) demonstrated that the cultivated land area in the United States showed an increasing trend from 1982 to 1992. We found that the cultivated lands in the United States increased from 1982 to 1992, but the increase was not significant. The increased areas were mainly located in central and western regions (Figure 7a).
4 Du et al. (2015) indicated that from 1980 to 2005 the cultivated lands of Brazil increased rapidly in all regions except the northern tropical rain forest area. The cultivated lands of Brazil presented an increasing trend from 1980 to 2005, this was mainly due to converted grasslands and woodlands (Figure 7b).
5 Dewan and Yamaguchi (2009) reported that from 1960 to 2005 the cultivated lands in Bangladesh continuously declined and that it was due to conversion into woodlands and construction lands. Between 1982 and 2005 the cultivated lands in Bangladesh showed a rapid decrease that was mainly due to conversion into grasslands and woodlands (Figure 7c).
6 Abbas (2009) determined that from 1975 to 2005 the cultivated land in Nigeria expanded towards the southern forest area, while the original cultivated land area reduced. The cultivated lands in Nigeria expanded by 214197.544 km2 towards the southern forest area, while the original cultivated lands reduced by 187354.798 km2 from 1982 to 2005 (Figure 7d).
7 Müller and Sikor (2006) found that many cultivated lands were abandoned in southeastern Albania from 1988 to 2003. The cultivated land area in Albania significantly reduced from 1988 to 2003; the decrease was mainly due to a conversion into grasslands.
8 Ramankutty and Foley (1998) reported that the global cultivated land area was 1800×104 km2; the land was concentrated in Asia and Europe, followed by North America and Africa in the 1990s. We calculated the global cultivated land area as 1845.761×104 km2. The lands were mainly located in southern Europe, northeastern Mongolia, eastern China, the area near the Great Lakes and Mississippi River basin in the United States, sub-Saharan Africa, Republic of the Congo, and southern Democratic Republic of the Congo in Africa.
9 Ramankutty and Foley (1999) determined that the cultivated land area showed an increasing trend from 1700 to 1992. After 1700, the fastest expansion of cultivated lands occurred in Europe, followed by North America and South America. We analyzed the spatial change of global cultivated lands from 1982 to 2011, which was very recent and covered a short time span. Moreover, we found that the most rapid cultivated land expansion occurred in Oceania.
10 Goldewijk et al. (2011) examined the data of global cultivated lands from 1700 to 1990, and concluded that the global cultivated land area increased by 5.5-fold during the past three centuries. We analyzed the spatial change of global cultivated lands from 1982 to 2011, and concluded that the global cultivated land area increased by 1.273-fold during the past 30 years.
Figure 6 The spatial change of global cultivated lands from 1982 to 1990
Figure 7 The spatial distribution of cultivated land conversions in different countries
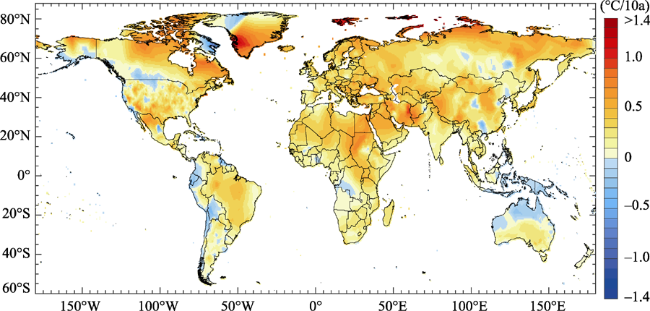
Figure 8 The spatial distribution of global temperature change since the 1980s
(2) Due to the large spatial scale covered in our study, the spatial resolution was not very high. Therefore, we focused on the areas with a high percentage of cultivated land change and the concentrated areas that had cultivated land change. The dispersed or relatively small areas with cultivated land change were not described in detail. Due to the length limit of this paper, we only analyzed this change in different continents, and we did not examine the cultivated land distribution and the spatial pattern of cultivated land change in each country. In addition, there was a significant amount of work involved in converting, cropping and overlaying the image layers used in our data analysis. Consequently, this may have resulted in some errors that could have affected the accuracy of our results.
(3) As can be seen by comparing Figure 3 and 8, the expansion of cultivated lands to high latitudes exhibited in all the continents analyzed, to different extents, indicates that global warming has provided a natural condition for this type of expansion. On the other hand, global warming also promotes the expansion of cultivated lands to high altitude areas. Accordingly, next we will investigate the influence of global warming on cultivated land expansion using global elevation data.

6 Conclusions

(1) From 1982 to 2011, the global cultivated land area increased at a rate of 7.920×10⁴ km2/a, although this increase was not significant. The total cultivated land increase over time was 528.768×10⁴ km2. The global cultivated land area increased in the 1980s and 2000s and decreased in the 1990s. The increased cultivated lands were mainly converted from grasslands, woodlands and unused lands, which were also the three types of land to which cultivated lands were mainly converted.
(2) Since the 1980s, cultivated land areas increased by 170.854×10⁴ km2, 107.890×10⁴ km2, and 186.492×10⁴ km2 in North America, South America, and Oceania, respectively, while respective decreases in cultivated land areas of 23.769×10⁴ km2, 4.035×10⁴ km2, and 86.76×10⁴ km2 occurred in Asia, Europe and Africa. The cultivated land areas increased significantly in North America and South America and decreased significantly in Asia. The cultivated land in North America showed the fastest increase in the most recent 10 years and South America showed the fastest increase in cultivated land in the 1980s. The cultivated land in Asia continued to decline after the 1990s. The newly increased cultivated lands were primarily converted from grasslands, woodlands and unused lands in each continent analyzed, and the decreased cultivated lands were converted to grasslands and woodlands.
(3) The global increase in cultivated lands was concentrated in southern and central Africa, eastern and northern Australia, southeastern South America, central United States and Alaska, central Canada, western Russia, northern Finland and northern Mongolia. The highest increase was found in Botswana in southern Africa, which showed an 80%-90% increase. On the other hand, the decrease in cultivated lands was concentrated in southern Sudan in central Africa, mid-southern United States, southern Russia and countries in southern Europe, including Bulgaria, Romania, Serbia, and Hungary. The highest decrease was found in southern Africa, southeastern United States, and southwestern Russia.
(4) The cultivated lands in all continents analyzed showed a trend towards expanding to high latitudes. Meanwhile, the spatial pattern of cultivated lands exhibited the characteristics of the expansion of newly increased cultivated lands and the reduction of original cultivated lands observed in most countries.

The authors have declared that no competing interests exist.

[1]
Abbas I I, 2009. An overview of land cover changes in Nigeria, 1975-2005.Journal of Geography & Regional Planning, 5(12): 62-65.The pattern of land cover changes between 1975 and 2005 strongly indicated loss of prime arable lands which is in turn leading to the opening up of new virgin land towards the south. In the northern and the middle parts of the country, the cereal productive Sudan Savannah ecology is transiting to pure Sahel and the influence of the Sahara is increasing southwards. In the same vein, the root and the tuber productive ecology of the Guinea Savannah is giving way to Sudan Savannah grassland. The predominant Fulani herdsman of the lower Sahel and Sudan Savannah ecologies is moving south to the Guinea Savannah and Forest belt of the South to find greener pasture for his herds. This is not acceptable to the root and tuber farmers of the Guinea Savannah that is already farming close to the margin of cultivation. He has the fears that Fulani herds will destroy his farm-lands. The natural result is clash over right to the lands. This paper therefore looks at the land cover changes in Nigeria between 1975 and 2005 with a view to explaining this scenario. Key words: Land cover, land use, pattern, afforestation, degradation.

DOI

[2]
Chhabra A, Geist H, Houghton R A et al., 2006. Multiple impacts of land-use/cover change. In: Land-Use and Land-Cover Change. Berlin and Heidelberg: Springer, 71-116.

[3]
Dewan A M, Yamaguchi Y, 2009. Using remote sensing and GIS to detect and monitor land use and land cover change in Dhaka Metropolitan of Bangladesh during 1960-2005.Environmental Monitoring & Assessment, 150(150): 237-249.This paper illustrates the result of land use/cover change in Dhaka Metropolitan of Bangladesh using topographic maps and multi-temporal remotely sensed data from 1960 to 2005. The Maximum likelihood supervised classification technique was used to extract information from satellite data, and post-classification change detection method was employed to detect and monitor land use/cover change. Derived land use/cover maps were further validated by using high resolution images such as SPOT, , IKONOS and field data. The overall accuracy of land cover change maps, generated from Landsat and -1D data, ranged from 85% to 90%. The analysis indicated that the urban expansion of Dhaka Metropolitan resulted in the considerable reduction of wetlands, cultivated land, vegetation and bodies. The maps showed that between 1960 and 2005 built-up areas increased approximately 15,924 ha, while agricultural land decreased 7,614 ha, vegetation decreased 2,336 ha, wetland/lowland decreased 6,385 ha, and bodies decreased about 864 ha. The amount of urban land increased from 11% (in 1960) to 344% in 2005. Similarly, the of landfill/soils category was about 256% in the same period. Much of the city's rapid in population has been accommodated in informal settlements with little attempt being made to limit the risk of environmental impairments. The study quantified the patterns of land use/cover change for the last 45 years for Dhaka Metropolitan that forms valuable resources for urban planners and decision makers to devise sustainable land use and environmental planning.

DOI PMID

[4]
Du Guoming, Kuang Wenhui, Meng Fanhaoet al., 2015. Spatiotemporal pattern and driving forces of land use/cover change in Brazil.Progress in Geography, 34(1): 73-82. (in Chinese)Land use/cover change (LUCC) is one of the hot topics in the study of global change. In this research, the authors adopted the method of human-computer interaction to amend the 2005 ESA GlobalCover land use data based on the Landsat TM/ETM remotely sensed data around 2005, then used the inverse phase visual interpretation method to extract land use/cover change information between 1980 and 2005 based on the Landsat MSS/ TM remotely sensed data in the 1980s, and analyzed the Spatiotemporal pattern and driving forces of the change. The results show that in the 25 years between 1980 and 2005, that area of land use/cover change reached 794300 kmin Brazil, accounting for 9.33% of the total land area. Among these, cropland increased by 201800 km, cropland/ natural vegetation mosaic increased by 107000 km, forest area decreased by 531200 km, shrub and grassland converted to other land use types by 236000 kmand the opposite conversion was 447000 kmwith a net increase of this land use category by 211000 km, water increased by 4600 km, urban and built-up areas extended by 7573.87 km. But the land use macroscopic structure did not change. Regional differences of the main land use change forms including deforestation, grassland in- and out- conversion, Land reclamation, and urban and built-up area expansion led to different land use/cover change characteristics in tropical and subtropical moist broadleaf forest ecological zone, tropical and subtropical dry broadleaf forest ecological zone, tropical and subtropical steppe ecological zone, grassland and marsh wetland ecological zone, desert and xeric plants ecological zone, and mangrove forest ecological zone. Natural geographical conditions such as landform, climate, and vegetation profoundly affected the macro pattern of land use and the possibility of land use change. Although climate change had a certain impact on cropland reclamation and the increase of grassland, land use policy, economy and foreign trade development, population growth and migration, and road construction were the direct causes of land use change in Brazil.

[5]
Findell K L, Pitman A J, England M Het al., 2009. Regional and global impacts of land cover change and sea surface temperature anomalies.Journal of Climate, 22(12): 3248-3269.The atmospheric and land components of the Geophysical Fluid Dynamics Laboratory's (GFDL's) Climate Model version 2.1 (CM2.1) is used with climatological sea surface temperatures (SSTs) to investigate the relative climatic impacts of historical anthropogenic land cover change (LCC) and realistic SST anomalies. The SST forcing anomalies used are analogous to signals induced by El Ni o outhern Oscillation (ENSO), the North Atlantic Oscillation (NAO), and the background global warming trend. Coherent areas of LCC are represented throughout much of central and eastern Europe, northern India, southeastern China, and on either side of the ridge of the Appalachian Mountains in North America. Smaller areas of change are present in various tropical regions. The land cover changes in the model are almost exclusively a conversion of forests to grasslands. Model results show that, at the global scale, the physical impacts of LCC on temperature and rainfall are less important than large-scale SST anomalies, particularly those due to ENSO. However, in the regions where the land surface has been altered, the impact of LCC can be equally or more important than the SST forcing patterns in determining the seasonal cycle of the surface water and energy balance. Thus, this work provides a context for the impacts of LCC on climate: namely, strong regional-scale impacts that can significantly change globally averaged fields but that rarely propagate beyond the disturbed regions. This suggests that proper representation of land cover conditions is essential in the design of climate model experiments, particularly if results are to be used for regional-scale assessments of climate change impacts.

DOI

[6]
Forster P, Ramaswamy V, Artaxo P et al., 2007. Changes in atmospheric constituents and in radiative forcing. Climate Change 2007: The Physical Science Basis Contribution of Working Group I to the Fourth Assessment Report of The Intergovernmental Panel on Climate Change. Cambridge, UK: Cambridge University Press.

[7]
Godfray H C, Beddington J R, Crute L Ret al., 2010. Food security: The challenge of feeding 9 billion people.Science, 327(5967): 812-818.

DOI

[8]
Goldewijk K K, Beusen A, Drecht G Vet al., 2011. The HYDE 3.1 spatially explicit database of human-induced global land-use change over the past 12,000 years.Global Ecology and Biogeography, 20(1): 73-86.ABSTRACT Aim68 This paper presents a tool for long-term global change studies; it is an update of the History Database of the Global Environment (HYDE) with estimates of some of the underlying demographic and agricultural driving factors. Methods68 Historical population, cropland and pasture statistics are combined with satellite information and specific allocation algorithms (which change over time) to create spatially explicit maps, which are fully consistent on a 5′ longitude/latitude grid resolution, and cover the period 10,000 bc to ad 2000. Results68 Cropland occupied roughly less than 1% of the global ice-free land area for a long time until ad 1000, similar to the area used for pasture. In the centuries that followed, the share of global cropland increased to 2% in ad 1700 ( c . 3 million km2) and 11% in ad 2000 (15 million km2), while the share of pasture area grew from 2% in ad 1700 to 24% in ad 2000 (34 million km2) These profound land-use changes have had, and will continue to have, quite considerable consequences for global biogeochemical cycles, and subsequently global climate change. Main conclusions68 Some researchers suggest that humans have shifted from living in the Holocene (emergence of agriculture) into the Anthropocene (humans capable of changing the Earth's atmosphere) since the start of the Industrial Revolution. But in the light of the sheer size and magnitude of some historical land-use changes (e.g. as result of the depopulation of Europe due to the Black Death in the 14th century and the aftermath of the colonization of the Americas in the 16th century) we believe that this point might have occurred earlier in time. While there are still many uncertainties and gaps in our knowledge about the importance of land use (change) in the global biogeochemical cycle, we hope that this database can help global (climate) change modellers to close parts of this gap.

DOI

[9]
He Fanneng, Li Meijiao, Liu Haolong, 2016. Reconstruction of cropland area at Lu scale and its spatial-temporal characteristics in the Northern Song Dynasty.Acta Geographica Sinica, 71(11): 1967-1978. (in Chinese)Based on "Cropland Taxes" and "the Number of Households" data recorded in historical documents, this paper estimated cropland area of the Northern Song Dynasty by analyzing some society factors in this dynasty, including land use policies and taxation system.Besides, by quantifying the relationship among population proportion, per capita cropland and cropland spatial pattern in the mid-Northern Song Dynasty, we designed a cropland distribution model. And the model was used to reconstruct cropland area at Lu(administrative region of the Northern Song Dynasty) scale for AD 976, 997, 1066 and 1078. The results are shown as follows:(1) The cropland area of the whole study area for AD 976, 997, 1066 and 1078 of the Northern Song Dynasty were about 468.27 million mu(Chinese area unit, 1 mu=666.7 m~2),495.53 million mu, 697.65 million mu and 731.94 million mu, respectively, and 264 million mu was increased for AD 976-1078. The annual growth rate of cropland area was about 4.4鈥, and the reclamation rate(i.e. ratio of cropland area to total land area) increased from 10.7% to16.8%, and per capita cropland area decreased from 15.7 mu to 8.4 mu.(2) In terms of the characteristics of cropland spatial pattern change, the reclamation rate of the Southeast,Northern and Southwest in the Northern Song territory increased by 12.0%, 5.2% and 1.2%,respectively, and that of some regions of the Yangtze River Plain increased to more than 40%,and for the North China Plain the reclamation rate increased to more than 20%. The reclamation rate of the Southwest(except the Chengdu Plain) in the Northern Song territory was less than 6%.(3) The evaluation results show that the absolute relative error of 84.2% Lu was less than 20%, so the cropland distribution model is feasible. Therefore, our reconstruction results can reflect the spatial- temporal characteristics of cropland area in the Northern Song Dynasty.

DOI

[10]
Hudson W D, 1987. Correct formulation of the Kappa coefficient of agreement.Photogrammetric Engineering & Remote Sensing, 53(4): 421-422.Abstract To put right the large number of erroneous formulae and incorrect numerical results published in the remote sensing fields, this paper briefly reviews the correct formulation.-after Authors

DOI

[11]
Lepers E, Lambin E F, Janetos A Cet al., 2005. A synthesis of information on rapid land-cover change for the period 1981-2000.BioScience, 55(2): 115-124.This article presents a synthesis of what is known about areas of rapid land-cover change around the world over the past two decades, based on data compiled from remote sensing and censuses, as well as expert opinion. Asia currently has the greatest concentration of areas of rapid land-cover changes, and dryland degradation in particular. The Amazon basin remains a major hotspot of tropical deforestation. Rapid cropland increase, often associated with large-scale deforestation, is prominent in Southeast Asia. Forest degradation in Siberia, mostly related to logging activities, is increasing rapidly. The southeastern United States and eastern China are experiencing rapid cropland decrease. Existing data do not support the claim that the African Sahel is a desertification hotspot. Many of the most populated and rapidly changing cities are found in the tropics.

DOI

[12]
Liu Jiyuan, 2000. A study on spatial-temporal feature of modem land use change in China.Quaternary Sciences, 20(3): 229-239. (in Chinese)

[13]
Liu Jiyuan, Kuang Wenhui, Zhang Zengxianget al., 2014. Spatiotemporal characteristics, patterns and causes of land use changes in China since the late 1980s.Acta Geographica Sinica, 69(1): 3-14. (in Chinese)Land-use/land-cover changes (LUCCs) have links to both human and nature interactions. China’s Land-Use/cover Datasets (CLUDs) were updated regularly at 5-year intervals from the late 1980s to 2010, with standard procedures based on Landsat TMETM+ images. A land-use dynamic regionalization method was proposed to analyze major land-use conversions. The spatiotemporal characteristics, differences, and causes of land-use changes at a national scale were then examined. The main findings are summarized as follows.Land-use changes (LUCs) across China indicated a significant variation in spatial and temporal characteristics in the last 20 years (1990–2010). The area of cropland change decreased in the south and increased in the north, but the total area remained almost unchanged. The reclaimed cropland was shifted from the northeast to the northwest. The built-up lands expanded rapidly, were mainly distributed in the east, and gradually spread out to central and western China. Woodland decreased first, and then increased, but desert area was the opposite. Grassland continued decreasing. Different spatial patterns of LUC in China were found between the late 20th century and the early 21st century. The original 13 LUC zones were replaced by 15 units with changes of boundaries in some zones. The main spatial characteristics of these changes included (1) an accelerated expansion of built-up land in the Huang-Huai-Hai region, the southeastern coastal areas, the midstream area of the Yangtze River, and the Sichuan Basin; (2) shifted land reclamation in the north from northeast China and eastern Inner Mongolia to the oasis agricultural areas in northwest China; (3) continuous transformation from rain-fed farmlands in northeast China to paddy fields; and (4) effectiveness of the “Grain for Green” project in the southern agricultural-pastoral ecotones of Inner Mongolia, the Loess Plateau, and southwestern mountainous areas. In the last two decades, although climate change in the north affected the change in cropland, policy regulation and economic driving forces were still the primary causes of LUC across China. During the first decade of the 21st century, the anthropogenic factors that drove variations in land-use patterns have shifted the emphasis from one-way land development to both development and conservation.The “dynamic regionalization method” was used to analyze changes in the spatial patterns of zoning boundaries, the internal characteristics of zones, and the growth and decrease of units. The results revealed “the pattern of the change process,” namely the process of LUC and regional differences in characteristics at different stages. The growth and decrease of zones during this dynamic LUC zoning, variations in unit boundaries, and the characteristics of change intensities between the former and latter decades were examined. The patterns of alternative transformation between the “pattern” and “process” of land use and the causes for changes in different types and different regions of land use were explored.

DOI

[14]
Liu Yang, Liu Ronggao, 2015. Retrieval of global long-term leaf area index from LTDR AVHRR and MODIS observations.Journal of Geo-Information Science, 17(11): 1304-1312. (in Chinese)Leaf area index(LAI) is a primary parameter for charactering the water, carbon and energy exchanges among soil, vegetation and the atmosphere. Global long-term LAI datasets help to understand the response and feedback of vegetation to climate change. In this paper, the global LAI was retrieved during a 32- year period from 1981 to 2012 by utilizing a combination of MODIS measurements and reprocessed long-term data record(LTDR) AVHRR observations. The high- quality MODIS observations were used to constrain the LAI retrieval from historical AVHRR data, by establishing the pixel- by- pixel relationship between them directly. Thus, the inconsistency of LAI derived from these two notably different sensors could be reduced, and the quality of LAI derived from AVHRR data could be improved. Firstly, MODIS LAI series(2000- 2012) were generated from high- quality MODIS land surface reflectance based on the GLOBCARBON LAI algorithm. Then, the relationships between AVHRR Simple Ratio(SR) and MODIS LAI were regressed pixel- by- pixel using the multi- year average values of these two data for each 8- day period. After that, the AVHRR LAI was estimated from historical AVHRR observations based on these pixel- level relationships from 1981 to 1999. The retrieved LAI could represent the spatial distribution of global vegetation and the seasonal characteristics of the major biomes. The LAI derived from AVHRR was inter- compared with that from MODIS. The results demonstrate a good consistency between the LAIs from these two different sensors. The comparison with NASA MODIS standard products of MOD15A2 shows that our results are consistent with MOD15A2 in both spatial pattern and seasonal cycle.

DOI

[15]
Ma Kaiyu, Ding yuguo,Tu Qipu et al., 1993. Principles and Methods of Climate Statistics. Beijing: China Meteorological Press, 77-82. (in Chinese)

[16]
Müller D, Sikor T, 2006. Effects of postsocialist reforms on land cover and land use in south-eastern Albania.Applied Geography, 26(3): 175-191.This paper examines effects of postsocialist reforms on land cover and land use through a case study from South-eastern Albania. The paper uses satellite data to measure changes in land cover between 1988 and 2003, draws on a village survey to assess changes in local land-use practices, and examines shifts in the determinants of land cover through seemingly unrelated regressions at the village level. The results show a high incidence of cropland abandonment especially in lower-lying areas closer to markets. Socio-economic factors have emerged as new determinants of spatial variation, suggesting a growing influence of market principles on land use.

DOI

[17]
Ramankutty N, Achard F, Alves Det al., 2005. Global changes in land cover.IHDP Newsletter, (3): 4-5.

[18]
Ramankutty N, Delire C, Snyder P, 2006. Feedbacks between agriculture and climate: An illustration of the potential unintended consequences of human land use activities.Global and Planetary Change, 54(1/2): 79-93.Agriculture has significantly transformed the face of the planet. In particular, croplands have replaced natural vegetation over large areas of the global land surface, covering around 18 million km 2 of the land surface today. To grow crops, humans have taken advantage of the resource provided by climate optimum temperature and precipitation. However, the clearing of land for establishing croplands might have resulted in an inadvertent change in the climate. This feedback might, in turn, have altered the suitability of land for growing crops. In this sensitivity study, we used a combination of land cover data sets, numerical models, and cropland suitability analysis, to estimate the degree to which the replacement of natural vegetation by croplands might have altered the land suitability for cultivation. We found that the global changes in cropland suitability are likely to have been fairly small, however large regional changes in cropland suitability might have occurred. Our theoretical study showed that major changes in suitability occurred in Canada, Eastern Europe, the Former Soviet Union, northern India, and China. Although the magnitude, sign, and spatial patterns of change indicated by this study may be an artifact of our particular model and experimental design, our study is illustrative of the potential inadvertent consequences of human activities on the land. Moreover, it offers a methodology for evaluating how climate changes due to human activities on the land may alter the multiple services offered by ecosystems to human beings.

DOI

[19]
Ramankutty N, Evan A T, Monfreda Cet al., 2008. Farming the planet: 1. Geographic distribution of global agricultural lands in the year 2000.Global Biogeochemical Cycles, 22(1): 567-568.Agricultural activities have dramatically altered our planet's land surface. To understand the extent and spatial distribution of these changes, we have developed a new global data set of croplands and pastures circa 2000 by combining agricultural inventory data and satellite-derived land cover data. The agricultural inventory data, with much greater spatial detail than previously available, is used to train a land cover classification data set obtained by merging two different satellite-derived products (Boston University's MODIS-derived land cover product and the GLC2000 data set). Our data are presented at 5 min (~10 km) spatial resolution in longitude by longitude, have greater accuracy than previously available, and for the first time include statistical confidence intervals on the estimates. According to the data, there were 15.0 (90% confidence range of 12.2-17.1) million kmof cropland (12% of the Earth's ice-free land surface) and 28.0 (90% confidence range of 23.6-30.0) million kmof pasture (22%) in the year 2000.

DOI

[20]
Ramankutty N, Foley J A, 1998. Characterizing patterns of global land use: An analysis of global croplands data. Global Biogeochemical Cycles, 12(4): 667-685.Human activities have shaped significantly the state of terrestrial ecosystems throughout the world. One of the most direct manifestations of human activity within the biosphere has been the conversion of natural ecosystems to croplands. In this study, we present an analysis of the geographic distribution and spatial extent of permanent croplands. This analysis represents the area in permanent croplands during the early 1990s for each grid cell on a global 5 min ( 10 km) resolution latitude-longitude grid. To create this data set, we have combined a satellite-derived land cover data set with a variety of national and subnational agricultural inventory data. A simple calibration algorithm was used so that the spatial land cover data were generally consistent with nonspatial agricultural inventory data. The spatial distribution of croplands represented in this analysis presents a quantitative depiction of global agricultural geography. The regions of the world known to have intense cultivation (e.g., the North American corn belt, the European wheat-corn belt, the Ganges floodplain, and eastern China) are clearly portrayed in this analysis. It also captures the less intensely cultivated regions of the world, usually surrounding the regions mentioned above, and regions characterized by subsistence agriculture (e.g., Sahelian Africa). Data generated from this kind of analysis can be used within global climate models and global ecosystem models to assess the importance of permanent croplands on environmental processes. In particular, these data, combined with models, could help evaluate the role of changing land cover on regional climate and carbon cycling. Future efforts will need to concentrate on other land use systems, including pastures and regions of shifting cultivation. Furthermore, land use and land cover data must be extended to include an historical dimension so as to evaluate the changing state of the biosphere over time. This article contains supplementary material.

DOI

[21]
Ramankutty N, Foley J A, 1999. Estimating historical changes in global land cover: Croplands from 1700 to 1992.Global Biogeochemical Cycles, 13(4): 997-1027.Human activities over the last three centuries have significantly transformed the Earth's environment, primarily through the conversion of natural ecosystems to agriculture. This study presents a simple approach to derive geographically explicit changes in global croplands from 1700 to 1992. By calibrating a remotely sensed land cover classification data set against cropland inventory data, we derived a global representation of permanent croplands in 1992, at 5 min spatial resolution [Ramankutty and Foley, 1998]. To reconstruct historical croplands, we first compile an extensive database of historical cropland inventory data, at the national and subnational level, from a variety of sources. Then we use our 1992 cropland data within a simple land cover change model, along with the historical inventory data, to reconstruct global 5 min resolution data on permanent cropland areas from 1992 back to 1700. The reconstructed changes in historical croplands are consistent with the history of human settlement and patterns of economic development. By overlaying our historical cropland data set over a newly derived potential vegetation data set, we analyze our results in terms of the extent to which different natural vegetation types have been converted for agriculture. We further examine the extent to which croplands have been abandoned in different parts of the world. Our data sets could be used within global climate models and global ecosystem models to understand the impacts of land cover change on climate and on the cycling of carbon and water. Such an analysis is a crucial aid to sharpen our thinking about a sustainable future.

DOI

[22]
Shang Rong, Liu Ronggao, Liu Yang, 2015. Generation of global long-term albedo product based on the background knowledge.Journal of Geo-Information Science, 17(11): 1313-1322. (in Chinese)Global continuous long-term surface albedo products are of great importance to land surface process and climate modeling research. Problems such as severe data missing and low effective retrieval percentage in the current albedo products made them difficult to meet the requirements of climate modeling perfectly. To solve those problems, this paper made two improvements on MODIS albedo product algorithm. One improvement was to modify the way of composing and selecting enough directional reflectance, which were used for the generation of background BRDF parameters. We assumed that the surface would change little in the same time period during different years. Therefore, all directional reflectance of multi-years for each time period could be used for the composition and selection, in which at least 7 valid directional reflectance for each pixel were used to conduct the BRDF retrieval. Another improvement was the quantitative data fusion between MODIS and AVHRR data, which helped to expand the temporal coverage of albedo products to 30 years. Validation results showed that this new albedo product kept great consistency with the relatively homogeneous SURFRAD site albedos and was almost the same with MODIS snow-free albedo product. These were no spatial or temporal data missing in this new albedo product and the temporal coverage had been greatly improved. Therefore, this new albedo product would be more suitable for the applications of land surface process and climate modeling research.

[23]
Shi Peijun, Wang Jing'ai, Chen Jinget al., 2006. The future of human-environment interaction research in geography: Lessons from the 6th Open Meeting of IHDP.Acta Geographica Sinica, 61(2): 115-126. (in Chinese)Based on a general introduction to the content of the 6th open meeting of IHDP, and an overview of the major projects and science plans of ESSP and IHDP, this paper discussed the future science issues and development priorities for human-environment research in Geography. Besides regional heterogeneity and holistic view, which have already been highly emphasized in Geography, the human-environment system also has vulnerability, risk, resilience and adaptability, which are newly discovered inherent features. These four features can modify, change or transform each other in certain spatial and temporal context. Because of these features, Geography, which takes the mechanism and process of the human-environment system as its congenital task, must redesign its research strategy to contribute to the global human-environment research community. The necessary strategic transformations for geographic research include: from element and pattern oriented to process oriented integrated research; from integrated research which combines physical geography and human geography to systematic research on resources and environment issues; from environment reconstruction to integrated disaster risk management research; from dynamics of pattern and process to systematic simulation of resources guarantee and regional security; from regional human-environment interaction mechanism research to global human-environment interaction mechanism research. This is a big challenge for Geography, and also a precious opportunity we could not bear to lose. We should learn from the strategies in the science plans for global environmental change of IHDP and IGBP, strengthen the understanding of dynamic and non-dynamic behaviors of the human-environment system, then solve the complex globalization, urbanization, resources, environment, ecology, disaster, risk and sustainable development problems we are facing through systematic and integrated research, which is a big advantage of Geography, and gradually approach a resource conserving and environment friendly society. Only in this way, could geographers contribute to the construction of a well off and harmonious society in China, the decision making of global sustainable development, and the bi-health of human and Earth.

DOI

[24]
Shi Xueli, Zhang Fang, Zhou Wenyanet al., 2015. Impacts of CG-LTDR land cover dataset updates on the ground temperature simulation with BCC_AVIM 1.0.Journal of Geo-Information Science, 17(11): 1294-1303. (in Chinese)The land cover (LC) datasets of CG-LTDR was applied in the Beijing Climate Center Land Model (BCC_AVIM 1.0). The impacts of different LC type updates on the ground temperature (Tg) were investigated through several numerical simulations. The results show that the CG-LTDR can reasonably describe the LC features. Compared with the original LC rawdata, the glacier fraction of the new CG-LTDR datasets were extensively increased in the high-latitude regions of the Greenland Island and Europe, as well as the Tibetan Plateau; the fraction of wetland was decreased in the major water body areas of North America and Europe; and the percentage of lake was also majorly decreased in the North American inland water area, but slightly increased around the Tibetan Plateau. The PFT present the largest differences between the new and original datasets. Besides the control runs with the original LC dataset (CTL), five simulations were conducted to compare different impacts of LC types (the glacier, wetland, lake, PFT and all types) on Tg. The changes of Tg due to LC dataset updates majorly constrained in the areas where the LC types (fraction) were modified. With the individual updates of glacier (rGlacier), the simulated Tg was lowered in the high-latitude areas. The simulated Tg with new wetland (rWetland) was increased, while the simulated Tg with the new lake (rLake) datasets were effectively decreased in the Tibetan Plateau. These changes were helpful to improve the model performances on Tg simulations. The most significant and extensive changes among the 4 LC types occurred when updating the PFT (rPFT), which were helpful for reducing the errors in the south and east Asian areas, but enlarged the biases in the other regions. The LC dataset updates of all types (rALL) show the most significant impacts on the Tg simulations, which was not simply the linear sum of the individual updates of LC types, especially in the areas having complex types. Therefore, proper introductions of new CG-LTDR land cover datasets were useful to improve the model performance in Tg simulations.

[25]
Tao B, Tian H Q, Chen G Set al., 2013. Terrestrial carbon balance in tropical Asia: Contribution from cropland expansion and land management.Global and Planetary Change, 100(1): 85-98.Tropical Asia has experienced dramatic cropland expansion and agricultural intensification to meet the increasing food demand and is likely to undergo further rapid development in the near future. Much concern has been raised about how cropland expansion and associated management practices (nitrogen fertilizer use, irrigation, etc.) have affected the terrestrial carbon cycle in this region. In this study, we used a process-based ecosystem model, the Dynamic Land Ecosystem Model (DLEM), to assess the magnitude, spatial and temporal patterns of terrestrial carbon fluxes and pools in Tropical Asia as resulted from cropland expansion and land management practices during 1901–2005. The results indicated that cropland expansion had resulted in a release of 19.1202±023.0602Pg02C (0.1802±020.02902Pg02C/yr) into the atmosphere in Tropical Asia over the study period. Of this amount, approximately 22% (4.1802±020.6602Pg02C) was released from South Asia and 78% (14.9402±022.4002Pg02C) from Southeast Asia. Larger land area was converted to cropland while less carbon was emitted from South Asia than from Southeast Asia, where forest biomass and soil carbon were significantly higher. Changes in vegetation, soil organic matter, and litter pools caused emissions of 15.58, 2.25, and 1.7102Pg02C, respectively, from the entire region. Significant decreases in vegetation carbon occurred across most regions of Southeast Asia due to continuous cropland expansion and shrink of natural forests. When considering land management practices, however, less carbon was released into the atmosphere, especially in South Asia where land management practices contributed to an approximately 10% reduction in carbon emission. This implies that optimizing land management practices could greatly reduce the carbon emissions caused by cropland expansion and might be one of important climate mitigation options in Tropical Asia.

DOI

[26]
Tian H Q, Chen G S, Zhang Chiet al., 2012. Century-scale responses of ecosystem carbon storage and flux to multiple environmental changes in the southern United States.Ecosystems, 15(4): 674-694.Terrestrial ecosystems in the southern United States (SUS) have experienced a complex set of changes in climate, atmospheric CO 2 concentration, tropospheric ozone (O 3 ), nitrogen (N) deposition, and land-use and land-cover change (LULCC) during the past century. Although each of these factors has received attention for its alterations on ecosystem carbon (C) dynamics, their combined effects and relative contributions are still not well understood. By using the Dynamic Land Ecosystem Model (DLEM) in combination with spatially explicit, long - term historical data series on multiple environmental factors, we examined the century-scale responses of ecosystem C storage and flux to multiple environmental changes in the SUS. The results indicated that multiple environmental changes shifted SUS ecosystems from a C source of 1.2002±020.5602Pg (102Pg02=0210 15 02g) during the period 1895 to 1950, to a C sink of 2.0002±020.9402Pg during the period 1951 to 2007. Over the entire period spanning 1895–2007, SUS ecosystems were a net C sink of 0.8002±020.3802Pg. The C sink was primarily due to an increase in the vegetation C pool, whereas the soil C pool decreased during the study period. The spatiotemporal changes of C storage were caused by changes in multiple environmental factors. Among the five factors examined (climate, LULCC, N deposition, atmospheric CO 2 , and tropospheric O 3 ), elevated atmospheric CO 2 concentration was the largest contributor to C sequestration, followed by N deposition. LULCC, climate, and tropospheric O 3 concentration contributed to C losses during the study period. The SUS ecosystem C sink was largely the result of interactive effects among multiple environmental factors, particularly atmospheric N input and atmospheric CO 2.

DOI

[27]
Waisanen P J, Bliss N B, 2002. Changes in population and agricultural land in conterminous United States counties, 1790 to 1997. Global Biogeochemical Cycles, 16(4): 84-1-84-19.We have developed a data set of changes in population and agricultural land for the conterminous United States at the county level, resulting in more spatial detail than in previously available compilations. The purpose was to provide data on the timing of land conversion as an input to dynamic models of the carbon cycle, although a wide variety of applications exist for the physical, biological, and social sciences. The spatial data represent the appropriate county boundaries for each census year between 1790 and 1997, and the census attributes are attached to the appropriate spatial region. The resulting time series and maps show the history of population (1790-1990) and the history of agricultural development (1850-1997). The patterns of agricultural development reflect the influences of climate, soil productivity, increases in population size, variations in the general economy, and technological changes in the energy, transportation, and agricultural sectors.

DOI

[28]
Xie Gaodi, Cheng Shengkui, 1999. A study on global land use change under the pressure of population growth.Journal of Natural Resources, 14(3): 193-199. (in Chinese)Theoretically,the 4 factors of population,cultivated land,grassland and forest form the global man land interaction system centering around man.In this system changes of population undoubtedly cause the increase or decrease as well as mutual transformation of cultivated land,grassland and forest.A man land equilibrium model was built in the study.Based on the model,the authors have analyzed the global land use changes in 1970~1995 and in the future 50 years.Results indicated: (a)Du ring 1970~1995,population increased by 54 6%,but no sharp decrease in cultivated land and grassland have been found.Reasons for this relative stable equilibrium is that the improved agricultural technology,which is marked by irrigated area expansion and a large amount of chemical fertilizer application,leads to the rise of cultivated land productivity to 63 9%,and offsets the cultivated land increase,grassland and forest decrease under the pressure of population growth. (b)In the future 50 years,population will reach 100×108,an increase of 74%,and per capita available cultivated land,grassland and forest will decrease to below 0 13ha,0 34ha,and 0.37ha respectively.However,it is impossible to expand cultivated land by 74%,as the key to sustain current global stable land cover is to raise cultivated land productivity to over 74%,by relying on improved agricultural technology.(c)Amongst the former mechanisms to sustaining land use change relative stable,it will be difficult to improve land productivity through cultivated land expansion and a large amount of chemical ferti lizer application.Assuming both the current cultivated land area and productivity maintain the same level,the current cultivated land can still feed the projected global population in 2050 which is 55×108 more than the present level.Even if the natural disasters cause cultivated land productivity a drop of 0 99t/ha or cultivated land area 4 77×108ha, the cultivated land can still provide enough food to feed the global po pulation of 100×108.That means the man land system will not get collapsed in the next 50 years.The reduction of grassland and forest may be unavertible.

[29]
Ye Yu, Fang Xiuqi, Ren Yuyuet al., 2009. Coverage changes of cropland in northeast China during the past 300 years. Science in China Series D: Earth Sciences, 39(3): 340-350. (in Chinese)

[30]
Zhao Wenwu, 2012. Arable land change dynamics and their driving forces for the major countries of the world.Acta Ecologica Sinica, 32(20): 6452-6462. (in Chinese)Arable land is an essential resource for the production of food and thus constitutes one of the most fundamental resources for mankind.This resource is burdened by population growth and economic development.The statistic data from the Food and Agriculture Organization of the United Nations showed that the world′s arable land area was 1.401 billion hectares in 1990,and dropped to 1.381 billion hectares in 2008;with the continued population growth,the world′s per capita arable land was 0.265 ha in 1990,and dropped to 0.205 ha in 2008.By 2050,the world′s population will reach 9.1 billion.Assuming that the world′s arable land area in 2008 remains unchanged to 2050,the world′s per capita arable land would fall to 0.151 hectares.Having enough arable land to feed the world population in 2050 is a major challenge,and it is a meaningful task to explore the arable land dynamics for the major countries of the world. This paper selected 21 countries for a case study,and the arable land dynamics and their possible driving factors for these countries were discussed.These countries includes ten countries with the largest cultivated areas in the world,and the countries whose population will exceed 1 billion by 2050.The research results show that,from 1961 to 2007,increasingly more countries′ arable land areas were declining,and almost all of the countries are facing the shortage challenges of arable land.In fact,90.5% countries have suffered a downward trend of per capita arable land,which implies that the world food crisis is constantly increasing.Considering the change of total arable land area and per capita arable land area,the 21 countries can be divided into four groups:(1) Total arable land area and per capita arable land area increase at the same time;(2) Total arable land area and per capita arable land area decrease at the same time;(3) Total arable land area increases but per capita arable land area decreases;or(4) Total arable land area decreases but per capita arable land area increases. Among the different situations,population growth and economic development have been two of the key driving forces for the arable land changes.However,due to different land use potentials and different degrees of political stability,the influence factors of arable land are different among the referenced counties.For Brazil,agricultural acreage expansion and the ethanol production increase are important reasons for deforestation and arable land increases.For Bangladesh,Japan,Russia and the United States,urbanization and industrialization are the main reasons behind the reduction of arable land.However,for the Ukraine,the reduced total arable land and increased per capita arable land are closely connected to the sharp population drop and increased urban development.For the other 15 countries,rapid population growth and urbanization lead to reduced per capita arable land;at the same time,population growth has also become an important driving force for these countries to increase the total amount of cultivated land to ensure food security.However,because different countries have different reserve land resources,the arable land growth rate among these countries is significantly different.

DOI

Outlines

/