
Journal of Geographical Sciences >
Planform characteristics and development of interchannel wetlands in a gravel-bed anastomosing river, Maqu Reach of the Upper Yellow River
Author: Liu Boyi, Master Candidate, specialized in fluvial geomorphology. E-mail: liuby.14s@igsnrr.ac.cn
Received date: 2017-06-02
Accepted date: 2017-07-06
Online published: 2017-09-07
Supported by
National Natural Science Foundation of China, No.41571005, No.41271027
Copyright
Both interchannel wetlands and multi-channels are crucial geomorphologic units in an anastomosing river system. Planform characteristics and development of interchannel wetlands and multi-channels control the characteristics of anastomosing rivers. To understand the role that interchannel wetlands play in the development of anastomosing rivers, a study was conducted on the Maqu Reach of the Upper Yellow River (MRUYR), a gravel-bed anastomosing river characterized by highly developed interchannel wetlands and anabranches. Geomorphologic units in the studied reach were extracted from high resolution satellite imagery in Google Earth. The size distributions of interchannel wetlands and interchannel wetland clusters (IWCs), a special combination of interchannel wetlands and anabranches, were investigated. Geomorphologic parameters, including the ratio of interchannel wetland area to IWC area (P), shoreline density (Dl), and node density (Dn) were used to analyze planform characteristics of IWCs and the development of multi-channels in the studied reach. The results suggest that small or middle sized interchannel wetlands and large or mega sized IWCs are more common at the study site. The area of IWC (Su) is highly correlated with other geomorphologic parameters. P increases with increasing Su, and the upper limit is about 80%, which indicates that the development of interchannel wetlands and anabranches in the IWC is in the equilibrium stage. In contrast, Dl and Dn show a tendency to decrease with increasing Su due to diverse evolution processes in IWCs with different sizes. There are three main reasons leading to the formation of IWCs: varying stream power due to the meandering principal channel; development of the river corridor due to the weakening of geologic structure control; and high stability of interchannel wetlands due to conservation by shoreline vegetation.
LIU Boyi , WANG Suiji . Planform characteristics and development of interchannel wetlands in a gravel-bed anastomosing river, Maqu Reach of the Upper Yellow River[J]. Journal of Geographical Sciences, 2017 , 27(11) : 1376 -1388 . DOI: 10.1007/s11442-017-1441-1
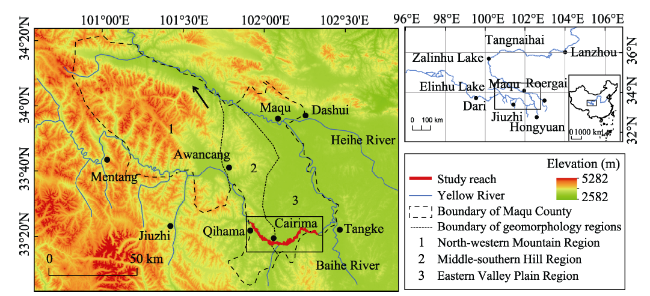
Figure 1 Overview of the location and topography of the study area; the left image is a digital elevation model that includes the tributaries of the Yellow River and the Maqu reach indicated in red |
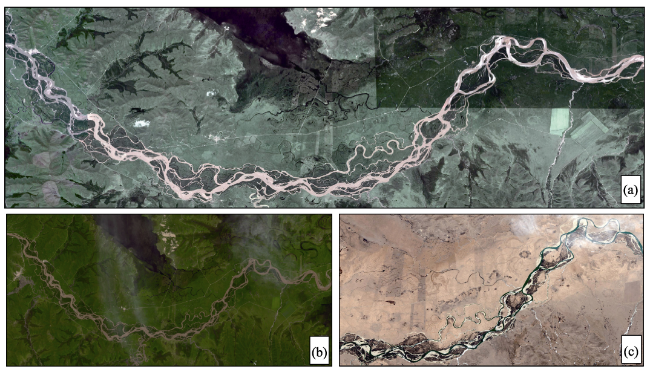
Figure 2 Satellite images of the study reach obtained from Google Earth. (a) Mosaic image of images 1, 2, and 3; (b) image 4, satellite image from Landsat 8; and (c) image 5, satellite image of part of the study reach during low flow |
Table 1 Satellite imagery information |
| Image | Satellite | Date | Covered reach (km) | Discharge (m³/s) |
|---|---|---|---|---|
| 1 | Worldview-02 | Aug. 27, 2011 | 0-13.34 | 627 |
| 2 | GeoEye-01 | Jul. 29, 2013 | 13.41-45.18 | 1640 |
| 3 | GeoEye-01 | Aug. 1, 2013 | 45.18-64.81 | 1920 |
| 4 | Landsat 8 | Jul. 23, 2013 | 0-64.81 | 1610 |
| 5 | Worldview-02 | Mar. 8, 2011 | 25.25-59.81 | 113 |
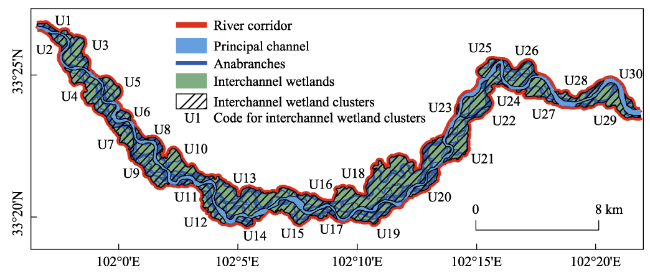
Table 2 Definition of the micro geomorphologic units in the anastomosing Maqu reach |
| Micro geomorphologic units | Definition |
|---|---|
| River corridor | Area of all geomorphologic units in the anastomosing river, including all channels and interchannel wetlands |
| Principal channel | The primary channel in an anastomosing river, which is usually the largest of all channels and has active water during low flow |
| Anabranches | All channels other than the principal channel |
| Interchannel wetlands | Vegetated land between channels |
| Interchannel wetland clusters | A combination of interchannel wetlands that develop on the same gravel bar and anabranches separating those interchannel wetlands |
Figure 3 Map of the Maqu reach showing the micro geomorphologic units and interchannel wetland clusters |
Table 3 Geomorphologic parameters of the interchannel wetland clusters on the Maqu reach |
| Code | Su (ha) | I | P (%) | Li (km) | Dl (km/km2) | N | Dn (node/km2) |
|---|---|---|---|---|---|---|---|
| U1 | 28.58 | 5 | 44.89 | 4.32 | 15.13 | 7 | 24.49 |
| U2 | 63.51 | 16 | 65.40 | 8.08 | 12.72 | 33 | 51.96 |
| U3 | 250.27 | 22 | 77.32 | 19.50 | 7.79 | 41 | 16.38 |
| U4 | 404.15 | 47 | 73.51 | 43.70 | 10.81 | 83 | 20.54 |
| U5 | 136.88 | 17 | 74.15 | 14.73 | 10.76 | 29 | 21.19 |
| U6 | 44.21 | 15 | 66.02 | 6.93 | 15.67 | 24 | 54.29 |
| U7 | 128.55 | 16 | 81.96 | 13.62 | 10.59 | 28 | 21.78 |
| U8 | 25.31 | 9 | 37.56 | 3.94 | 15.58 | 12 | 47.42 |
| U9 | 345.31 | 53 | 75.80 | 39.65 | 11.48 | 65 | 18.82 |
| U10 | 331.36 | 44 | 71.27 | 32.82 | 9.90 | 64 | 19.31 |
| U11 | 27.77 | 8 | 40.83 | 3.64 | 13.12 | 11 | 39.61 |
| U12 | 163.57 | 28 | 73.58 | 21.67 | 13.25 | 36 | 22.01 |
| U13 | 672.94 | 85 | 79.12 | 71.11 | 10.57 | 143 | 21.25 |
| U14 | 54.45 | 14 | 50.81 | 7.75 | 14.23 | 28 | 51.42 |
| U15 | 170.26 | 27 | 74.86 | 17.73 | 10.41 | 31 | 18.21 |
| U16 | 119.13 | 15 | 70.07 | 13.97 | 11.73 | 16 | 13.43 |
| U17 | 67.94 | 20 | 50.52 | 10.00 | 14.72 | 31 | 45.63 |
| U18 | 1336.17 | 131 | 79.24 | 110.94 | 8.30 | 202 | 15.12 |
| U19 | 177.93 | 48 | 63.95 | 24.47 | 13.75 | 56 | 31.47 |
| U20 | 95.34 | 41 | 57.09 | 17.20 | 18.04 | 63 | 66.08 |
| U21 | 321.44 | 54 | 78.85 | 35.77 | 11.13 | 67 | 20.84 |
| U22 | 239.77 | 12 | 73.98 | 14.48 | 6.04 | 15 | 6.26 |
| U23 | 6.46 | 2 | 33.25 | 0.82 | 12.66 | 3 | 46.47 |
| U24 | 96.14 | 13 | 78.33 | 11.31 | 11.76 | 21 | 21.84 |
| U25 | 70.64 | 4 | 71.70 | 5.92 | 8.37 | 7 | 9.91 |
| U26 | 243.44 | 18 | 71.57 | 22.62 | 9.29 | 32 | 13.15 |
| U27 | 183.42 | 26 | 83.21 | 18.86 | 10.28 | 45 | 24.53 |
| U28 | 114.00 | 14 | 55.55 | 11.24 | 9.86 | 22 | 19.30 |
| U29 | 260.51 | 29 | 73.11 | 20.06 | 7.70 | 40 | 15.35 |
| U30 | 25.73 | 4 | 52.71 | 3.54 | 13.77 | 7 | 27.21 |
Table 4 Total number and total area of interchannel wetlands in different size ranges |
| Area (ha) | Type | Interchannel wetlands number | Interchannel wetlands number frequency (%) | Total area (ha) | Total area frequency (%) |
|---|---|---|---|---|---|
| <0.1 | Micro | 231 | 27.24 | 8.70 | 0.19 |
| 0.1-1 | Small | 284 | 33.49 | 108.92 | 2.36 |
| 1-10 | Middle | 232 | 27.36 | 808.19 | 17.54 |
| 10-100 | Large | 97 | 11.44 | 2988.96 | 64.87 |
| ≥100 | Mega | 4 | 0.47 | 692.67 | 15.03 |
Table 5 Total area and total number of interchannel wetlands of interchannel wetland clusters with different sizes |
| Area (ha) | Type | Number | Total area (ha) | Total area frequency (%) | Interchannel wetlands number | Number | Total number frequency (%) |
|---|---|---|---|---|---|---|---|
| <10 | Small | 1 | 6.46 | 0.10 | < 10 | 6 | 5.14 |
| 10-50 | 5 | 151.59 | 2.44 | 10-20 | 10 | 20.31 | |
| 50-100 | 6 | 448.02 | 7.22 | 21-50 | 10 | 36.80 | |
| 100-200 | Middle | 8 | 1193.74 | 19.24 | 51-100 | 3 | 22.10 |
| 200-500 | Large | 8 | 2396.24 | 38.62 | > 100 | 1 | 15.65 |
| >500 | Mega | 2 | 2009.11 | 32.38 |
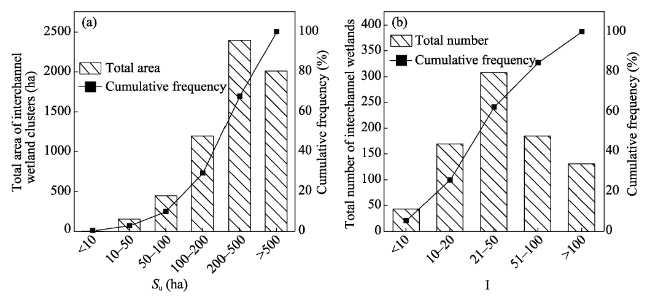
Figure 4 Statistical analysis of interchannel wetlands in interchannel wetland clusters with different areas (a. Total area and cumulative frequency; b. total number of interchannel wetlands and cumulative frequency) |
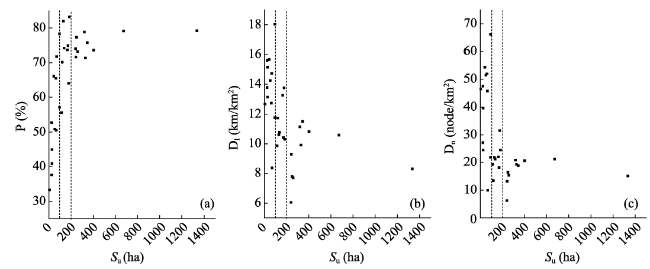
Figure 5 Relationship between area and other geomorphologic parameters of interchannel wetland clusters, (a) area and ratio of interchannel wetland area to interchannel wetland cluster area, (b) area and shoreline density, and (c) area and node density |
Table 6 Interchannel wetland cluster parameters categorized by area |
| Area (ha) | P (%) | Dl (km/km2) | Dn (node/km2) | ||||||
|---|---|---|---|---|---|---|---|---|---|
| Avg. | Min | Max | Avg. | Min | Max | Avg. | Min | Max | |
| <10 | 33.25 | 12.66 | 46.47 | ||||||
| 10-50 | 48.40 | 37.56 | 66.02 | 14.65 | 13.12 | 15.67 | 38.60 | 24.49 | 54.29 |
| 50-100 | 62.31 | 50.52 | 78.33 | 13.31 | 8.37 | 18.04 | 41.14 | 9.91 | 66.08 |
| 100-200 | 72.17 | 55.55 | 83.21 | 11.33 | 9.86 | 13.75 | 21.49 | 13.43 | 31.47 |
| 200-500 | 74.46 | 71.27 | 78.85 | 9.27 | 6.04 | 11.48 | 16.33 | 6.26 | 20.84 |
| >500 | 79.18 | 79.12 | 79.24 | 9.43 | 8.30 | 10.57 | 18.18 | 15.12 | 21.25 |
The authors have declared that no competing interests exist.
| [1] |
|
| [2] |
|
| [3] |
|
| [4] |
|
| [5] |
|
| [6] |
|
| [7] |
|
| [8] |
|
| [9] |
|
| [10] |
|
| [11] |
|
| [12] |
|
| [13] |
|
| [14] |
|
| [15] |
|
| [16] |
|
| [17] |
|
| [18] |
|
| [19] |
|
| [20] |
|
| [21] |
|
| [22] |
|
| [23] |
|
| [24] |
|
| [25] |
|
| [26] |
|
| [27] |
|
| [28] |
|
| [29] |
|
| [30] |
|
| [31] |
|
| [32] |
|
| [33] |
|
| [34] |
|
| [35] |
|
| [36] |
|
| [37] |
|
| [38] |
|
| [39] |
|
| [40] |
|
| [41] |
|
| [42] |
|
| [43] |
|
| [44] |
|
| [45] |
|
| [46] |
|
/
| 〈 |
|
〉 |