
Journal of Geographical Sciences >
Interacting effects of multiple factors on the morphological evolution of the meandering reaches downstream the Three Gorges Dam
Author: Han Jianqiao, PhD, specialized in river geomorphology and numerical simulation of fluvial processes. E-mail: hjq13@163.com
*Corresponding author: Zhang Wei, PhD, E-mail: wzhang97082@whu.edu.cn
Received date: 2017-03-22
Accepted date: 2017-05-02
Online published: 2017-09-06
Supported by
National Natural Science Foundation of China, No.51479146
Doctoral Foundation of Northwest A&F University No.2452015337
National Key Research and Development Plan, No.2016YFC0402303, No.2016YFC0402101
Copyright
Elucidating the influence of dams on fluvial processes can inform river protection and basin management. However, relatively few studies have focused on how multiple factors interact to affect the morphological evolution of meandering reaches. Using hydrological and topographical data, we analyzed the factors that influence and regulate the meandering reaches downstream the Three Gorges Dam (TGD). Our conclusions are as follows. (1) The meandering reaches can be classified into two types based on their evolution during the pre-dam period: G1 reaches, characterized by convex point bar erosion and concave channel deposition (CECD), and G2 reaches, characterized by convex point bar deposition and concave channel erosion (CDCE). Both reach types exhibited CECD features during the post-dam period. (2) Flow processes and sediment transport are the factors that caused serious erosion of the low beaches located in the convex point bars. However, changes in the river regime, river boundaries and jacking of Dongting Lake do not act as primary controls on the morphological evolution of the meandering reaches. (3) Flood discharges ranging from 20,000 to 25,000 m³/s result in greater erosion of convex point bars. The point bars become scoured if the durations of these flows, which are close to bankfull discharge, exceed 20 days. In addition, the reduction in bedload causes the decreasing of point bar siltation in the water-falling period. (4) During the post-dam period, flood abatement, the increased duration of discharges ranging from 20,000 to 25,000 m³/s, and a significant reduction in sediment transport are the main factors that caused meandering reaches to show CECD features. Our results are relevant to other meandering reaches, where they can inform estimates of riverbed change, river management strategies and river protection.
HAN Jianqiao , ZHANG Wei , FAN Yongyang , YU Mengqing . Interacting effects of multiple factors on the morphological evolution of the meandering reaches downstream the Three Gorges Dam[J]. Journal of Geographical Sciences, 2017 , 27(10) : 1268 -1278 . DOI: 10.1007/s11442-017-1434-0
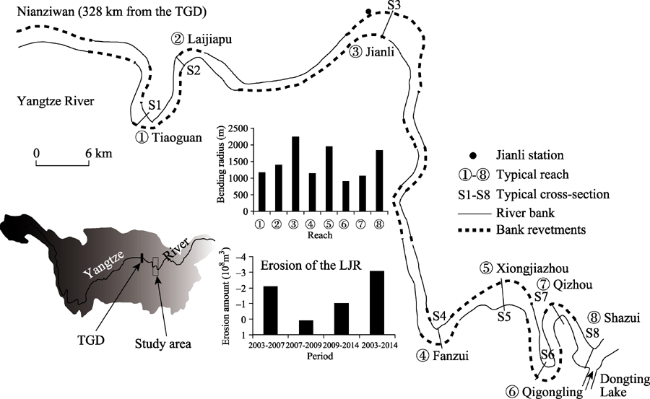
Figure 1 Study area, showing the meandering reaches downstream the Three Gorges Dam |
Table 1 Sources of measurements |
| Data type | Station | Measured time | Sources |
|---|---|---|---|
| Hydrologic data | Shashi Jianli | 2003-2013 1996-2015 | CWRC |
| Sectional velocity | Six typical sections | August 2014, January 2015 | CWPDRI |
| Sectional profiles | Laijiapu reach | 2003-2016 | CWPDRI |
| Eight typical sections | 1996, 2003, October 2016 | CWRC |
Figure 2 Morphological patterns of the G1 and G2 reaches |
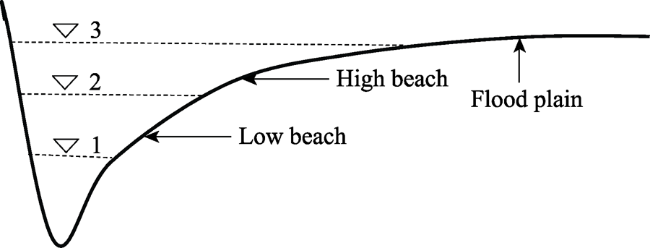
Figure 3 Schematic diagram of the channel divisions. The water stages representing low-flow channel, basic channel, and bankfull channel are indicated by 1, 2, and 3, respectively. |
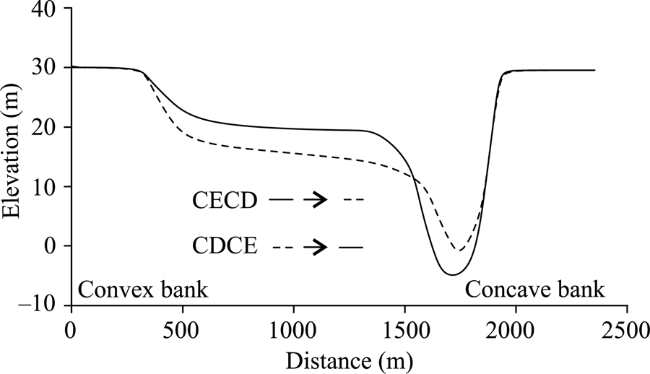
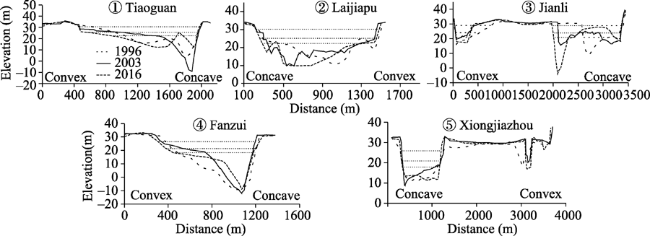
Figure 4 Typical cross-sectional profiles of G1 reaches during the pre- and post-dam periods |
Figure 5 Typical cross-sectional profiles of the G2 reaches during the pre- and post-dam periods |
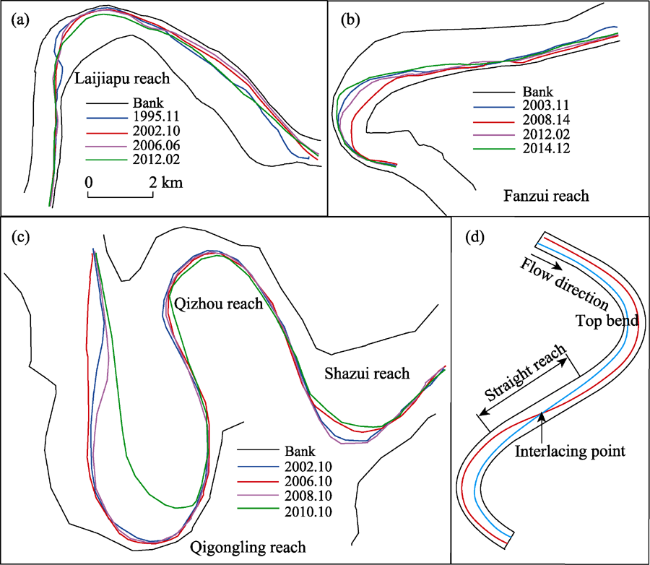
Figure 6 Changes in thalweg position in the meandering bends of the Lower Jingjiang River |
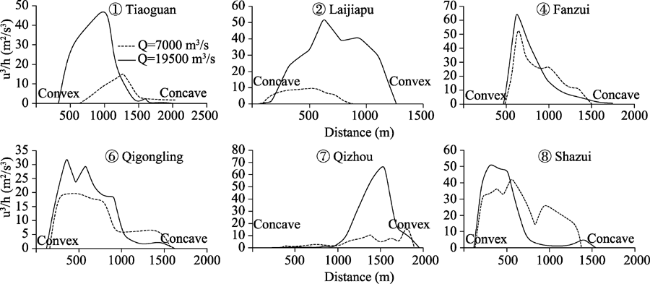
Figure 7 Changes in u3/h along the cross sections during different discharges in the Lower Jingjiang River |
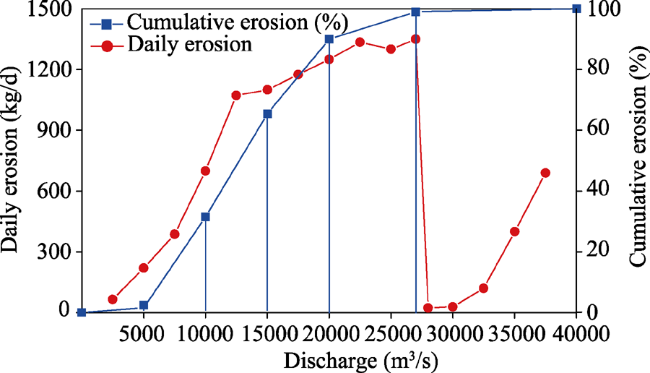
Figure 8 Erosion intensity caused by different discharges in the sandy bed of the Jingjiang River (Han et al., 2014) |
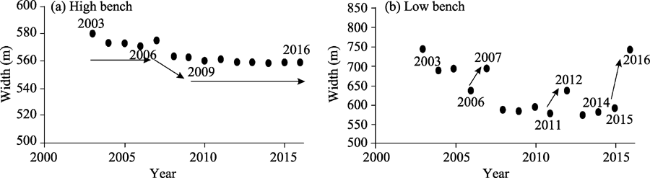
Figure 9 Changes in width of the high beach and low beach in the Laijiapu reach |
Table 2 Durations of different discharge ranges at the Jianli station after impoundment of the TGR (days) |
| Discharge (m³/s) | Average | 2003 | 2004 | 2005 | 2006 | 2007 | 2008 |
|---|---|---|---|---|---|---|---|
| Bankfull discharge (20,000-25,000) | 32 | 43 | 36 | 40 | 5 | 27 | 33 |
| Flood discharge (>35,000) | 1 | 0 | 5 | 1 | 0 | 6 | 0 |
| Discharge (m³/s) | 2009 | 2010 | 2011 | 2012 | 2013 | 2014 | 2015 |
| Bankfull discharge (20,000-25,000) | 41 | 46 | 17 | 29 | 38 | 67 | 15 |
| Flood discharge (>35,000) | 0 | 0 | 0 | 3 | 0 | 2 | 0 |
The authors have declared that no competing interests exist.
| [1] |
|
| [2] |
|
| [3] |
|
| [4] |
|
| [5] |
|
| [6] |
|
| [7] |
|
| [8] |
|
| [9] |
|
| [10] |
|
| [11] |
|
| [12] |
|
| [13] |
|
| [14] |
|
| [15] |
|
| [16] |
|
| [17] |
|
| [18] |
|
| [19] |
|
| [20] |
|
| [21] |
|
| [22] |
|
| [23] |
|
| [24] |
|
| [25] |
|
| [26] |
|
/
| 〈 |
|
〉 |
