Orginal Article

Emergy-based environmental accounting toward a sustainable Mongolia

  • LI Haitao , 1 ,
  • BROWN Mark 1, 2
Expand
  • 1. Key Laboratory of Land Surface Pattern and Simulation, Institute of Geographic Sciences and Natural Resources Research, CAS, Beijing 100101, China
  • 2. Center for Environmental Policy, Engineering School of Sustainable Infrastructure and Environment, University of Florida, Gainesville, Fl 32611, USA

Author: Li Haitao, PhD, E-mail:

Received date: 2017-02-24

  Accepted date: 2017-04-07

  Online published: 2017-09-06

Supported by

Chinese Academy of Sciences President’s International Fellowship Initiative, No.2016VBA043(BM)

China Scholarship Council and Michigan State University, No.NN-X-09-AM-55G(LH)

Copyright

Journal of Geographical Sciences, All Rights Reserved

Abstract

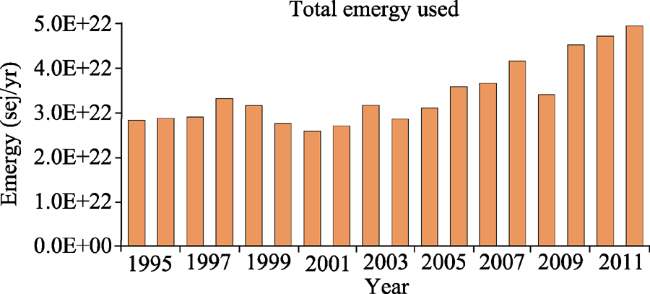
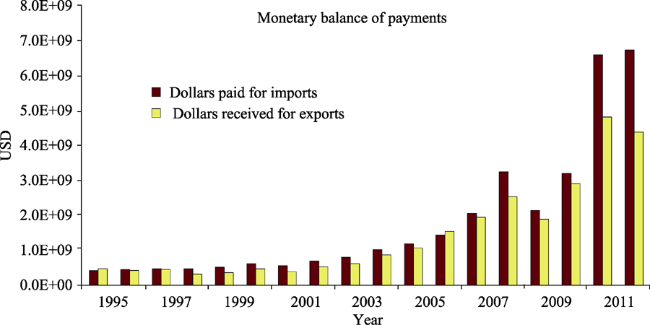
An emergy-based environmental accounting of Mongolia is presented based on the data from 1995 to 2012. By calculating natural and economic inputs and a series of emergy indicators, this paper discusses Mongolia’s resource use structure, economic situation, trade status and societal sustainability. The results show that the total emergy use for Mongolia changed from 2.83×10²² sej in 1995 to 4.96×10²² sej in 2012, representing a 75% increase over the 18 years of this study, yet its emergy per capita remains one of the lowest in the world (1.74×10¹⁶ sej/capita). The emergy money ratio (EMR) of Mongolia during 1995-2012 decreased from 1.99×10¹³ sej/USD to 7.75×10¹² sej/USD, which indicates that the power of a dollar for purchasing real wealth in Mongolia was declining, while the relatively high absolute values compared to its trading partners and even the world average EMR suggests that Mongolia is continuing a trade disadvantage. Mongolia’s emergy exchange ratio is increasingly less than one to the point that in 2012 the ratio was 0.3 suggesting that the exported emergy was over 3.3 times greater than the imported emergy. The growing dependence on imports and the dramatic increase in exports suggests that Mongolia’s economy is increasingly vulnerable to downturns in the world economy.

Cite this article

LI Haitao , BROWN Mark . Emergy-based environmental accounting toward a sustainable Mongolia[J]. Journal of Geographical Sciences, 2017 , 27(10) : 1227 -1248 . DOI: 10.1007/s11442-017-1432-2

1 Introduction

The country of Mongolia, lies in Central Asia, and without the benefit of a coastal location, it has a strong continental climate, the result of being dominated by a region of high atmospheric pressure throughout much of the year (Worden and Savada, 1989). The spatial distribution of its climate transitions gradually from a semi-humid region in the north and east to semi-arid, arid, and extremely arid regions in the south and west. The climate of Mongolia is extremely variable and more than any other factor, has resulted in an environment dominated by ecologically marginal areas, which are unsuited to agriculture. This, in turn, has generated a culture of nomadic pastoralism in response to the variability of the climate and marginal ecosystems that permanent cropping or livestock grazing would soon deplete. Today nearly one half of Mongolia’s population still depends on livestock production, which contributes a little more than 20% of the country’s GDP (Vernooy, 2011).
Due to the fragile nature of its environment, Mongolia’s ecosystems are increasingly vulnerable to changes in climate and to human activity. The most important environmental issues include increasing rangeland degradation, land desertification, soil acidification and erosion, reduction in available water resources, and rapid decreases in forest resources (CIA, 2016). Farming and animal husbandry, particularly sheep and goat herding, are the traditional means of subsistence. However, emphasis on industrial and economic growth during the last two decades has greatly affected this region, and brought an increasing pressure on natural ecosystems. The ability to maintain a balance between economic growth and ecosystem stability, and thus foster long-term societal sustainability, has become a serious challenge for the people of Mongolia.
In recent years, Mongolia has increased development of its mineral resources expecting to gain significant economic and social benefits from expansion of the mining sector. With significant deposits of metals (copper, gold, silver, copper, molybdenum, tungsten, tin, nickel, zinc, and fluorspar) and energy (uranium, oil, and coal), Mongolia has increased its export income six fold in the past decade from $1.1 billion in 2004 to $6.1 billion in 2014. The top exports (monetary value) in 2014 as percentage of total value of exports, were copper ore (42%), coal briquettes (14%), crude petroleum (11%) and iron ore (7%), (OEC, 2016).
Mongolia is a state in transition, from a country dominated by nomadic pastoralism to an economy largely relying on the export of raw materials to international markets. The country's main exports are mined minerals, metals and fossil fuels (primarily coal) and secondarily, livestock products (especially cashmere). Mongolia depends heavily on imports of machinery, fuels, industrial and consumer goods, and food products. Current estimates suggest that the total monetary value of Mongolia’s mineral wealth is on the order of $1.3 to $2.75 trillion (ECSP, 2017). Investment in Mongolia’s mining sector has topped $14 billion in the period 2008-2013 (Mungunzul and Chang, 2016), an amount equal to over 50% of Mongolia’s GDP for those years.
With such unprecedented mineral wealth, the achievement of long-term national well-being would seem to be possible. Yet learning from other developing economies, mineral wealth alone does not guarantee a sustainable future. While the monetary flows are impressive and the future looks bright for continued investment and even larger export earnings, understanding the real wealth of Mongolia and the difference between value in exchange (monetary value) and value in use (emergy value) may provide policy makers with a better way of directing resources in beneficial ways.
The objectives of this paper are three fold, to evaluate: (1) the temporal changes of Mongolia’s resources use, imports and exports from 1995 to 2012; (2) economic efficiency and trade status of Mongolia; (3) the sustainability of Mongolia system, and make suggestions for its sustainable future on the basis of the emergy synthesis of the Mongolia’s environmental and economic systems. In order to achieve these objectives, the main flows of energy, materials and money passing through the boundaries of the region are quantified and standardized; the emergy flow of renewable resources, non-renewable resources, imports and exports are calculated; a series of emergy indices of Mongolia, such as emergy dollar ratio (EDR), emergy-based resources productivity (ERP), emergy exchange ratio (EER), environmental load ratio (ELR) and emergy yield ratio (EYR), are evaluated.

2 Materials and methods

2.1 Study area

Mongolia (87˚44'-119˚56'E, 41˚35'-52˚09'N, Figure 1) is a landlocked country situated in an arid and semi-arid zone in Northeast Asia. It is bordered by Russia to the north and the People's Republic of China to the south, east and west. In total, Mongolia covers an area of 1.564 million km2 (CIA, 2016).
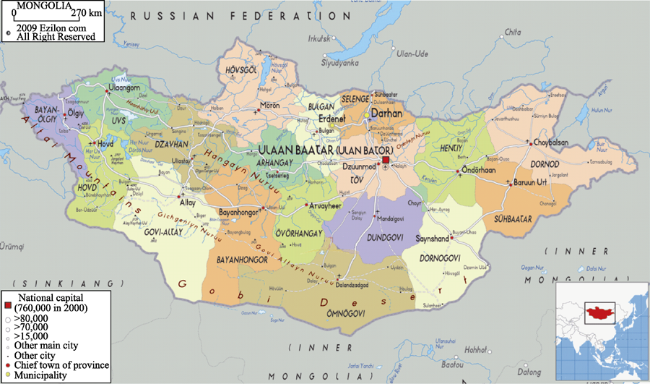
Figure 1 Map of Mongolia
The geography of Mongolia is varied with the Gobi Desert to the south and with cold and mountainous regions to the north and west, about 1130.523 thousand km2 or 73.9% of the territory is marginal agricultural land (of which 97.8% is meadows and pastures in 2012), 9.2% is forest land, 0.4% is surface water resources and about 0.3% is in urban areas (MSY, 1995-2012). Located in Central Asia, Mongolia is an upland country with 85% of its land above 1000 m asl. Much of Mongolia’s grassland is located between 1000 m and 2500 m asl (MSY, 1995-2012). Annual precipitation of Mongolia from the year of 2000 to 2004 was 165.9 mm (Batjargal, 1997). The average summer temperature in Ulaanbaatar, the capital of Mongolia, is between +11˚C and +25˚C, while average winter temperature is between -30˚C and -15˚C (WWO, 2016).
With a population of 2.85 million persons (2012), and a population density of 1.82 people per square kilometer, Mongolia is one of the most sparsely populated countries in the world. In earlier times the majority of the population practiced pastoralism, while in 2012, about 62.6% of the total population or 1.78 million persons lived in urban areas (MSY, 1995-2012).
Currently, Mongolia’s economy is centered on agriculture and mining (coal, copper, molybdenum, fluorspar, tin, tungsten, and gold). The gross domestic product of Mongolia was US$ 6.4 billion in 2012, 21.1% of which was produced by the agriculture sector (MSY, 2009). In 2012, livestock comprised three-quarters of economic value-added agriculture (meat, hide, wool, cashmere, dairy products), while crops made up the rest (wheat and vegetables for domestic consumption). Industry accounted for around 59.8% of GDP, which included mining and quarrying (the share of mining and quarrying industries in the total industrial sales reached 65.9%), processed wool, cashmere, leather, and food (mostly meat and dairy products), and construction materials (MSY, 1995-2012). In recent years, Mongolia is increasingly dependent on mined minerals and metals as well as fossil fuels for the bulk of its export earnings (MSY, 1995-2012).

2.2 Data sources

Data sources for this research are from published yearbooks and internet data compilations, such as Mongolian Statistical Yearbook (MSY, 1995-2012), the CIA Fact Book (CIA, 2016), Food and Agricultural Organization (FAO Stat, 2016), United States Energy Information Agency (EIA, 2016), United Nations Environmental Program (UNEP, 2016) and several others. The majority of the data on Mongolian local resources production and consumption, imports and exports was sourced from Mongolian Statistical Yearbook (MSY, 1995-2012).

2.3 Emergy analysis

An emergy analysis of Mongolia was conducted to characterize the flows of energy, resources and services driving the system. In emergy analysis flows of energy, material, or service in a system are transformed into common units of solar emergy (the units of which are solar emjoules, abbreviated sej) by multiplying units of energy or mass by a unit emergy value (UEV). UEVs are defined as the available energy of one form (usually solar) that is required to produce a unit of another form (Odum, 1996). If the units produced are in joules of available energy, then the UEV is called transformity. If the units produced are expressed in mass, the UEV is called specific emergy. The units of each are as follows: transformity = sej/J and specific emergy = sej/g. A third type of UEV is emergy per unit of currency, such as dollars, in which case the units are sej/$.
2.3.1 Emergy baseline
Crucial to the method of emergy accounting are the main driving emergy flows of the geobiosphere to which all other flows are referenced. They form what is referred to as the geobiosphere emergy baseline (GEB) for the construction of tables of Unit Emergy Values (UEVs) to be used in emergy evaluations. The three main sources of available energy that form the GEB (Odum, 1996) are solar radiation received by Earth, tidal momentum created by the earth-sun-moon system, and geothermal energy from deep within the earth.
Over the past several decades different baselines have been proposed and used by emergy researchers, the result of incremental increases is useful in understanding of geobiosphere processes and gaining more refined data. Most recently a baseline of 12.0 E24 sej y-1 (Brown et al., 2016) has been proposed by several researchers working in tandem, but using different approaches. The emergy baseline used in this analysis was 12.0 E24 sej y-1 (Brown et al., 2016). UEVs obtained from other sources (see below) were computed using other previous baselines. Conversion of UEVs produced with different baselines was done using the ratio of the old baseline to the new baseline as follows:
Baseline of 9.44 E24 sej y-1 was multiplied by 12.0/9.44,
Baseline of 15.83 E24 sej y-1 was multiplied by 12.0/15.83
Baseline of 15.2 E24 sej y-1 was multiplied by 12.0/15.2
2.3.2 Unit emergy values (UEVs)
In practice UEVs are computed from real processes that have been in operation for sufficient time that they are likely to be operating at close to optimal performance. Ideally UEVs are computed for each analysis, however time and resource constraints make this ideal difficult to obtain. Instead, most emergy analyses (especially those as complex as an analysis of a country with many input flows), rely on UEVs computed by others. Odum (1996), along with others (Brown and Ulgiati, 1999; Tilley, 1999; Odum et al., 2000; Bastianoni et al., 2005), have computed UEVs for a variety of products and services. Two databases, the National Environmental Accounting Database (NEAD, 2016) and the Emergy Data Base (Tilley et al., 2016) provide comprehensive lists of UEVs previously computed by others. UEVS used in this study were obtained from these and other sources.
In addition to the above sources, we have used UEV’s for mineral resources from a new, unpublished study (De Vilbiss and Brown, 2016) that was preformed for the USEPA. This study developed UEVs for 102 minerals that are used in industry, construction, and agriculture. The method used to compute the mineral UEVs and the resulting values depart significantly from those previously published. Additionally, the UEV for rainfall and all subsequent global flows of water (i.e., river discharges), taken from this same publication, differ in method of computation and the ultimate values from UEVs used in the past. As a result of these differences in computations and final UEV values for minerals, rainfall, and river discharges, the results of this national analysis are not easily compared to national analysis that have been performed in the past.
The reliability of UEVs obtained from other sources was evaluated by contrasting values from several sources where possible. If different sources differed significantly we choose to take an average, or settled on a UEV that represented the majority of values from the literature. Of course, uncertainties are always present and are transferred from these previous studies to the present study. Finally, as is well known, only the largest of the flows can significantly affect the outcome, so through our investigation, we focused our attention on those flows that represented the largest contributions to total emergy.
2.3.3 Environmental accounting
The biophysical basis for the Mongolia’s economy was derived by accounting for all the flows of energy and materials that are consumed (both imported and obtained within Mongolia) and exported. Accounting tables were constructed for each year of the analysis (1995-2012) and data in energy and mass units were obtained from published sources. All data were converted to emergy using appropriate UEVs from the literature.
The renewable sources of energy to Mongolia were identified as solar radiation, the deep heat of the earth, precipitation, and wind. Since there is potential to double count emergy when accounting for renewable energy, special accounting procedures were adopted (developed by Brown and Ulgiati, 2016b). To avoid double-counting of renewable emergy sources the sum of solar radiation and deep heat was compared to the largest of the other renewable inputs (precipitation) and the larger of those two values was taken as the renewable input (Figure 2).
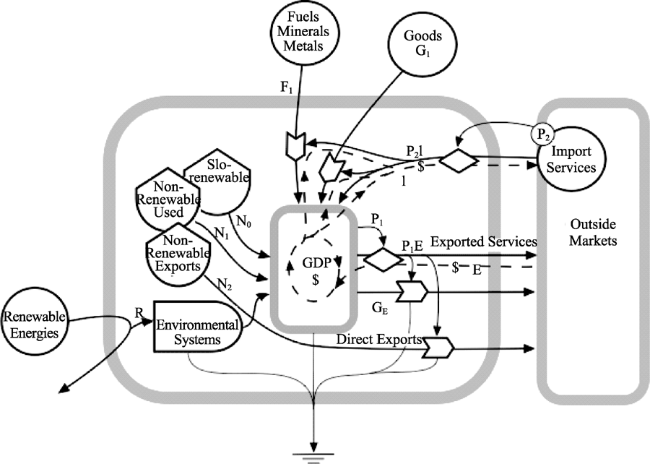
Figure 2 Aggregated national diagram from which emergy indices and ratios are computed
2.3.4 Emergy intensity indices
Intensity in the sciences refers to the quantity of something expressed in relation to some other quantity. For instance, in physics, intensity is power transferred per unit area. In economics, energy intensity is calculated as units of energy input per unit of GDP. In this study we compute three different emergy intensities: 1) empower per capita (total annual emergy use divided by population, 2) aerial empower intensity (total annual emergy use per unit area), and 3) emergy money ratio (EMR: total annual emergy use per dollar of annual GDP)
2.3.5 Emergy performance indices
Several performance indicators were computed to compare year to year performance of the Mongolia’s economy and to compare Mongolia with other countries. Referring to Figure 2, the most important of these indices are as follows:
Environmental Loading Ratio - (N0+N1+FI+GI+P2I) / R. The ELR is the ratio of the nonrenewable emergy used by the economy to the renewable emergy. Lower ELRs are better.
Export to Import Ratio - (N2+GE+P1E) / (FI+GI+P2I). The export to import ratio is the ratio of the emergy of exports to the emergy of imports. Values greater than 1.0 indicate economies that export more emergy than they import.
Emergy Exchange Ratio - (FI+GI+P2I) / (GE+N2+(I*EMR)). The emergy exchange ratio (EER), a measure of trade efficiency, is the ratio of emergy received by the buyer, to the emergy given, in a trade or sales transaction. Ratios greater than 1 indicate positive trade advantage, while ratios less than one indicate negative trade advantage.

3 Results and discussion

3.1 Systems diagram

Given in Figure 3 is a systems diagram of modern Mongolia showing the main driving energies, imports, exports and internal processes. The diagram is used as a means of inventorying the main characteristics of the biophysical economy and also showing the main flows of money received for exports and spent for imports. The internal circulation of money is not included in the diagram, but each flow of energy or resource within the economy would have an accompanying flow of money in the opposite direction.
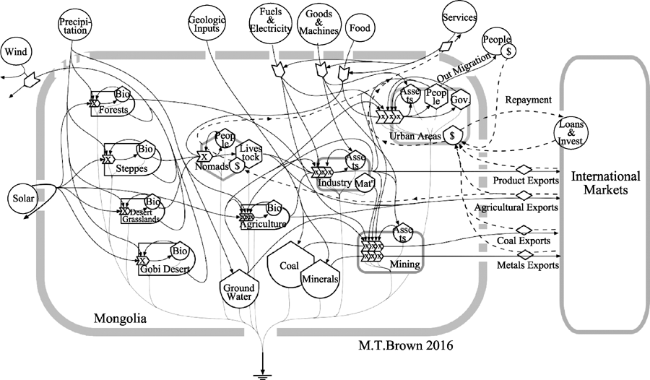
Figure 3 Systems diagram of Mongolia showing the driving energies, exchanges of resources and money and the main sectors of the economy
The main renewable energy inputs are solar energy, winds, and precipitation. Also included as a renewable source is the geologic input, here evaluated as geothermal exergy. Non-renewable inputs purchased from outside include fuels and electricity, goods and machines, food, and services. To the left in the diagram are the ecological systems including forests, steppes, desert grasslands, and the Gobi Desert. The most important sectors of Mongolia’s economy are the pastoralists (nomads) and their cattle in the center of the diagram, mining in the lower right, and industry, center left, not necessarily in the order of importance. Nowadays urban areas have become increasingly important as the economy has shifted away for pastoralism toward industrialization.
Mongolia’s main exports, shown flowing from the left to international markets, include products from industrial output, agricultural commodities from the nomads and agriculture, and coal, metals and minerals from the mining sector. These exports are shown with a counter flow of money as income from their sale.

3.2 Emergy analysis

Table 1 is an emergy accounting of Mongolia for the year 2008 as an example of the tables constructed for each year of the study period. The table explains the main categories of energy and material flows that were aggregated to make the summary statistics for each of the 18 years of this study. Notes to Table 1 that provide a summary of calculation procedures and sources for all data are given in Appendix A.
Table 1 Emergy evaluation of Mongolia (2008)
Note Item Raw units UEV (sej/unit) Solar emergy (E20 sej)
Primary renewable sources
1 Solar radiation 6.10E+21 J 1 61.0
2 Earth Cycle, heat flow 1.87E+17 J 4900 9.2
Sum of primary sources 70.2
Secondary and tertiary renewable sources
3 Wind, kinetic energy 9.93E+18 J 800 79.4
4 Precipitation (Chem. Pot.) 1.13E+18 J 7000 79.3
5 Runoff geopotential 1.88E+17 J 12800 24.0
6 River, geopotential 0.00E+00 J 12800 0.0
7 River, chemical potential 0.00E+00 J 21300 0.0
Sum of items 4 and 5 103.3
Total renewable (largest of primary or 2nd and 3rd sources) 103.3
Indigenous renewable production:
8 Hydroelectricity 0.00E+00 J 2.54E+05 0.0
9 Agriculture production 1.05E+16 J 2.54E+05 26.8
10 Livestock production 6.24E+14 J 2.54E+06 15.8
11 Fisheries production 7.74E+11 J 2.54E+06 0.0
Nonrenewable sources from within system:
12 Fuelwood production 5.24E+15 J 1.87E+04 1.0
13 Forest extraction 1.53E+16 J 1.87E+04 2.9
14 Natural gas 0.00E+00 J 1.40E+05 0.0
15 Oil 1.10E+16 J 1.40E+05 15.3
16 Coal 1.72E+17 J 5.21E+04 89.5
17 Minerals 6.10E+10 g 5.26E+08 0.3
18 Metals 1.84E+12 g 7.60E+07 1.4
19 Topsoil losses 9.62E+16 J 2.01E+04 19.3
20 Water (gd. water extraction) 5.58E+15 J 4.80E+04 2.7
Imports:
21 Fuels 4.10E+16 J 1.32E+05 54.1
22 Metals 7.43E+10 g 6.73E+07 0.1
23 Minerals 1.70E+13 g 4.75E+07 8.1
24 Electricity 8.68E+14 J 2.54E+05 2.2
25 Food & agriculture products 5.77E+15 J 4.28E+05 24.7
26 Livestock, meat, fish 8.93E+13 J 2.54E+06 2.3
27 Plastics & rubber 4.92E+14 J 1.32E+05 0.6
Note Item Raw units UEV(sej/unit) Solar emergy (E20 sej)
28 Chemicals 7.53E+10 g 1.12E+10 8.5
29 Finished products 9.14E+11 g 3.66E+09 33.5
30 Mach.& trans equip. 7.52E+10 g 1.90E+10 14.3
31 Service in imports 3.24E+09 $ 1.27E+12 41.1
Exports:
32 Food & agriculture products 2.47E+14 J 2.54E+05 0.6
33 Livestock, meat, fish 3.66E+14 J 2.54E+06 9.3
34 Finished products 1.19E+11 g 3.79E+09 4.5
35 Fuels 1.27E+17 J 5.60E+04 71.3
36 Metals 7.82E+11 g 2.73E+08 2.1
37 Minerals 4.78E+10 g 1.00E+09 0.5
38 Chemicals 4.12E+09 g 1.12E+10 0.5
39 Electricity 3.64E+13 J 2.54E+05 0.1
40 Mach. & trans equip. 1.47E+09 g 1.44E+10 0.2
41 Plastics & rubber 2.40E+11 J 1.32E+05 0.0
42 Service in exports 2.53E+09 $ 8.52E+12 215.8

Footnotes to Table 1 are given in Appendix A

Table 2 summarizes the data in Table 1 by providing summaries of inputs and outputs according to larger classifications of renewable, nonrenewable, goods, services etc. The letters in the first column are keyed to the diagram in Figure 2.
Table 2 Summary of emergy and monetary flows for Mongolia (2008)
Variable Item Solar emergy a. (E20 sej/y) Dollars
R Renewable sources (rain, tide, earth cycle) 103.3
N Nonrenewable resources from within country 132.3
N0 Dispersed rural source 22.0
N1 Concentrated use 110.4
N2 Exported without use 73.9
FI Imported fuels, minerals & electricity 64.4
GI Imported goods 83.8
I Money paid for imports ($US) 3.24E+09
P2I Emergy of services in imported goods & fuels 41.1
E Money received for exports ($US) 2.53E+09
P1E Services in exports 215.8
GE Exported emergy in goods 15.1
FE Exported fuels, minerals & electricity 74.0
P2 World emergy/$ ratio, used in imports 1.27E+12
P1 Country emergy/$US ratio 8.52E+12

a. Data are summarized from Table 1

The aggregated system diagram of Mongolia in 2008 provides an overview of the emergy and money flows across system boundaries and the Gross Domestic Product (GDP), in the central circular flow of money (Figure 4). The diagram summarizes the interaction of renewable and non-renewable resources within the system and the exchanges of emergy and dollars that drive the system’s economy. Sources of emergy from outside that cross the system boundary include: the renewable resources (R) (free environmental inputs), imported fuels and minerals (F), goods (G) and the services embodied in these imports (P2I) (purchased from economy outside the system). Sources of emergy derived from storages within the country include: (N0) (dispersed rural resources that are used faster than they are renewed such as soils or forest biomass harvested at unsustainable rates) and (N1) non-renewable resources (fossil fuels, metals and minerals). Exports from the system include: non-renewable resources (N2) that are exported without upgrading in the economy, finished products (B), and services and labor (P1E) embodied in B.
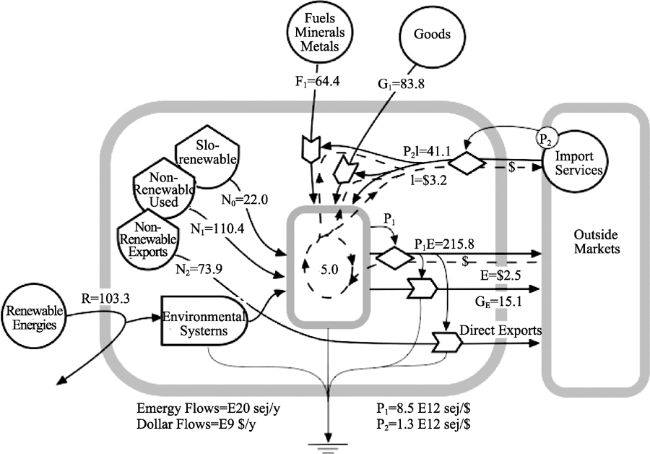
Figure 4 Aggregated diagram summarizing the quantities of emergy and money flowing into and out of the Mongolia’s economy (Table 2 lists each of the pathways and their definition)
The aggregated systems diagram in Figure 4 was used to construct a number of indices of emergy and monetary flows that are given in Table 3. Under the column labeled “expression” the equation of the flows used to compute the index is given.
Table 3 Indices using emergy for overview of Mongolia (2008)
Item Name of index Expression a. Quantity
1 Renewable emergy flow R 1.03E+22
2 Nonrenewable resources from within the country N 1.32E+22
3 Flow of imported emergy (incl. services) FI+GI+P2I 1.89E+22
4 Total emergy inflows (incl. services) R+FI+GI+P2I 2.93E+22
5 Total emergy support, (U) (incl. services) R+N0+N1+FI+GI+P2I 4.25E+22
6 Total emergy support, (UMOD) (NOT incl. services) R+N0+N1+FI+GI 3.84E+22
7 Exported emergy (NOT incl. services) GE + FE 8.91E+21
8 Exported emergy (incl. services) GE + FE + P1E 3.05E+22
9 Percent emergy from home sources (NO+N1+R)/U 55%
10 Imports minus exports (incl. services) (FI+GI+P2I) - (FE+GE+P1E) -1.16E+22
11 Imports minus exports (NOT incl. services) (FI+GI) - (FE +GE) -8.91E+21
12 Balance of payments (Export$ - Import$) (E - I) - 7.06E+08
13 Export to imports ratio (incl. services) (FE+GE+P1E) / (FI+GI+P2I) 1.61
14 Export to imports ratio (NOT incl. services) (FE+GE) / (FI+GI) 0.60
15 Percent of emergy locally renewable R/U 24.3%
16 Percent of emergy purchased (FI+GI+P2I)/U 45%
17 Percent of emergy as imported service P2I/U 10%
18 Percent of emergy that is free (R+N0+N1)/U 55%
19 Ratio of concentrated to rural (FI+GI+P2I+N1)/(R+N0) 2.39
22 Environmental loading ratio (ELR) (N0+N1+FI+GI+P2I) / R 3.11
23 Emergy yield ratio (EYR) (R+N0+N1+FI) / (P2I +GI) 2.40
24 Emergy sustainability index EYR/ELR 0.77
25 Ratio of emergy to GDP (EMR) P1=U/GDP 8.52E+12
26 Ratio of emergy to GDP (EMR, NOT including service) P1=UMOD/GDP 7.69E+12
20 Emergy per unit area, aerial empower Intensity U/(area m2) 2.72E+10
21 Emergy per person U/population 1.58E+16

a. letters refer to variable in Table 2 and Figure 2.

In 2008 the renewable emergy inflows equaled 103.3×10²⁰ sej (note that to avoid double counting the renewable inflows were computed as the sum of emergy of the chemical potential of precipitation utilized by plants (transpired) and the geopotential of the remaining precipitation that runs-off the landscape). Slowly renewable and non-renewable resources that are from within Mongolia totaled 132.4×10²⁰ sej, while imports of fuels minerals and finished goods were 148.2×10²⁰ sej. Overall, the total emergy driving the economy of Mongolia in 2008 (the sum of the renewables [R], slow renewables [N0] and non-renewables [N1] used from within the country, and the imports of fuels and minerals [FI] and finished goods [GI]) equaled 383.9×10²⁰ sej. If the services of the imported fuels and goods are included then the total emergy driving the economy in 2008 was 425.0×10²⁰ sej.
Mongolia’s emergy balance of payments (Table 3) was negative in 2008 as was its monetary balance of payments (-7.06×10⁸ USD). Often, especially in developed countries, a negative monetary balance of payments is accompanied by a positive emergy balance of payments which indicates that they are exporting finished products and importing raw resources. The fact that in 2008 both the monetary and emergy balance of payments were negative suggests that Mongolia’s economy is one that is highly subsidizing developed countries with which it trades. The money received for raw resources exported is always much less than their true value to the economic system that imports and uses them (Brown et al., 2009; Brown and Ulgiati, 2011).
In 2008, the global average emergy use per capita was 5.22 ×10¹⁶ sej/capita (NEAD, 2016), while Mongolia’s emergy per capita in that same year was 1.58 ×10¹⁶ sej/capita (Table 3), suggesting that Mongolia is somewhat below world average. In that same year, China’s emergy per capita was 3.1×10¹⁶ sej/capita (NEAD, 2016). Aerial empower intensity of Mongolia was 2.7×10¹⁰ sej m-2 in 2008 (Table 3). Compared to the world average in 2008 (3.1×10¹² sej m-2: NEAD, 2016), Mongolia’s overall emergy intensity is well below (2 order of magnitude) the world average, highlighting the relatively small overall emergy economy of the country. Mongolia’s emergy money ratio (EMR) in 2008 was 8.5×10¹² sej/USD compared to the world average of 2.7×10¹² sej/USD indicates that Mongolia was at a relatively high disadvantage when trading with other nations, exporting more resource wealth than it imports, dollar for dollar.

3.3 Time series emergy accounting

An emergy accounting of each of the 16 years between 1995 and 2012 was conducted like that shown in Table 1. Appendix B provides the summary data for each year, and Appendix C provides the summary indices.
3.3.1 Emergy flows in Mongolia
Figure 5 shows total emergy input in Mongolia for the period 1995-2012. The total emergy use (U) changed from 2.83×10²² sej in 1995 to 4.96×10²² sej in 2012, resulting in a 75% increase over the 16 years. The various components of emergy use changed as well. Figure 6 shows the change in percentage of total use of the components of the emergy budget between 1995 and 2012. Renewable emergy (R) was 39% of the total in 1995 but only comprised 23% in 2012. In like manner, local non-renewable emergy (N0+N1) decreased from 41% in 1995 to 33% in 2012. Imported emergy flows (FI) increased slightly from 18% in 1995 to 21% in 2012. And imported goods (GI) increased from 2% in 1995 to over 41% of total emergy budget in 2012. These data suggest not only that Mongolia’s economy was growing (75% in 16 years), but also an economy that is increasingly reliant on external sources of energy, materials and information.
Figure 5 Total emergy used in the Mongolia’s economy during 1995-2012
Figure 6 The change in emergy sources in Mongolia in 1995 and 2012
3.3.2 Renewable resources and non-renewable resources derived within Mongolia
Renewable resources (R) of Mongolia were an important emergy input, fluctuating between 8.46×10²¹ sej yr-1 and 1.49×10²² sej yr-1 (Figure 7) during 1995 and 2012. The fluctuations are due to changes in precipitation during the study period.
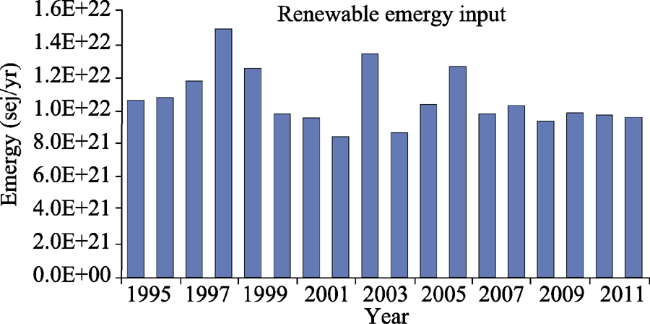
Figure 7 Renewable emergy input to the Mongolia’s economy during 1995-2012
Figure 8 is a graph showing the time series of local non-renewable resources derived from within Mongolia including “dispersed rural sources” (N0: primarily soil loss), “concentrated use” (N1: fossil fuels and minerals) and “mineral and fossil fuels directly exported” (N2). The total emergy of these local non-renewables increased from 1.1×10²² sej to 1.40×10²² sej, over the study period, resulting in a 38% increase (see Appendix B). While the emergy in soil loss due to erosion decreased about 30% from 3.3×10²¹ sej yr-1 to 2.2×10²¹ sej yr-1, the domestic use of fuels (mainly coal) and minerals increased nearly 50% from 7.9×10²¹ sej yr-1 to 1.2×10²² sej yr-1. The very large increase in fuel and mineral exports from 1.4×10²¹ sej yr-1 in 1995 to 3.6×10²² sej yr-1, representing a 25 fold increase, shows the extent of Mongolia’s involvement in providing resources to its trading partners.
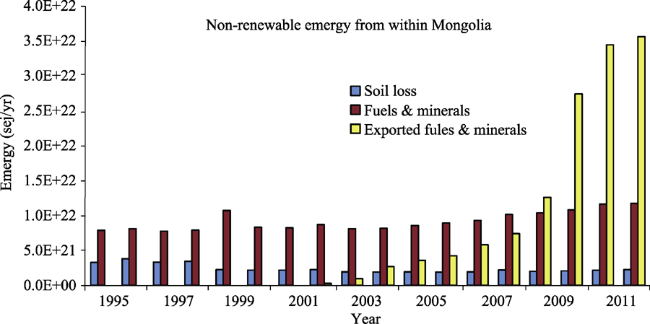
Figure 8 The total nonrenewable emergy used and exported in Mongolia during 1995-2012
3.3.3 Imports and exports
Figure 9 shows Mongolia’s monetary balance of payments. In the years between 1995, 1996 and 1997 Mongolia had a positive balance of payments. Beginning in 1998 and continuing to 2012 (with the exception of 2006) balance of payments were increasingly negative.
Figure 9 Mongolia’s monetary balance of payments during 1995-2012
The graphs in Figure 10 depict the emergy of imports and exports including and not including services to show the relative contribution that services make to import and export emergy. In Figure 10a services are included in both imports and exports. The services of exports were based on the emergy dollar ratio of Mongolia, while the emergy of services for imports was based on a world average emergy dollar ratio. In Figure 10b, services are not included. When services are included the emergy of Mongolia’s exports outweighed the emergy of imports in every year of the study (Figure 10a). In the late 1990s exported emergy exceeded imported emergy by an average factor of 1.8 to 1 (i.e. on the average, exported emergy was 1.8 times greater than imported emergy). In the period 2010 to 2012 exported emergy not only exceeded imported emergy by an average of 2.8 to 1, but the magnitude of exported emergy in 2012 was roughly 7 times the imported emergy in 1995. When services are not included in export and import emergy (Figure 10b), a different pattern emerges. The emergy of imported goods, fuels and minerals exceeds exported emergy from 1995 to 2008, however, after 2008 exported emergy significantly increases, averaging about 2.3 times the emergy in imports.
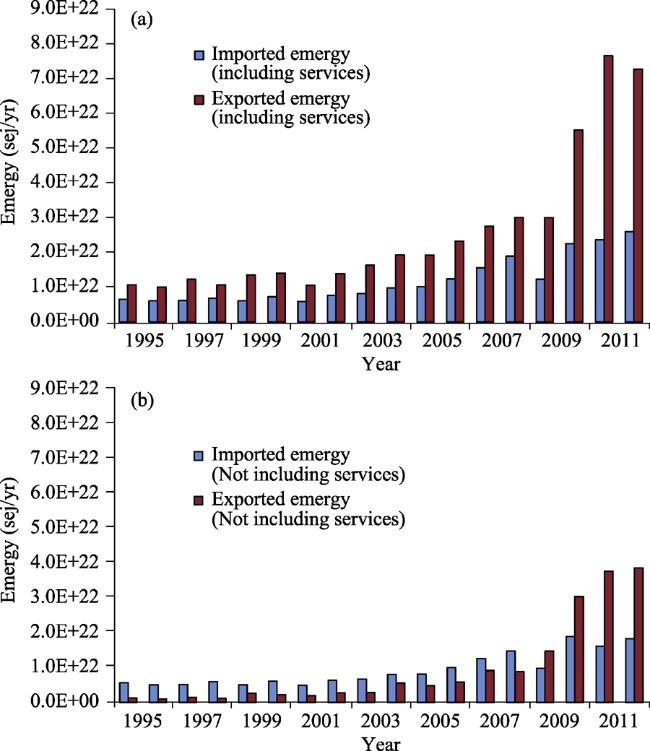
Figure 10 The emergy of imports and exports of Mongolia during 1995-2012

(a. Emergy of imports and exports including services; b. Emergy of imports and exports NOT including services)

3.3.4 Emergy intensities
Shown in Figure 11 are several emergy intensities of Mongolia including emergy use per person, aerial empower intensity and emergy money ratio. Emergy intensities were computed by dividing total emergy use (U) by Mongolia’s population, area, and GDP respectively.
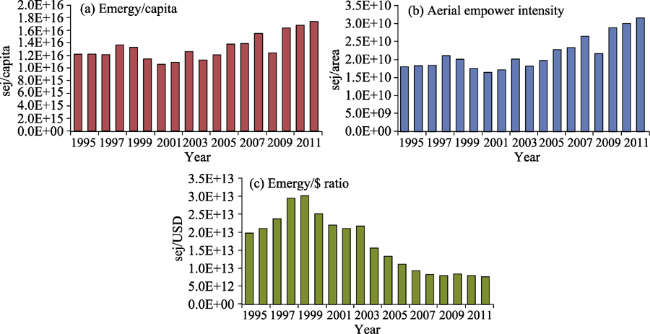
Figure 11 Emergy intensity ratios of Mongolia during 1995-2012

(a. Emergy per capita; b. Aerial empower intensity; c. Emergy money ratio expressed in equivalent USDs)

During the period 1995-2012, the population in Mongolia increased 24% from 2.32 million to 2.88 million, and the emergy use per capita increased from 1.22×10¹⁶ sej/capita to 1.74×10¹⁶ sej/capita (Figure 10a), a 43% increase. World average emergy use per capita during portions of this period was between 3×10¹⁶ and 5×10¹⁶ sej/capita (NEAD, 2016), suggesting that Mongolia is somewhat below world average.
Aerial empower intensity of Mongolia (Figure 10b) fluctuated between 1.6×10¹⁰ sej m-2, and 2.1×10¹⁰ sej m-2 until 2005 when significant increases in total emergy use doubled aerial empower intensity in 2012 to 3.2×10¹⁰ sej m-2. Compared to world averages during this same period of time, they were two orders of magnitude higher (NEAD, 2016: country average = 5.4×10¹² sej m-2 and median = 1.5×10¹² sej m-2). Mongolia’s lower aerial empower intensity is characteristic of a country with a very modest level of development.
Overall, the emergy money ratio (EMR) of Mongolia (Figure 11c) during 1995-2012 decreased from 1.99×10¹³ sej/USD to 7.75×10¹² sej/USD, a 61% decline. However, the ratio increased from 1995 to 1999 to over 3.0×10¹² sej/USD, whereupon it declined almost every year until 2012. The decline in the EMR indicates that the power of the Mongolian currency in purchasing real wealth is decreasing. In addition, the relatively high absolute values compared to the world average in 2008 (2.7×10¹² sej/USD) indicates that Mongolia is consistently at a relatively high disadvantage when trading with other nations, exporting more resource wealth than in imports, dollar for dollar.
3.3.5 Emergy indices of sustainability
We include three emergy indices (Figure 12) that when considered together provide a relative measure of Mongolia’s long-term sustainability. They include: 1) percentage of emergy use that is locally renewable, 2) percentage of total use that is imported, and 3) percentage of total use that is exported.
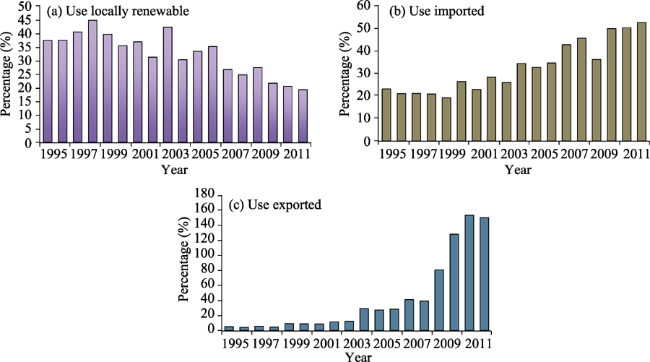
Figure 12 Emergy indices of sustainability in Mongolia during 1995-2012 (a. Percentage of total use from local renewable sources; b. Percentage of total emergy use that is imported; c. Percentage of total use that is exported)
Percentage of use locally renewable (%REN) - Mongolia had a relatively high percentage of total emergy use that is locally renewable (Figure 12a). For the first 7 years of the study period, until 2001 the percentage of use that was locally renewable was between 35% and 45%, after 2001 the percentage began to decrease (with the exception of 2003 which had higher rainfall) to about 20% in 2012. By comparison, the global average for the countries in the NEAD (2016) database in the year 2008 was 10% (median value = 5%). This large percentage of renewable sources is primarily harnessed and integrated into Mongolia’s economy through agriculture output.
Percentage of use imported (%IMP) - This index provides insight into the degree of dependency of an economy on external sources. In the early years of the study period, Mongolia’s dependency on imports was about 20% (Figure 12b). Over the years the percentage of use that is imported has increased to the point that in 2012, Mongolia imported a little over 50% of total emergy use. In 2008, the global average for countries in the NEAD (2016) was 55% (median value=56%) suggesting that Mongolia in recent years is more or less about average in terms of the percentage of use that is imported.
Percentage of use exported (%EXP) - This index relates exported emergy to the total emergy used in the economy. It shows the degree to which Mongolia is depleting its non-renewable capital (Figure 12c). During the study period, the percentage of Mongolia’s total emergy use that was exported increased substantially from about 5% to over 150%. This suggests that in the last couple of years of the study period, Mongolia exported 1.5 times the emergy than it consumed internally and if this emergy could have been directed at productive processes within the country, significant increases in overall economic productivity could have been realized.
3.3.6 Emergy performance indicators
Emergy exchange ratio (EER) - The EER is measure of trade efficiency, is the ratio of emergy received by the buyer, to the emergy given, in a trade. Obviously, ratios greater than 1.0 indicate positive emergy balance of payments, in which a country receives more emergy than is embodied in its exports. During the study period Mongolia’s EER was always less than 1.0 (Figure 13a). In 1995 Mongolia’s EER was 0.7 and decreased steadily to 0.3 in 2012. In comparison with global averages Mongolia’s EER was in a relatively low position in the available data, falling within the group of countries, i.e., Russia (0.26), China (0.43), Chile (0.44), Australia (0.29), Argentina (0.39), Brazil (0.4) and Saudi Arabia (0.14), which contributes large fluxes of real wealth to support growth in the global economies that receive them (NEAD, 2016).
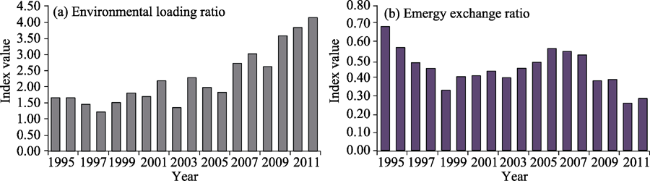
Figure 13 Emergy performance indicators of Mongolia during 1995-2012

a. Environmental loading ratio, the ratio of non-renewable emergy use to renewable emergy use; b. Emergy exchange ratio, the ratio of imported emergy to exported emergy

Environmental loading ratio (ELR) - The ELR is a ratio of non-renewable and imported emergy use to renewable emergy use (Odum 1996), it provides an indication of environmental pressures from the perspective of the renewable capacity of the environment to support economic processes and human endeavors. A large ELR indicates highly-intensive economic development and high environmental loads. In 2008, the average ELR for nations of the world was 102.4, while the median value is 17.3 (NEAD, 2016).
Because the environmental loading ratio (ELR) is composed of both non-renewable and renewable emergy inputs to an economy, differences in either of the variables result in changes in the index. In general, we conclude that a low index results from either large renewable or relatively small non-renewable inputs. Since renewable flows are most generally spatial in their input, larger countries tend to have larger total renewable inputs and therefore the ratio can be lower by virtue of the fact that the renewable flows are larger. So two countries having the same non-renewable inputs but different area can have very different ELRs.
In light of the above, interpreting the ELR is not straightforward. Be that as it may, in general, we believe that countries with ratios less than 10 have relatively low environmental load. This may be the result of a relatively small economy (Bolivia, Costa Rica, Guyana, Suriname, Uruguay, or Zambia) or because of a large surface area that is not intensely developed (Argentina, Australia, Brazil, Canada, Russia). Further, we believe that countries that have ELRs greater than 10 but less than 100 have moderate environmental load ... again tempered by either large area (Chile, Denmark, Norway, United States) or moderate sized economies (Botswana, Belize, Portugal, Venezuela). Finally, countries with ELRs greater than 100 tend to be relatively small in surface area and intensely developed (Austria, Finland, Italy, Israel, Germany).
The ELR of Mongolia (Figure 13b) remains relatively low having increased from 1.66 in 1995 to 4.15 in 2012. This would suggest that the overall pressure on Mongolia’s environment is low. However, obviously this is an average over the entire country. There maybe, and surely are, numerous areas within Mongolia (urban centers, mining districts, etc) where there are considerable environmental pressures. Mongolia’s relatively large land area (compared to population and developed areas) could be equated with a high capacity to absorb wastes, recycle by-products and provide other environmental services that are of fundamental importance to a sustainable development pattern.

4 Conclusions and suggestions

4.1 A word of caution

The findings in this national analysis cannot be compared to national analyses done for other countries in the past by multiplying these results by a simple ratio of the two baselines, for two reasons. First, the UEVs for minerals are significantly different from those used in the past, which also translates into very different UEVs for the metals like steel, aluminum and copper, etc. Second, we have used a UEV for rainfall that is almost 50% lower than the UEV used by Odum (1996) and that is given in the Center for Environmental Policy, Folio 1 (Odum, 2000). The UEV used in the present study was taken from a publication by Brown and Ulgiati (2016). Since rain and the emergy of geopotential (which is computed from rain) are the most important renewable emergy inputs to Mongolia, the fact that their UEVs are about 50% lower makes simple comparison with other national analyses problematic. Add this difference to the different UEV’s for minerals and metals and a simple ratio of baselines is obviously not appropriate.

4.2 Structure of Mongolia’s economy

The structure of Mongolia’s economy changed significantly during the 18-year period of this study. While total emergy use (U) in Mongolia increased 75% from 1995 to 2012 (Figure 5) its emergy per capita remains one of the lowest in the world (Figure 11). The percentage of renewable decreased from 39% in 1995 to 23% in 2012 while imported goods and materials increased from just 2% of total use to 23% (Figure 6). Imported fuels, minerals and electricity increased slightly from 18% to 21% of total emergy use. During this same period exports increased from 1.1×10²² sej yr-1 to 7.3×10²² sej yr-1, over a six fold increase in 18 years (Figure 8). By 2012, exports were about 150% of total emergy use in the economy (Figure 12). All in all, the growing dependence on imports and the dramatic increase in exports suggests that Mongolia’s economy is increasingly vulnerable to downturns in the world economy.
In the early years of this study, Mongolia had relatively large emergy money ratios, increasing each year until reaching a maximum of 3.0 ×10¹³ sej/$ then decreasing to about 7.8 ×10¹² sej/$ in 2012 (Figure 11). Since the world average EMR is much lower, and especially developed economies which are significantly lower, Mongolia is at a trade disadvantage with its currency, providing more emergy per transaction to trading partners than it receives. This is highlighted in the annual emergy exchange ratio of Mongolia (Figure 13a) showing consistent and increasing trade disadvantage over all years of this study. This can be interpreted as suggesting that far more resource wealth is exported from Mongolia than is received in imports. In essence, Mongolia is supporting its trading partner’s economies at the expense of its own economy.

4.3 Value added by emergy accounting

Standard economic national accounting treats the flows of resources as monetary flows. Since monetary flows are counter current to resource flows, i.e., they flow in the opposite direction from resource flows, emergy accounting provides an important perspective on the picture of a nation’s balance of trade. In monetary terms, if a country exports more than it imports (i.e. the monetary value of exports is greater than the money paid for imports), it is said that the economy has a trade surplus, a positive, or “favorable” balance of trade. Conversely, if the cost of a country’s imports is greater than the money received for its exports, it is said to be functioning with a trade deficit, a negative or “unfavorable” balance of trade.
On the other hand, from an emergy perspective, the opposite is true. If a country exports more emergy than it imports, its emergy trade balance is negative. And, of course, if it imports more emergy than it exports, its emergy trade balance is positive.
Often developed economies function with negative trade balance of payments monetarily, but have a positive emergy balance. Under these circumstances, since resources are the true driver of the economy, the net result can be a positive influence on the economy. For instance, the USA has had a negative monetary balance of payments every year since 1976, in both “good times” and “bad” (TradingEconomics, 2017) while maintaining an average annual growth rate of 3.2% (TradingEconomics, 2017).
Developing economies, because they often export raw resources and import finished products, frequently have a negative balance of trade in both monetary and emergy terms (Brown, 2003; Brown et al.; 2009). This can be a twofold blow to the economy. First a negative monetary balance of trade is generally financed through borrowing and thus the economy is more unsustainable in the long run and burdened with high interest rates. Second, the negative emergy trade balance means that resource capital stocks are being drawn down and instead of driving the local economy and building infrastructure, resources are driving their trading partner’s economy.
This is the case for Mongolia. For the majority of the 18 years included in this study its monetary and emergy trade balances were negative (Figures 9 and 10), especially in 2010, 2011, and 2012. All in all, this twofold weakness becomes a major impediment to a healthy economy. Resources are not building “value” and driving economic productivity, and the money received from their sale is not sufficient to purchase needed imports, which generates a continuing downward economic spiral.
The obvious solution is to stop exports, or raise the price of exports. However, neither of these options is feasible. Thus a different strategy is necessary, one that recognizes the value of resources as economic drivers. Optimally the best strategy would be one where companies that sign agreements to develop Mongolia’s mineral resources, provide the country with the means of developing the resources themselves and eventually developing the industrial capability to turn mineral resources into finished products. In this way the mineral wealth drives the economy to a far greater extent than the goods that can be purchased with the export income.
Clearly, it is important to adjust the resource utilization structure of Mongolia’s economy. As long as Mongolia exports its raw resources and imports finished goods and materials (in 2012, exported emergy was one and a half times the emergy budget of the country), it’s energetic economy will continue to suffer from a negative emergy trade balance, and the well-being of the population as measured by emergy per capita will remain low. Keeping resources within the economy and using them to make products for export will provide jobs, and a major boost to the economy.
Often, developing countries caught in the downward economic spiral induced by double trade deficits, devalue their currency in the hopes of turning things around. The “economic rational” for currency devaluation is primarily to combat trade imbalances by boosting exports (since devaluation in relation to other currencies causes exports to become less expensive) and reducing imports (since imports are more expensive). A second reason is that devaluation reduces the cost of interest payments on outstanding government debts. However from an emergy perspective, devaluation only exacerbates the problems by increasing the export of valuable resources and lowering the quantity of imported emergy, which ultimately slows the economy. Devaluing the Mongolian currency should be avoided at all costs, since a devalued currency makes resources less expensive in relation to other currencies and increases exports supporting other nations rather than supporting the Mongolia’s economy.
Mongolia’s renewable emergy base is relatively low in comparison with other nations that have moderate climates, abundant rain, and coastal locations. What it lacks in renewable emergy it more than makes up for with non-renewable fuels (coal) and mineral wealth. Like many developing economies with rich natural capital reserves, however, Mongolia is selling its wealth and using the income to purchase more and more finished products. Unfortunately, such a monetary policy may seem sound in the short run, but it is not sound energetic policy in the long run. Resources should be turned into economic infrastructure (buildings, roads, industrial capacity, etc.) within Mongolia, instead of in the countries with whom Mongolia trades. With economic infrastructure, Mongolia can begin to capitalize on its mineral and fuel wealth to develop a functioning economy. Without it, the country will remain poor, energetically, with one of the lowest per capita emergy use in the world.
The emergy perspective values resources not on their market value (referred to as “exchange value” by classical economists), but instead on their “use value”. In agreement with many of the classical economists, emergy is a measure of the “real wealth” of resources. In contrast, current economic thinking values resources on their exchange value, the result of which is a serious under valuation. Raw resources bring the lowest exchange values while finished products the highest. Developing countries like Mongolia which have relatively rich mineral resources cannot possibly get ahead trading high emergy minerals for low emergy finished products. In every trade they lose emergy...their high emergy resources drive their trading partner’s economy where they are turned into finished products and sold back to them. The emergy perspective suggests policies that recognize this inherent inequity and a method to compute balanced trade between nations that would go a long way in alleviating the downward economic spiral and replace it with self-regenerating circle of economic progress.

Additional information

Supplementary information accompanies this paper online.
Appendix A. Footnotes to Table 1
Renewable Sources
1 Solar Radiation
Land area = 1.56E+12 m2 (CIA, 2016)
Insolation = 5.99E+05 J cm-2 y-1 (IRENA, 2016)
Albedo = 30.00 (% of insolation) Estimate
Carnot efficiency = 0.93
Available energy (J) = (Land area )*(avg sun)*(1-albedo)*(Carnot effic.) +
(shelf area) (avg. sun)*Carnot effic.)
= (1.56 E+12 m2) (1.09E6 J cm-2 y-1) (1.0E+04 cm2 m-2) (0.70) (0.93)
= 6.10E+21 J y-1
UEV = 1.0 sej J-1
2 Earth Cycle
Land area = 1.56E+12 m2
Heat flow = 1.26E+06 J m-2 y-1 (Internat. Heat Flow Database, 2010)
Carnot efficiency = 9.50% = 1 - (287 K/ 317 K)
Available energy (J) = (land area) (heat flow) (Carnot efficiency)
= (1.56 E+12 m2) (2.0E6 J m-2 y-1) (0.095)
= 1.87E+17 J y-1
UEV = 4900 sej J-1 (Brown and Ulgiati, 2016)
3 Wind Energy
Land area = 1.56E+12 m2
Shelf area = 0.00E+00 m3
Density of air = 1.23E+00 kg m-3
Geostrophic wind = 1.04E+01 m s-1
Land wind velocity = 5.76E+00 m s-1 (NERL, 2016)
Land wind absorbed = 4.64E+00 m s-1
Land drag coeff. = 1.64E-03 (Palutikof et al., 1984)
Energy (J) = (land area) (air density) (drag coefficient) (wind velocity absorbed3) +
= (1.56 E+12 m2) (1.23 kg m-3) (1.64E-3) (4.64 m s-3) (3.15 E7 s y-1)
Available energy (J) = 9.93E+18 J y-1
UEV = 800 sej J-1 (Brown and Ulgiati, 2016)
4 Precipitation (chemical potential)
Land Area = 1.56E+12 m2
Precipitation (land) = 0.17 m y-1 (FAO Aquastat, 2016)
Transpiration rate = 93 % Pot. Evapotranspiration (UNEP, 2016)
Gibbs energy = 4720 J kg-1
Renewable Sources
Available energy (J) = (land area) (rainfall) (% transpired) (Gibbs energy of rain)
= (1.56E+12 m2) (0.24 m y-1) (93%) (1000 kg m-3) (4.72E+03 J kg-1)
= 1.13E+18 J y-1
UEV = 7000 sej J-1 (Brown and Ulgiati, 2016)
5 Runoff Geopotential
Land area = 1.56E+12 m2
Runoff = 0.01 m y-1 Precipitation - transpiration
Average elevation = 1060 m (NERL, 2016)
Available Energy (J) = (runoff) (density) (area) (avg elevation difference) (gravity)
= (0.16 m) (1000 kg m-3) (1.56E12 m2) (750) (9.8 m s-2)
= 1.88E+17 J y-1
UEV = 12800 sej J-1 (Brown and Ulgiati, 2016)
6 River Inflow (geopotential energy)
Discharge = 0.00E+00 m3 y-1 (FAO Aquastat, 2016)
Elevation = 1060.00 m (dif. inflow-outflow) (NERL, 2016)
Water density = 1000.00 kg m-3
Available energy (J) = (discharge) (density) (Elevation difference) (gravity)
= (0.00 m3) (1000 kg/m3) (1060 m) (9.8 m s-2)
= 0.00E+00 J y-1
UEV = 12800 sej J-1 (Brown and Ulgiati, 2016)
7 River Inflow (chemical energy)
Discharge = 0.00E+00 m3 y-1 (FAO Aquastat, 2016)
TDSINFLOW = 10 ppm Rain TDS
TDSOUTFLOW = 3500 ppm estimate
Gas Constant 8.134 J mol-1 K-1
T = 287.25 K
M weight water = 18.02 g
Gibbs energy = ((gas constant)*(T)*Ln(TDSINFLOW / TDSOUTFLOW)) / (M weight water)
= ((8.13)*(287.25)*Ln(999990ppm / 999450ppm)) / (18.01 g M-1)
= 4.53E-01 J g-1
Available energy (J) = (discharge) (1E6 g m-3) (Gibbs energy)
= 0.00E+00
UEV = 21300 sej J-1 (Brown and Ulgiati, 2016)
Indigenous Renewable Production
8 Hydroelectricity
Production = 0.00E+00 kWh y-1 (EIA, 2016)
Available Energy (J) = (____kWh y-1)*(3.6 E6 J kWh-1)
= 0.00E+00 J y-1
UEV = 2.54E+05 sej J-1 (Odum, 1996)
9 Agricultural Production (grains, vegetables, etc):
Production = 7.87E+05 MT (20% humidity) (FAO, 2016)
Available energy (J) = (Total production) (1 - water content) (energy content)
= (____ MT)*(1E06 g MT-1)*(80%)*(4.0 kcal g-1)*(4186 J kcal-1)
= 1.05E+16 J y-1
UEV = 2.54E+05 sej J-1 (Odum, 1996)
Renewable Sources
10 Livestock Production (meat)
Livestock production = 1.49E+05 MT (80% humidity) (FAO, 2016)
Available energy (J) = (Total production) (1 - water content) (energy content)
= (____ MT)*(1E+06 g MT-1)*(20%)*(5.0 kcal g-1)*(4186 J kcal-1)
= 6.24E+14 J y-1
UEV = 2.54E+06 sej J-1 (Odum, 1996)
11 Fishery Production
Fish catch = 1.85E+02 MT (80% humidity) (FAO, 2016)
Available energy (J) = (Total production) (1 - water content) (energy content)
= (____ MT)*(1E+06 g MT-1)*(5.0 kcal g-1)*(20%)*(4186 J kcal-1)
= 7.74E+11 J y-1
UEV = 2.54E+06 sej J-1 Odum, 1996)
12 Fuelwood Production
Fuelwood prod = 8.70E+05 m3 (FAO, 2016)
Available energy (J) = (Total production) (1 - water content) (energy content)
= (____ m3) (0.5E6 g m-3) (3.6 kcal g-1) (80%) (4186 J kcal-1)
= 5.24E+15 J y-1
UEV = 1.87E+04 sej J-1 (DeVilbiss & Brown, 2015)
13 Forest Extraction
Harvest = 2.53E+06 m3 (FAO, 2016)
Available energy (J) = (Total production) (1 - water content) (energy content)
= (____ m3) (0.5E+06 g m-3) (80%) (3.6 kcal g-1) (4186 J kcal-1)
= 1.53E+16 J y-1
UEV = 1.87E+04 sej J-1 (DeVilbiss & Brown, 2015)
Nonrenewable Resource Use from Within the Country
14 Natural Gas
Consumption = 0.00E+00 m3 y-1 (EIA, 2016)
Available energy (J) = (____m3 y-1) (energy content)
= (____m3 y-1)*(8966 kcal m-3)*(4186 J kcal-1)
= 0.00E+00 J y-1
UEV = 1.40E+05 sej J-1 (DeVilbiss & Brown, 2015)
15 Oil
Consumption = 1.87E+03 bbl y-1 (EIA, 2016)
Available energy (J) = (____ barrel/yr) (energy content)
= (____bbl y-1)*(5.86E9 J bbl-1)
= 1.10E+16 J y-1
UEV = 1.40E+05 sej J-1 (DeVilbiss & Brown, 2015)
16 Coal
Consumption = 5.92E+03 MT y-1 (EIA, 2016)
Available energy (J) = (____MT y-1) (energy content)
= (____MT y-1)*(2.9E+10 J MT-1)
= 1.72E+17 J y-1
UEV = 5.21E+04 sej J-1 (DeVilbiss & Brown, 2015)
17 Minerals (including limestone and fertilizers) (BGS, 2016)
Consumption UEV (DeVilbiss & Brown, 2015)
Renewable Sources
Gypsum = 6.10E+04 MT y-1 5.26E+08 sej g-1
Phosphorus = 0.00E+00 MT y-1 2.34E+07 sej g-1
Potash = 0.00E+00 MT y-1 8.20E+09 sej g-1
Nitrogen = 0.00E+00 MT y-1 4.32E+10 sej g-1
Total consumption = 6.10E+04 MT y-1 5.26E+08 sej g-1
Mass (g) = (____E6 MT y-1)*(1E6 g MT-1)
= 6.10E+10 g y-1
UEV (weighed) = 5.26E+08 sej g-1
18 Metals (mined - Al, Au, Cu, Fe, others) (BGS, 2016)
Consumption UEV (DeVilbiss & Brown, 2015)
Aluminum (bauxite) = 3.71E+04 MT y-1 1.70E+07 sej g-1
Iron = 6.65E+05 MT y-1 2.27E+07 sej g-1
Copper = 3.76E+05 MT y-1 3.00E+08 sej g-1
Fluorspar 6.89E+05 MT y-1 3.05E+07 sej g-1
Gold = 1.75E+01 MT y-1 5.00E+08 sej g-1
Silver = 2.05E+01 MT y-1 3.84E+08
Zinc = 7.70E+04 MT y-1 1.50E+08 sej/g
Total Consumption = 1.84E+06 MT y-1 7.60E+07 sej/g
Mass (g) = (____E5 MT y-1)*(1E6 g MT-1)
= 1.84E+12 g y-1
UEV (weighed) = 7.60E+07 sej g-1
19 TOPSOIL (soil organic matter)
Harvested cropland = 1.16E+12 m2 (World Bank, 2016)
Soil loss = 1.22E+02 g m-2 y-1 (ISRIC, 2016)
Avg. organic content (%) = 3 %
Available energy (J) = (__g m-2 y-1)*( __ m2)*(% organic)*(5.4 kcal g-1) (4186 J kcal-1)
= 9.62E+16 J y-1
UEV = 2.01E+04 sej J-1 (DeVilbiss & Brown, 2015)
20 Water Extraction
Extraction = 1.18E+09 m3 y-1 (FAO Aquastat, 2016)
Available energy (J) = (_____m3 y-1) (1.0E6 g m-3) (Gibbs energy in water)
= (4.43E+8 m3 y-1) (1.0 E6 g m-3) (4.72 J g-1)
= 5.58E+15 J y-1
UEV = 4.80E+04 sej J-1 (DeVilbiss & Brown, 2015)
Imports of Energy, Materials & Goods
21 Fuels
Natural gas = 5.00E+04 m3 y-1 (EIA, 2016)
Available energy (J) = (____m3 y-1)*(8966 kcal m-3)*(4186 J kcal-1)
Oil derived fuels = 8.59E+08 l y-1 (EIA, 2016)
Available energy (J) = (____l y-1)*(1.14E4 kcal l-1)*(4186 J kcal-1)
Coal = 1.00E+03 MT y-1 (EIA, 2016)
Available energy (J) = (_MT y-1)*(2.9E10 J MT-1)
Import amount UEV (DeVilbiss & Brown, 2015)
Natural gas = 1.88E+12 J y-1 1.40E+05 sej J-1
Oil derived fuels = 4.10E+16 J y-1 1.32E+05 sej J-1
Renewable Sources
Coal = 2.90E+13 J y-1 6.70E+04 sej J-1
Total fuels = 4.10E+16 J y-1 1.32E+05
UEV (weighted)= 1.32E+05 sej J-1
22 Metals (UN TradeCom, 2016)
Import amount UEV (DeVilbiss & Brown, 2015)
Aluminum ore (Bauxite) = 5.00E+04 MT y-1 1.70E+07 sej g-1
Aluminum = 2.40E+04 MT y-1 1.70E+08 sej g-1
Iron ore = 8.69E+01 MT y-1 2.27E+07 sej g-1
Steel = 0.00E+00 MT y-1 4.13E+09 sej g-1
Copper = 0.00E+00 MT y-1 2.82E+08 sej g-1
Gold = 0.00E+00 MT y-1 4.55E+11 sej g-1
Others = 1.77E+02 MT y-1 3.92E+08 sej g-1
Total imports = 7.43E+04 MT y-1 6.73E+07 sej g-1
Mass (g) = (____MT y-1)*(1E6 g MT-1)
7.43E+10 g y-1
UEV (weighed) = 6.73E+07 sej g-1
23 Minerals (UN TradeCom, 2016)
Import amount UEV (DeVilbiss & Brown, 2015)
Limestone = 3.73E+03 MT y-1 5.26E+08 sej g-1
Sand = 8.66E+05 MT y-1 1.56E+06 sej g-1
Gravel = 4.27E+05 MT y-1 1.03E+06 sej g-1
Phosphorus = 1.14E+02 MT y-1 2.34E+07 sej g-1
Potash = 8.36E+02 MT y-1 8.20E+06 sej g-1
Clay = 7.51E+06 MT y-1 4.50E+06 sej g-1
Others = 8.18E+06 MT y-1 9.41E+07 sej g-1
Total imports = 1.70E+07 MT y-1 4.75E+07 sej g-1
Mass (g) = (____MT y-1)*(1E6 g MT-1)
= 1.70E+13 g y-1
UEV (weighed) = 4.75E+07 sej g-1
24 Electricity
Kilowatt Hrs/yr = 2.41E+08 kWh y-1 (EIA, 2016)
Available energy (J) = (Energy production) (energy content)
= (____kWh y-1)*(3.6 E6 J kWh-1)
= 8.68E+14 J y-1
UEV = 2.54E+05 sej J-1 (Odum, 1996)
25 Food and Agricultural Products
Imports = 4.92E+05 MT y-1 (UN TradeCom, 2016)
Available energy (J) = (____MT y-1)*(1E6 g MT-1)*(3.5 kcal g-1)*(4186 J kcal-1)*(80%)
= 5.77E+15 J y-1
UEV = 4.28E+05 sej J-1 (Odum,1996)
26 Livestock, Fish, Meat
Imports = 1.94E+04 MT y-1 (UN TradeCom, 2016)
Available energy (J) = (____MT y-1)*(1E6 g MT-1)*(5 kcal g-1)*(4186 J kcal-1)*(0.22 protein)
= 8.93E+13 J y-1
UEV = 2.54E+06 sej J-1 sej J-1 (Odum, 1996)
Renewable Sources
27 Plastics & Rubber
Imports = 1.64E+04 MT y-1 (UN TradeCom, 2016)
Available energy (J) = (____MT y-1)*(1000 kg MT-1)*(30.0E6 J kg-1)
= 4.92E+14 J y-1
UEV = 1.32E+05 sej J-1 (DeVilbiss & Brown, 2015)
28 Chemicals
Imports = 7.53E+04 MT y-1 (UN TradeCom, 2016)
Mass (g) = (____MT y-1)*(1E6 g MT-1)
= 7.53E+10 g y-1
UEV = 1.12E+10 sej g-1 *as pesticides
29 Finished Products (lumber, paper, textiles, glass, others) (UN TradeCom, 2016)
Import amount UEV (DeVilbiss & Brown, 2015)
Lumber = 1.29E+05 MT y-1 2.70E+08 sej g-1
Paper = 1.31E+04 MT y-1 8.46E+09 sej g-1
Textiles = 1.16E+04 MT y-1 3.69E+09 sej g-1
Steel = 2.63E+04 MT y-1 4.19E+09 sej g-1
Others = 7.34E+05 MT y-1 4.15E+09 sej g-1
Total imports = 9.14E+05 MT y-1 3.66E+09 sej g-1
Energy (J) = (____MT y-1)*(1E6 g MT-1)
= 9.14E+11 g y-1
UEV = 3.66E+09 sej g-1
30 Machinery & Transportation Equipment
Imports = 7.52E+04 MT y-1 (UN TradeCom, 2016)
Mass (g) = (____ E4 MT y-1)*(1E6 g MT-1)
= 7.52E+10 g y-1
UEV = 1.90E+10 sej g-1 (Rotolo et al., 2007)
31 Services in Imports
Dollar value = 3.24E+09 $US (UN TradeCom, 2016)
World emergy/$ ratio = 1.27E+12 sej $-1
Exports of Energy, Materials and Goods
32 Food and Agricultural Products
Exports = 2.11E+04 MT y-1 (UN TradeCom, 2016)
Available energy (J) = (____MT y-1)*(1E+06 g MT-1)*(80%)*(3.5 kcal g-1)*(4186 J kcal-1)
= 2.47E+14 J y-1
UEV = 2.54E+05 sej J-1 (Odum, 1996)
33 Livestock, Fish, Meat
Exports = 7.94E+04 MT y-1 (UN TradeCom, 2016)
Available energy (J) = (____MT y-1) (1E+06 g MT-1) (5 kcal g-1) (4187 J kcal-1) (.22 prot)
= 3.66E+14 J y-1
UEV = 2.54E+06 sej J-1 (Odum, 1996)
34 Finished Products (lumber, paper, textiles, glass, others) (UN TradeCom, 2016)
Exported amount UEV
Lumber = 1.23E+04 MT y-1 2.70E+08 sej g-1
Paper = 3.66E+03 MT y-1 8.46E+09 sej g-1
Textiles = 2.40E+04 MT y-1 3.69E+09 sej g-1
Renewable Sources
Others = 7.86E+04 MT y-1 4.15E+09 sej g-1
Total exports = 1.19E+05 MT y-1 3.79E+09 sej g-1
Available energy (J) = (____MT y-1) (1.0E+06 g MT-1)
= 1.19E+11 g y-1
UEV (weighed) = 3.79E+09 sej g-1 Odum, 1996
35 Fuels
Natural gas = 0.00E+00 m3 y-1 (EIA, 2016)
Available energy (J) = (____ m3 y-1)*(8966 kcal m-3)*(4186 J kcal-1)
Oil derived fuels = 1.31E+08 l y-1 (EIA, 2016)
Available energy (J) = (____l y-1)*(1.14E4 kcal l-1)*(4186 J kcal-1)
Coal = 4.17E+06 MT y-1 (EIA, 2016)
Available energy (J) = (_ Quantity)*( J/Quantity)
Exported amount UEV (DeVilbiss & Brown, 2016)
Natural gas = 0.00E+00 J y-1 1.40E+05 sej J-1
Oil derived fuels = 6.23E+15 J y-1 1.32E+05 sej J-1
Coal = 1.21E+17 J y-1 5.21E+04 sej J-1
Total fuels = 1.27E+17 J y-1 5.60E+04 sej J-1
UEV (weighed) = 5.60E+04 sej J-1
36 Metals (UN TradeCom, 2016)
Exported amount UEV (DeVilbiss & Brown, 2016)
Aluminum ore (Bauxite) = 3.60E+04 MT y-1 1.70E+07 sej g-1
Aluminum = 1.29E+02 MT y-1 1.70E+10 sej g-1
Iron ore = 2.40E+04 MT y-1 2.27E+07 sej g-1
Steel = 0.00E+00 MT y-1 4.13E+09 sej g-1
Copper = 6.32E+05 MT y-1 2.82E+08 sej g-1
Zinc = 1.32E+04 MT y-1 1.52E+08 sej g-1
Others = 7.66E+04 MT y-1 3.92E+08 sej g-1
Total exports = 7.82E+05 MT y-1 2.73E+08 sej g-1
Mass (g) = (____MT y-1)*(1E6 g MT-1)
= 7.82E+11 g y-1
UEV (weighed) = 2.73E+08 sej g-1
37 Minerals (UN TradeCom, 2016)
Exported amount UEV (DeVilbiss & Brown, 2015)
Limestone = 7.53E+03 MT y-1 5.26E+08 sej g-1
Fluospar = 4.03E+04 MT y-1 2.34E+07 sej g-1
Potash = 0.00E+00 MT y-1 8.20E+09 sej g-1
Nitrogen = 0.00E+00 MT y-1 4.32E+10 sej g-1
Others = 0.00E+00 MT y-1 1.30E+10 sej g-1
Total Exports = 4.78E+04 MT y-1 1.03E+08 sej g-1
Mass (g) = (____MT y-1) (1.0E+06 g MT-1)
= 4.78E+10 g y-1
UEV (weighed)= 1.03E+08 sej g-1
38 Chemicals
Exports = 4.12E+03 MT y-1 (UN TradeCom, 2016)
Mass (g) = (____MT y-1)*(1E6 g MT-1)
Renewable Sources
= 4.12E+09 g y-1
UEV = 1.12E+10 sej g-1 (as pesticides) (Brandt-Williams, 2000)
39 Electricity
Production exported/yr = 1.01E+07 kWh y-1 (UN TradeCom, 2016)
Available energy (J) = (Energy production) (energy content)
= (____kWh y-1)*(3.6 E6 J kWh-1)
= 3.64E+13 J y-1
UEV = 2.54E+05 sej J-1 (Odum, 1996)
40 Machinery & Transportation Equipment
Exports = 1.47E+03 MT y-1 (UN TradeCom, 2016)
Mass (g) = (____MT y-1)*(1E6 g MT-1)
= 1.47E+09 g y-1
UEV = 1.44E+10 sej g-1 (Rotolo et al., 2007)
41 Plastics and Rubber Products
Exports = 8.00E+00 MT y-1 (UN TradeCom, 2016)
Available energy (J) = (____MT y-1)*(1000 kg MT-1)*(30.0E6 J kg-1)
= 2.40E+11
UEV = 1.32E+05 sej J-1 (as oil) (DeVilbiss & Brown, 2015)
42 Services in Exports
Dollar value = 2.53E+09 $US (UN TradeCom, 2016)
EMR= 8.52E+12 sej $-1 Computed
Appendix B. Summary of annual flows for Mongolia 1995-2012
Variable Emergy flow 1995 1996 1997 1998 1999 2000 2001
R Renewable emergy received 1.1E+22 1.1E+22 1.2E+22 1.5E+22 1.3E+22 9.8E+21 9.6E+21
N Nonrenewable sources from within 1.1E+22 1.2E+22 1.1E+22 1.1E+22 1.3E+22 1.0E+22 1.0E+22
N0 Dispersed rural source 3.3E+21 3.8E+21 3.3E+21 3.4E+21 2.3E+21 2.2E+21 2.2E+21
N1 Concentrated use (fuels, etc.) 7.9E+21 8.1E+21 7.7E+21 7.9E+21 1.1E+22 8.3E+21 8.2E+21
N2 Minerals, fuels exported without use 1.4E+20 1.5E+20 1.5E+20 1.5E+20 1.5E+20 1.5E+20 1.6E+20
FI Imported minerals, fuels, elec. etc. 5.0E+21 4.7E+21 4.9E+21 5.0E+21 3.2E+21 3.5E+21 3.5E+21
GI Imported goods & materials 6.7E+20 4.3E+20 3.9E+20 9.6E+20 1.9E+21 2.7E+21 1.4E+21
P2I Imported services, total 8.1E+20 8.7E+20 8.8E+20 8.9E+20 9.5E+20 1.1E+21 9.8E+20
I Dollars paid for all imports 4.2E+08 4.5E+08 4.7E+08 4.7E+08 5.1E+08 6.1E+08 5.5E+08
GE Exported products (goods & elec.) 1.1E+21 9.3E+20 1.3E+21 1.1E+21 2.5E+21 2.1E+21 1.9E+21
FE Exported fuels, minerals & electricity 1.4E+20 1.5E+20 1.9E+20 2.0E+20 2.1E+20 1.8E+20 1.8E+20
P1E Exported services, total 9.4E+21 9.0E+21 1.1E+22 9.4E+21 1.1E+22 1.2E+22 8.5E+21
E Dollars paid for all exports 4.7E+08 4.2E+08 4.5E+08 3.2E+08 3.6E+08 4.7E+08 3.9E+08
GDP Gross domestic product 1.4E+09 1.4E+09 1.2E+09 1.1E+09 1.0E+09 1.1E+09 1.2E+09
P1 Mongolia emergy/$ ratio 2.0E+13 2.1E+13 2.4E+13 3.0E+13 3.0E+13 2.5E+13 2.2E+13
Appendix C. Emergy Indices overview of Mongolia
Name of Index Expression 1995 1996 1997 1998 1999 2000
Indigenous non-renewable N0+N1 1.11E+22 1.19E+22 1.11E+22 1.13E+22 1.30E+22 1.05E+22
Imported emergy (including services) F+GI+P2I 6.52E+21 6.03E+21 6.12E+21 6.89E+21 6.04E+21 7.25E+21
Imported emergy (Not including services) F+GI 5.70E+21 5.16E+21 5.24E+21 6.01E+21 5.09E+21 6.15E+21
Total emergy inflows (including services) R+F+GI+P2I 1.71E+22 1.68E+22 1.79E+22 2.18E+22 1.86E+22 1.71E+22
Total emergy inflows (Not including services) R+F+GI 1.63E+22 1.60E+22 1.70E+22 2.09E+22 1.77E+22 1.60E+22
Total emergy used (including services) U=R+N0+N1+F+GI+P2I 2.83E+22 2.88E+22 2.90E+22 3.31E+22 3.16E+22 2.76E+22
Total emergy used (Not including services) U=R+N0+N1+F+GI 2.75E+22 2.79E+22 2.81E+22 3.23E+22 3.06E+22 2.65E+22
Exported emergy (including services) GE+P1E+N2 1.07E+22 1.01E+22 1.22E+22 1.06E+22 1.35E+22 1.41E+22
Exported emergy (Not including services) N2+GE 1.29E+21 1.08E+21 1.46E+21 1.25E+21 2.68E+21 2.27E+21
Emergy yield Y=R+N+F+GI+P2I 2.83E+22 2.88E+22 2.90E+22 3.31E+22 3.16E+22 2.76E+22
Percent emergy used from home sources (N0+N1+R)/U 0.77 0.79 0.79 0.79 0.81 0.74
Imports - Exports ($) I - E -5.80E+07 2.66E+07 1.68E+07 1.56E+08 1.55E+08 1.48E+08
Imports - Exports (sej) (F+GI+P2I)-
(GE+P1E+N2)
-4.18E+21 -4.04E+21 -6.13E+21 -3.75E+21 -7.50E+21 -6.82E+21
Ratio of export to imports (GE+P1E+N2)/
(F+GI+P2I)
1.64 1.67 2.00 1.54 2.24 1.94
Ratio of export to imports (Not including services) GE+N2)/(F+GI) 0.23 0.21 0.28 0.21 0.53 0.37
Percent use, locally renewable R/U 38% 38% 41% 45% 40% 36%
Percent of use purchased import (Emergy dependency) (F+GI+P2I)/U 23% 21% 21% 21% 19% 26%
Percent of use that is free (R+N0+N1)/U 49% 51% 52% 55% 47% 44%
Percent of total use that is exported (N2+GE+FE)/U 5% 4% 6% 4% 9% 9%
Ratio of concentrated to rural (F1+GI+N1+
P2I)/(R+N0)
1.04 0.96 0.92 0.80 1.13 1.30
Environmental loading ratio (ELR) (N0+N1+F+
GI+P2I)/(R)
1.66 1.66 1.46 1.22 1.51 1.81
Emergy investment ratio(EIR) (FI+GI+P2I)/
(R+N0+N1)
0.30 0.27 0.27 0.26 0.24 0.36
Emergy exchange ratio (EER) (F+GI+P2I)/ (N2+GE+P1E) 0.68 0.57 0.48 0.45 0.33 0.41
Aerial empower intensity U/Area 1.81E+10 1.84E+10 1.85E+10 2.12E+10 2.02E+10 1.76E+10
Use per capita U/Population 1.22E+16 1.22E+16 1.21E+16 1.37E+16 1.33E+16 1.14E+16
Emergy money ratio (EMR) U/GDP 1.99E+13 2.12E+13 2.39E+13 2.96E+13 3.03E+13 2.53E+13
Name of Index Expression 2002 2003 2004 2005 2006 2007
Indigenous non-renewable N0+N1 1.09E+22 1.01E+22 1.01E+22 1.05E+22 1.08E+22 1.12E+22
Imported emergy (including services) F+GI+P2I 7.62E+21 8.16E+21 9.80E+21 1.01E+22 1.24E+22 1.56E+22
Imported emergy (Not including services) F+GI 6.40E+21 6.78E+21 8.07E+21 8.16E+21 1.01E+22 1.27E+22
Total emergy inflows (including services) R+F+GI+P2I 1.61E+22 2.16E+22 1.85E+22 2.05E+22 2.50E+22 2.54E+22
Total emergy inflows (Not including services) R+F+GI 1.49E+22 2.02E+22 1.68E+22 1.86E+22 2.27E+22 2.25E+22
Total emergy used (including services) U=R+N0+N1+
F+GI+P2I
2.70E+22 3.17E+22 2.86E+22 3.10E+22 3.58E+22 3.66E+22
Total emergy used (Not including services) U=R+N0+N1+
F+GI
2.58E+22 3.03E+22 2.69E+22 2.91E+22 3.35E+22 3.37E+22
Exported emergy (including services) GE+P1E+N2 1.39E+22 1.63E+22 1.93E+22 1.92E+22 2.32E+22 2.75E+22
Exported emergy (Not including services) N2+GE 2.78E+21 2.88E+21 5.60E+21 4.90E+21 5.89E+21 9.21E+21
Emergy yield Y=R+N+F+
GI+P2I
2.70E+22 3.17E+22 2.86E+22 3.10E+22 3.58E+22 3.66E+22
Percent emergy used from home sources (N0+N1+R)/U 0.72 0.74 0.66 0.67 0.66 0.57
Imports - Exports ($) I - E 1.67E+08 1.85E+08 1.51E+08 1.19E+08 -1.07E+08 1.14E+08
Imports - Exports (sej) (F+GI+P2I)-
(GE+P1E+N2)
-6.27E+21 -8.18E+21 -9.49E+21 -9.11E+21 -1.09E+22 -1.19E+22
Ratio of export to imports (GE+P1E+N2)/
(F+GI+P2I)
1.82 2.00 1.97 1.90 1.88 1.76
Ratio of export to imports (Not including services) GE+N2)/(F+GI) 0.43 0.42 0.69 0.60 0.59 0.73
Percent use, locally renewable R/U 31% 42% 30% 34% 35% 27%
Percent of use purchased import (Emergy dependency) (F+GI+P2I)/U 28% 26% 34% 33% 34% 43%
Percent of use that is free (R+N0+N1)/U 40% 49% 37% 40% 41% 32%
Percent of total use that is exported (N2+GE+FE)/U 11% 12% 29% 27% 28% 41%
Ratio of concentrated to rural (F1+GI+N1+P2I)
/(R+N0)
1.52 1.06 1.69 1.51 1.46 2.12
Environmental loading ratio (ELR) (N0+N1+F+GI+
P2I)/(R)
2.19 1.36 2.28 1.98 1.83 2.73
Emergy investment ratio(EIR) (FI+GI+P2I)/
(R+N0+N1)
0.39 0.35 0.52 0.48 0.53 0.74
Emergy exchange ratio (EER) (F+GI+P2I)/ (N2+GE+P1E) 0.44 0.40 0.45 0.49 0.56 0.55
Aerial empower intensity U/Area 1.73E+10 2.02E+10 1.83E+10 1.98E+10 2.29E+10 2.34E+10
Use per capita U/Population 1.09E+16 1.26E+16 1.13E+16 1.21E+16 1.38E+16 1.39E+16
Emergy money ratio (EMR) U/GDP 2.12E+13 2.19E+13 1.57E+13 1.34E+13 1.12E+13 9.42E+12
Name of Index Expression 2008 2009 2010 2011 2012
Indigenous non-renewable N0+N1 1.23E+22 1.24E+22 1.29E+22 1.38E+22 1.40E+22
Imported emergy (including services) F+GI+P2I 1.89E+22 1.23E+22 2.26E+22 2.37E+22 2.60E+22
Imported emergy (Not including services) F+GI 1.48E+22 9.87E+21 1.89E+22 1.62E+22 1.84E+22
Total emergy inflows (including services) R+F+GI+P2I 2.93E+22 2.17E+22 3.24E+22 3.34E+22 3.56E+22
Total emergy inflows (Not including services) R+F+GI 2.52E+22 1.93E+22 2.88E+22 2.60E+22 2.80E+22
Total emergy used (including services) U=R+N0+N1+F+
GI+P2I
4.16E+22 3.40E+22 4.53E+22 4.72E+22 4.96E+22
Total emergy used (Not including services) U=R+N0+N1+F+GI 3.75E+22 3.16E+22 4.17E+22 3.97E+22 4.20E+22
Exported emergy (including services) GE+P1E+N2 3.00E+22 3.00E+22 5.53E+22 7.66E+22 7.27E+22
Exported emergy (Not including services) N2+GE 8.90E+21 1.48E+22 3.05E+22 3.78E+22 3.87E+22
Emergy yield Y=R+N+F+GI+P2I 4.16E+22 3.40E+22 4.53E+22 4.72E+22 4.96E+22
Percent emergy used from home sources (N0+N1+R)/U 0.54 0.64 0.50 0.50 0.48
Imports - Exports ($) I - E 7.10E+08 2.52E+08 2.92E+08 1.78E+09 2.35E+09
Imports - Exports (sej) (F+GI+P2I)-(GE+
P1E+N2)
-1.11E+22 -1.77E+22 -3.27E+22 -5.29E+22 -4.67E+22
Ratio of export to imports (GE+P1E+N2)/(F+
GI+P2I)
1.59 2.44 2.45 3.24 2.80
Ratio of export to imports (Not including services) GE+N2)/(F+GI) 0.60 1.50 1.61 2.33 2.11
Percent use, locally renewable R/U 25% 28% 22% 21% 19%
Percent of use purchased import (Emergy dependency) (F+GI+P2I)/U 46% 36% 50% 50% 52%
Percent of use that is free (R+N0+N1)/U 54% 33% 26% 25% 24%
Percent of total use that is exported (N2+GE+FE)/U 39% 81% 128% 153% 150%
Ratio of concentrated to rural (F1+GI+N1+P2I)/(R+
N0)
2.32 1.99 2.79 2.96 3.18
Environmental loading ratio (ELR) (N0+N1+F+GI+P2I)/
(R)
3.02 2.63 3.59 3.84 4.15
Emergy investment ratio(EIR) (FI+GI+P2I)/(R+N0+
N1)
0.83 0.57 0.99 1.01 1.10
Emergy exchange ratio (EER) (F+GI+P2I)/ (N2+GE+P1E) 0.53 0.38 0.39 0.26 0.29
Aerial empower intensity U/Area 2.66E+10 2.18E+10 2.90E+10 3.02E+10 3.17E+10
Use per capita U/Population 1.55E+16 1.24E+16 1.64E+16 1.68E+16 1.74E+16
Emergy money ratio (EMR) U/GDP 8.34E+12 8.08E+12 8.52E+12 8.05E+12 7.75E+12

The authors have declared that no competing interests exist.

[1]
Adams T A, Barton P I, 2011. Combining coal gasification and natural gas reforming for efficient polygeneration. Fuel Processing Technology, 92(3): 639-655.A techno-economic analysis of several process systems to convert coal and natural gas to electricity, methanol, diesel, and gasoline is presented. For these polygeneration systems, a wide range of product portfolios and market conditions are considered, including the implementation of a CO2 emissions tax policy and optional carbon capture and sequestration technology. A new strategy is proposed in which natural gas reforming is used to cool the gasifier, rather than steam generation. Simulations along with economic analyses show that this strategy provides increased energy efficiency and can be the optimal design choice in many market scenarios.

DOI

[2]
Almeida C M V B, Barrella F Aet al., 2007. Emergetic ternary diagrams: Five examples for application in envi-ronmental accounting for decision-making. Journal of Cleaner Production, 15(1): 63-74.The use and the versatility of ternary diagrams for assisting in performing emergy analyses are illustrated by means of five examples taken from the literature, which are presented and discussed. It is shown that emergetic ternary diagram's properties assist the assessment of the system efficiency, its dependence upon renewable and non-renewable inputs and the environmental support for dilution and abatement of process emissions. With the aid of ternary diagrams, details such as the interaction between systems and between systems and the environment are recognized and evaluated. Such a tool for graphical analysis allows a transparent presentation of the results and can serve as an interface between emergy scientists and decision makers, provided the meaning of each line in the diagram is carefully explained and understood.

DOI

[3]
Bastianoni S B, Campbell D, Susani Let al., 2005. The solar transformity of oil and petroleum natural gas. Eco-logical Modelling, 186(2): 212-220.This paper presents an emergy evaluation of the biogeochemical process of petroleum formation. Unlike the previous calculation, in which the transformity of crude oil was back calculated from the relative efficiency of electricity production and factors relating coal to transportation fuels and transportation fuels to crude oil, we analyzed the geochemical process of petroleum formation (naftogenesis) to determine the transformities of oil and natural gas. We assumed that the process of oil and gas production is a steady state process in which all the emergy required is captured in the initial input. For such a system, we can use the mass concentration of the initial input to determine the specific emergy and transformity of the products. We used the maximum photosynthetic yield in Joules of phytoplankton organic matter per Joule of sunlight as the starting point. From this initial assumption, we traced the energy transformations in the oil and gas formation process through photosynthesis, death and decay of the phytoplankton, and diagenesis to kerogen production and from kerogen through catagenesis to petroleum formation. Our results show that both methods converge to similar values for oil ( 54,200 solar emJoules per Joule (sej/J)) and petroleum natural gas (43,500 sej/J) increasing our confidence in the results of past emergy analyses and providing a firm basis for the calculation of transformities for oil and gas derivatives.

DOI

[4]
Batjargal Z, 1997. Desertification in Mongolia. RALA Report No.200: 107-113.

[5]
BGS, 2016. British Geological Survey. World Mineral Production. (Accessed August, 2016 at

[6]
Brandt-Williams S L, 2001. Handbook of emergy evaluation: A compendium of data for emergy computation issued in a series of Folios. Folio# 4. Emergy of Florida Agriculture. University of Florida, Gainesville, 40pp.Emergy spelled with an “m ” is a universal measure of real wealth of the work of nature and society made on a common basis. Calculations of emergy production and storage provide a basis for making choices about environment and economy following the general public policy to maximize real wealth, production and use (maximum empower). To aid evaluations, this series of folios provides data on emergy contents and the computations on which they were based. A series of Fo-lios are to be issued. Folio #1: Introduction and Global Budget, introduces the series and evaluates the empower of the geobiosphere. Folio # 2: Emergy of Global Processes presents calculations and transformities for global processes of atmospheric, geologic and oceanic systems. There may be folios by many authors, who take the initiative to make new calcu-

[7]
Brown M T, 2003. Resource imperialism: Emergy perspectives on sustainability, balancing the welfare of nations and international trade. In: Ulgiati S ed. Advances in Energy Studies. Proceeding of the conference held in Porto Venere, Italy, October 2002. University of Siena, Italy.

[8]
Brown M T, Campbell D E, De Vilbiss Cet al., 2016. The geobiosphere emergy baseline: A synthesis. Ecological Modelling, 339: 92-95.The concept of emergy defined as the available energy (or exergy) of one form used up directly and indirectly to produce an item or action (Odum, Environmental Accounting Emergy and Environmental Decision Making, John Wiley & Sons, Inc., 1996) requires the specification of a uniform solar equivalent exergy reference, or geobiosphere emergy baseline (GEB). Three primary exergy sources of different origins interact to drive processes within the geobiosphere. Each of these sources are expressed in solar equivalent exergy from which, all other forms of energy can be computed, so that they may be expressed as emergy in units of solar emjoules. If emergy practitioners reference their work to a single agreed-upon baseline, then all research products resulting from the application of the emergy approach will be inherently consistent and valid comparisons can then be made easily. In this paper, we synthesize information from three new calculation procedures of the emergy baseline for the geobiosphere and propose a unified solution.

DOI

[9]
Brown M T, Cohen M J, Sweeney S, 2009. Predicting national sustainability: The convergence of energetic, economic and environmental realities. Ecological Modelling, 220(23): 3424-3438.The onstraint space dictated by energetic, economic and environmental realities on scenarios for future organization of humanity and nature is explored from the perspective of the energy and resources driving economies. Net energy of energy sources is presented as an index (Emergy Yield Ratio; EYR) that must be evaluated for energy sources to better understand their potential contributions to society, but more important, as an indicator of the changes needed in the future if lower net yielding sources are to be relied upon. An aggregate EYR was calculated for the USA economy and shown to have decreased by 38% since 1950, from 11/1 to 6.8/1. Several measures of efficiency at the scale of national economies are explored and the data suggest that the most efficient economies are also the most energetically intense (as measured by empower intensity). An index of environmental loading is suggested as a measure to evaluate environmental efficacy. An obvious outcome is that the smallest most energetically intense countries have the highest environmental loads, and those with large land area and/or continental shelves have the lowest ratios. An Emergy Sustainability Index (EmSI) is defined, computed for countries, and proposed as a multi-dimensional measure of long-term sustainability. The most sustainable economies are those with the highest EYR and lowest environmental loads.

DOI

[10]
Brown M T, Ulgiati S, 1997. Emergy-based indices and ratios to evaluate sustainability: Monitoring economies and technology toward environmentally sound innovation. Ecological Engineering, 9(1/2): 51-69.This paper provides a reference set of indices based on emergy, for the evaluation of ecotechnological processes and whole economies. Indices of emergy yield ratio (EYR), environmental loading ratio (ELR), and emergy investment ratio (EIR), among others, are stressed, and a new index the emergy sustainability index (ESI) is defined. The emergy indices for a given system are shown to be functions of renewable, nonrenewable and purchased emergy inflows. Indices are given for several ecological engineering activities including oil spill restoration, land reclamation and wastewater recycle through wetlands, several production systems, and several national economies to demonstrate their usefulness. Ecological engineering involves both natural and engineered systems and the flows of renewable and nonrenewable energy, the appropriate amounts of which are important to determine if they are to result in sustainable use of resources. The sustainability index can be used to evaluate appropriate nonrenewable investments in eco-technology to maximize their performance. Sustainability of economies is shown to be a function of the net yield of the economy and its `load' on the environment. The trends of these indices can be monitored over time and provide useful information about the dynamics of economic systems within the carrying capacity of the environment in which they develop. When a particular sector or production process is focused on, instead of a national economy, emergy based indices can provide insights into the thermodynamic efficiency of the process, the quality of its output, and the interaction between the process and its surrounding environment.

DOI

[11]
Brown M T, Ulgiati S, 1999. Emergy evaluation of the biosphere and natural capital. Ambio, 28(6): 486-493.The measure of value called emergy is used to evaluate the flows of energy and resources that sustain the biosphere including the economy of humans. A donor system of value based on solar emergy required to produce things Is suggested as the only means of reversing the logic trap inherent in economic valuation, which suggests that value stems only from utilization by humans. The stocks of natural capital and flows of environmental resources are evaluated in emergy and related to Global World Product. Several emergy indices are introduced as a means of evaluating sustainability of economies and processes. The total emergy flux of the biosphere is composed of 32% renewable flows of sunlight, tidal momentum and deep heat (it was 68% in 1950), and 68% slowly-renewable and nonrenewable flows. An index of environmental loading on the biosphere is shown to have increased about 4 times since 1950, while an index of global sustainability suggests that overall, sustainability of the global economy has precipitously declined.

DOI

[12]
Brown M T, Ulgiati S, 2011. Understanding the global economic crisis: A biophysical perspective. Ecological Modelling 223: 4-13.The recent economic meltdown worldwide has reinforced our understanding of the effects of decoupling economic growth, monetary policy, and resources. Concern for peak oil and suggestions that it may have contributed to the global economic woes as well as over concern for the banking fraud may be adding confusion over the underlying causes and sending a misleading message to the public and ultimately to policy makers. Viewing the economy as simply a circulation of money that can be manipulated to increase spending and therefore consume our way out of the current economic situation, is courting disaster by deluding the public that the solution lies in simple adjustments to the current monetary system. Similarly, emphasizing that energy is the problem and that the solution can be found with another energy source is probably counterproductive in the short run and may be disastrous in the long run. The recent nuclear accident in Japan seriously calls into question increased dependence on nuclear energy and renewable energy sources, in the majority, have low net yields and are unevenly distributed worldwide. In this paper we frame the economic system as a subsystem of the larger more encompassing geobiosphere and suggest that within this context, neoclassical economics is unlikely to provide sufficient explanation of the recent economic melt-down. From a biophysical perspective, increasing the amount or speed of money circulation as well as extracting more energy from whatever source is available will only compound the problems and relying on growth as the solution to what ails the global economy is not a desirable nor a tenable solution.

DOI

[13]
Brown M T, Ulgiati S, 2016. Emergy accounting of global renewable sources. Ecological Modelling. doi: 10.1016/j.ecolmodel.2016.03.010.

[14]
De Vilbiss C, Brown M T, 2015. New method to compute the emergy of crustal minerals. Ecological Modelling. doi: 10.1016/j.ecolmodel.2015.04.007.Mineral transformity can be characterized using either chemical exergy or Gibb's formation energy. Both calculations use the same mixing term which depends on average crustal abundance of the mineral. Also it's possible to account mineral emergy using either total free energy (or total chemical exergy) or by accounting only the mixing exergy. Four herein proposed methods yield a wide range of specific emergies for each of the prominent mineral/metal inputs to economies. We conclude that the exergy of concentration (mixing exergy) best represents that which is destroyed in mining/extraction activities and that using Gibb's transformities better suit the emergy method due to chemical exergies being positive or negative depending on the mineral. The emergy accounting of minerals should utilize Gibb's transformities and account only the emergy of a mineral's mixing exergy because this represents the natural capital that is irrevocably destroyed in mineral harvesting.

DOI

[15]
De Vilbiss C, Brown M T, 2016. Emergy research support for supply chains, Final Technical Report on Contract EP-11-C-000197. The Center for Environmental Policy, University of Florida, Gainesville, FL.

[16]
CIA, 2016. The Central Intellecence Agency. The World Factbook 2013-14. Washington, DC: Central Intelligence Agency, 2013. Accessed August, 2016 at: .

[17]
ECSP, 2017. In Mongolia,Climate Change and Mining Boom Threaten National Identity. NewSecurityBeat. En-vironmental Change and Security Program, Woodrow Wilson International Center for Scholars. Accesed March, 2017 at: .

[18]
EIA, 2016. United States Energy Information Agency. International data portal. (accessed August 2016 at .

[19]
FAO Aquastat, 2016. Food and Agriculture Organization Aquastat database (accessed August, 2016 at .

[20]
FAOstat, 2016. Food and Agricultural Organization. Agricultural data portal. (accessed August 2016 at .

[21]
IRENA, 2016. International Renewable Energy Agency, Global Atlas for Renewable Energy. (accessed August 2016 at .

[22]
ISRIC, 2016. International Soil Reference and Information Centre, World Soil Information data portal. (Accessed August 2016 at .

[23]
John R, Chen J, Lu Net al., 2009. Land cover/land use change in semi-arid Inner Mongolia: 1992-2004. Envi-ronmental Research Letters, 4(4).

[24]
MSY, 2009. Mongolian Statistical Yearbook. Ulaanbaatar, National Statistical Office of Mongolia.

[25]
Mungunzul E, Chang T, 2016. Foreign Direct Investment in the Mongolian Mining Sector. International Journal of u- and e-Service, Science and Technology, 9(3): 249-258.Attraction to foreign investment in Mongolia’s economy has become a key factor in Mongolia’s development. Mongolia has a small population, especially in comparison to some other “tiger” economies. There is a large population emerging into a wealthier class, which is expected to increase consumption. Mongolia is geographically the 19th largest country in the world and has many natural resources. This paper diagnoses the Mongolian mining sector and identifies its problems, constraints, growth, and increased contributions to the national economy. The paper also addresses FDI trends in the mining sector in Mongolia in comparison to FDI in mining in developing countries and their processes, advantages, and government policies.

DOI

[26]
NEAD, 2016. The National Environmental Accounting Database. Cneter for ENvironmental Policy, University of Florida (accessed August 2016 at .

[27]
NERL, 2016. National Renewable Energy Laboratory. Wind energy resource atlas of Mongolia. (accessed August 2016 at .

[28]
Odum H T, 1996. Environmental Accounting: Emergy and Environmental Decision Making. New York: John Wiley & Sons Inc.Goodnow JJ.

DOI

[29]
Odum H T, 2000. Handbook of Emergy Evaluation. Folio#2. Emergy of Global Processes. Florida, Center for Environmental Policy. University of Florida, Gainesville.

[30]
Odum H T, Brown M T, Brandt-Williams S, 2000. Handbook of Emergy Evaluation. Folio#2. Introduction and Global Budget. Florida, Center for Environmental Policy. University of Florida, Gainesville.

[31]
OEC, 2016. AJG Simoes, CA Hidalgo. The Economic Complexity Observatory: An Analytical Tool for Under-standing the Dynamics of Economic Development. Accessed August 2016 at .

[32]
Palutikof J P, Davies T D, Kelly P M, 1984. A data bank of wind speed records for the British Isles and off-shore waters. In: Musgrove P ed. Wind Energy Conversion. Cambridge: Cambridge University Press, 414-425.

[33]
Rótolo G C, Rydberg T, Lieblein Get al., 2007. Emergy evaluation of grazing cattle in Argentina's Pampas. Agriculture, Ecosystems & Environment, 119(3): 383-395.Argentina has a tradition of grazing livestock and the Pampas region produces 61% of the total beef cattle, with more than 80% allocated to internal consumption. Potential for expanding exports has created incentives for increasing production, yet national decisions should include an assessment of natural resources and environmental impacts of the grazing system. The aim of this study was to evaluate the complete system of grazing cattle in Argentina's Pampas in an environmental and economic context. Emergy analysis is used to assess the potential for long-term, sustainable cattle production including indicators of performance and environmental sustainability, with focus on all sources of input energy and the energy value of outputs. Rainfall contributes 61% of the total emergy to the grazing system. Natural pasture depends most highly on local renewable resources (85%) and less than 4% on purchased inputs. In contrast, sowed pasture and maize are 41 and 35% dependent on purchased inputs. Results showed the grazing system to be environmentally sustainable with a low impact on the environment. Yet specific subsystems where grazing cattle depend for part of the cycle on improved sowed pasture or on maize have a relatively high dependency on external inputs and moderate use of local non-renewable resources. Natural pastures have the highest environmental sustainability and the lowest load on the environment, due to low losses of soil organic matter. Appropriate management strategies are available for grazing livestock systems, yet government regulations need to provide incentives to ensure future production stability and economic returns while minimizing adverse effects on the environment. One method to achieve this is recognizing and rewarding farmers for the emergy contributions of the environment.

DOI

[34]
Tilley D R, 1999. Emergy Basis of Forest Systems. PhD Dissertation, Department of Environmental Engineering Sciences, University of Florida.A major question in natural resource management is how to integrate economic-use activities with the supporting ecosystems to maximize performance of the ecological-economic system. In this dissertation, the natural wealth of forested systems of three different sizes was evaluated with emergy: two watersheds of the Southern Appalachians, Macon County (N.C.), and North Carolina. Emergy is the total amount of energy of one form that was required directly and indirectly to make another form of energy. Values are reported as emdollars (Em$) which represent the economic activity resulting from resource use. Benefits provided by forested watersheds were quantified based on emergy required to develop and maintain each service or product. Total wealth contributed by the multiple-use Wine Spring Creek (WSC) watershed was 4300 Em$/ha/y, and was divided among scientific research (3450 Em$/ha/y), water yield (2060 Em$/ha/y), recreation (1880 Em$/ha), and timber (1440 Em$/ha/y). In the 1990's, timber accounted for 3% of world emergy use, 1% in the United States, 9% in North Carolina, 14% in Macon County, and 8% in the WSC watershed. Forest ecosystems captured 53% of environmental emergy in North Carolina, 81% in Macon County, and 100% in the WSC watershed. The importance of forest ecosystems to the U.S. economy were evaluated based on emergy flows of the U.S. forest products industry and international trade of forest products in North America. In 1993, the U.S. had an annual trade surplus in forest products worth 63 billion Em$.Simple models were developed to explore the temporal and spatial dynamics of emergy and transformity in forested watersheds. Transformity is the ratio of emergy to energy; it measures position in the energy hierarchy of energy forms. Temporally, transformity and emergy lagged energy levels in reaching steady-state. Spatially, emergy from mountain uplands converged to the stream network, making water and its carved basin locations of high empower density. A model, MULTIBEN, evaluated forest empower of multiple benefits given various combinations of economic investment in recreation and timbering. Maximum empower was found at an intermediate level of economic investment, suggesting that an optimum intensity of forest development exists.

[35]
Tilley D R, Agostinho F, Campbell Eet al., 2012. The ISAER transformity database. International Society for Advancement of Emergy Research. Available at .

[36]
Trading Economics, 2017. United States Balance of Trade 1950-2017. Accessed February, 2017 at .

[37]
UN ComTrade, 2016. United Nations Stastics Division trade data portal (accessed August 2016 at .

[38]
UNEP, 2016. United Nations Environmental Program, DEWA/GRID-Geneva. Global Resource Information Da-tabase (Accessed August, 2016 at .

[39]
Vernooy R, 2011. How Mongolian Herders Are Transforming Nomadic Pastoralism. The Solutions Journal, 2(5): 82-87. Accessed August, 2016 at ().

[40]
Worden R L, Savada A M, 1989. Mongolia: A Country Study. Gov. Publishing Office, for the Library of Congress, Washington D.C.

[41]
World Bank, 2016. World Bank Data portal-agricultural land. (accessed August, 2016 at .

[42]
WWO (WorldWeatherOnline). 2016. Accessed August 2016 at

[43]
Yang Z F, Jiang M M, Chen Bet al., 2010. Solar emergy evaluation for Chinese economy. Energy Policy, 38(2): 875-886.A unified evaluation integrating various forms of energy sources and natural resources, products and services, and imports and exports is carried out systematically at the national scale for the booming Chinese economy 1978–2005, based on the ecological measure of solar emergy. The development of the economy is shown heavily dependent on the consumption of nonrenewable natural resources. Of the total resources use, the indigenous resources contribute the most, along with the increasing imports of nonrenewable resources. The development of the Chinese economy is characterized with the recovery stage during 1978–1981, transformation stage during 1981–1991, steady growth stage during 1991–2000, and accelerated increase stage after 2000, with specific distinctive systems indications.

DOI

[44]
MSY, 1995-2012. Mongolia Statistical Yearbook. (accessed October, 2016 at .

[45]
Zhu L, Li H, Chen Jet al., 2012. Emergy-based sustainability assessment of Inner Mongolia. Journal of Geo-graphical Sciences, 22(5): 843-858.

Outlines

/