Orginal Article

Reconstruction of cropland spatial patterns and its spatiotemporal changes over the 20th century on the Songnen Plain, Northeast China

  • ZHANG Lijuan , 1 ,
  • JIANG Lanqi ,
  • ZHANG Xuezhen , 2, 3
Expand
  • 1. Key Laboratory of Land Surface Pattern and Simulation, Institute of Geographic Sciences and Natural Resources Research, CAS, Beijing 100101, China
  • 2. Key Laboratory of Land Surface Pattern and Simulation, Institute of Geographic Sciences and Natural Resources Research, CAS, Beijing 100101, China
  • 3. Jiangsu Collaborative Innovation Center for Climate Change, Nanjing 210093, China

Author: Zhang Lijuan (1965-), PhD and Professor, specialized in studies of changes in land use and land cover. E-mail:

*Corresponding author: Zhang Xuezhen (1981-), PhD and Associate Professor, E-mail:

Received date: 2016-10-31

  Accepted date: 2016-12-30

  Online published: 2017-09-06

Supported by

National Natural Science Foundation of China, No.42171217, No.41471171

Doctorial Innovation Fund, No.HSDBSCX 2015-12

Copyright

Journal of Geographical Sciences, All Rights Reserved

Abstract

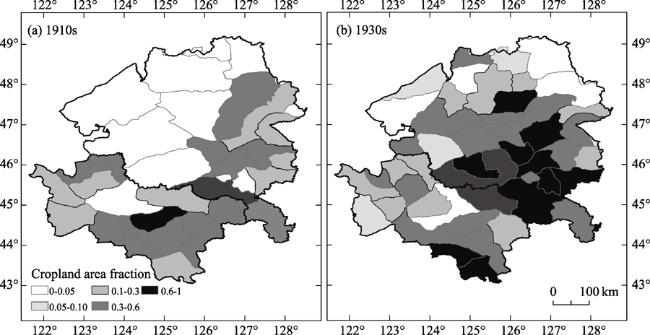
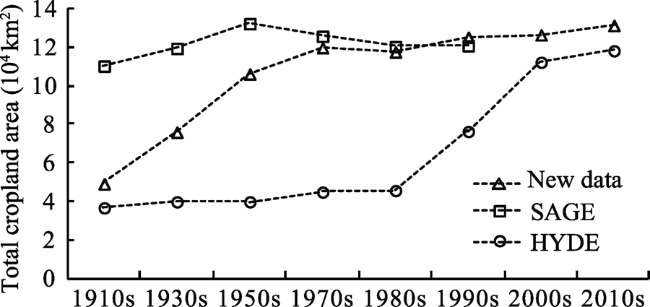
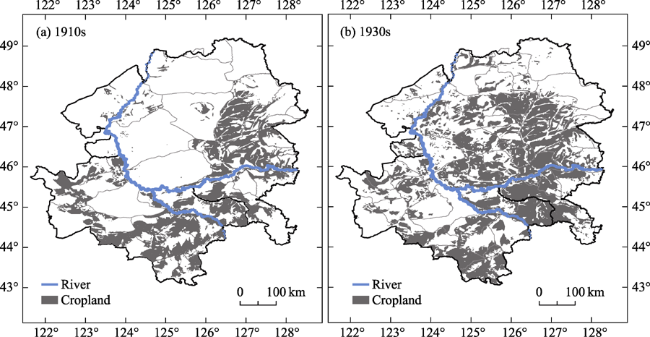
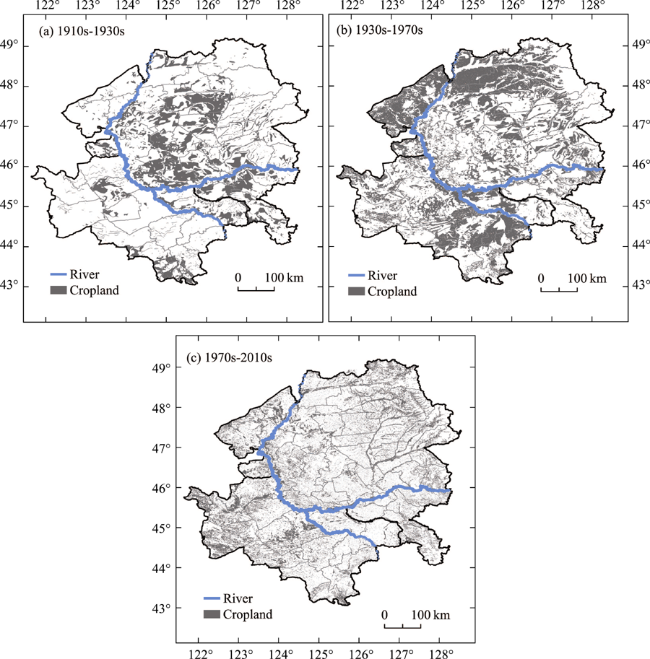
We initially estimated the cropland area at county level using local historical documents for the Songnen Plain (SNP) in the 1910s and 1930s. We then allocated this cropland area to grid cells with a size of 1 km × 1 km, using a range of cultivation possibilities from high to low; this was based on topography and minimum distances to rivers, settlements, and traffic lines. Cropland areas for the 1950s were obtained from the Land Use Map of Northeast China, and map vectorization was performed with ArcGIS technology. Cropland areas for the 1970s, 1980s, 1990s, 2000s, and 2010s were retrieved from Landsat images. We found that the cropland areas were 4.92 × 10⁴ km2 and 7.60 × 10⁴ km2, accounting for 22.8% and 35.2% of the total area of the SNP in the 1910s and 1930s, respectively, which increased to 13.14 × 10⁴ km2, accounting for 60.9% in the 2010s. The cropland increased at a rate of 1.18 × 10⁴ km2 per decade from the 1910s to 1970s while it was merely 0.285 × 10⁴ km2 per decade from the 1970s to 2010s. From the 1910s to 1930s, new cultivation mainly occurred in the central SNP while, from the 1930s to 1970s, it was mainly over the western and northern parts. This spatially explicit reconstruction could be offered as primary data for studying the effects of changes in human-induced land cover based on climate change over the last century.

Cite this article

ZHANG Lijuan , JIANG Lanqi , ZHANG Xuezhen . Reconstruction of cropland spatial patterns and its spatiotemporal changes over the 20th century on the Songnen Plain, Northeast China[J]. Journal of Geographical Sciences, 2017 , 27(10) : 1209 -1226 . DOI: 10.1007/s11442-017-1431-3

1 Introduction

In pursuit of human provision throughout history, natural vegetation such as woodland, grassland, and swamps, has been converted into anthropogenic cropland. Due to agricultural development, land-cover changes (LCCs) have modified the surface energy balance, the Bowen ratio, and wind speed, and have thus had important climatic implications (Notaro et al., 2006; Pielke et al., 2007; Anderson-Teixeira et al., 2012). LCCs have therefore been broadly accepted as one of the driving forces of climate change (Pielke and Niyogi, 2009; Mahmood et al., 2010; Dirmeyer et al., 2010). Because of the large spatial heterogeneity of the predecessors of cropland, the climatic effects of agriculture-induced LCCs vary between regions; they may be positive in some regions and negative in others. To comprehensively understand regional climate change, it is necessary to reveal changes in anthropogenic cropland that indicate human modifications to the land surface.
Relevant studies have reconstructed the historical spatial patterns of cropland for agricultural regions in China (Lin et al., 2009; He et al., 2011; Feng et al., 2014; Jin et al., 2015; Ye et al., 2009; Cao et al., 2013; 2014; Li et al., 2012; 2015; Luo et al., 2014; Zhang et al., 2015; Liu et al., 2010; Wang et al., 2015; Li et al., 2010; Pan et al., 2015). One method is based on using the reclamation rate index to reconstruct the spatial distribution of farmland. For example, Ye et al. (2009) used the reclamation rate to reconstruct the spatial distribution of farmland in Northeast China for the previous 300 years with 50-100 year intervals as a county unit. Jin et al. (2015) reconstructed China’s provincial farmland dataset for the last 300 years (1661-1985) by applying factor correction, citing replacement, linear interpolation, cohesion adjustment, etc. Earlier, Lin et al. (2009) designed an empirical model to reconstruct the spatial distribution pattern of cropland in the traditionally cultivated regions of China in 1820 (at 60 km × 60 km). He et al. (2011) similarly reconstructed the spatial distribution pattern of cropland during the Northern Song Dynasty using the method of Lin et al. (2009). In the same way, Feng et al. (2014) also developed a separate method to reconstruct the cropland distribution of China in 1913, 1933, 1950, 1970, 1990, and 2000 at a spatial resolution of 10 km × 10 km. Furthermore, to the best of our knowledge, there are two global datasets. One was created by the Center for Sustainability and the Global Environment (SAGE), University of Wisconsin (hereafter, called the SAGE dataset; Ramankutty et al., 1999; 2010). The other is the History Database of the Global Environment (HYDE) created by the Netherlands Environmental Assessment Agency (hereafter, called the HYDE dataset; Goldewijk et al., 2001; 2011). The SAGE dataset was created through the following approach. National-level cropland areas from inventories in 1992 were used to calibrate the satellite-based discovered dataset to obtain the spatially explicit and accurately quantitative cropland area; then, keeping the relative spatial weights unchanged, the historical national-level cropland area was allocated into grid cells (see Ramankutty et al., 1999, for details). The latest HYDE dataset (v3.1) used the contemporary population and per capita cropland area for the period pre-1960 to estimate national cropland area, and it then allocated the estimated national cropland area into grid cells of 5 minutes (latitude/longitude). The national cropland area was allocated to grid cells using a mix of two weighting maps: a current map, which was constructed from a satellite map of AD 2000 (Klein Goldewijk and van Drecht, 2006), and a historical map, which was constructed based on six rules by considering the effects of population density, temperature, land suitability for crops, distance to water, surface slope, and city development on agricultural activities (for details, see Klein Goldewijk et al., 2011).
After the 1970s, with the development of remote sensing interpretation technology, it was possible to interpret cropland spatial patterns based on remote sensing images. However, using the arable land reclamation index to reconstruct the spatial distribution of cultivated land has its limitations for precisely reproducing the spatial change in arable land through history. Therefore, too much attention has been paid to the pre-1970 spatial patterns of cropland reconstruction. Pan et al. (2015) and Li et al. (2010) used integrated suitability indices analysis based on modern land-use patterns to rebuild cropland spatial position patterns in Jiangsu Province (100 m × 100 m) and Yunnan Province (100 m × 100 m) in 1671 and 1827. However, until now, few studies have focused on an extended historical period sequence pattern that is based on the spatial distribution of cultivated land.
Songnen Plain (SNP) forms the main part of the Northeast China Plain, which is a typical agricultural area of China. Since the 19th century, the SNP has been extensively developed amid high levels of immigration (Li and Shi, 1987), and with the impact of large-scale land reclamation in the 1950s, extensive areas of Northeast China were converted to arable use. The area of cropland almost increased exponentially by the year. Northeast China is a typical area for studies on the influence of human activities on the change in land cover (Ye et al., 2009). There are three datasets (HYED, SAGE, and Ye et al., 2009) that describe the spatial distribution of cropland in the SNP. However, the SAGE dataset is largely different from local historical records (Li et al., 2010), and the HYDE dataset for Northeast China still contains great uncertainties because of lack of reliability in the estimated national total cropland area through the use of a constant per capita cropland area (Li et al., 2010; He et al., 2013). Ye et al. (2009) used the proportion of cultivated land area as an index to reconstruct the spatial distribution of cropland; however, there is a limitation in the spatial pattern of cropland change in the SNP over an extended period of time. This paper reconstructs the spatial distribution of cultivated land for the SNP in the 1910s, 1930s, 1950s, 1970s, 1990s, and 2010s. Furthermore, it analyzes cropland spatial pattern changes over an extended time scale using methods involving statistical and spatial analysis. The results not only provide a quantitative basis of the influence of human activities on land-use changes in Northeast China, but also provide models and references for research on long-term sequence cropland spatial patterns.

2 Study area

The study area, lying between 42°30′-51°20′N and 121°40′-128°30′E and located in the Northeast China Plain, covers an area of about 23.75 × 10⁴ km2 (approximately 2.47% of China’s total; Figure 1). The SNP is an alluvial plain, which is drained by the Songhua River and Nenjiang River flowing down from the Tianchi Lake of the Changbai Mountains and the Greater Higgnan Mountains. The study area is mostly flat with a few hills and an elevation of about 120-300 m (Zeng et al., 2010). Soils are fertile with black soil, meadow soil, and chernozem widely distributed in this region; wetlands and lakes are commonly found in the central plain. The plain supports 559 million ha of arable land, including soybeans, maize, wheat, beets, and potatoes, and it is an important grain commodity base for China.
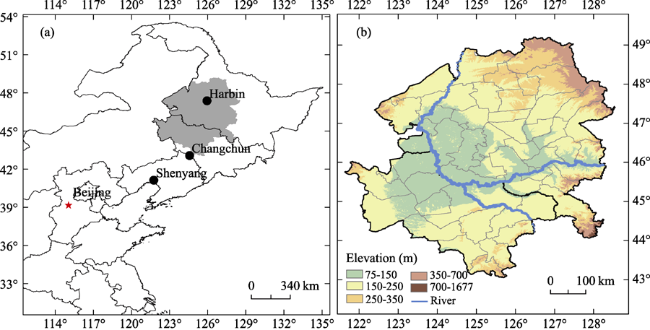
Figure 1 Location of the Songnen Plain (a) and the distribution of counties (b) in Northeast China
The SNP has a temperate continental monsoon climate, characterized by significant winds and four seasons with a hot, rainy summer and a cold, dry winter. The average monthly temperature is about -16 to -26℃ in January and precipitation can reach 10 to 24 mm in winter.

3 Data sources

3.1 Cropland data

This study used cropland data from multiple sources. For the 1910s, the cropland area data were compiled from a Survey Report of Manchuria (LPA, 2008) and the General Conditions of Manchuria-Mongolia (CSMR, 1923). The Survey Report of Manchuria was based on a field survey that was conducted by the Survey Department of the South Manchuria Railway Company between 1909 and 1925. The fifth volume of this report records the conditions of society including the sub-provincial level of the cropland area of Heilongjiang Province and Jilin Province for the 34th year of the Emperor Guangxu (i.e. 1908). The General Conditions of Manchuria-Mongolia, which was published in 1918, records natural resources including sub-provincial levels of cropland area for Heilongjiang and Jilin for the early 20th century. The two sources overlapped and could therefore verify each other.
For the 1930s, the cropland area data were mainly taken from the Survey Report of the Northeast Region in the Republic of China (Xiong, 2009). This field survey was conducted by the Republic of China in 1929 and covered 41 counties in Jilin and 41 counties in Heilongjiang. This report records county-level cropland areas, with some counties having no data. To complement the missing data, we used cropland area records from the History of Agricultural Development in Heilongjiang Province (Xin et al., 1999) and the Gazette of Jilin Province (CCCJP, 1992). One section of the History of Agricultural Development in Heilongjiang Province records natural resources including county-level cropland area for the 1930s. The Gazette of Jilin Province records county-level cropland area in Jilin for the 1930s.
To exhibit the temporal-spatial changes in cropland, the current study also used cropland data for the 1950s and thereafter. For the 1950s, since there were no remote sensing images, the cropland area data were taken from the Land Use Map of Northeast China (1:300,000; Sun et al., 1959). We registered the scanned map to a relative coordinate, and then vectorized the map using ArcGIS technology. For the 1970s, we retrieved the cropland area from Landsat MSS images; for the 1980s, 1990s, 2000s, and 2010s, cropland areas were retrieved from Landsat ETM+ images. The Landsat MSS/ETM+ images underwent manual visual interpretation. All satellite images are available on the USGS Global Visualization Viewer.

3.2 Population and settlement data

The current study also used population data of the early 20th century, which were taken from the Local Gazette of Heilongjiang Province (Wan et al., 1992) and the Local Gazette of Jilin Province (CCCJP, 1992). The Local Gazette of Heilongjiang Province contains population figures for the 39 county-level units in Heilongjiang from the 33rd year of the Emperor Guangxu (i.e. 1907) to the 7th year of the Republic of China (i.e. 1918). The Local Gazette of Jilin Province contains data of the population covering county-level units of Jilin from the 10th year of the Emperor Shunzhi (i.e. 1653) to 1985 including the time slice of 1910.
We also used historical settlement data. For the 1910s (Figure 2a), the spatial distribution of settlements was taken from the eighth volume of the Atlas of Historical Geography (Tan, 1987). For the 1930s (Figure 2b), data were taken from the New Atlas of the Republic of China, which was created by Ding et al. (1934). This atlas contains thematic maps of political units and traffic lines with a scale of 1:200,000 in eastern China and 1:500,000 in western China. The spatial distribution of settlements is included in the thematic map of political units.
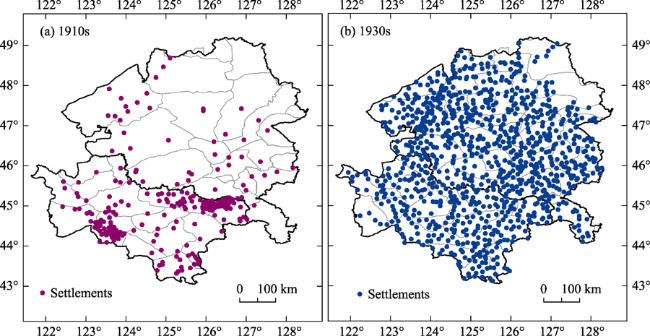
Figure 2 Spatial distribution of settlements in the Songnen Plain, Northeast China in the 1910s (a) and 1930s (b)

3.3 Assistant geographical data

Except for the above-mentioned cropland and population data, the current study also used some geographical data, including maps of forests in Heilongjiang, the spatial distribution of wetlands and lakes for the 1950s, surface elevation data, maps of railways for the 1930s, and the present river systems. The forest map for Heilongjiang exhibits forest types and their spatial distribution for the late 19th century and has a scale of 1:300,000 (Li, 1993). The spatial distribution of wetlands and lakes for the 1950s was taken from the Land Use Map of Northeast China (1:300,000) created by the Department of Economy in the Institute of Geography, Chinese Academy of Sciences (1959). Surface elevation data were taken from the Bureau of Survey and Geoinformation of Heilongjiang Province, which has a spatial resolution of 90 m. The distribution of railways was retrieved from the Political Map during the Period When Northeast China was Japanese-occupied (CCCHP, 1999 see Figure 3a). The distribution of rivers was taken from the National Geomatics Center of China (available at http://nfgis. nsdi.gov.cn/nfgis/chinese/c_xz.htm; Figure 3b).
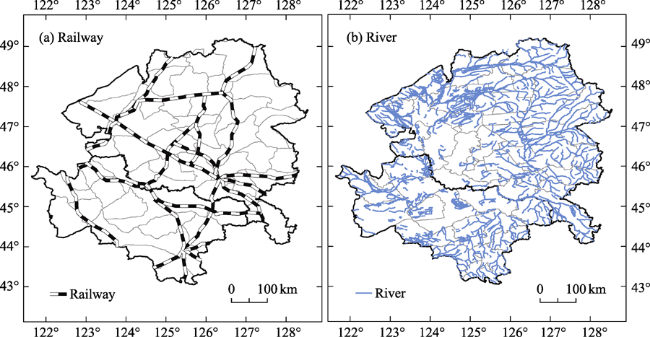
Figure 3 Spatial distribution of railways (a) and rivers (b) in the Songnen Plain, Northeast China in the 1930s

4 Methods

4.1 Method for spatial allocation of cropland for the 1910s and 1930s

To create a spatially explicit cropland dataset for the early 20th century, we estimated the county-level cropland area and subsequently allocated it into spatially explicit grid cells at a size of 1 km × 1 km.
4.1.1 Estimation of county-level unit cropland area
Historical documents generally record cropland area for each county. As the political area changed in the 20th century, it was necessary to locate historical documents based on the distribution of historical and contemporary counties. Figure 4 shows the distribution of counties for the 1910s, 1930s and 1990s, respectively. In the 1910s, there were 34 counties, 20 and 14 of which were governed by Heilongjiang and Jilin, respectively. In the 1930s, there were 49 counties, 32 and 17 of which were governed by Heilongjiang and Jilin, respectively. In the 1990s, there were 51 counties, 35 and 16 of which were governed by Heilongjiang and Jilin, respectively.
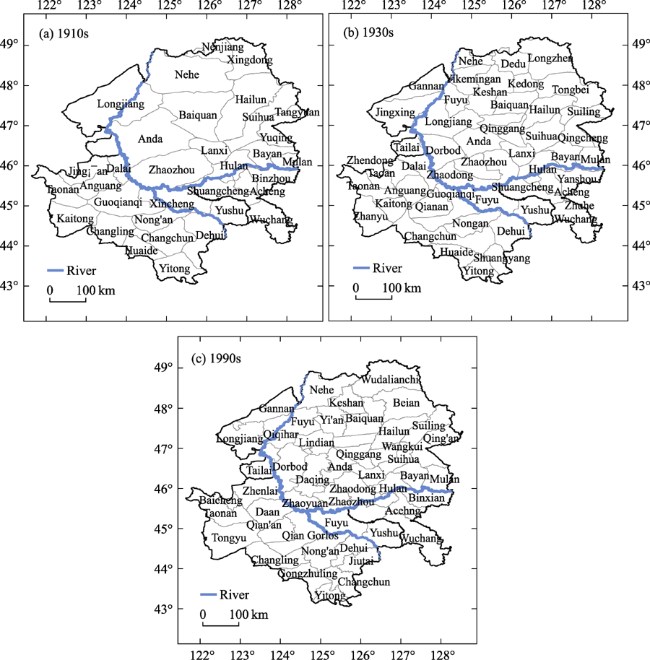
Figure 4 County distribution of the Songnen Plain, Northeast China for the 1910s (a), 1930s (b), and 1990s (c)
The units for measuring cultivated land area differed between historical documents. For the current study, we converted all measurement units into square kilometers (km2) (Zhang et al., 2015).
Farmland data from 28 counties in the 1910s were directly obtained from The Survey Report of Mancuria Railway, which are considered highly credible. The farmland data from four counties were obtained from The General Conditions of Manchuria-Mongolia after correction. Calibration used county as a sample to establish regression equations for both sets of farmland data (The Survey Report of Manchuria Railway and The General Conditions of Manchuria-Mongolia). Calibration equations were established for both Heilongjiang (13 samples) and Jilin (10 samples). There was a high correlation between these two sets of data with explained variances of 99% and 85%, respectively (Table 1).
Table 1 Calibration functions of cropland area for the 1910s in the Songnen Plain, Northeast China
Cropland area from GMM (X) Population (P)
HLJ JL HLJ JL
Calibrated cropland area (Y) Y = X+0.6387 Y = 0.45*X+1044.7 Y = 0.0144*P-78.144 Y = 0.0034*P+1060.1
R2 0.99 0.85 0.84 0.66
Number of samples 13 10 15 10

Note: GMM represents The General Conditions of Manchuria-Mongolia HLJ and JL represent Heilongjiang Province and Jilin Province, respectively.

For those counties without records, we estimated the area of cultivated land according to the population data by establishing regression equations between population and cropland. There was a high correlation between population and arable land, the explained variances of the population data and cropland area in Heilongjiang and Jilin were 84% and 66%, respectively.
For the 1930s, the cropland areas of 47 counties were taken directly from the Survey Report of Northeast Region in the Republic of China. The cropland areas of eight counties in Heilongjiang were taken from the History of Agricultural Development in Heilongjiang Province but with calibration (Table 2). The cropland areas of two counties in Heilongjiang were taken from the Brief History of Heilongjiang Province but with calibration (Table 2). The cropland area of one county in Jilin, which was not recorded by the Survey Report of Northeast Region in Republic of China, was taken from the Gazette of Jilin Province but with calibration (Table 2). These calibrations were performed through regressing the county level of cropland areas from the Survey Report of Northeast Region in the Republic of China to those from the other historical documents mentioned above. As shown in Table 3, there were strong correlations with the explained variance from 91% to 99%.
Table 2 Calibration functions of cropland area for the 1930s in the Songnen Plain, Northeast China
Cropland area from
HAD-HLJ (X)
Cropland area from
BH-HLJ (X)
Cropland area from
GZ-JL (X)
Calibrated cropland area (Y) Y = 0.83*X+3.80 Y =0.846*X-57.69 Y =0.987*X+118.81
R2 0.99 0.92 0.91
Number of samples 49 49 12

Note: HAD-HLJ represents the “History of Agricultural Development in Heilongjiang Province”; BH-HLJ represents the “Brief History of Heilongjiang Province”; GZ-JL represents the “Gazette of Jilin Province”.

Table 3 Total cropland area and cropland area fraction over the Songnen Plain, Northeast China from the 1910s to 2010s
1910s 1930s 1950s 1970s 1980s 1990s 2000s 2010s
Cropland area
(km2)
49176.0 76013.2 106199.6 119883.6 117626.4 125286.7 126520.5 131380.9
Cropland area
fraction (%)
22.78 35.21 49.19 55.52 54.48 58.03 58.60 60.85
4.1.2 Allocation of county-level cropland area into grid cells
To achieve the spatial distribution of county-level cropland, we estimated the cultivation possibility of each 1 km × 1 km pixel within the potential cultivation area. The potential cultivation area refers to the study area excluding forests, wetlands, rivers, lakes, and mountains. In the current study, we assumed that mountain areas with elevations higher than 200 m and a slope greater than 3° were not suitable for crop production (Lin et al., 2009). Following the order of cultivation possibility from high to low, we assigned the cropland area in pixels of 1 km × 1 km. The assignment of cropland stopped when the county cropland area was completed.
The cultivation possibility is quantified as:
$R=\frac{1}{a\times \alpha +b\times \beta +c\times \gamma }$ (1)
where R is the cultivation possibility; α, β, and γ represent human dimension factors, water resource factors, and topography complexity factors, respectively. α is quantified by Eq. (2);
β is indexed as the normalized minimum distance from rivers; and γ is indexed as the
normalized standard deviation of sub-pixel elevation. a, b, and c are coefficients with a sum of 1.
$\alpha =d\times X+e\times Y$ (2)
where X and Y denote settlement (population) factors and traffic line impact factors (only available for the 1930s), respectively. X is the normalized distance from the nearest settlement; Y is the normalized minimum distance from the railway; d and e are coefficients with a sum of 1; particularly, for the 1910s, d is 1 and e is 0, because there were no railways.
Similarly, we calculated that d and e were 0.667 and 0.333, respectively. So, Eq. (2) could be represented as:
$\alpha =0.667\times X+0.333\times Y$ (3)
To determine a, b, c, d, and e, we referred to the previous documents (Zhang et al., 2015).

4.2 Method for retrieval of cropland in the mid-late 20th century

We digitized the Land Use Map of Northeast China (1:300,000; Sun et al., 1959) and converted the vector data to raster data with a resolution of 1 km × 1 km. We used unsupervised classification on the Landsat images for the 1970s, 1980s, 1990s, 2000s, and 2010s to obtain cropland areas at a resolution of 1 km × 1 km. Such retrieved cropland areas were verified through field survey. Among the 400 field survey points, the retrieved 369 points were consistent with the field survey.

5 Results

5.1 County-level cropland area

Figure 5 shows the estimated county-level cropland area for the SNP. There were 4.92 × 10⁴ and 7.60 × 10⁴ km2 of cropland accounting for 22.8% and 35.2% of the total area of the SNP in the 1910s and 1930s, respectively. Our estimations were close to those of Ye et al. (2009; 2011), who estimated 25.6% and 36.5% of the total area of the SNP in the 1910s and 1930s, respectively. The estimated county-level cropland area illustrates that agricultural development in the early 20th century mainly occurred in the eastern part of the SNP. From the 1910s to 1930s, agricultural development extended generally westward.
Figure 5 County-level cropland area fraction under county administration in the Songnen Plain, Northeast China in the 1910s (a) and 1930s (b)
Table 3 shows changes in total cropland area in the SNP from the 1910s to 2010s; there was an obvious increase (Figure 6). The total cropland area was about 4.92 × 10⁴ km2, or 22.8% of the total area of the SNP in the 1910s; while it reached 12.65 × 10⁴ km2 in the 2000s and 13.14 × 10⁴ km2 in the 2010s, or 58.6% and 60.9% of the total area of the SNP, respectively. The total cropland area increased by about 1.8-fold with a rate of 0.82 × 10⁴ km2 per decade from the 1910s to 2010s. However, the increase did not last throughout the 20th century. The increasing rate in the first half of the 20th century was much higher than that of the second half. The cropland area increased from about 4.92 × 10⁴ km2 in the 1910s to 12.0 × 10⁴ km2 in the 1970s at a rate of 1.18 × 10⁴ km2 per decade; while the rate of increase from the 1970s to 2010s was merely 0.285 × 10⁴ km2 per decade.
Figure 6 Total cropland area in the Songnen Plain, Northeast China from the 1910s to 2010s

5.2 Spatially explicit distribution of cropland

Figure 7 illustrates the reconstructed spatially explicit cropland in the 1910s and 1930s. We found that agricultural development in the 1910s mostly occurred in the eastern SNP while the other areas were less developed. The cropland area fractions ranged from 31.34% in Binxian county to 65.89% in Wangkui county located in the eastern part of the region (including Wangkui, Bayan, Yushu, Hulan, Shuangcheng, and Binxian counties), while the maximum cropland fraction was only 28.64% in Zhenlai county in the west. Such a distribution pattern is consistent with that of historical immigration. It was reported that in the late Qing Dynasty, immigrants moved northward to the SNP and first settled and developed along the Songhua River because of the rich soil and plentiful water resources (Xu, 1985).
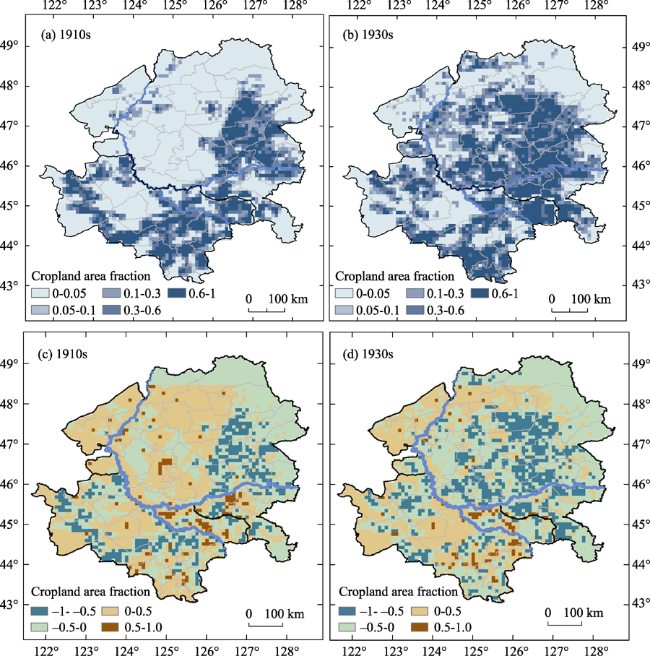
Figure 7 Reconstructed cropland distribution with a pixel size of 1 × 1 km in the 1910s (a) and 1930s (b) in the Songnen Plain, Northeast China
Up to the 1930s, the cropland area increased extensively. In the eastern SNP, cultivation was enhanced. It is estimated that the maximum cropland fraction reached 80.45% in Yushu county. Meanwhile, agricultural development occurred largely within the reach of the Nenjiang River and the central part of the SNP. There was a maximum cropland fraction of 63.9% in Zhaozhou county. Such an increase in cropland fraction was consistent with immigration across the Nenjiang River from the east to the west (Xu, 1985). However, up to the 1930s, little immigration occurred in the northern and western parts of the SNP (Xu, 1985); therefore, there was still little cropland in these areas.
Figure 8 shows pixel-based cropland expansion in the SNP over the last century. From the 1910s to 1930s, newly developed cropland mainly occurred in the central SNP. The largest increase in cropland fraction, from 0.06% to 63.90%, occurred in Zhaozhou county in the central SNP. The second largest increase from 0.02% to 54.00% was in Daqing county, also located in the central SNP. From the 1930s to 1970s, new cropland was mainly established in the northern and southeastern SNP. In the north, the largest increase in cropland fraction, from 0.28% to 10.18%, occurred in Keshan county. In the south, the largest increase in cropland fraction from 1.21% to 7.30% occurred in Yitong county. In total, over the last century, the most extensive increase in cropland occurred in the northwestern SNP. The cropland fraction increased from 1.74% to 61.46%, from 14.46% to 72.71%, and from 41.23% to 77.96%, in Lindian, Yi’an, and Qiqihar counties, respectively. From the 1910s to 1970s, the increasing rate of cropland fraction at county level ranged from 0.44% to 14.11% per decade. The high rates mostly occurred in the central-northern SNP and the largest rate of 14.11% per decade occurred in Keshan county. From the 1970s to 2010s, the highest rate of increase at the county level was only 5.61% in Taonan county, western SNP.
Figure 8 Cropland expansion with a pixel size of 1 km × 1 km in the Songnen Plain, Northeast China from the 1910s to 1930s (a), from the 1930s to 1970s (b), and from the 1970s to 2010s (c)

6 Discussion

(1) This spatially explicit reconstruction of cropland was based on essential local historical documents and an estimation of the possibility of local cultivation after considering multiple factors. This reconstruction not only confirmed the county-level estimations from Ye et al. (2009), but also presented a high-resolution grid dataset. This dataset could be directly offered as primary data to study the effects of human-induced LCCs on land surface heat/moisture flux and thus on regional climate change over the last century.
(2) This spatially explicit reconstruction of cropland demonstrated that HYDE and SAGE datasets had a low ability to capture temporal changes and spatial patterns of regional cropland before the age of satellites. As mentioned above, the HYDE and SAGE datasets
provided spatially explicit global cropland data. Figure 6 shows the total cropland area in the SNP throughout the 20th century. We found the HYDE dataset presented a small low bias of cropland area compared with our estimations for the 1910s and 2010s. The underestimations of the HYDE data were about 1.0 × 10⁴ km2 in the 1910s and 1.2 × 10⁴ km2 in the 2010s. However, this dataset did not represent the characteristics of the increase in cropland area from the 1910s to 2010s; it presented a small rate of increase before the 1970s and a high rate of increase after the 1970s. Such a pattern is the reverse to that suggested by local historical-document-based estimations, which present a high rate of increase before the 1970s and a low rate of increase after the 1970s. Because of such a reversal, the underestimation of the HYDE dataset reached a peak in the 1970s. The estimated cropland area was about 4.2 × 10⁴ km2 in the HYDE dataset, while the local historical-document-based estimation was about 12 × 104 km2 in the 1970s.
Figure 9 illustrates the pixel-based estimation of cropland area fraction of the HYDE dataset in the 1910s and 1930s. The HYDE dataset revealed large areas of cropland in the east and south, and little cropland in the west and north. Such a spatial distribution is similar to our estimation shown in Figure 7. However, we found that in the main body of agricultural development, the cropland fractions of the HYDE data were mostly lower than our estimations. Moreover, there were more pixels underestimated in the 1930s than in the 1910s. This was because the underestimation of total cropland area in the 1930s was much larger than that in the 1910s (Figure 6).
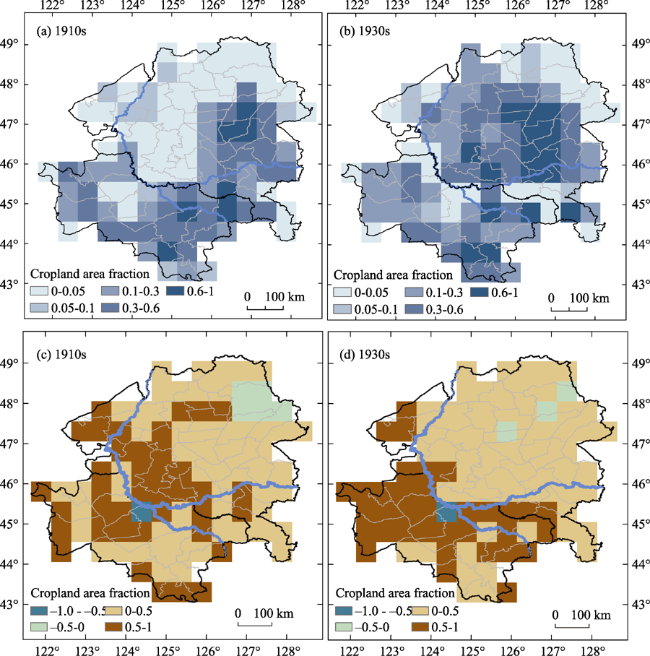
Figure 9 HYDE-reconstructed cropland area fraction (a, b) and its differences compared with the new estimations of this study (c, d) at a cell size of 5 minutes × 5 minutes in the 1910s (a, c) and 1930s (b, d) in the Songnen Plain, Northeast China
The SAGE dataset presented generally consistent results in cropland area using satellite-based estimations in the 1980s and 1990s (Figure 10). However, the SAGE dataset presented a much higher estimation in the 1910s; it estimated the cropland area to be about 11.0 × 10⁴ km2 while historical-document-based estimation was only about 4.92 × 10⁴ km2. Due to overestimation in the 1910s, the SAGE dataset did not reveal the high rate of increase in cropland in the 20th century. The SAGE data also showed a more extensive cropland area fraction over the SNP than the historical-document-based estimation in the 1910s and 1930s.
Figure 10 SAGE-reconstructed cropland area fraction (a, b) and its differences with the new estimations of the current study (c, d) at a cell size of 0.5°×0.5° in the 1910s (a, c) and 1930s (b, d) in the Songnen Plain, Northeast China
(3) The SNP’s cropland area has increased notably for nearly a century. With the 1970s as the turning point, the increase in cropland area in the SNP can be divided into two periods of rapid development and slow growth (Figure 6). Farmland expansion can have different driving forces at different times, and the driving forces are listed below.
(i) Policies. In 1895-1914, because of the financial crisis during the war, the Qing Government proposed a “ban-reclaiming cancel policy” in Northeast China, which resulted in most of the wasteland in this region being reclaimed by the 1910s. Such a large-scale and fast land development has rarely been seen worldwide (Li et al., 2005; Dong, 2012). In the 1950s, to feed the country’s population, the Chinese Government mobilized one hundred thousand demobilized military personnel and hundreds of thousands of urban youths to cultivate wastelands in Northeast China. Subsequently, cropland areas in the SNP expanded rapidly due to government policies.
(ii) Natural disasters. During the Qing Dynasty, natural disasters caused severe damage to the society in the lower reaches of the Yellow River. To eke out an existence in the old society, many people (from Shandong Province) braved the journey to Northeast China. This migration from Shanhaiguan to the northeast involved the population of so many provinces and lasted for such a long time that it became known as “the largest population movement in human history.” The number of migrants reached over five million from the hinterland to Northeast China during 1923-1930 (Zhu, 2006). With a burgeoning population, there was a need for cropland areas to increase dramatically.
(iii) Transportation development. With the construction of the Manchuria Railway (1903), the pace of population migration from Shanhaiguan to the Northeast accelerated. According to statistics, as there were no railroads in Northeast China during 1894-1895, there were about 8 million, 2-2.5 million, and 1 million Chinese living in Liaoning, Jilin, and Heilongjiang provinces, respectively. However, 35 years later (1895-1930), Northeast China’s population rose from more than 10 million to about 32 million. Among them, the population of Liaoning more than doubled and the populations of Jilin and Heilongjiang tripled (Zhu, 2006).
(iv) Other factors. Warfare, markets, and economic benefits have also had an impact on the development of agriculture in the SNP of Northeast China.
(4) There is no record of county population data to estimate the cultivated area, so the current study used population data mainly from the Gazette of Heilongjiang Province (Wan et al., 1992) and the Local Gazette of Jilin Province (CCCJP, 1992); these data sources provided accurate records of population data. This study estimated the cultivated areas of three counties (Dehui county, Shuangyang county, and Nenjiang county) using a sample of 24 counties to establish a population and arable land regression equation. This had little effect on the overall accuracy since population data were only used to estimate cultivated areas in three counties. A settlement distribution map, which was based on figures from the Atlas of Historical Geography (1910s) and New Atlas of the Republic of China (1930s), was obtained through vectorization. Because the two settlement maps were from two data sources, they were not comparable; the settlement distribution is a point on a large-scale map, so it inevitably resulted in space error during the process of vectorization.
Several relevant limitations of this study should be noted. The conversion of area units from old units to current ones is a difficult task in the field of historical geography. In this study, we used conversion ratios from Ye et al. (2009) and Li et al. (2010). Even though historical evidence was used by Ye et al. (2009) and Li et al. (2010), more evidence would be needed to verify these conversion ratios. Additionally, the potential cultivation area was estimated by excluding forests, wetlands, rivers, lakes, and mountains. Since these geographical factors were not temporal contemporaries with the historical cropland, the estimated cultivation area might not be accurate. Furthermore, it should be noted that we used 2 as the decision scale in the AHP model. This value will be validated or improved upon by collecting experience from more experts in the future.

7 Conclusions

This study used multiple historical documents to reconstruct the spatial distribution of cropland areas in the SNP, Northeast China, in the 1910s and 1930s. The original records from different historical documents were calibrated with each other. We subsequently defined an agricultural suitability index model and distributed the spatial cropland area into 1 km × 1 km size pixels using this model. The spatial distributions of cropland of the 1950s, 1970s, 1980s, 1990s, 2000s, and 2010s for the Songnen Plain were reconstructed based on the map of cultivated land distribution vectorization and remote sensing image interpretation. This study achieved a research goal of detecting a regional scale spatial pattern of cropland change over an extended time scale. It provided a surface drive parameter to simulate regional climate change research and also provided basic data for the study of human activities and the coupling of ecological and environmental effects.
The above findings demonstrated that the SNP was extensively developed during the last century with the cropland area fraction increasing from 22.8% in the 1910s to 60.9% in the 2010s. During this time, agricultural development exhibited large temporal and spatial variability. There was a turning point in the growth rate of cropland area in the 1970s; from the 1910s to 1970s, the cropland area fraction increased at a rate of 5.5% per decade, while from the 1970s to 2010s, the increase was only 1.3% per decade. Newly developed cropland was mostly situated in the central and northwestern parts of the SNP, since the eastern part of the SNP had been developed by the 1910s. From the 1910s to 1930s, new cultivation mainly occurred in the mid-SNP, while from the 1930s to 1970s new cultivation mainly spread over the western and northern parts.

The authors have declared that no competing interests exist.

[1]
Anderson-Teixeira K J, Snyder P K, Twine T Eet al., 2012. Climate regulation services of natural and agricultural eco-regions of the Americas.Nature Climate Change, 2: 177-181.Terrestrial ecosystems regulate climate through both biogeochemical (greenhouse-gas regulation) and biophysical (regulation of water and energy) mechanisms. However, policies aimed at climate protection through land management, including REDD+ (where REDD is Reducing Emissions from Deforestation and Forest Degradation) and bioenergy sustainability standards, account only for biogeochemical mechanisms. By ignoring biophysical processes, which sometimes offset biogeochemical effects, policies risk promoting suboptimal solutions. Here, we quantify how biogeochemical and biophysical processes combine to shape the climate regulation values of 18 natural and agricultural ecoregions across the Americas. Natural ecosystems generally had higher climate regulation values than agroecosystems, largely driven by differences in biogeochemical services. Biophysical contributions ranged from minimal to dominant. They were highly variable in space, and their relative importance varied with the spatio-temporal scale of analysis. Our findings reinforce the importance of protecting tropical forests, show that northern forests have a relatively small net effect on climate, and indicate that climatic effects of bioenergy production may be more positive when biophysical processes are considered. Ensuring effective climate protection through land management requires consideration of combined biogeochemical and biophysical processes. Our climate regulation value index serves as one potential approach to quantify the full climate services of terrestrial ecosystems.

DOI

[2]
Cao X, Jin X B, Zhou Y K, 2013. Research on cropland data recovery and reconstruction in the Qing Dynasty: Method and case study.Acta Geographica Sinica, 68(2): 245-256. (in Chinese)The global environment has changed significantly since the beginning of the human civilization, especially after the industrial resolution when the world population explosion started. Historical land-use and land-cover changes caused by human activities during the last three centuries have been regarded as one of the five key frame issues in the LUCC project. As a country of 5000 years of history, China has its population boom ever since the prime Qing Dynasty (around AD1700), and becomes an area of active land-use and land-cover changes. Currently, there are two global historical land use datasets, generally referred as the "RF datasets" and "HYDE database". However, at the national level, these global datasets have coarse resolutions and inevitable errors. International and domestic scholars tried to reconstruct China's historical land-use and land-cover quantitatively and spatially. But the remarkable differences among their results bring a lot of difficulty to relevant researchers. Considering various factors that influenced the cropland tax records, this study developed a revised system to transfer historical records into real cropland area. Then, to inspect and calibrate these revised cropland area, we built an examination and calibration system from the aspects of population limitation and reclamation trends. Finally, as a case study, we applied the system to Shandong province, reconstructed its cropland data in the Qing Dynasty and obtained three main results. (1) Historical land tax records were not equal to the real cropland area. Despite the fact that the data revised by the first system can pass the population test, it cannot pass the reclamation trends test. (2) To calibrate them through reclamation trends, the revised system should consider the differences in reclamation policy, cropping system and natural conditions among various areas, and build a provincial factor revision form according to its historical situation. (3) In the early period of the Qing Dynasty, the key factor that limited Shandong's cropland growth was labor supply, so the cropland area approached to the labor supply line. As the population grew, cropland area went towards grain demand line. At the end of Qing Dynasty, the cropland yield of Shandong could not meet its requirement. Thus, Shandong turned into a grain importing place in the mid-19th century.

DOI

[3]
Cao X, Jin X B, Wang J Set al., 2014. Reconstruction and change analysis of cropland data of China in recent 300 years.Acta Geographica Sinica, 69(7): 896-906. (in Chinese)Historical land-use and land-cover changes caused by human activities during the last three centuries have been regarded as one of the five key frame issues in the LUCC project. China, with a history of 5000 years, has had its population boom ever since the early Qing Dynasty (around AD1700), and unprecedented development of national agricultural reclamation had started, left China as one of areas with rapid land-use and land-cover changes. Currently, there are two global historical land use datasets, generally referred as the &lsquo;RF datasets&rsquo; and &lsquo;HYDE database&rsquo; but at the zonal level, these global datasets are widely doubted with coarse resolution and inevitable errors. Academics have tried to reconstruct China's historical land-use and land-cover both quantitatively and spatially, but there are remarkable differences in their results, thus bringing troubles to relevant researches. Since the quantity forms the backbone of cropland restructuring, this paper grounded itself on China's historical records and related research achievements, and reconstructed China's provincial cropland data at the modern boundaries from 1661 to 1985, using a variety of methods based on resources and population, such as factor revision, man-land relationship test, and reclamation trend examination, etc. Our results differ less from HYDE, CHCD and Zhang with an average difference rate of less than 15%. But at the provincial level, our results are closer to CHCD, with 22% of provinces' average difference rate being over 30% . But significant diversities were found in a few provinces and further researches are needed. Then we analyzed China's cropland growth process and regional change characteristics. The results show that ever since the population boom in the Qing Dynasty, China's cropland trebled from 42.4&times;10<sup>6</sup> ha in the early Qing Dynasty to 136.9&times;10<sup>6</sup> ha in 1985. In terms of the growth rate, the process of China's cropland rise can be identified into five periods. Significant differences existed among the provincial cropland change. At the beginning of the Qing dynasty, China's farming activities mainly existed in the Yangtze River Plain, the Huang-Huai-Hai Plain, Guanzhong Basin and Yinchuan Plain. Thereafter, reclamation activities expanded to outer agriculture areas. Since the founding of the People's Republic of China, Northeast China and Northwest China have been major sources of additional cropland. National policy, disasters, wars, and economic development, are main factors affecting cropland changes.

DOI

[4]
Compiling Committee of Chorography in Heilongjiang Province (CCCHP), 1999. The Chorography of Heilongjiang Province. Harbin: Heilongjiang People’s Publishing House. (in Chinese)

[5]
Compiling Committee of Chorography in Jilin Province (CCCJP), 1992. The Chorography of Jilin Province. Changchun: Jilin People’s Publishing House. (in Chinese)

[6]
Course on the Survey of Manchurian Railway (CSMR), 1923. Local Gazette of Manchu-Mongolian. Manchuria Riri Press. (in Chinese)

[7]
Ding W J, Weng W H, Zeng S Y, 1934. New Atlas of China. Shanghai: Museum Returns Building. (in Chinese)

[8]
Dirmeyer P A, Niyogi D, Noblet-Ducoudre Net al., 2010. Impacts of land use change on climate.International Journal of Climatology, 30(13): 1905-1907.No abstract is available for this article.

DOI

[9]
Dong Q J, 2012. Research of the ban-reclaiming cancel and northeast agricultural development of the late Qing Dynasty [D]. Qiqihar: Qiqihar University (in Chinese).

[10]
Feng Y H, Zhang S H, He F Net al., 2014. Separate reconstruction of Chinese cropland grid data in the 20th century.Progress in Geography, 33(11): 1546-1555. (in Chinese)Many studies have demonstrated that land use and cover change(LUCC) has played a key role in global environmental change. The contemporary land cover is a result of human land use in the history. In order to simulate the LUCC's influence in climate and ecosystem, it is important to have a historical LUCC dataset, especially high- resolution land cover dataset. However, in China, such national coverage dataset is still missing,and this has limited the national environmental change simulations. So there is an urgent need to develop an effective way to reconstruct historical cropland distribution with high-resolution grids. Considering the complexity of the natural environment in China, in this study we developed a separate reconstruction method. First, we divided China into four regions based on a qualitative analysis: the traditional cultivated region, the northeastern region, the northwestern region, and the Qinghai-Tibet Plateau. This division is mostly consistent with other recent studies except for the northwestern region, which differs slightly from common delineation. Second, in every region we examined the relationship between cropland distribution and various natural and human factors and built a reconstruction model. In the traditional cultivated region and the northeastern region, we found that elevation,slope, and population density were the main contributing factors to cropland distribution. In other regions, how-ever, population density was the sole significant contributing factor. This model was then used to reconstruct the cropland distribution of China in 1913, 1933, 1950, 1970, 1990 and 2000 at a spatial resolution of 10 km 10 km.By comparing the reconstruction result with remote sensing data interpretation for 1990, we found that the reconstructed cropland distribution data are reliable not only at the county scale, but also at the grid scale. The comparison between the reconstructed change and the remote sensing data-derived change from 1990 to 2000 also supports this view, that is, the separate reconstruction method developed in this study is effective for capturing cropland change over time. The reconstructed dataset indicates the follows.(1) In the northeastern region, the cropland area slightly decreased at the beginning of the People's Republic of China in 1949; up to 1970, the cropland area had recovered and the modern distribution pattern formed; thereafter, the Sanjiang Plain was brought into agricultural development gradually.(2) In Xinjiang in western China, the first cropland development climax appeared in the republican period influenced by the agricultural policy; the second climax appeared between the1950 s and the 1970 s, but most of the cropland was distributed in the area of the Tianshan Mountains.(3) Change in cropland distribution of the Qinghai-Tibet Plateau was not notable, but the area had increased much; the spatial distribution of cropland in the traditional cultivated region also did not change significantly, but the reclamation ratio has increased. In conclusion, cropland area in China had increased in the early 20 th century and then decreased, and the inflection point was likely in the late 20 th century. This trend occurred not only in cropland area, but also in reclamation ratio. However, the change varies in different regions and is more pronounced in the northeastern and northwestern regions.

DOI

[11]
Goldewijk K K, 2001. Estimating global land use change over the past 300 years: The HYDE database. Global Biogeochemical Cycle, 15(2): 417-433.Testing against historical data is an important step for validating integrated models of global environmental change. Owing to long time lags in the climate system, these models should aim the simulation of the land use dynamics for long periods, i.e., spanning decades up to a century. Developing such models requires understanding of past and current trends and is therefore strongly data dependent. For this purpose, a history database of the global environment has been developed: HYDE. This paper describes and analyzes parts of HYDE version 2.0, presenting historical population and land use patterns for the past 300 years. Results suggest, among other things, a global increase of cropland area from 265 million ha in 1700 to 1471 million ha in 1990, while the area of pasture has increased more than six fold from 524 to 3451 million ha. In general, the increase of man-made agricultural land took place at the expense of natural grasslands and to a lesser extent of forests. There are differences between the several regions in the temporal pace of these land use conversions. The temperate/developed regions of Canada, United States, USSR, and Oceania appear to have had their strongest increase during the 19th century, while most of the tropical/developing regions witnessed the largest land use conversions at the end of the last century. Results of this analysis can be used to test integrated models of global change and are available at http://www.rivm.nl/env/int/hyde/.

DOI

[12]
Goldewijk K K, Beusen A, Drecht G Vet al., 2011. The HYDE 3.1 spatially explicit database of human-induced global land-use change over the past 12000 years.Global Ecology and Biogeography, 20(1): 73-86.ABSTRACT Aim68 This paper presents a tool for long-term global change studies; it is an update of the History Database of the Global Environment (HYDE) with estimates of some of the underlying demographic and agricultural driving factors. Methods68 Historical population, cropland and pasture statistics are combined with satellite information and specific allocation algorithms (which change over time) to create spatially explicit maps, which are fully consistent on a 5′ longitude/latitude grid resolution, and cover the period 10,000bctoad2000. Results68 Cropland occupied roughly less than 1% of the global ice-free land area for a long time untilad1000, similar to the area used for pasture. In the centuries that followed, the share of global cropland increased to 2% inad1700 (. 3 million km) and 11% inad2000 (15 million km), while the share of pasture area grew from 2% inad1700 to 24% inad2000 (34 million km) These profound land-use changes have had, and will continue to have, quite considerable consequences for global biogeochemical cycles, and subsequently global climate change. Main conclusions68 Some researchers suggest that humans have shifted from living in the Holocene (emergence of agriculture) into the Anthropocene (humans capable of changing the Earth's atmosphere) since the start of the Industrial Revolution. But in the light of the sheer size and magnitude of some historical land-use changes (e.g. as result of the depopulation of Europe due to the Black Death in the 14th century and the aftermath of the colonization of the Americas in the 16th century) we believe that this point might have occurred earlier in time. While there are still many uncertainties and gaps in our knowledge about the importance of land use (change) in the global biogeochemical cycle, we hope that this database can help global (climate) change modellers to close parts of this gap.

DOI

[13]
Goldewijk K K, van Drecht G, 2006. HYDE 3: Current and historical population and land cover. In: Bouwman A F, Kram T, Goldewijk K K (eds.). Integrated Modeling of Global Environmental Change. An Overview of IMAGE 2.4. Bilthoven, The Netherlands: PBL, 93-111.Publication &raquo; HYDE 3: Current and historical population and land cover.

[14]
He F N, Li S C, Zhang X Z, 2011. The reconstruction of cropland area and its spatial distribution pattern in the mid-Northern Song Dynasty.Acta Geographica Sinica, 66(11): 1531-1539. (in Chinese)To simulate land cover change process and its climate effects, it is significant to construct historical land use and land cover change dataset with spatial information. According to &quot;Cropland Taxes&quot; and &quot;the Number of Households&quot; data recorded in historical documents, this paper speculates cropland area and population of each Lu (administrative region of the Northern Song Dynasty) during the mid-Northern Song Dynasty by analyzing some society factors of the Northern Song Dynasty, including land-use practices, taxation system, reclamation policies. Besides, this study selects slope, altitude and population density as the main driving factors of land use suitability degree and reconstructs the gridding spatial distribution pattern of cropland of the Northern Song Dynasty (at a 60 km&times;60 km resolution). The results are shown as follows. (1) The cropland area of the whole country in the mid- and late Northern Song Dynasty is about 720 million Mu, accounted for 40.1% of the north and 59.9% of the south; the population is 87.2 million, accounting for 38.7% of the north and 61.3% of the south; the territory cropland fraction is 16.6%, and per capita cropland area is 8.2 Mu. (2) The cropland fraction of the North China Plain, the Yangtze River Plain, the Guanzhong Plain, the plains of Hunan and Hubei, and the Sichuan Basin are larger while the that of the south of Nanling Ridges, Southwest China (except the Chengdu Plain) and southeast coastal regions of China are lower. (3) In terms of altitudes, we conclude that the cropland areas of low altitude, middle altitude, high altitude are 443 million Mu, 215 million Mu, and 64 million Mu respectively, and the corresponding mean cropland fraction are 27.5%, 12.6% and 7.2%. (4) As for slopes, we conclude that the cropland area of flat slope, slow slope, slope, steep slope are 116 million Mu, 456 million Mu, 144 million Mu and 2 million Mu respectively, and the corresponding mean cropland fraction are 34.6%, 20.7%, 8.5% and 2.3%.

DOI

[15]
He F N, Li S C, Zhang X Zet al., 2013. Comparisons of cropland area from multiple datasets over the past 300 years in the traditional cultivated region of China.Journal of Geographical Sciences, 23(6): 978-990.lt;p>Land use/cover change is an important parameter in the climate and ecological simulations. Although they had been widely used in the community, SAGE dataset and HYDE dataset, the two representative global historical land use datasets, were little assessed about their accuracies in regional scale. Here, we carried out some assessments for the traditional cultivated region of China (TCRC) over last 300 years, by comparing SAGE2010 and HYDE (v3.1) with Chinese Historical Cropland Dataset (CHCD). The comparisons were performed at three spatial scales: entire study area, provincial area and 60 km by 60 km grid cell. The results show that (1) the cropland area from SAGE2010 was much more than that from CHCD; moreover, the growth at a rate of 0.51% from 1700 to 1950 and -0.34% after 1950 were also inconsistent with that from CHCD. (2) HYDE dataset (v3.1) was closer to CHCD dataset than SAGE dataset on entire study area. However, the large biases could be detected at provincial scale and 60 km by 60 km grid cell scale. The percent of grid cells having biases greater than 70% (&lt;-70% or &gt;70%) and 90% (&lt;-90% or &gt;90%) accounted for 56%-63% and 40%-45% of the total grid cells respectively while those having biases range from -10% to 10% and from -30% to 30% account for only 5%-6% and 17% of the total grid cells respectively. (3) Using local historical archives to reconstruct historical dataset with high accuracy would be a valuable way to improve the accuracy of climate and ecological simulation.</p>

DOI

[16]
Jin X B, Cao X, Du X Det al., 2015. Farmland dataset reconstruction and farmland change analysis in China during 1661-1985.Journal of Geographical Sciences, 25(9): 1058-1074.This research reconstructs China’s provincial farmland dataset in the last 300 years (1661–1985) by applying factor correction, citing replacement, linear interpolation, cohesion and contrast, man-land relationship test, farming trend test, provincial administrative area adjustment, etc. on available farmland data based on China’s current provincial administrative boundary. Based on this dataset, a quantitative analysis has been applied to study the farmland amount and its change characteristics at both national and provincial level. Three conclusions are derived: (1) Along with the rapid population growth, national farmland amount has increased by about 320% in the last 300 years from 424,480 km 2 in the early Qing Dynasty to 1,368,600 km 2 in 1985. Comparing with global and national farmland datasets, in terms of the overall trend of national farmland growth, very low deviation exists but significant variances do appear for some provinces. (2) At the beginning of the Qing Dynasty, China's farming activities mainly existed in the Yangtze River Plain, the North China Plain, the Guanzhong Basin and the Yinchuan Plain. Thereafter, reclamation activities expanded to outer agricultural areas. Regarding of the growth rate, national farmland increase can be divided into five phases. National policy, disasters, wars, and economic development, are the main factors affecting farmland changes. (3) Significant regional variances exist in farmland changes. In the space shaped by the average farmland amount and the average annual change rate of farmland, the nation can be divided into six areas.

DOI

[17]
Liaoning Provincial Archives (LPA), 2008. Survey of Manchurian Railway (Vol. 3). Nanning: Guangxi Normal University Press. (in Chinese)

[18]
Li B B, Fang X Q, Ye Yet al., 2010. Accuracy assessment of global historical cropland datasets based on regional reconstructed historical data: A case study in Northeast China.Science China Earth Sciences, 53(11): 1689-1699.Historical cropland datasets are fundamental for quantifying the effects of human land use activities on climatic change and the carbon cycle. Two representative global land-use datasets, the Global Land Use Database (termed SAGE dataset) and the Historical Database of the Global Environment (termed HYDE dataset) have been established and used widely. Despite improvement of data quality and methodologies for extracting historical land use information, certain dataset limitations exist that need to be quantified and communicated to users so that they can make informed decisions on whether and how these land-use products should be used. The Cropland data of Northeast China (CNEC) is based on calibrated historical data and a multi-sourced data conversion model, and reconstructs cropland cover change in Northeast China over the last 300 years. Us- ing the CNEC as a reference, we evaluated the accuracy of cropland cover for SAGE and HYDE in Northeast China at spatial scales ranging from the entire Northeast China to provinces and even individual raster grid cells. Neither SAGE nor HYDE reflects real historical land reclamation. Cropland areas in SAGE are overestimated by 20.98 times in 1700 to 1.6 times in 1990. Although HYDE is better, there are significant disagreements in cropland area and distribution between HYDE and CNEC, especially in the 18th and 19th centuries. The proportion of total grid cells whose relative error was greater than 100% was 63.55% in 1700 and 53.27% in 1780. Global cropland dataset errors over Northeast China originate mainly from both the reverse calculation method for historical cropland data based on modern spatial patterns, and modern land-use outputs from satellite data.

DOI

[19]
Li D B, Shi F, 1987. A General Study of Immigration in Heilongjiang. Harbin: Heilongjiang People’s Publishing House. (in Chinese)

[20]
Li J W, 1993. Forests in Heilongjiang. Beijing: China Forestry Publishing House. (in Chinese)

[21]
Li Q K, Wang S M, 2013. Systematic development of agriculture in Northeast China from a historical perspective.Journal of Arid Land Resources and Environment, 27(2): 11-17. (in Chinese)

[22]
Li S C, He F N, Chen Y S, 2012. Gridding reconstruction of cropland spatial patterns in Southwest China in the Qing Dynasty.Progress in Geography, 31(9): 1196-1203. (in Chinese)On the basis of modern cropland spatial pattern, we designed a method to quantify the relationship among topography (including altitude and slope), production potential of climate (including light, temperature and water), population density and cropland spatial pattern. Then the method was used to reconstruct cropland spatial pattern with a resolution of 10 km by 10 km in Southwest China for 6 periods between 1661 and 1784 in the Qing Dynasty. The results are shown as follows. (1) As a whole, the changes of cropland spatial pattern in Southwest China can be described in two respects. One is the expansion of cultivated area, which are mainly distributed in the Sichuan Basin and the Yunnan-Guizhou Plateau. The grid cells with small cropland fractions (0~10%) decreased by 24.0% during the past 250 years. The other is enhancement of cultivation intensity, which are obvious in the Sichuan Basin and the central-eastern parts of Yunnan Province. The grid cells whose cropland fractions are relatively large (&gt;30%) increased by 10.3% during the past 250 years. (2) The process of cropland change in Southwest China in the Qing Dynasty can be divided into three periods. The cultivation recovery period (1661-1724)--the grid cells whose cropland fractions are small (0~10%) decreased by 11.4%; the slow cultivation expansion period (1724-1820)-the grid cells whose cropland fractions are small (0~10%) decreased by 7% while the grid cells with relatively large cropland fractions (&gt;30%) increased by 7%. The postwar abandonment of cropland in some parts of the study area and recovery period (1820-1911)-the grid cells whose cropland fractions are small (0~10%) decreased from 75.0% to 72.2% while the grid cells whose cropland fractions are relatively large (&gt;30%) increased from 9.1% to 10.9%. The results of correlation analysis indicate that the reconstruction is reasonable to some degree.

DOI

[23]
Li S C, Zhang Y L, He F N, 2015. Reconstruction of cropland distribution in Qinghai and Tibet for the past one hundred years and its spatiotemporal changes.Progress in Geography, 34(2): 197-206. (in Chinese)Since numerical simulation has become a popular method for studying the effects of land use and land cover change on climate and environment, spatially explicit historical cropland datasets are increasingly required in regional and global climate change and carbon cycle research. In this study, using historical population data as a proxy, we estimated the provincial cropland area of Qinghai and Tibet in 1910. Based on the statistical data of the National Bureau of Statistics of China, the survey data of the Ministry of Land and Resources, and the results of some previous studies, we revised the cropland area of Qinghai and Tibet in 1950-2000. The relationship between altitude and surface slope and cropland distribution were quantified to develop the spatially explicit reconstruction model of historical cropland at a resolution of 1 km 1 km. Since the cropland area reached the maximum in the 1980 s, the satellite-observed cropland distribution extent of this time period was taken as the maximum distribution extent of historical cropland. The model developed in this research was used to reconstruct the spatial patterns of cropland in Qinghai and Tibet in 1910, 1960, 1980, and 2000. The reconstruction results show that:(1) in 1910-1950, cropland area of Qinghai-Tibet was stable, while in 1950-1980 cropland area increased rapidly, reaching 10583 km2, which is the maximum of the entire study period; in 1980-1990, cropland area decreased slightly; and in 1990-2000, cropland area increased slightly;(2) with regard to its spatial distribution, in1910- 1960, cropland expanded and land use activities intensified greatly in the Yellow River- Huangshui River Valley(YHV); in 1960-1980, cropland expansion and land use intensification occurred in the YHV, the Yarlung Zangbo River, the Nianchu River, and the Lhasa River valleys; in 1980-2000, the spatial pattern of cropland in Qinghai and Tibet remained unchanged. By comparing the reconstruction results of this study for 2000 with satellite- observed cropland distribution of the same year, we found that the correlation coefficient was 0.92 and the absolute difference followed normal distribution. The percentage of grid cells where the absolute difference is low(-10% to 10%) reached 73.29%, while the percentage of grid cells where the absolute difference is high(40% or -40%) was 1.94%. Incorporating more information on historical population and cropland of Qinghai and Tibet will help improve the accuracy of our reconstruction modeling. The reconstruction results of this research can be used in regional climate models to study the impact of cropland cover change on the climate and carbon cycle.

DOI

[24]
Li W, Zhang P, Song Y, 2005. Analysis on land development and causes in Northeast China during Qing Dynasty.Scientia Geographica Sinica, 25(1): 7-16. (in Chinese)This article discusses the process, characteristics and causes of the land development in Northeast China during Qing dynasty. In this period, land development mainly happened in the Liao river valley and the west of Liaoning Province, only a little land was developed in Jilin Province and Heilongjiang Province, representing a scene of desolation in vast undeveloped interior area. After Qing government abolished an immigration ban, large area was cultivated in Fengtian, Jilin and Heilongjian one after another at a high speed rarely seen before. The authors further analyse the main factors which had influenced land use change in this area, and find that huge population pressure in central China, successive famines and land policy change of Qing government are the 3 major reasons that caused the large scale immigration and high speed land development in Northeast China during Qing dynasty, particularly in the late period.

[25]
Lin S S, Zheng J Y, He F N, 2009. Gridding cropland data reconstruction over the agricultural region of China in 1820.Journal of Geographical Sciences, 19(1): 36-48.lt;a name="Abs1"></a>Recent studies have demonstrated the importance of LUCC change with climate and ecosystem simulation, but the result could only be determined precisely if a high-resolution underlying land cover map is used. While the efforts based satellites have provided a good baseline for present land cover, what the next advancement in the research about LUCC change required is the development of reconstruction of historical LUCC change, especially spatially-explicit historical dataset. Being different from other similar studies, this study is based on the analysis of historical land use patterns in the traditional cultivated region of China. Taking no account of the less important factors, altitude, slope and population patterns are selected as the major drivers of reclamation in ancient China, and used to design the HCGM (Historical Cropland Gridding Model, at a 60 km×60 km resolution), which is an empirical model for allocating the historical cropland inventory data spatially to grid cells in each political unit. Then we use this model to reconstruct cropland distribution of the study area in 1820, and verify the result by prefectural cropland data of 1820, which is from the historical documents. The statistical analyzing result shows that the model can simulate the patterns of the cropland distribution in the historical period in the traditional cultivated region efficiently.

DOI

[26]
Liu M L, Tian H Q, 2010. China’s land cover and land use change from 1700 to 2005: Estimations from high-resolution satellite data and historical archives. Global Biogeochemical Cycles, 24, GB3003.1] One of the major limitations in assessing the impacts of human activities on global biogeochemical cycles and climate is a shortage of reliable data on historical land cover and land use change (LCLUC). China had extreme discrepancies in estimating contemporary and historical patterns of LCLUC over the last 3 centuries because of its geographical complexity, long history of land use, and limited national surveys. This study aims to characterize the spatial and temporal patterns of China's LCLUC during 1700-2005 by reconstructing historical gridded data sets from high-resolution satellite data and long-term historical survey data. During this 300 year period, the major characteristics of LCLUC in China have been shrinking forest (decreased by 22%) and expanding cropland (increased by 42%) and urban areas (including urban and rural settlements, factories, quarries, mining, and other built-up land). New cropland areas have come almost equally from both forested and nonforested land. This study also revealed that substantial conversion between forest and woodland can be attributed to forest harvest, forest regeneration, and land degradation. During 1980-2005, LCLUC was characterized by shrinking cropland, expanding urban and forest areas, and large decadal variations on a national level. LCLUC in China showed significant spatial variations during different time periods, which were caused by spatial heterogeneity in vegetation, soils, and climate and regional imbalance in economy development. During 1700-2005, forests shrunk rapidly while croplands expanded in the northeast and southwest of China. During 1980-2005, we found a serious loss of cropland and urban sprawl in the eastern plain, north, and southeast regions of China and a large increase in forested area in the southeast and southwest regions. The reconstructed LCLUC data sets from this study could be used to assess the impacts of land use change on biogeochemical cycles, the water cycle, and the regional climate in China. To further eliminate uncertainties in this data set and make reliable projections of LCLUC for the future, we need to improve our understanding of the drivers of LCLUC and work toward developing an advanced, spatially explicit land use model.

DOI

[27]
Luo J, Zhang Y L, Liu G Fet al., 2014. Reconstruction of cropland spatial patterns for 1726 on Yellow River-Huangshui River Valley in northeast Qinghai-Tibet Plateau.Geographical Research, 33(7): 1285-1296. (in Chinese)In this study, first we revised the taxes-cropland area data in historical documents and estimated the cropland area in 1726 (the fourth year of Emperor Yongzheng's Reign in the Qing Dynasty) of Yellow River-Huangshui River Valley (YHV) which is located in northeast of Qinghai-Tibet Plateau. Subsequently, the cropland area was allocated into grids with a resolution of 2 km by 2 km under the help of GIS technology. The results show that the cropland area of YHV in 1726 was 1.427 10km, among which, 64.7% was cultivated by the minority as well as 35.3% was cultivated by soldiers and chieftain. The arable land of YHV is little due to the harsh natural environment. Crops can be found in some 47% of all grids and these grids were distributed in the Huangshui River basin, Beichuan River basin, the mid-lower reaches of the Datong and Yellow River. In terms of intensity of land use, the YHV had a low reclamation index in 1726. The reclamation index of 68.3% of all grids was less than 10% and only 1.4% of all grids had a reclamation index greater than 40%, which was attributed to the harsh environment and governmental policy. In addition, the spatial difference of the land use intensity was obvious. The reclamation index of Xining County was great on the whole and the mean value reached 13.5% at grid scale.

DOI

[28]
Mahmood R, Pielke R A, Hubbard K Get al., 2010. Impacts of land use/land cover change on climate and future research priorities.Bulletin of the American Meteorological Society, 91: 37-46.This paper proposes a series of recommendations related both to detecting land use/land cover change (LULCC) from observed climatic records and to modelling to improve our understanding of LULCC and its impacts on climate. Recommendations are presented under two subgroups: (1) monitoring and data issues and (2) modelling.

DOI

[29]
Notaro M, Liu Z, Williams J W, 2006. Observed vegetation-climate feedbacks in the United States.Journal of Climate, 19: 763-786.Observed vegetation feedbacks on temperature and precipitation are assessed across the United States using satellite-based fraction of photosynthetically active radiation (FPAR) and monthly climate data for the period of 198209“2000. This study represents the first attempt to spatially quantify the observed local impact of vegetation on temperature and precipitation over the United States for all months and by season. Lead09“lag correlations and feedback parameters are computed to determine the regions where vegetation substantially impacts the atmosphere and to quantify this forcing. Temperature imposes a significant instantaneous forcing on FPAR, while precipitation's impact on FPAR is greatest at one-month lead, particularly across the prairie. An increase in vegetation raises the surface air temperature by absorbing additional radiation and, in some cases, masking the high albedo of snow cover. Vegetation generally exhibits a positive forcing on temperature, strongest in spring and particularly across the northern states. The local impact of FPAR on precipitation appears to be spatially inhomogeneous and relatively weak, potentially due to the atmospheric transport of transpired water. The computed feedback parameters can be used to evaluate vegetation09“climate interactions simulated by models with dynamic vegetation.

DOI

[30]
Pan Q, Jin Y B, Zhou Y K, 2015. Gridding reconstruction of land use pattern in Jiangsu Province in the mid-Qing Dynasty.Acta Geographica Sinica, 70(19): 1449-1462. (in Chinese)Reconstructing the spatial data of historical LUCC could fill the gap between modern remote sensing interpretation results and long- term LUCC change analysis, and promote the study of spatiotemporal dynamics of land use and its impacts on climate and ecology. The current studies has obtained certain achievements and revealed the spatial pattern of historical LUCC to some extent. However, the results were normally in the form of single land use type and low spatial resolution. Thus, this study targeted to propose an integrated method of land use reconstruction with relatively high spatial resolution. We set 1820 as the time section and took the administrative boundary of contemporary Jiangsu Province as the study area. Supported by historical documentary records, historical geography research results,modern statistical data and natural environmental data, we divided the land use types into cropland, settlement(including urban land and rural residential land), water body and other lands(including forest, grassland and unused land). Considering the characteristics of regional natural resources and socioeconomic conditions, theoretical hypotheses were proposed to obtain the areas of cropland, urban land and rural residential land at prefectural level. Based on the modern land use pattern, from the perspective of man-land relationship, the land use map of Jiangsu Province in 1820 with a spatial grid of 100 m 100 m was established by administrative seat proximity analysis, integrated suitability indices analysis and so on. Then, statistics of different geographical divisions and comparative analysis of data in sub- regions were used respectively to analyze and validate the results indirectly. The results showed that:(1) In 1820,the area of cropland, urban land, rural residential land, water body and other lands of Jiangsu Province accounted for 48.49%, 4.46%, 0.16%, 15.03% and 31.86% of the total study area respectively.(2) The land use pattern in Jiangsu Province has general features of higher cultivation rate and lower construction rate. Meanwhile, affected by the discrepant population distribution, topography and drainage density, land use in different geographical divisions varied significantly.(3) The proportion of the area of residential land and cropland at county level occupying the correspondent city level in 1820 and 1985 showed a significant positive linear correlation. Therefore, the results of this study had certain reasonability and could provide methodological references for related historical LUCC reconstruction.

DOI

[31]
Pielke R A, Adegoke J, Beltran-Przekurat Aet al., 2007. An overview of regional land-use and land-cover impacts on rainfall.Tellus Teries B-Chemical and Physical Meteorology, 59(3): 587-601.This paper documents the diverse role of land-use/land-cover change on precipitation. Since land conversion continues at a rapid pace, this type of human disturbance of the climate system will continue and become even more significant in the coming decades.

DOI

[32]
Pielke R A, Niyogi D, 2009. The role of landscape processes within the climate system. In: Otto J C, Dikaum R (eds.). Landform-Structure, Evolution, Process Control: Proceedings of the International Symposium on Landforms organised by the Research Training Group 437, 115. Berlin: Springer, 67-85.

[33]
Ramankutty N, Foley J A, 2010. ISLSCP II Historical Croplands Cover, 1700-1992. Dataset. Available from: .

[34]
Ramankutty N, Foley J A, 1999. Estimating historical changes in global land cover: Croplands from 1700 to 1992.Glob. Biogeochem. Cycle, 13(4): 997-1027.Human activities over the last three centuries have significantly transformed the Earth's environment, primarily through the conversion of natural ecosystems to agriculture. This study presents a simple approach to derive geographically explicit changes in global croplands from 1700 to 1992. By calibrating a remotely sensed land cover classification data set against cropland inventory data, we derived a global representation of permanent croplands in 1992, at 5 min spatial resolution [Ramankutty and Foley, 1998]. To reconstruct historical croplands, we first compile an extensive database of historical cropland inventory data, at the national and subnational level, from a variety of sources. Then we use our 1992 cropland data within a simple land cover change model, along with the historical inventory data, to reconstruct global 5 min resolution data on permanent cropland areas from 1992 back to 1700. The reconstructed changes in historical croplands are consistent with the history of human settlement and patterns of economic development. By overlaying our historical cropland data set over a newly derived potential vegetation data set, we analyze our results in terms of the extent to which different natural vegetation types have been converted for agriculture. We further examine the extent to which croplands have been abandoned in different parts of the world. Our data sets could be used within global climate models and global ecosystem models to understand the impacts of land cover change on climate and on the cycling of carbon and water. Such an analysis is a crucial aid to sharpen our thinking about a sustainable future.

DOI

[35]
Sun J Z, 1959. The Regional Economic Geography Science in Northeast China. Beijing: Science Press. (in Chinese)

[36]
Tan Q X, 1987. Historical Atlas of China: The Eighth Book. Beijing: China Cartographic Publishing House, 12-15. (in Chinese)

[37]
Wan F L, Zhang B Y, Cu. C Q et al., 1992. The Chorography of Heilongjiang Province. Harbin: Heilongjiang People’s Publishing House. (in Chinese)

[38]
Wang Y K, Tao J P, Liu F Get al., 2015. Reconstruction of cropland spatial pattern in 1830 in the middle reaches of Yarlung Zangbo River Valley.Geographical Research, 34(12), 2355-2367. (in Chinese)In this study, we collected and revised the cultivated land tax data from the Tie Hu List, which recorded the cultivated land tax of the Midstream Yarlung Zangbo River Valley of Tibet in 1830, the data were transformed to modern cropland land area. Then the gridding method was used to reconstruct the cropland spatial pattern with a resolution of 1 km by 1 km in the study area in 1830. The results show that: as a whole, the cropland area of this region in 1830 was 895 km2, among which, 39% was cultivated by the Government, 31% was cultivated by the Nobles, and 29% by Temples. In terms of the distribution pattern, the cultivated land was found in only 27.4% of the grids, and it was distributed dispersedly in the main stream basins of Yarlung Zangbo River Valley and its tributary basins. As for the intensity of land use,the lower level reclamation index reflects the situation of local lower level agricultural production. The average reclamation index of the whole study area was only 0.6%. However, the spatial difference of the reclamation index was obvious. The average reclamation index of Lhasa was 6.3%, which was the greatest in the study area. The average reclamation index of Shigatse, Gyangze, Nedong and Qonggyai is about 3%, while Gongbu and the western countieshas the lowest reclamation index, which was less than 1%.

[39]
Xin P L, Zhang F M, Gao X Y, 1999. The Development History of Heilongjiang. Harbin: Heilongjiang People’s Publishing House. (in Chinese)

[40]
Xiong Z B, 2009. Summary of County Jurisdiction of Northeast Region in the Republic of China. Beijing: China National Microfilming Center for Library Resources. (in Chinese)

[41]
Xu J H, 2009. Mathematical Methods in Contemporary Geography. Beijing: Higher Education Press. (in Chinese)

[42]
Xu Z L, 1985. The Summary of Heilongjiang. Harbin: Heilongjiang People’s Publishing House. (in Chinese)

[43]
Ye Y, Fang X Q, Ren Y Yet al., 2009. Cropland cover change in Northeast China during the past 300 years. Science China: Earth Science, 39(3): 340-350. (in Chinese)Land use/cover change induced by human activities has emerged as a “global” phenomenon with Earth system consequences. Northeast China is an area where the largest land cultivation activities by migrants have happened in China during the past 300 years. In this paper, methods including documentary data calibration and multi-sourced data conversion model are used to reconstruct historical cropland cover change in Northeast China during the past 300 years. It is concluded that human beings have remarkably changed the natural landscape of the region by land cultivation in the past 300 years. Cropland area has increased almost exponentially during the past 300 years, especially during the past 100 years when the ratio of cropland cover changed from 10% to 20%. Until the middle of the 19th century, the agricultural area was still mainly restricted in Liaoning Province. From the late 19th century to the early 20th century, dramatic changes took place when the northern boundary of cultivation had extended to the middle of Heilongjiang Province. During the 20th century, three agricultural regions with high ratio of cropland cover were formed after the two phases of spatial expansion of cropland area in 1900s–1930s and 1950s–1980s. Since 1930s–1940s, the expansion of new cultivated area have invaded the forest lands especially in Jilin and Heilongjiang Provinces.

DOI

[44]
Zeng L H, Song K S, Zhang Bet al., 2010. Analysis of spatiotemporal variations in evapotranspiration and its influencing factors over the Songnen Plain in the growing season during the period 2000-2008.Resources Science, 32(12): 2305-2315. (in Chinese)Evapotranspiration (ET) is a critical component of the land surface energy balance system and hydrologic processes. Analysis of spatiotemporal variations and influencing factors of ET in the growing season is of great importance to evaluate the growing environment for crops and to effectively use water resources across the Songnen Plain, a critical base for grain production in China. The authors made use of the Surface Energy Balance Algorithm for Land (SEBAL) and the Penman-Monteith equation (P-M) in conjunction with Moderate-resolution Imaging Spectroradiometer (MODIS) products (i.e., MOD11A1, MOD11A2, MOD13A2, MOD43B3, and MCD43B3) to estimate land surface actual ET in the growing season generally from May to September during the period 2000-2008. Furthermore, spatial patterns and temporal trends in the ET estimates were comprehensively analyzed, with investigating correlation of five key climatic factors (i.e., precipitation, air temperature, relative humidity, wind speed, and sunshine hours) with ET estimates. In addition to large water bodies and wetlands, the average ET in the growing season from 2000 to 2008 changed obviously, increasing gradually from the southwest to the east and northeast of the study region. It was suggested that the average ET of the whole Songnen Plain exhibited a significant decreasing trend during the period 2000-2008, with a maximum ET value of 669.31 mm occurring in 2000 and a minimum ET value of 570.79 mm in 2005. The mean annual ET was found to be roughly 612.63 mm. Under a combined effect of weather conditions, soil water supply status, and fractional vegetation cover, the monthly ET from May to September showed a marked spatiotemporal variation, with a maximum monthly ET value of 141.60 mm in July and a minimum ET value of 81.35 mm in September. This could be ascribed largely to relatively less precipitation and lower air temperatures. By examining responses of the ET estimates to climatic variables, it was found that ET was positively correlated with precipitation and average air temperature over most regions of the Songnen Plain, indicating that the two climatic variables may be the major factors affecting ET for the growing season. Additionally, average relative humidity was positively correlated with ET in areas covered primarily by forests and water bodies, whereas showed negative correspondence with ET over other regions. The ET estimates showed insignificant correlation with climatic factors, such as wind speed and sunshine hours. This work would provide a basis for the assessment of water supply status during the crop growth stage over the Songnen Plain, particularly over the arid and semi-arid environments. It can also facilitate assessing ecological water requirement and irrigation system functions, further strengthening water resources management.

DOI

[45]
Zeng Z Z, Fang X Q, Ye Y, 2011. The process of land cultivation based on settlement names in Jilin Province in the past 300 years.Acta Geographica Sinica, 66(7): 985-993. (in Chinese)Settlements, as a land-use type, can reflect the interaction between human activities and natural environment. In a new cultivation area, establishment of new settlements and agricultural land cultivation were carried out simultaneously, which made it possible to identify the process of land cultivation through studying the temporal and spatial growth of settlements. Settlement names, which recorded the actual situation when people migrated to a new cultivated area, have very important values in research on land exploitation and historical process of land use/cover change. Based on the chorography of toponym in Jilin, this paper studied settlement names according to different types of land cultivation, and developed a method of classification for land cultivation-settlements. Then it identified two types of land cultivation-settlement, which were governmental cultivation-settlements and individual cultivation-settlements. Furthermore the latter could also be divided into two sub-types, individual migration-settlements and governmental recruitment-settlements. In this paper, the process of temporal-spatial distribution of land cultivation in Jilin Province in the past 300 years has been recognized, which may be helpful to study the land use/cover change in Jilin, and also provide an attempt to conduct research on land cultivation based on toponym, or settlement names.

[46]
Zhang L J, Jiang L Q, Zhang X Z, 2015. Spatially precise reconstruction of cropland areas in Heilongjiang Province, Northeast China during the late Qing Dynasty (1910s).Journal of Geographical Sciences, 25(5): 627-637.

[47]
Zhu Y G, Dai A G, 2006. Modern China: Social and Economic Research. Shanghai: Fudan University Press. (in Chinese)

Outlines

/